false 0001538990 0001538990 2023-08-04 2023-08-04
UNITED STATES
SECURITIES AND EXCHANGE COMMISSION
Washington, D.C. 20549
FORM 8-K
CURRENT REPORT
Pursuant to Section 13 or 15(d)
of the Securities Exchange Act of 1934
Date of Report (Date of earliest event reported): August 4, 2023
STORE Capital LLC
(Exact name of registrant as specified in its charter)
|
|
|
|
|
| Delaware |
|
001-36739 |
|
88-4051712 |
(State or Other Jurisdiction
of Incorporation) |
|
(Commission
File Number) |
|
(IRS Employer
Identification No.) |
8377 East Hartford Drive, Suite 100
Scottsdale, AZ 85255
(Address of Principal Executive Offices, Including Zip Code)
(480) 256-1100
(Registrant’s Telephone Number, Including Area Code)
Check the appropriate box below if the Form 8-K filing is intended to simultaneously satisfy the filing obligation of the registrant under any of the following provisions:
| |
☐ |
Written communications pursuant to Rule 425 under the Securities Act (17 CFR 230.425) |
| |
☐ |
Soliciting material pursuant to Rule 14a-12 under the Exchange Act (17 CFR 240.14a-12) |
| |
☐ |
Pre-commencement communications pursuant to Rule 14d-2(b) under the Exchange Act (17 CFR 240.14d-2(b)) |
| |
☐ |
Pre-commencement communications pursuant to Rule 13e-4(c) under the Exchange Act (17 CFR 240.13e-4(c)) |
Securities registered pursuant to Section 12(b) of the Act:
|
|
|
|
|
| Title of each class |
|
Trading
Symbol(s) |
|
Name of each exchange on which registered |
| None |
|
None |
|
None |
Indicate by check mark whether the registrant is an emerging growth company as defined in Rule 405 of the Securities Act of 1933 (§230.405 of this chapter) or Rule 12b-2 of the Securities Exchange Act of 1934 (§240.12b-2 of this chapter).
Emerging growth company ☐
If an emerging growth company, indicate by check mark if the registrant has elected not to use the extended transition period for complying with any new or revised financial accounting standards provided pursuant to Section 13(a) of the Exchange Act. ☐
| Item 2.02 |
Results of Operations and Financial Condition. |
On August 4, 2023, STORE Capital LLC, a Delaware limited liability company (the “Company”), posted a supplemental earnings presentation to its website, which is attached hereto as Exhibit 99.1 and incorporated herein by reference.
| Item 7.01 |
Regulation FD Disclosure. |
The disclosure set forth in Item 2.02 above is hereby incorporated by reference into this Item 7.01 as if fully set forth herein. The Company, at its discretion, may elect to post similar supplemental earnings presentations in the future.
The information furnished in this Current Report on Form 8-K, including Exhibit 99.1, shall not be deemed to be “filed” for the purposes of Section 18 of the Securities Exchange Act of 1934, as amended, or otherwise subject to the liabilities of that section, and shall not be deemed to be incorporated by reference into any filing pursuant to the Securities Act of 1933, as amended, unless specifically identified therein as being incorporated therein by reference.
| Item 9.01 |
Financial Statements and Exhibits. |
(d) Exhibits
SIGNATURES
Pursuant to the requirements of the Securities Exchange Act of 1934, the Registrant has duly caused this report to be signed on its behalf by the undersigned hereunto duly authorized.
|
|
|
|
|
|
|
|
|
|
|
|
|
|
|
|
|
|
STORE Capital LLC |
| Dated: August 4, 2023 |
|
|
|
|
|
|
| |
|
|
|
By: |
|
/s/ Chad A. Freed |
| |
|
|
|
|
|
Chad A. Freed |
| |
|
|
|
|
|
Executive Vice President – General Counsel |

Exhibit 99.1 a leader in real estate capital solutions 202 3 second
quarter supplemental operating & financial information
disclaimer This presentation contains forward-looking statements within
the meaning of Section 27A of Forward-looking statements set forth herein speak only as of the date hereof, and we expressly the Securities Act of 1933, as amended, or the Securities Act, and Section 21E of the Securities disclaim any obligation or
undertaking to update or revise any forward-looking statement Exchange Act of 1934, as amended, or the Exchange Act. Such forward-looking statements contained herein, to reflect any change in our expectations with regard thereto, or any other
include, without limitation, statements concerning our business and growth strategies, change in events, conditions or circumstances on which any such statement is based, except to investment, financing and leasing activities and trends in our
business, including trends in the the extent otherwise required by law. market for long-term, triple-net leases of freestanding, single-tenant properties. Words such as THIS PRESENTATION CONTAINS HISTORICAL PERFORMANCE INFORMATION REGARDING
“expects,” “anticipates,” “intends,” “plans,” “likely,” “will,” “believes,” “seeks,” “estimates,” and STORE CAPITAL. SUCH PAST PERFORMANCE IS
NOT A GUARANTEE OF FUTURE RESULTS. variations of such words and similar expressions are intended to identify such forward-looking This presentation contains references to our copyrights, trademarks, trade names and service statements. Such
statements involve known and unknown risks, uncertainties and other factors marks and to those belonging to other entities. Solely for convenience, copyrights, trademarks, which may cause our actual results, performance or achievements to be
materially different “© “ trade names and service marks referred to in this presentation may appear without the or from the results of operations or plans expressed or implied by such forward-looking TM” “sm”
“ or symbols, but such references are not intended to indicate, in any way, that we will statements. Although we believe that the assumptions underlying the forward-looking not assert, to the fullest extent under applicable law, our rights or
the rights of the applicable statements contained herein are reasonable, any of the assumptions could be inaccurate. In licensor to these copyrights, trademarks, trade names and service marks. We do not intend our light of the significant
uncertainties inherent in the forward-looking statements included herein, use or display of other companies’ trade names, copyrights, trademarks or service marks to the inclusion of such information should not be regarded as a representation
by us or any other imply a relationship with, or endorsement or sponsorship of us by, any other companies. person that the results or conditions described in such statements or our objectives and plans will be achieved. Furthermore, actual results
may differ materially from those described in the Definitions and footnotes for data provided herein are provided in the appendix section of this forward-looking statements and may be affected by a variety of risks and factors including,
presentation. without limitation, the risks described in our Annual Report on Form 10-K, quarterly reports on Unless otherwise indicated, data provided herein is as of June 30, 2023. form 10-Q, and current reports on Form 8-K. 2 supplemental
operating & financial information
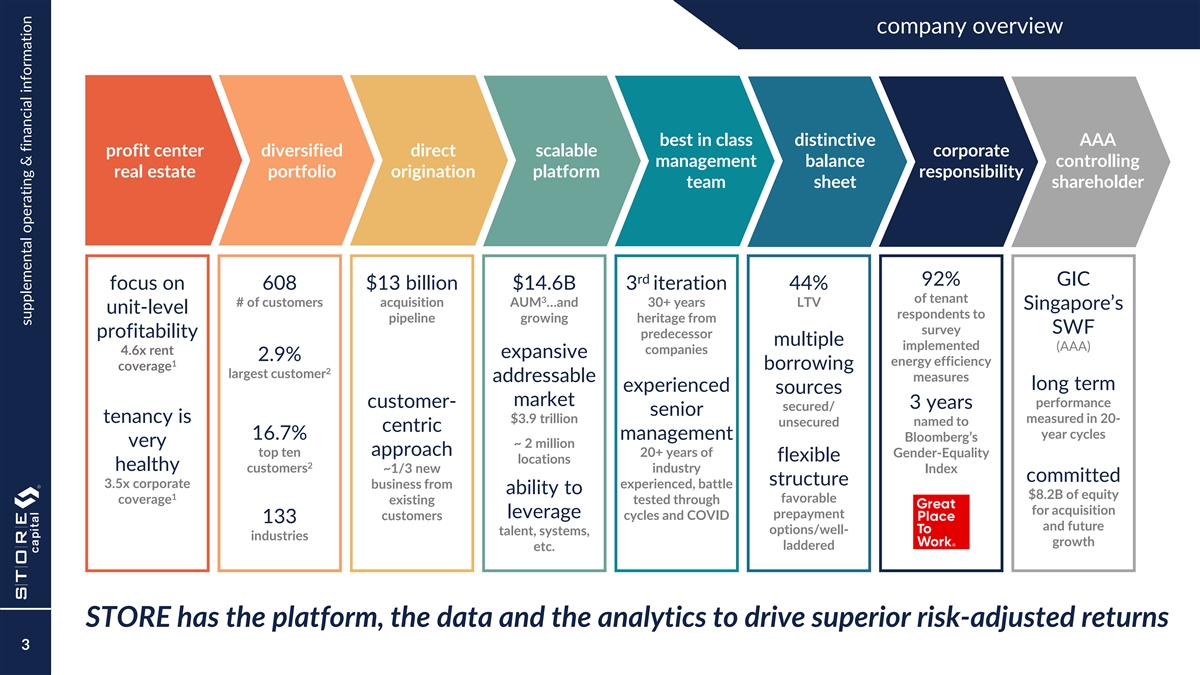
company overview best in class distinctive AAA profit center
diversified direct scalable corporate management balance controlling real estate portfolio origination platform responsibility team sheet shareholder rd 92% GIC focus on 608 $13 billion $14.6B 3 iteration 44% of tenant 3 # of customers acquisition
AUM …and 30+ years LTV Singapore’s unit-level respondents to pipeline growing heritage from SWF survey profitability predecessor multiple implemented (AAA) companies 4.6x rent expansive 2.9% energy efficiency 1 borrowing coverage 2
largest customer measures addressable long term experienced sources market customer- performance 3 years secured/ senior tenancy is $3.9 trillion measured in 20- unsecured named to centric year cycles 16.7% management Bloomberg’s very ~ 2
million approach top ten 20+ years of Gender-Equality flexible locations 2 healthy customers industry ~1/3 new Index committed structure 3.5x corporate business from experienced, battle ability to $8.2B of equity 1 favorable coverage tested through
existing for acquisition leverage prepayment customers cycles and COVID 133 and future options/well- talent, systems, industries growth laddered etc. STORE has the platform, the data and the analytics to drive superior risk-adjusted returns 3
supplemental operating & financial information
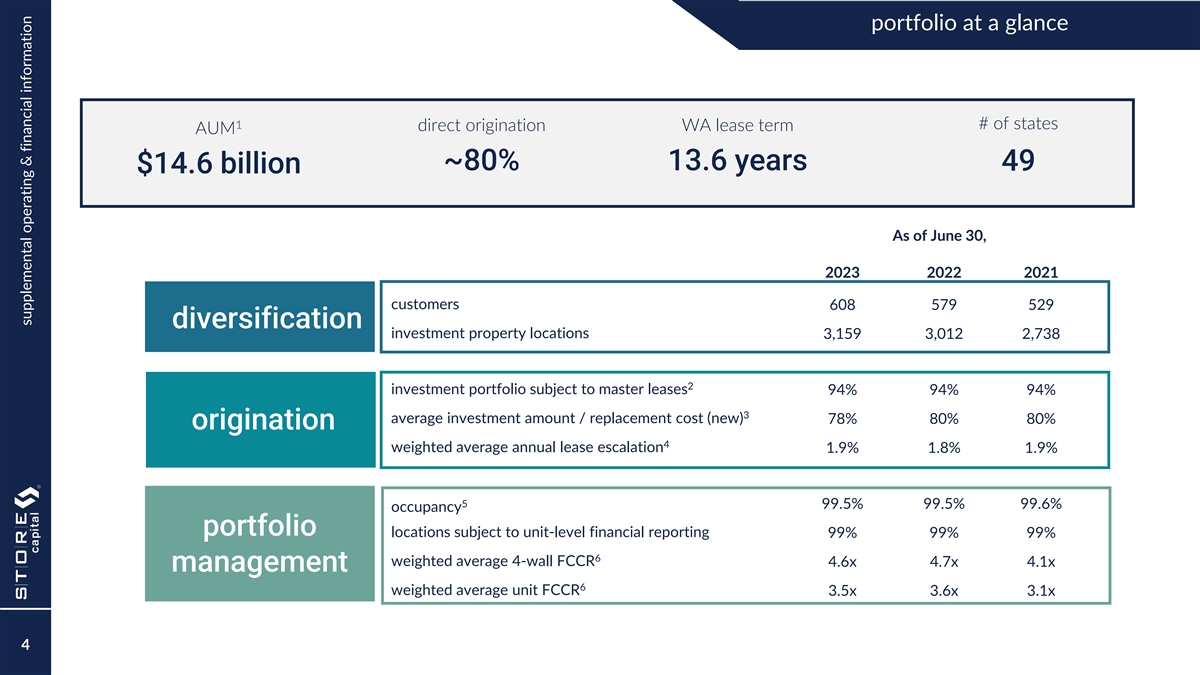
portfolio at a glance 1 # of states direct origination WA lease term AUM
~80% 13.6 years 49 $14.6 billion As of June 30, 2023 2022 2021 customers 608 579 529 diversification investment property locations 3,159 3,012 2,738 2 investment portfolio subject to master leases 94% 94% 94% 3 average investment amount /
replacement cost (new) 78% 80% 80% origination 4 weighted average annual lease escalation 1.9% 1.8% 1.9% 5 99.5% 99.5% 99.6% occupancy portfolio locations subject to unit-level financial reporting 99% 99% 99% 6 weighted average 4-wall FCCR 4.6x 4.7x
4.1x management 6 weighted average unit FCCR 3.5x 3.6x 3.1x 4 supplemental operating & financial information
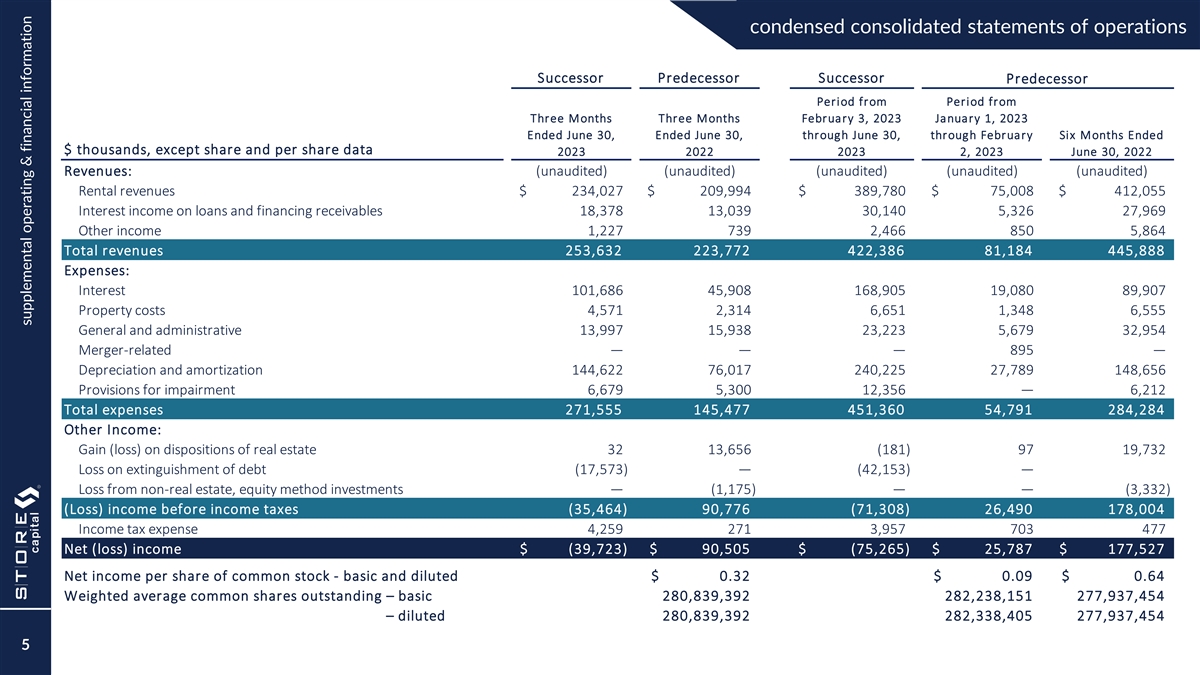
condensed consolidated statements of operations Successor Predecessor
Successor Predecessor Period from Period from Three Months Three Months February 3, 2023 January 1, 2023 Ended June 30, Ended June 30, through June 30, through February Six Months Ended $ thousands, except share and per share data 2023 2022 2023 2,
2023 June 30, 2022 Revenues: (unaudited) (unaudited) (unaudited) (unaudited) (unaudited) Rental revenues $ 234,027 $ 209,994 $ 3 89,780 $ 7 5,008 $ 4 12,055 Interest income on loans and financing receivables 1 8,378 13,039 30,140 5 ,326 2 7,969
Other income 1,227 7 39 2 ,466 850 5,864 Total revenues 253,632 223,772 422,386 81,184 445,888 Expenses: Interest 101,686 45,908 1 68,905 19,080 89,907 Property costs 4,571 2,314 6,651 1 ,348 6,555 General and administrative 1 3,997 15,938 2 3,223
5,679 3 2,954 Merger-related — — — 8 95 — Depreciation and amortization 1 44,622 7 6,017 240,225 27,789 1 48,656 Provisions for impairment 6,679 5,300 1 2,356 — 6 ,212 Total expenses 271,555 145,477 451,360 54,791
284,284 Other Income: Gain (loss) on dispositions of real estate 32 13,656 (181) 97 1 9,732 Loss on extinguishment of debt ( 17,573) — ( 42,153) — Loss from non-real estate, equity method investments — (1,175) — — (
3,332) (Loss) income before income taxes (35,464) 90,776 (71,308) 26,490 178,004 Income tax expense 4 ,259 2 71 3 ,957 703 4 77 Net (loss) income $ (39,723) $ 90,505 $ (75,265) $ 25,787 $ 177,527 Net income per share of common stock - basic and
diluted $ 0.32 $ 0.09 $ 0.64 Weighted average common shares outstanding – basic 280,839,392 282, 238,151 277,937,454 – diluted 280,839,392 282, 338,405 277,937,454 5 supplemental operating & financial information
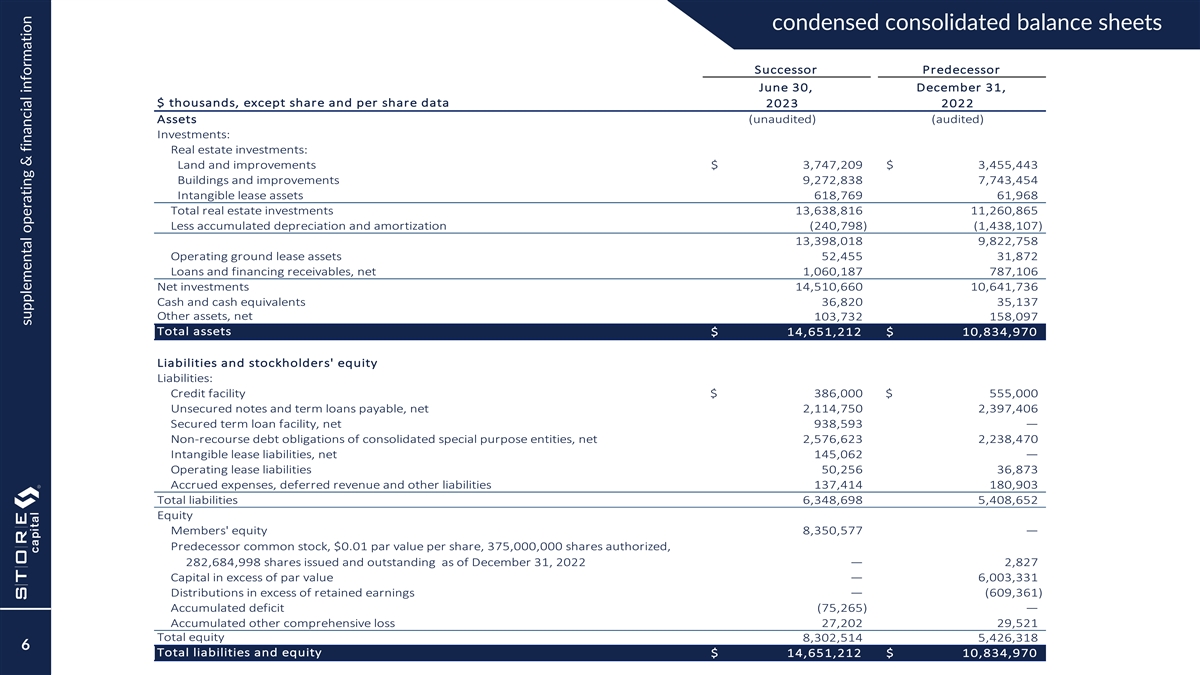
condensed consolidated balance sheets Successor Predecessor June 30,
December 31, $ thousands, except share and per share data 2023 2022 Assets (unaudited) (audited) Investments: Real estate investments: Land and improvements $ 3 ,747,209 $ 3 ,455,443 Buildings and improvements 9 ,272,838 7 ,743,454 Intangible lease
assets 6 18,769 6 1,968 Total real estate investments 13,638,816 11,260,865 Less accumulated depreciation and amortization ( 240,798) ( 1,438,107) 1 3,398,018 9 ,822,758 Operating ground lease assets 52,455 31,872 Loans and financing receivables,
net 1 ,060,187 7 87,106 Net investments 14,510,660 10,641,736 Cash and cash equivalents 3 6,820 3 5,137 Other assets, net 103,732 158,097 Total assets $ 14,651,212 $ 10,834,970 Liabilities and stockholders' equity Liabilities: Credit facility $
386,000 $ 555,000 Unsecured notes and term loans payable, net 2 ,114,750 2 ,397,406 Secured term loan facility, net 938,593 — Non-recourse debt obligations of consolidated special purpose entities, net 2 ,576,623 2 ,238,470 Intangible lease
liabilities, net 145,062 — Operating lease liabilities 5 0,256 3 6,873 Accrued expenses, deferred revenue and other liabilities 137,414 180,903 Total liabilities 6,348,698 5 ,408,652 Equity Members' equity 8,350,577 — Predecessor common
stock, $0.01 par value per share, 375,000,000 shares authorized, 282,684,998 shares issued and outstanding as of December 31, 2022 — 2,827 Capital in excess of par value — 6 ,003,331 Distributions in excess of retained earnings — (
609,361) Accumulated deficit ( 75,265) — Accumulated other comprehensive loss 2 7,202 2 9,521 Total equity 8,302,514 5 ,426,318 6 Total liabilities and equity $ 14,651,212 $ 10,834,970 supplemental operating & financial information
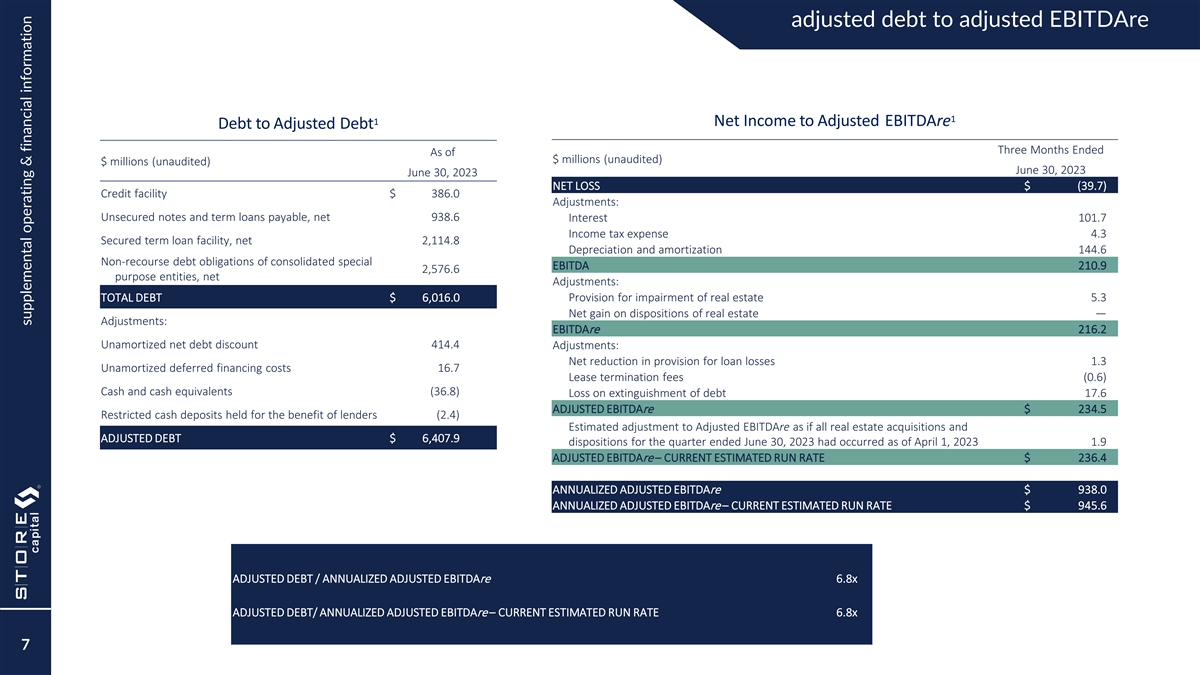
adjusted debt to adjusted EBITDAre 1 1 Net Income to Adjusted EBITDAre
Debt to Adjusted Debt Three Months Ended As of $ millions (unaudited) $ millions (unaudited) June 30, 2023 June 30, 2023 NET LOSS $ (39.7) Credit facility $ 386.0 Adjustments: Unsecured notes and term loans payable, net 938.6 Interest 101.7 Income
tax expense 4.3 Secured term loan facility, net 2,114.8 Depreciation and amortization 144.6 Non-recourse debt obligations of consolidated special EBITDA 210.9 2,576.6 purpose entities, net Adjustments: TOTAL DEBT $ 6,016.0 Provision for impairment
of real estate 5.3 Net gain on dispositions of real estate — Adjustments: EBITDAre 216.2 Unamortized net debt discount 414.4 Adjustments: Net reduction in provision for loan losses 1.3 Unamortized deferred financing costs 16.7 Lease
termination fees (0.6) Cash and cash equivalents (36.8) Loss on extinguishment of debt 17.6 ADJUSTED EBITDAre $ 234.5 Restricted cash deposits held for the benefit of lenders (2.4) Estimated adjustment to Adjusted EBITDAre as if all real estate
acquisitions and ADJUSTED DEBT $ 6,407.9 dispositions for the quarter ended June 30, 2023 had occurred as of April 1, 2023 1.9 ADJUSTED EBITDAre – CURRENT ESTIMATED RUN RATE $ 236.4 ANNUALIZED ADJUSTED EBITDAre $ 938.0 ANNUALIZED ADJUSTED
EBITDAre – CURRENT ESTIMATED RUN RATE $ 945.6 ADJUSTED DEBT / ANNUALIZED ADJUSTED EBITDAre 6.8x ADJUSTED DEBT/ ANNUALIZED ADJUSTED EBITDAre – CURRENT ESTIMATED RUN RATE 6.8x 7 supplemental operating & financial information
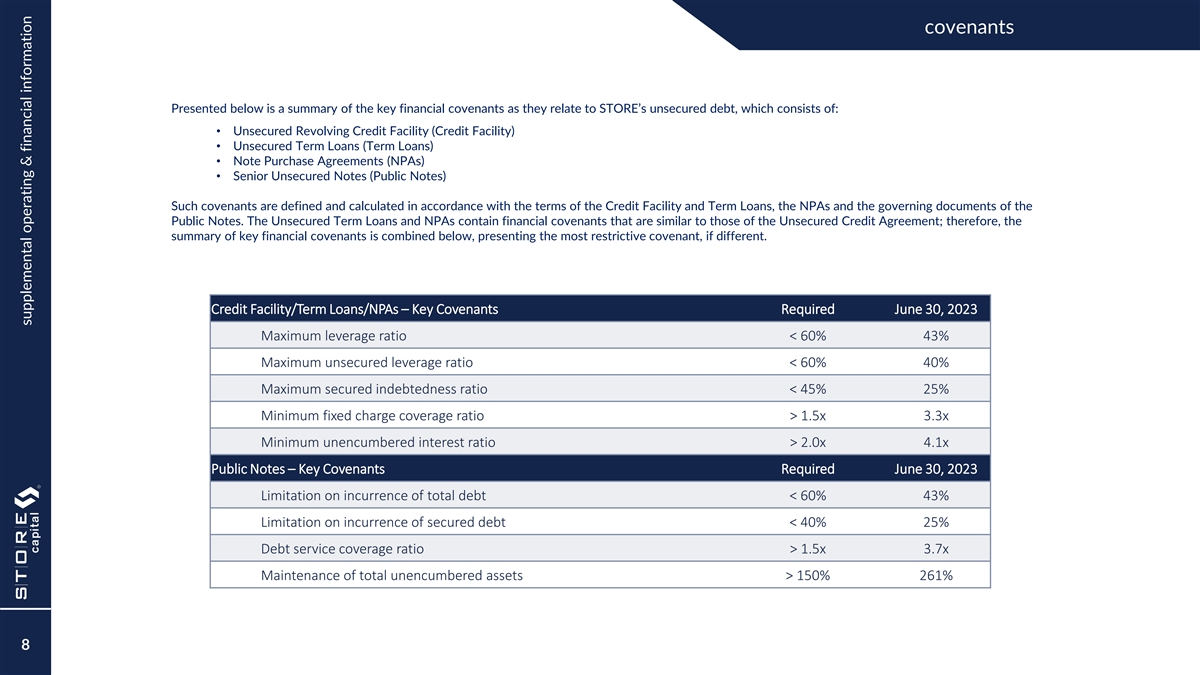
covenants Presented below is a summary of the key financial covenants as
they relate to STORE’s unsecured debt, which consists of: • Unsecured Revolving Credit Facility (Credit Facility) • Unsecured Term Loans (Term Loans) • Note Purchase Agreements (NPAs) • Senior Unsecured Notes (Public
Notes) Such covenants are defined and calculated in accordance with the terms of the Credit Facility and Term Loans, the NPAs and the governing documents of the Public Notes. The Unsecured Term Loans and NPAs contain financial covenants that are
similar to those of the Unsecured Credit Agreement; therefore, the summary of key financial covenants is combined below, presenting the most restrictive covenant, if different. Credit Facility/Term Loans/NPAs – Key Covenants Required June 30,
2023 Maximum leverage ratio < 60% 43% Maximum unsecured leverage ratio < 60% 40% Maximum secured indebtedness ratio < 45% 25% Minimum fixed charge coverage ratio > 1.5x 3.3x Minimum unencumbered interest ratio > 2.0x 4.1x Public Notes
– Key Covenants Required June 30, 2023 Limitation on incurrence of total debt < 60% 43% Limitation on incurrence of secured debt < 40% 25% Debt service coverage ratio > 1.5x 3.7x Maintenance of total unencumbered assets > 150% 261%
8 supplemental operating & financial information
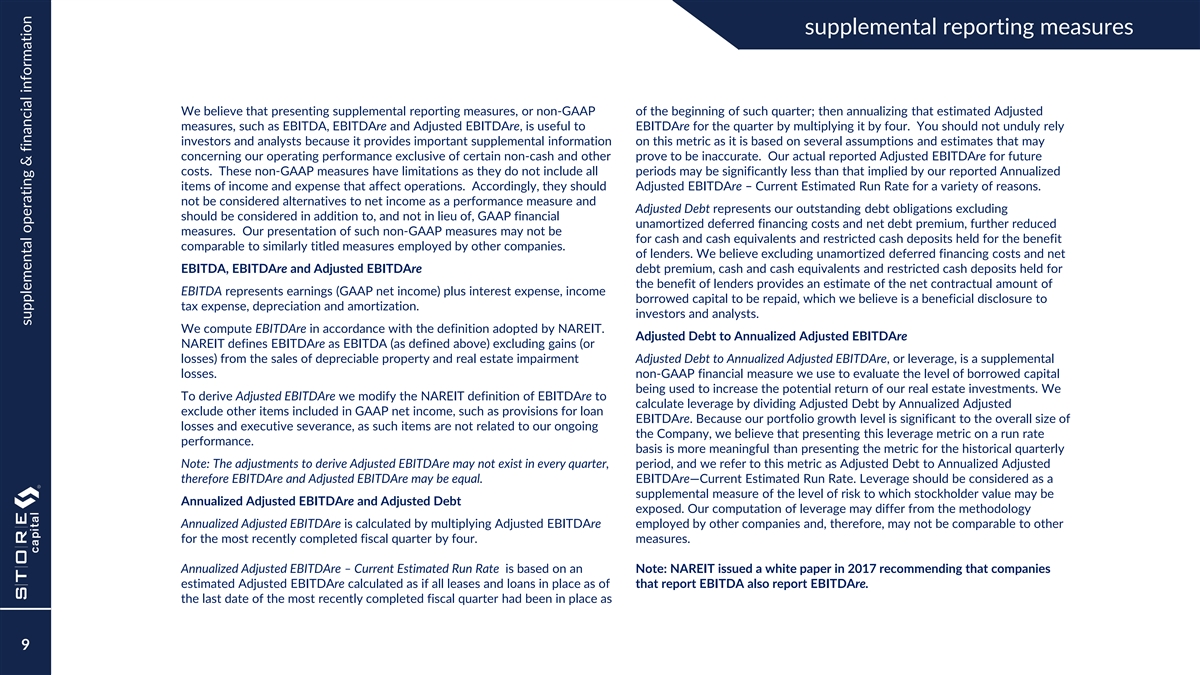
supplemental reporting measures We believe that presenting supplemental
reporting measures, or non-GAAP of the beginning of such quarter; then annualizing that estimated Adjusted measures, such as EBITDA, EBITDAre and Adjusted EBITDAre, is useful to EBITDAre for the quarter by multiplying it by four. You should not
unduly rely investors and analysts because it provides important supplemental information on this metric as it is based on several assumptions and estimates that may concerning our operating performance exclusive of certain non-cash and other prove
to be inaccurate. Our actual reported Adjusted EBITDAre for future costs. These non-GAAP measures have limitations as they do not include all periods may be significantly less than that implied by our reported Annualized items of income and expense
that affect operations. Accordingly, they should Adjusted EBITDAre – Current Estimated Run Rate for a variety of reasons. not be considered alternatives to net income as a performance measure and Adjusted Debt represents our outstanding debt
obligations excluding should be considered in addition to, and not in lieu of, GAAP financial unamortized deferred financing costs and net debt premium, further reduced measures. Our presentation of such non-GAAP measures may not be for cash and
cash equivalents and restricted cash deposits held for the benefit comparable to similarly titled measures employed by other companies. of lenders. We believe excluding unamortized deferred financing costs and net EBITDA, EBITDAre and Adjusted
EBITDAre debt premium, cash and cash equivalents and restricted cash deposits held for the benefit of lenders provides an estimate of the net contractual amount of EBITDA represents earnings (GAAP net income) plus interest expense, income borrowed
capital to be repaid, which we believe is a beneficial disclosure to tax expense, depreciation and amortization. investors and analysts. We compute EBITDAre in accordance with the definition adopted by NAREIT. Adjusted Debt to Annualized Adjusted
EBITDAre NAREIT defines EBITDAre as EBITDA (as defined above) excluding gains (or losses) from the sales of depreciable property and real estate impairment Adjusted Debt to Annualized Adjusted EBITDAre, or leverage, is a supplemental losses.
non-GAAP financial measure we use to evaluate the level of borrowed capital being used to increase the potential return of our real estate investments. We To derive Adjusted EBITDAre we modify the NAREIT definition of EBITDAre to calculate leverage
by dividing Adjusted Debt by Annualized Adjusted exclude other items included in GAAP net income, such as provisions for loan EBITDAre. Because our portfolio growth level is significant to the overall size of losses and executive severance, as such
items are not related to our ongoing the Company, we believe that presenting this leverage metric on a run rate performance. basis is more meaningful than presenting the metric for the historical quarterly Note: The adjustments to derive Adjusted
EBITDAre may not exist in every quarter, period, and we refer to this metric as Adjusted Debt to Annualized Adjusted therefore EBITDAre and Adjusted EBITDAre may be equal. EBITDAre—Current Estimated Run Rate. Leverage should be considered as a
supplemental measure of the level of risk to which stockholder value may be Annualized Adjusted EBITDAre and Adjusted Debt exposed. Our computation of leverage may differ from the methodology Annualized Adjusted EBITDAre is calculated by multiplying
Adjusted EBITDAre employed by other companies and, therefore, may not be comparable to other for the most recently completed fiscal quarter by four. measures. Annualized Adjusted EBITDAre – Current Estimated Run Rate is based on an Note:
NAREIT issued a white paper in 2017 recommending that companies estimated Adjusted EBITDAre calculated as if all leases and loans in place as of that report EBITDA also report EBITDAre. the last date of the most recently completed fiscal quarter had
been in place as 9 supplemental operating & financial information
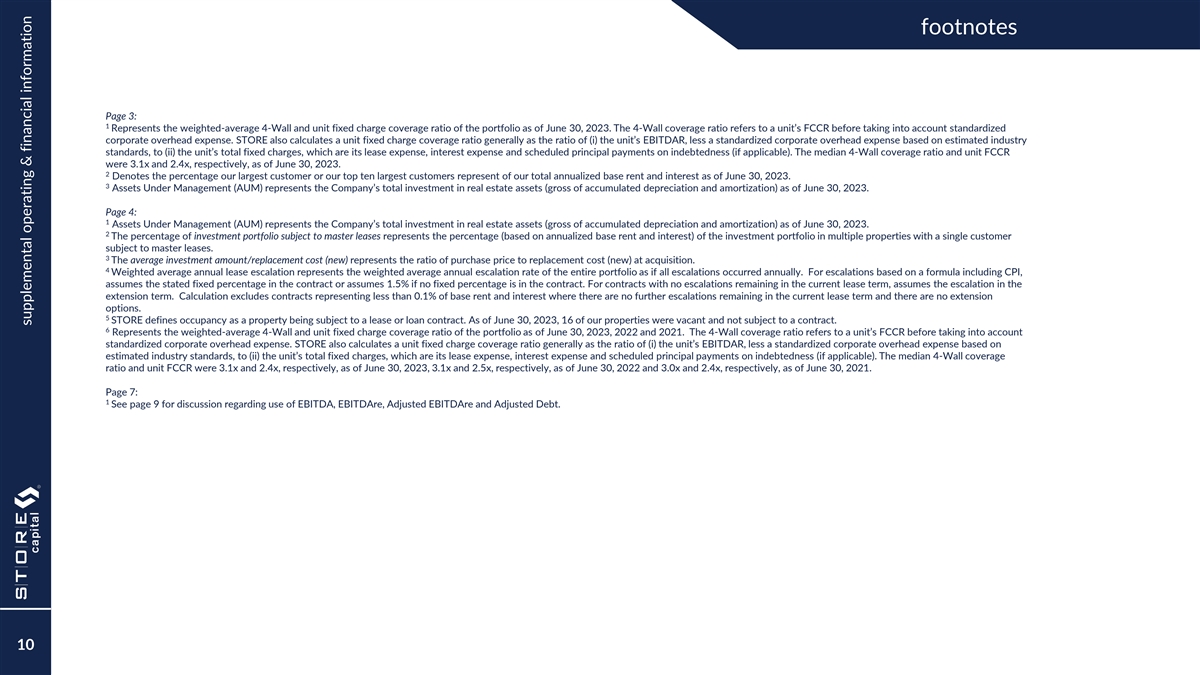
footnotes Page 3: 1 Represents the weighted-average 4-Wall and unit
fixed charge coverage ratio of the portfolio as of June 30, 2023. The 4-Wall coverage ratio refers to a unit’s FCCR before taking into account standardized corporate overhead expense. STORE also calculates a unit fixed charge coverage ratio
generally as the ratio of (i) the unit’s EBITDAR, less a standardized corporate overhead expense based on estimated industry standards, to (ii) the unit’s total fixed charges, which are its lease expense, interest expense and scheduled
principal payments on indebtedness (if applicable). The median 4-Wall coverage ratio and unit FCCR were 3.1x and 2.4x, respectively, as of June 30, 2023. 2 Denotes the percentage our largest customer or our top ten largest customers represent of our
total annualized base rent and interest as of June 30, 2023. 3 Assets Under Management (AUM) represents the Company’s total investment in real estate assets (gross of accumulated depreciation and amortization) as of June 30, 2023. Page 4: 1
Assets Under Management (AUM) represents the Company’s total investment in real estate assets (gross of accumulated depreciation and amortization) as of June 30, 2023. 2 The percentage of investment portfolio subject to master leases
represents the percentage (based on annualized base rent and interest) of the investment portfolio in multiple properties with a single customer subject to master leases. 3 The average investment amount/replacement cost (new) represents the ratio of
purchase price to replacement cost (new) at acquisition. 4 Weighted average annual lease escalation represents the weighted average annual escalation rate of the entire portfolio as if all escalations occurred annually. For escalations based on a
formula including CPI, assumes the stated fixed percentage in the contract or assumes 1.5% if no fixed percentage is in the contract. For contracts with no escalations remaining in the current lease term, assumes the escalation in the extension
term. Calculation excludes contracts representing less than 0.1% of base rent and interest where there are no further escalations remaining in the current lease term and there are no extension options. 5 STORE defines occupancy as a property being
subject to a lease or loan contract. As of June 30, 2023, 16 of our properties were vacant and not subject to a contract. 6 Represents the weighted-average 4-Wall and unit fixed charge coverage ratio of the portfolio as of June 30, 2023, 2022 and
2021. The 4-Wall coverage ratio refers to a unit’s FCCR before taking into account standardized corporate overhead expense. STORE also calculates a unit fixed charge coverage ratio generally as the ratio of (i) the unit’s EBITDAR, less a
standardized corporate overhead expense based on estimated industry standards, to (ii) the unit’s total fixed charges, which are its lease expense, interest expense and scheduled principal payments on indebtedness (if applicable). The median
4-Wall coverage ratio and unit FCCR were 3.1x and 2.4x, respectively, as of June 30, 2023, 3.1x and 2.5x, respectively, as of June 30, 2022 and 3.0x and 2.4x, respectively, as of June 30, 2021. Page 7: 1 See page 9 for discussion regarding use of
EBITDA, EBITDAre, Adjusted EBITDAre and Adjusted Debt. 10 supplemental operating & financial information
v3.23.2
| X |
- DefinitionBoolean flag that is true when the XBRL content amends previously-filed or accepted submission.
| Name: |
dei_AmendmentFlag |
| Namespace Prefix: |
dei_ |
| Data Type: |
xbrli:booleanItemType |
| Balance Type: |
na |
| Period Type: |
duration |
|
| X |
- DefinitionFor the EDGAR submission types of Form 8-K: the date of the report, the date of the earliest event reported; for the EDGAR submission types of Form N-1A: the filing date; for all other submission types: the end of the reporting or transition period. The format of the date is YYYY-MM-DD.
| Name: |
dei_DocumentPeriodEndDate |
| Namespace Prefix: |
dei_ |
| Data Type: |
xbrli:dateItemType |
| Balance Type: |
na |
| Period Type: |
duration |
|
| X |
- DefinitionThe type of document being provided (such as 10-K, 10-Q, 485BPOS, etc). The document type is limited to the same value as the supporting SEC submission type, or the word 'Other'.
| Name: |
dei_DocumentType |
| Namespace Prefix: |
dei_ |
| Data Type: |
dei:submissionTypeItemType |
| Balance Type: |
na |
| Period Type: |
duration |
|
| X |
- DefinitionAddress Line 1 such as Attn, Building Name, Street Name
| Name: |
dei_EntityAddressAddressLine1 |
| Namespace Prefix: |
dei_ |
| Data Type: |
xbrli:normalizedStringItemType |
| Balance Type: |
na |
| Period Type: |
duration |
|
| X |
- DefinitionAddress Line 2 such as Street or Suite number
| Name: |
dei_EntityAddressAddressLine2 |
| Namespace Prefix: |
dei_ |
| Data Type: |
xbrli:normalizedStringItemType |
| Balance Type: |
na |
| Period Type: |
duration |
|
| X |
- Definition
+ References
+ Details
| Name: |
dei_EntityAddressCityOrTown |
| Namespace Prefix: |
dei_ |
| Data Type: |
xbrli:normalizedStringItemType |
| Balance Type: |
na |
| Period Type: |
duration |
|
| X |
- DefinitionCode for the postal or zip code
| Name: |
dei_EntityAddressPostalZipCode |
| Namespace Prefix: |
dei_ |
| Data Type: |
xbrli:normalizedStringItemType |
| Balance Type: |
na |
| Period Type: |
duration |
|
| X |
- DefinitionName of the state or province.
| Name: |
dei_EntityAddressStateOrProvince |
| Namespace Prefix: |
dei_ |
| Data Type: |
dei:stateOrProvinceItemType |
| Balance Type: |
na |
| Period Type: |
duration |
|
| X |
- DefinitionA unique 10-digit SEC-issued value to identify entities that have filed disclosures with the SEC. It is commonly abbreviated as CIK. Reference 1: http://www.xbrl.org/2003/role/presentationRef
-Publisher SEC
-Name Exchange Act
-Number 240
-Section 12
-Subsection b-2
| Name: |
dei_EntityCentralIndexKey |
| Namespace Prefix: |
dei_ |
| Data Type: |
dei:centralIndexKeyItemType |
| Balance Type: |
na |
| Period Type: |
duration |
|
| X |
- DefinitionIndicate if registrant meets the emerging growth company criteria. Reference 1: http://www.xbrl.org/2003/role/presentationRef
-Publisher SEC
-Name Exchange Act
-Number 240
-Section 12
-Subsection b-2
| Name: |
dei_EntityEmergingGrowthCompany |
| Namespace Prefix: |
dei_ |
| Data Type: |
xbrli:booleanItemType |
| Balance Type: |
na |
| Period Type: |
duration |
|
| X |
- DefinitionCommission file number. The field allows up to 17 characters. The prefix may contain 1-3 digits, the sequence number may contain 1-8 digits, the optional suffix may contain 1-4 characters, and the fields are separated with a hyphen.
| Name: |
dei_EntityFileNumber |
| Namespace Prefix: |
dei_ |
| Data Type: |
dei:fileNumberItemType |
| Balance Type: |
na |
| Period Type: |
duration |
|
| X |
- DefinitionTwo-character EDGAR code representing the state or country of incorporation.
| Name: |
dei_EntityIncorporationStateCountryCode |
| Namespace Prefix: |
dei_ |
| Data Type: |
dei:edgarStateCountryItemType |
| Balance Type: |
na |
| Period Type: |
duration |
|
| X |
- DefinitionThe exact name of the entity filing the report as specified in its charter, which is required by forms filed with the SEC. Reference 1: http://www.xbrl.org/2003/role/presentationRef
-Publisher SEC
-Name Exchange Act
-Number 240
-Section 12
-Subsection b-2
| Name: |
dei_EntityRegistrantName |
| Namespace Prefix: |
dei_ |
| Data Type: |
xbrli:normalizedStringItemType |
| Balance Type: |
na |
| Period Type: |
duration |
|
| X |
- DefinitionThe Tax Identification Number (TIN), also known as an Employer Identification Number (EIN), is a unique 9-digit value assigned by the IRS. Reference 1: http://www.xbrl.org/2003/role/presentationRef
-Publisher SEC
-Name Exchange Act
-Number 240
-Section 12
-Subsection b-2
| Name: |
dei_EntityTaxIdentificationNumber |
| Namespace Prefix: |
dei_ |
| Data Type: |
dei:employerIdItemType |
| Balance Type: |
na |
| Period Type: |
duration |
|
| X |
- DefinitionLocal phone number for entity.
| Name: |
dei_LocalPhoneNumber |
| Namespace Prefix: |
dei_ |
| Data Type: |
xbrli:normalizedStringItemType |
| Balance Type: |
na |
| Period Type: |
duration |
|
| X |
- DefinitionBoolean flag that is true when the Form 8-K filing is intended to satisfy the filing obligation of the registrant as pre-commencement communications pursuant to Rule 13e-4(c) under the Exchange Act. Reference 1: http://www.xbrl.org/2003/role/presentationRef
-Publisher SEC
-Name Exchange Act
-Number 240
-Section 13e
-Subsection 4c
| Name: |
dei_PreCommencementIssuerTenderOffer |
| Namespace Prefix: |
dei_ |
| Data Type: |
xbrli:booleanItemType |
| Balance Type: |
na |
| Period Type: |
duration |
|
| X |
- DefinitionBoolean flag that is true when the Form 8-K filing is intended to satisfy the filing obligation of the registrant as pre-commencement communications pursuant to Rule 14d-2(b) under the Exchange Act. Reference 1: http://www.xbrl.org/2003/role/presentationRef
-Publisher SEC
-Name Exchange Act
-Number 240
-Section 14d
-Subsection 2b
| Name: |
dei_PreCommencementTenderOffer |
| Namespace Prefix: |
dei_ |
| Data Type: |
xbrli:booleanItemType |
| Balance Type: |
na |
| Period Type: |
duration |
|
| X |
- DefinitionBoolean flag that is true when the Form 8-K filing is intended to satisfy the filing obligation of the registrant as soliciting material pursuant to Rule 14a-12 under the Exchange Act. Reference 1: http://www.xbrl.org/2003/role/presentationRef
-Publisher SEC
-Name Exchange Act
-Section 14a
-Number 240
-Subsection 12
| Name: |
dei_SolicitingMaterial |
| Namespace Prefix: |
dei_ |
| Data Type: |
xbrli:booleanItemType |
| Balance Type: |
na |
| Period Type: |
duration |
|
| X |
- DefinitionBoolean flag that is true when the Form 8-K filing is intended to satisfy the filing obligation of the registrant as written communications pursuant to Rule 425 under the Securities Act. Reference 1: http://www.xbrl.org/2003/role/presentationRef
-Publisher SEC
-Name Securities Act
-Number 230
-Section 425
| Name: |
dei_WrittenCommunications |
| Namespace Prefix: |
dei_ |
| Data Type: |
xbrli:booleanItemType |
| Balance Type: |
na |
| Period Type: |
duration |
|
STORE Capital (NYSE:STOR)
Historical Stock Chart
From Apr 2024 to May 2024

STORE Capital (NYSE:STOR)
Historical Stock Chart
From May 2023 to May 2024
