Transcontinental Realty Investors, Inc. (NYSE: TCI), a
Dallas-based real estate investment company, today reported results
of operations for the first quarter ended March 31, 2018. For the
three months ended March 31, 2018, we reported a net loss
applicable to common shares of $0.5 million or ($0.05) per diluted
loss per share compared to a net loss applicable to common shares
of $5.4 million or ($0.61) per diluted loss per share for the same
period ended 2017.
During this period the company adhered to its overall business
strategy to focus only on high value assets and with this in mind,
we disposed of several underperforming properties. Though this
created a slight reduction in revenue, the overall operating income
was virtually consistent with the first quarter of 2017. As the
company has been redeploying capital in new residential apartment
properties, we fully anticipate increases in both revenue and
operating income.
Going forward we further believe that operating expenses should
remain very manageable as we continue to replace older
underperforming assets with newer class A properties.
Revenues
Rental and other property revenues were $31.1 million for the
three months ended March 31, 2018. This represents a decrease of
approximately $0.4 million, compared to the prior period revenues
of $31.5 million. This change, by segment, is an increase in the
apartment portfolio of $0.9 million, and a decrease in the
commercial portfolio of $1.3 million.
Expense
Property operating expenses were $14.5 million for the three
months ended March 31, 2018. This represents a decrease of $1.4
million, compared to the prior period operating expenses of $15.9
million. This change, by segment, is a decrease in the apartment
portfolio of $0.2 million, a decrease in the commercial portfolio
of $0.9 million and a decrease in the land portfolio of $0.2
million.
Depreciation and amortization expenses were $6.4 million for the
three months ended March 31, 2018. This represents an increase of
$0.1 million as compared to prior period depreciation of $6.3
million.
Mortgage and loan interest expense was $14.1 million for the
three months ended March 31, 2018. This represents a decrease of
$1.1 million, as compared to the prior period expense of $15.2
million. The change by segment is an increase in the other
portfolio of $0.4 million and a decrease in the apartment portfolio
of $1.4 million, and an increase in the commercial portfolio of
$0.2 million. Within the other portfolio, the increase is primarily
due to $2.3 million of interest expense related to the bonds.
Other income was $3.6 million for the three months ended March
31, 2018. This represents an increase of $2.5 million compared to
prior period other income of $1.1 million. This increase is due to
forgiveness of debt of $1.5 million during the first quarter and
$1.8 million of foreign currency translation gain due to change in
currency exchange rate.
Gain on land sales increased for the three months ended March
31, 2018, compared to the prior period. In the current period we
sold 62 acres of land for a sales price of $3.0 million and
recorded a gain of $1.3 million. For the same period in 2017, we
sold 2.49 acres of land for a sales price of $1.1 million and
recorded a gain of $0.4 million.
About Transcontinental Realty Investors, Inc.
Transcontinental Realty Investors, Inc., a Dallas-based real
estate investment company, holds a diverse portfolio of equity real
estate located across the U.S., including apartments, office
buildings, shopping centers, and developed and undeveloped land.
The Company invests in real estate through direct ownership, leases
and partnerships and invests in mortgage loans on real estate. For
more information, visit the Company’s website at
www.transconrealty-invest.com.
TRANSCONTINENTAL REALTY INVESTORS, INC.
CONSOLIDATED STATEMENTS OF OPERATIONS (unaudited)
For the Three Months Ended March
31, 2018 2017 (dollars in
thousands, except share and par value amounts) Revenues:
Rental and other property revenues (including $208 and $190 for the
three months ended 2018 and 2017, respectively, from related
parties) $ 31,082 $ 31,535
Expenses: Property
operating expenses (including $227 and $228 for the three months
ended 2018 and 2017, respectively, from related parties) 14,455
15,889 Depreciation and amortization 6,446 6,303 General and
administrative (including $1,093 and $732 for the three months
ended 2018 and 2017, respectively, from related parties) 2,192
1,780 Net income fee to related party 53 60 Advisory fee to related
party 2,748 2,305 Total operating
expenses 25,894 26,337 Net operating
income 5,188 5,198
Other income (expenses): Interest
income (including $3,236 and $3,169 for the three months ended 2018
and 2017, respectively, from related parties) 3,876 3,421 Other
income (expense) 1,826 1,442 Mortgage and loan interest (including
$318 and $151 for the three months ended 2018 and 2017,
respectively, from related parties) (14,093 ) (15,190 ) Foreign
currency translation gain (loss) 1,756 (323 ) Earnings (losses)
from unconsolidated joint ventures and investees 11
(8 ) Total other expenses (6,624 ) (10,658 )
Loss before gain on land sales, non-controlling interest, and taxes
(1,436 ) (5,460 ) Gain on land sales 1,335 445
Net loss from continuing operations before taxes (101
) (5,015 ) Net loss from continuing operations (101 ) (5,015
) Net loss (101 ) (5,015 ) Net (income) attributable to
non-controlling interest (132 ) (119 ) Net loss
attributable to Transcontinental Realty Investors, Inc. (233 )
(5,134 ) Preferred dividend requirement (222 ) (222 )
Net loss applicable to common shares $ (455 ) $ (5,356 )
Earnings per share - basic Net loss from
continuing operations $ (0.05 ) $ (0.61 )
Earnings per
share - diluted Net loss from continuing
operations $ (0.05 ) $ (0.61 ) Weighted average common
shares used in computing earnings per share 8,717,767 8,717,767
Weighted average common shares used in computing diluted earnings
per share 8,717,767 8,717,767
Amounts attributable to
Transcontinental Realty Investors, Inc. Net loss from
continuing operations $ (233 ) $ (5,134 ) Net loss applicable to
Transcontinental Realty, Investors, Inc. $ (233 ) $ (5,134 )
TRANSCONTINENTAL REALTY INVESTORS, INC.
CONSOLIDATED BALANCE SHEETS
March 31, December 31, 2018 2017
(unaudited) (audited) (dollars in thousands,
except share and par value amounts) Assets Real estate,
at cost $ 1,111,346 $ 1,112,721 Real estate subject to sales
contracts at cost 45,739 45,739 Less accumulated depreciation
(179,100 ) (178,590 ) Total real estate 977,985
979,870 Notes and interest receivable: Performing (including
$48,553 in 2018 and $45,155 in 2017 from related parties)
83,342 70,166 Total notes and interest
receivable 83,342 70,166 Cash and cash equivalents 40,894 42,705
Restricted cash 55,400 45,637 Investments in unconsolidated joint
ventures and investees 2,483 2,472 Receivable from related party
115,734 111,665 Other assets 54,751 60,907
Total assets $ 1,330,589 $ 1,313,422
Liabilities and Shareholders’ Equity Liabilities: Notes and
interest payable $ 885,831 $ 892,149 Notes related to real estate
held for sale 376 376 Notes related to real estate subject to sales
contracts 347 1,957 Bond and bond interest payable 146,888 113,047
Deferred revenue (including $40,584 in 2018 and $40,574 in 2017 to
related parties) 60,960 60,949 Accounts payable and other
liabilities (including $6,701 in 2018 and $7,236 in 2017 to related
parties) 28,249 36,683 Total
liabilities 1,122,651 1,105,161 Shareholders’ equity:
Preferred stock, Series C: $0.01 par value, authorized 10,000,000
shares; issued and outstanding zero shares in 2018 and 2017. Series
D: $0.01 par value, authorized, issued and outstanding 100,000
shares in 2018 and 2017 (liquidation preference $100 per share) 1 1
Common stock, $0.01 par value, authorized 10,000,000 shares; issued
8,717,967 shares in 2018 and 2017; outstanding 8,717,767 shares in
2018 and 2017 87 87 Treasury stock at cost, 200 shares in 2018 and
2017 (2 ) (2 ) Paid-in capital 268,727 268,949 Retained deficit
(80,098 ) (79,865 ) Total Transcontinental Realty
Investors, Inc. shareholders' equity 188,715 189,170
Non-controlling interest 19,223 19,091
Total shareholders' equity 207,938 208,261
Total liabilities and shareholders' equity $ 1,330,589
$ 1,313,422
View source
version on businesswire.com: https://www.businesswire.com/news/home/20180515006796/en/
Transcontinental Realty Investors, Inc.Investor
RelationsGene Bertcher,
800-400-6407investor.relations@transconrealty-invest.com
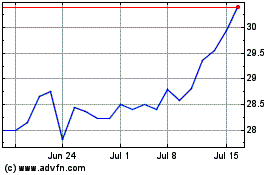
Transcontinental Realty ... (NYSE:TCI)
Historical Stock Chart
From Mar 2024 to Apr 2024

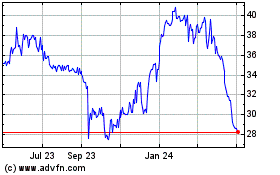
Transcontinental Realty ... (NYSE:TCI)
Historical Stock Chart
From Apr 2023 to Apr 2024
