State Street Private Equity Index Ends 3Q 2017 with Continued Strong Performance
February 01 2018 - 10:32AM
Business Wire
Buyout Funds Lead Private Equity Strategies in Returns for
Seventh Consecutive Quarter
The State Street Global Exchange℠ Private Equity Index (GXPEI)
closed the third quarter of 2017 with a solid performance of 3.85
percent with Buyout Funds continuing to lead private equity
strategies in gains. The GXPEI is based on directly-sourced limited
partnership data and represents more than $2.7 trillion in private
equity investments, with more than 2,800 unique private equity
partnerships, as of September 30, 2017.
“Momentum is the name of the game in the third quarter of 2017,”
said Will Kinlaw, senior managing director and global head of State
Street Associates®, a division of State Street Global Exchange.
“Not only were the overall returns close to the previous quarter’s
strong returns, but the relative performances across market
segments, such as fund strategy, region and sector focus was
largely unchanged.”
Third Quarter Highlights Include:
- Buyout funds posted a 4.11% gain in Q3.
While slightly lower than Q2’s 4.73%, they still led the three main
strategies for the seventh consecutive quarter.
- Venture Capital return improved to
3.57% from 1.84% in Q2 and Private Debt funds inched lower to 2.84%
in Q3 from 3.08% in Q2.
- European-focused private equity funds
experienced a 6.07% quarterly gain in USD-denominated terms (2.32%
in EUR-denominated initial rate of return). US-focused funds
returned 3.20%, while funds focused on the rest of the world gained
4.29%.
- Among sectors, Industrial funds saw the
highest return rising to 5.87%, up from 4.73% in Q2; followed by
Information Technology funds with a return of 3.80%, up from 3.10%
in Q2; Energy funds’ performance improved to 2.59% this quarter up
from 0.26% in Q2.
- Average monthly paid-in-capital to
commitment (PICC) increased to 0.74 percent in 2017 up from 0.64
percent in 2016 while average monthly distribution to commitment
(DCC) increased to 1.04 percent in 2017 up from 0.88 percent in
2016.
“Following a minor slowdown in cash flow activities in 2016,
there has been a meaningful recovery in both capital calls and
distributions signaled by the higher cash flow ratios in 2017,”
said Anthony Catino, managing director, Alternative Investment
Solutions for State Street. “The gap between distribution and
contribution also widened in 2017 comparing to 2016, strengthening
a trend started in 2012.”
For additional insights, or to learn more about the GX Private
Equity Index please visit http://www.ssgx.com/peindex.
Index returns reflect capital gains and losses, income, and the
reinvestment of dividends.
It is not possible to invest directly in an index. Index
performance does not reflect charges and expenses associated with
the fund or brokerage commissions associated with buying and
selling a fund.
Index performance is not meant to represent that of any
particular fund.
About State Street CorporationState Street Corporation
(NYSE: STT) is one of the world's leading providers of financial
services to institutional investors, including investment
servicing, investment management and investment research and
trading. With $33.10 trillion in assets under custody and
administration and $2.80 trillion* in assets under management as of
December 31, 2017, State Street operates in more than 100
geographic markets worldwide, including the US, Canada, Europe, the
Middle East and Asia. For more information, visit State Street’s
website at www.statestreet.com.
* AUM reflects approx. $35 billion (as of December 31, 2017)
with respect to which State Street Global Markets, LLC (SSGM)
serves as marketing agent; SSGM and State Street Global Advisors
are affiliated.
Important Information
Investing involves risk including the risk of loss of
principal.
State Street Global Exchange℠ and State Street Associates® are
trademarks of State Street Corporation (incorporated in
Massachusetts) and are registered or have registrations pending in
multiple jurisdictions. This document and information herein
(together, the “Content”) is subject to change without notice based
on market and other conditions and in any event may not reflect the
views of State Street Corporation and its subsidiaries and
affiliates (“State Street”). The Content provided is for
informational, illustrative and/or marketing purposes only and it
does not constitute investment research or investment, legal, or
tax advice. The Content provided has been prepared and obtained
from sources believed to be reliable at the time of preparation,
however it is provided “as-is” and State Street makes no guarantee,
representation, or warranty of any kind including, without
limitation, as to its accuracy, suitability, timeliness,
merchantability, fitness for a particular purpose, non-infringement
of third-party rights, or otherwise. State Street disclaims all
liability, whether arising in contract, tort or otherwise, for any
claims, losses, liabilities, damages (including direct, indirect,
special or consequential), expenses or costs arising from or
connected with the Content. The Content provided is not, nor should
be construed as any offer or solicitation to buy or sell any
product, service, or securities or any financial instrument, and it
does not constitute any binding contractual arrangement or
commitment for State Street of any kind. The Content provided may
contain certain statements that could be deemed forward-looking
statements; any such statements or forecasted information are not
guarantees or reliable indicators for future performance and actual
results or developments may differ materially from those depicted
or projected. Past performance is no guarantee of future results.
No permission is granted to reprint, sell, copy, distribute, or
modify the Content in any form or by any means without the prior
written consent of State Street.
Currency Risk is a form of risk that arises from the change in
price of one currency against another. Whenever investors or
companies have assets or business operations across national
borders, they face currency risk if their positions are not
hedged.
All information has been obtained from sources believed to be
reliable, but its accuracy is not guaranteed. There is no
representation or warranty as to the current accuracy, reliability
or completeness of, nor liability for decisions based on such
information and it should not be relied on as such.
State Street Corporation, One Lincoln Street, Boston, MA
02111-2900.
© 2018 State Street Corporation - All Rights Reserved
View source
version on businesswire.com: http://www.businesswire.com/news/home/20180201005885/en/
State Street CorporationJulie Kane, +1
617-664-3001JEKane@StateStreet.com@StateStreet
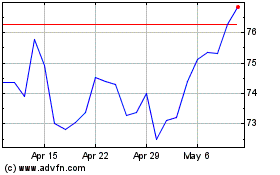
State Street (NYSE:STT)
Historical Stock Chart
From Jun 2024 to Jul 2024

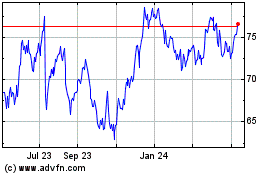
State Street (NYSE:STT)
Historical Stock Chart
From Jul 2023 to Jul 2024
