State Street Misses by a Penny - Analyst Blog
January 18 2012 - 7:27AM
Zacks
State Street Corporation (STT) reported fourth
quarter 2011 operating earnings per share of 93 cents, a penny
below the Zacks Consensus Estimate. However, this compares
favorably with the prior-year quarter earnings of 87 cents.
On a GAAP basis, earnings for the quarter came in at 76 cents
per share compared with earnings of $1.10 in the prior quarter and
only 16 cents in the year-ago quarter.
Operating results for the quarter were aided by strong net
interest revenue and lower expenses. Capital ratios were also
steady during the quarter. However, lower non-interest revenue was
among the negatives. Also, the company recorded $58 million pre-tax
charges during the reported quarter associated with its business
operations and information technology transformation program.
For the full year 2011, operating earnings came in at $3.73 per
share, missing the Zacks Consensus Estimate by a penny. The company
reported operating earnings of $3.40 in the previous year.
According to the requirement, the company has submitted its 2012
capital plan to the Federal Reserve earlier this month.
Quarter in Detail
State Street reported revenue of $2.32 billion in the quarter,
down 5% sequentially but up 13% year over year. Operating revenue
of $2.29 billion fell 5% from $2.41 billion in the prior quarter
but was almost flat compared with $2.28 billion in the year-ago
quarter. Operating revenue was substantially lower than the Zacks
Consensus Estimate of $2.41 billion.
Operating revenues for the full year 2011 were $9.50 billion, up
from $8.71 billion in the previous year. Full year revenues came in
better than the Zacks Consensus Estimate of $9.70
billion.
For the reported quarter, net interest revenue on an operating
basis increased 2% sequentially and 5% year over year to $577
million. The sequential increase was mainly attributable to an
increase in earning assets driven by an increase in client
deposits.
Net interest margin (NIM) on an operating basis (excluding the
excess deposits) was 1.55% in the quarter, down from 1.56% in the
prior quarter and 2.07% in the prior-year quarter.
State Street reported 4% year-over-year decline in fee revenues
during the quarter. The drop was mainly due to substantial fall in
trading services and processing fees.
On an operating basis, expenses were $1.64 billion, down 5%
sequentially but up 1% year over year. The sequential decline was
mainly due to lower salaries and employee benefits expenses.
Total assets under custody and administration were $21.81
trillion as of December 31, 2011, up 1% year over year.
Capital and Profitability Ratios
State Street’s capital ratios continue to remain strong. As of
December 31, 2011, Tier 1 risk-based capital ratio was 18.9%, up
from 17.9% as of September 30, 2011 but down from 20.5% as of
December 31, 2010. Tier 1 common to risk-weighted assets increased
to 16.9% as of December 31, 2011 from 16.0% as of September 30,
2011 but decreased from 18.1% as of December 31, 2010.
For the reported quarter, return on common equity (on an
operating basis) came in at 9.5% compared with 9.8% in both the
prior quarter and the prior-year quarter.
Our Viewpoint
We anticipate the company’s restructuring programs along with
well-off core servicing and investment management franchises to
help offset the weakness caused by the sluggish economic recovery.
However, given the ongoing weakness in the mortgage market, we
remain concerned about the sizable amount of mortgage-backed and
asset-backed securities in its investment portfolio.
Among State Street’s competitors, BB&T
Corp. (BBT) is scheduled to report fourth quarter earnings
on January 19 while SunTrust Banks Inc. (STI) will
report on January 19.
State Street currently retains a Zacks #3 Rank, which translates
into a short-term Hold’ rating. Considering the company’s
fundamentals, we are also maintaining our long-term “Neutral”
recommendation on the shares.
BB&T CORP (BBT): Free Stock Analysis Report
SUNTRUST BKS (STI): Free Stock Analysis Report
STATE ST CORP (STT): Free Stock Analysis Report
To read this article on Zacks.com click here.
Zacks Investment Research
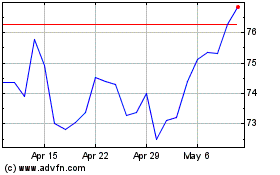
State Street (NYSE:STT)
Historical Stock Chart
From May 2024 to Jun 2024

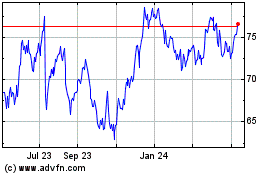
State Street (NYSE:STT)
Historical Stock Chart
From Jun 2023 to Jun 2024
