Kimco Reports in Line - Analyst Blog
May 05 2011 - 10:00AM
Zacks
Kimco Realty Corp.
(KIM), a leading real estate investment trust (REIT), reported
first quarter 2011 rental revenues of $224.0 million compared with
$213.4 million in the year-earlier quarter – an increase of 5.0%.
Total revenues for the reported quarter exceeded the Zacks
Consensus Estimate of $216.0 million.
Kimco reported first quarter 2011
FFO (fund from operations) of $115.1 million or 28 cents per share
compared with $126.0 million or 31 cents in the year-ago period.
Fund from operations, a widely used metric to gauge the performance
of REITs, is obtained after adding depreciation and amortization
and other non-cash expenses to net income.
Excluding certain non-recurring
items, FFO for the reported quarter was $121.2 million or 30 cents
per share compared with $115.6 million or 28 cents in the
year-earlier quarter. The recurring FFO for the quarter was in line
with the Zacks Consensus Estimate.
Overall occupancy in Kimco’s
combined shopping center portfolio was 92.8% at the end of the
quarter, an increase of 20 bps compared with first quarter 2010. In
the U.S. portfolio, occupancy was 92.5% as of March 31, 2011, an
increase of 40 bps compared with the year-ago period. Same-store
net operating income (cash-basis, excluding lease termination fees
and including charges for bad debts) in the U.S. portfolio
increased 1.1% year-over-year.
During the reported quarter, Kimco
executed a total of 696 leases spanning 2.6 million square feet.
These included 106 new leases in the same-store portfolio totaling
347,000 pro-rata square feet and 376 lease renewals and options for
1.8 million pro-rata square feet. In addition, Kimco executed over
200 new leases totaling 393,000 square feet for spaces vacant for
more than one year. Leasing spreads in the U.S. portfolio increased
1.4% (cash basis).
The company acquired 2 shopping
centers during the quarter, along with a land parcel for
approximately $37.4 million, including $15.4 million in mortgage
debt. Subsequent to the quarter-end, Kimco acquired a grocery
anchored shopping center for $13.7 million, including $9.3 million
of mortgage debt, and sold 2 unencumbered non-strategic shopping
centers for $3.2 million.
The reported quarter also saw the
company recognizing $9.7 million of fee income related to its
investment management business, including $7.5 million in
management fees, $0.1 million in acquisition fees and $2.1 million
in other ongoing fees. Kimco had 284 properties in investment
management funds with 24 institutional partners at quarter-end.
During the quarter, the company
generated $15.1 million of income from its structured investments
and other non-retail assets, out of which $14.6 million was
recurring in nature. During first quarter 2011, Kimco reduced its
non-retail investments by $11 million primarily from the sale of
marketable securities as well as the sale of one of the Canadian
hotels in the Westmont joint venture. As of April 30, 2011, Kimco
reduced its non-retail assets to approximately $612 million
compared to $1.2 billion at the end of first quarter 2009.
At quarter-end, Kimco had over $1.7
billion available under its revolving credit facilities. The
company’s consolidated net debt to recurring EBITDA (earnings
before interest, tax, depreciation and amortization) ratio was
6.2x. For fiscal 2011, the company reiterated its earlier recurring
FFO guidance in the range of $1.17 – $1.21 per share.
We maintain our ‘Neutral’
recommendation for the long term on the stock, which presently has
a Zacks #3 Rank translating into a short-term ‘Hold’ rating.
However, we have an ‘Outperform’ recommendation and a Zacks #3 Rank
for CBL & Associates Properties Inc. (CBL),
one of the competitors of Kimco.
CBL&ASSOC PPTYS (CBL): Free Stock Analysis Report
KIMCO REALTY CO (KIM): Free Stock Analysis Report
Zacks Investment Research
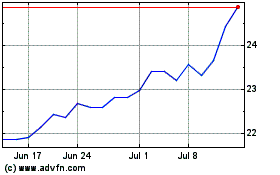
CBL and Associates Prope... (NYSE:CBL)
Historical Stock Chart
From May 2024 to Jun 2024

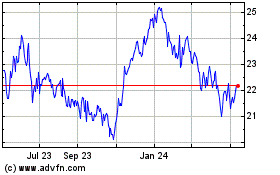
CBL and Associates Prope... (NYSE:CBL)
Historical Stock Chart
From Jun 2023 to Jun 2024
