Bristol-Myers Squibb On Pace for Highest Close in Over a Year -- Data Talk
December 11 2019 - 11:33AM
Dow Jones News
Bristol-Myers Squibb Company (BMY) is currently at $62.58, up
$0.48 or 0.78%
-- Would be highest close since Oct. 9, 2018, when it closed at
$63.23
-- Currently up 10 of the past 11 days
-- On Tuesday, presented survival and safety data from its study
evaluating CC-486 as maintenance therapy in a broad population of
patients with front-line, newly diagnosed acute myeloid leukemia.
In the QUAZAR AML-001 study, treatment with CC-486 in the
maintenance setting provided patients a statistically significant
and clinically meaningful improvement. Based on the results,
Bristol-Myers Squibb said it is planning regulatory submissions in
the first half of 2020
-- Currently up eight consecutive days; up 9.9% over this
period
-- Longest winning streak since Aug. 31, 2017, when it rose for
nine straight trading days
-- Best eight day stretch since the eight days ending Jan. 15,
2019, when it rose 10.2%
-- Up 9.9% month-to-date
-- Up 20.38% year-to-date; on pace for best year since 2013,
when it rose 63.09%
-- Down 18.49% from its all-time closing high of $76.77 on July
14, 2016
-- Up 17.09% from 52 weeks ago (Dec. 12, 2018), when it closed
at $53.44
-- Would be a new 52 week closing high
-- Up 46.31% from its 52 week closing low of $42.77 on July 22,
2019
-- Traded as high as $62.98; highest intraday level since Oct.
10, 2018, when it hit $63.35
-- Up 1.43% at today's intraday high
All data as of 10:55:09 AM
Source: Dow Jones Market Data, FactSet
(END) Dow Jones Newswires
December 11, 2019 11:18 ET (16:18 GMT)
Copyright (c) 2019 Dow Jones & Company, Inc.
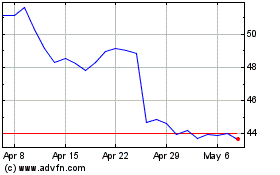
Bristol Myers Squibb (NYSE:BMY)
Historical Stock Chart
From Mar 2024 to Apr 2024

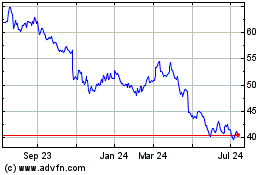
Bristol Myers Squibb (NYSE:BMY)
Historical Stock Chart
From Apr 2023 to Apr 2024
