Northwest Pipe Company (NASDAQ: NWPX)
Highlights:
- Net sales were a record $524.5 million in
2012, up from the previous record of $511.7 million in
2011
- Operating income was $27.6 million
- Net income was $16.2 million, or $1.72 per
diluted share
Northwest Pipe Company (NASDAQ: NWPX) today announced its 2012
financial results including record net sales in 2012. The Company
will broadcast its 2012 earnings conference call on Friday, March
15, 2013, at 8:00 am PDT.
Full Year 2012 Results
Net sales for the year ended December 31, 2012 increased 2.5% to
$524.5 million compared to $511.7 million in the year ended
December 31, 2011. Gross profit was $56.2 million (10.7% of net
sales) in 2012, a decrease from $59.1 million (11.6% of net sales)
in 2011. Net income for 2012 was $16.2 million or $1.72 per diluted
share compared to $12.7 million or $1.35 per diluted share for
2011.
Water Transmission sales decreased by 1.0% to $269.2 million in
2012 from $271.9 million in 2011. The minor decrease in net sales
was due to an 8.9% decrease in the average selling price per ton
which was offset by an 8.7% increase in tons produced. Water
Transmission gross profit increased to $45.1 million (16.7% of
segment net sales) in 2012 from $43.2 million (15.9% of segment net
sales) in the prior year.
Tubular Products sales increased 6.5% to $255.3 million in 2012
from $239.8 million in 2011, driven by a 4% increase in average
selling price per ton and a 2% increase in tons sold from 202,400
tons in 2011 to 206,200 tons in 2012. Tubular Products gross profit
decreased by 30.1% to $11.1 million (4.4% of segment net sales) in
2012 from $16.0 million (6.7% of segment net sales) in 2011.
As of December 31, 2012, the backlog of orders in the Water
Transmission segment was approximately $173 million. This compared
to a backlog of orders of $138 million as of December 31, 2011. The
backlog includes confirmed orders, including the balance of
projects in process, and projects for which the Company has been
notified that we are the successful bidder even though a binding
agreement has not been executed.
Outlook
"The Water Transmission segment had higher margins in 2012
compared to 2011, although net sales stayed relatively the same.
The fourth quarter was the strongest quarter of 2012 in Water
Transmission, and was the highest quarter ever in Water
Transmission in both net sales and gross profit. This was due, in
part, to production on the Lake Texoma project, the largest project
in our history," said Scott Montross, President and Chief Executive
Officer of the Company. "As expected, we saw lower margins in the
Tubular Products segment in 2012 as compared to 2011 with the
competition from increased quantities of imported energy pipe,
particularly in the third and fourth quarters. The Tubular Products
segment was also negatively impacted by lower drilling activity, as
seen in the decrease in rig counts, and lower natural gas prices.
In Water Transmission, we anticipate that the first quarter of 2013
will have similar profitability as the fourth quarter of 2012,
although with lower net sales. In Tubular Products, we expect to be
near breakeven as competition from imports of energy products will
continue to negatively impact profitability for the Tubular
Products segment in the near term."
Conference Call
The Company will hold its 2012 earnings conference call on
Friday, March 15, 2013 at 8 am PDT. The live call can be accessed
by dialing 1-888-810-4934, passcode NWPIPE. For those unable to
attend the live call, a replay will be available approximately one
hour after the event and will remain available for 30 days by
dialing 1-888-566-0507 passcode 6301.
About Northwest Pipe Company
Northwest Pipe Company manufactures welded steel pipe and other
products in two business groups. Its Water Transmission Group is
the leading supplier of large diameter, high-pressure steel pipe
products that are used primarily for water infrastructure in North
America. Its Tubular Products Group manufactures smaller diameter
steel pipe for a wide range of products including energy,
construction, agriculture and industrial systems. The Company is
headquartered in Vancouver, Washington and has nine manufacturing
facilities across the United States and Mexico.
Forward-Looking Statements
Statements in this press release by Scott Montross are
"forward-looking" statements within the meaning of the Securities
Litigation Reform Act of 1995 and Section 21E of the Exchange Act
that are based on current expectations, estimates and projections
about our business, management's beliefs, and assumptions made by
management. These statements are not guarantees of future
performance and involve risks and uncertainties that are difficult
to predict. Therefore, actual outcomes and results may differ
materially from what is expressed or forecasted in such
forward-looking statements as a result of a variety of important
factors. While it is impossible to identify all such factors, those
that could cause actual results to differ materially from those
estimated by us include changes in demand and market prices for our
products, product mix, bidding activity, the timing of customer
orders and deliveries, production schedules, the price and
availability of raw materials, excess or shortage of production
capacity, international trade policy and regulations and other
risks discussed in our Annual Report on Form 10-K for the year
ended December 31, 2011 and from time to time in our other
Securities and Exchange Commission filings and reports. Such
forward-looking statements speak only as of the date on which they
are made and we do not undertake any obligation to update any
forward-looking statement to reflect events or circumstances after
the date of this release. If we do update or correct one or more
forward-looking statements, investors and others should not
conclude that we will make additional updates or corrections with
respect thereto or with respect to other forward-looking
statements.
                           NORTHWEST PIPE COMPANY
        CONDENSED CONSOLIDATED STATEMENTS OF OPERATIONS (Unaudited)
     (Dollar and share amounts in thousands, except per share amounts)

                                     Three Months Ended    Full Year Ended
                                        December 31,        December 31,
                                     ------------------  ------------------
                                       2012      2011      2012      2011
                                     --------  --------  --------  --------

Net sales:
  Water Transmission                 $ 88,235  $ 61,828  $269,203  $271,885
  Tubular Products                     47,953    55,316   255,300   239,783
                                     --------  --------  --------  --------
    Net sales                         136,188   117,144   524,503   511,668

Cost of sales:
  Water Transmission                   70,713    53,416   224,152   228,703
  Tubular Products                     50,954    52,543   244,153   223,827
                                     --------  --------  --------  --------
    Total cost of sales               121,667   105,959   468,305   452,530

Gross profit:
  Water Transmission                   17,522     8,412    45,051    43,182
  Tubular Products                     (3,001)    2,773    11,147    15,956
                                     --------  --------  --------  --------
    Total gross profit                 14,521    11,185    56,198    59,138

Selling, general, and administrative
 expense                                7,139     6,956    28,638    26,315
                                     --------  --------  --------  --------

Operating income (loss):
  Water Transmission                   15,155     5,963    36,278    34,113
  Tubular Products                     (3,646)    2,158     8,335    12,660
  Corporate                            (4,127)   (3,892)  (17,053)  (13,950)
                                     --------  --------  --------  --------
    Operating income                    7,382     4,229    27,560    32,823

Other expense (income), net               288        (9)      339     1,338
Interest income                           (38)      (72)     (160)      (99)
Interest expense                        1,145     1,866     5,616     9,306
                                     --------  --------  --------  --------

Income before income taxes              5,987     2,444    21,765    22,278

(Benefit from) provision for income
 taxes                                  1,477       977     5,521     9,618
                                     --------  --------  --------  --------

Net income                           $  4,510  $  1,467  $ 16,244  $ 12,660
                                     ========  ========  ========  ========

Basic earnings per share             $   0.48  $   0.16  $   1.73  $   1.36
                                     ========  ========  ========  ========

Diluted earnings per share           $   0.48  $   0.15  $   1.72  $   1.35
                                     ========  ========  ========  ========

Shares used in per share
 calculations:
  Basic                                 9,383     9,353     9,377     9,333
                                     ========  ========  ========  ========
  Diluted                               9,479     9,472     9,445     9,384
                                     ========  ========  ========  ========


                           NORTHWEST PIPE COMPANY
              CONDENSED CONSOLIDATED BALANCE SHEETS (Unaudited)
                        (Dollar amounts in thousands)

                                                           December 31,
                                                      ----------------------
                                                         2012        2011
                                                      ----------  ----------
Assets:
  Cash and cash equivalents                           $       46  $      182
  Trade and other receivables, net                        41,498      69,894
  Costs and estimated earnings in excess of billings
   on uncompleted contracts                               73,314      38,029
  Inventories                                            113,545     107,169
  Other current assets                                     7,735      11,649
                                                      ----------  ----------
  Total current assets                                   236,138     226,923
  Property and equipment, net                            152,545     152,846
  Other assets                                            33,739      33,604
                                                      ----------  ----------
    Total assets                                      $  422,422  $  413,373
                                                      ==========  ==========

Liabilities:
  Current maturities of long-term debt                $    9,009  $    9,072
  Accounts payable                                        21,042      20,248
  Accrued liabilities                                     32,217      19,175
  Billings in excess of cost and estimated earnings
   on uncompleted contracts                                6,478       7,814
                                                      ----------  ----------
  Total current liabilities                               68,746      56,309
  Note payable to financial institution                   47,533      62,000
  Other long-term debt, less current maturities           15,536      24,418
  Other long-term liabilities                             31,175      30,379
                                                      ----------  ----------
    Total liabilities                                    162,990     173,106

Stockholders' equity                                     259,432     240,267
                                                      ----------  ----------
    Total liabilities and stockholders' equity        $  422,422  $  413,373
                                                      ==========  ==========
CONTACT: Robin Gantt Chief Financial Officer 360-397-6250
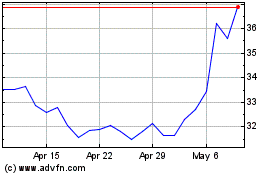
Northwest Pipe (NASDAQ:NWPX)
Historical Stock Chart
From Jun 2024 to Jul 2024

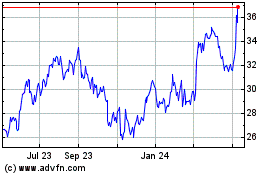
Northwest Pipe (NASDAQ:NWPX)
Historical Stock Chart
From Jul 2023 to Jul 2024
