CME Tops, Margins High - Analyst Blog
November 01 2011 - 10:27AM
Zacks
CME Group Inc. (CME) reported its third quarter
2011 earnings per share of $4.74, modestly ahead of the Zacks
Consensus Estimate of $4.64 but substantially higher than $3.66
reported in the year-ago quarter. Net income surged 29.4% to $316.1
million from the prior-year earnings of $244.3 million. The uptick
was primarily attributable to moderate volume growth and strong
expense management.
CME Group’s total revenue for the reported quarter spiked 19.2%
year over year to $874.2 million. However, it slightly lagged the
Zacks Consensus Estimate of $876 million. The year-over-year
increase was primarily due to a surge in the average daily volumes
across all asset classes, partially offset by lower average rate
per contract.
CME Group’s average daily volume surged 27% year over year to
14.7 million contracts in the reported quarter. However, total
average rate per contract declined 4% from the year-ago quarter to
77.9 cents.
Although volumes constituted mostly of lower-priced financial
products that require higher volume discounts, the relative
stability came from a favourable product and venue mix with growth
coming from energy, metals and agricultural products in
exchange-traded venue.
CME Group’s clearing and transaction fees increased 22.4% to
$732.7 million, driven by higher interest rate volume and revenue
growth across agricultural commodities, energy and metals product
lines.
In addition, revenue earned from market data and information
services increased 5.5% year over year to $107.0 million due to
growth of CME Group Index Services business. Besides, revenue from
access and communication fee increased 6.2% year over year to $12.0
million while other revenues edged up 2.3% year over year to $22.5
million.
Nevertheless, total expenses also climbed up 4.0% year over year
to $302.1 million. As a result, operating margin climbed to 65%
from 60% in the year-ago quarter.
CME Group’s non-operating expense reduced 3.7% year over year to
$26.2 million, primarily owing to interest expense and borrowing
costs of $29.0 million and equity losses of $0.9 million, partially
offset by $3.7 million of investment income.
Financial Update
As of September 30, 2011, CME Group had $875.9 million of cash
and marketable securities, slightly down from $905.4 million as of
December 31, 2010. The company had $2.106 billion in long-term
debt, marginally higher from $2.105 billion at the end of December
31, 2010.
As of September 30, 2011, CME Group had total assets of $38.89
billion (up from $35.05 billion as of December 31, 2010) while
total shareholders equity stood at $20.86 billion (up from $20.06
billion as of December 31, 2010).
Stock Repurchase Update
During the reported quarter, CME Group bought back 5.9 million
of shares for $155 million.
On May 9, 2011, the board of CME Group had announced the
approval and authorization of a new share repurchase program worth
$750 million of common stock, expected to be held in the next 12
months. Following the sanction, the company bought back more than
8.0 million shares so far in 2011.
Guidance
Concurrent with the earnings release, management provided a
revised expenses outlook for 2011. Accordingly, total operating
expense is estimated to be between $1.23 billion and $1.235
billion, putting a lower end to the previous projection of $1.235
billion.
Previously, capital expenditure was projected to be $165 million
in 2011, while the effective tax rate was guided at approximately
42.5% for the second half of 2011.
Furthermore, the company aims to maintain expense growth below
5% in 2012 and beyond.
Dividend Update
On September 26, 2011, the board of CME group paid its quarterly
dividend of $1.40 per share to shareholders of record as on
September 9, 2011.
Peer Take
Yesterday, NASDAQ OMX Group Inc. (NDAQ)
reported its third quarter operating earnings per share of 67
cents, which came in line with the Zacks Consensus Estimate but
modestly ahead of 50 cents in the prior-year quarter. Meanwhile,
another prime peer, NYSE Euronext Inc. (NYX) is
scheduled to release its results before the market opens on
November 3, 2011.
CME GROUP INC (CME): Free Stock Analysis Report
NASDAQ OMX GRP (NDAQ): Free Stock Analysis Report
NYSE EURONEXT (NYX): Free Stock Analysis Report
Zacks Investment Research
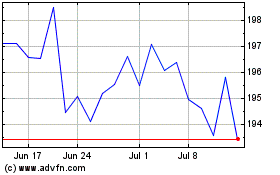
CME (NASDAQ:CME)
Historical Stock Chart
From Jun 2024 to Jul 2024

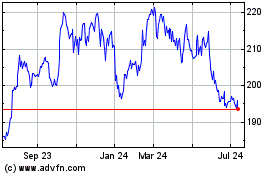
CME (NASDAQ:CME)
Historical Stock Chart
From Jul 2023 to Jul 2024
