CME Group Beats on Revenues - Analyst Blog
April 28 2011 - 1:35PM
Zacks
CME Group Inc. (CME) reported its first quarter
earnings of $292 million or $4.36 per share, way ahead of the Zacks
Consensus Estimate of $4.18. The earnings also surpassed the
prior-year earnings of $240 million or $3.62 per share.
The improved result in the reported quarter was primarily
attributable to strong volumes and robust revenues, which also led
to solid bottom-line results.
The net operating earnings in the first quarter of 2011 excludes
the $164 million benefit within tax expense associated with a
change in the expected effective tax rate and its impact on the
deferred tax expense and the release of reserves related to a
foreign investment.
Including this benefit, net income in the first quarter was $457
million or $6.81 per share, as against $240 million or $3.62 per
share in the prior-year quarter.
CME Group’s total revenue for the reported quarter increased 20%
year over year to $832 million, exceeding the Zacks Consensus
Estimate of $809 million.
The increase was primarily due to a surge in the average daily
volumes across all asset classes. CME Group’s average daily volume
jumped 19% year over year to 13.8 million contracts in the reported
quarter.
However, total average rate per contract decreased 2% from the
year-ago quarter to 80.8 cents. Although record volumes resulted in
larger discounts, the relative stability in the rate per contract
can be attributed to the strength of product mix with strong growth
coming from energy and agricultural products.
CME Group’s clearing and transaction fees were hiked by 20% to
$691 million, driven by higher interest rate volume and record
revenue across agricultural commodities, energy and metals product
lines.
In addition, revenue earned from market data and information
services increased 22% year over year to $107 million and access
and communication fee revenue increased 5.5% year over year to
$11.5 million while other revenues increased 31% year over year to
$21.8 million.
Total expenses increased 10% year over year to $307 million in
the first quarter 2011. CME Group’s non-operating expense was $13
million in the first quarter of 2011, owing to interest expense and
borrowing costs of $30 million, offset by $19 million of investment
income.
Balance Sheet
As of March 31, 2011, CME Group had $719.3 million of cash and
marketable securities, down from $905.4 million as of December 31,
2010. The company had $2.105 billion in long-term debt, marginally
higher from $2.104 billion at the end of December 31, 2010.
As of March 31, 2011, CME Group had assets totaling $34.7
billion (down from $35.0 billion as of December 31, 2010) while
total shareholders’ equity stood at $20.8 billion (down from $20.1
billion as of December 31, 2010).
Dividend Update
In February, 2011, CME Group’s board approved an increase in its
dividend payout policy to approximately 35% of prior year’s cash
earnings from approximately 30%. This would in turn result in an
increase in regular quarterly dividend by 22% from $1.15 per share,
earlier.
The hiked quarterly cash dividend of $1.40 per share was paid on
March 25, 2011 to shareholders of record as on March 10, 2011.
Peer Groups
CME Group’s rival NASDAQ OMX Group Inc. (NDAQ)
has reported its 2011 first quarter operating earnings per share of
61 cents on April 20, a penny higher than the Zacks Consensus
Estimate of 60 cents and significantly higher than the prior-year
quarter earnings of 43 cents.
Another competitor, NYSE Euronext, Inc. (NYX)
will report its first quarter of 2011 earnings on the same day,
while IntercontinentalExchange, Inc. (ICE) is
scheduled to report on May 4.
Our Take
Although operating cash flow remained strong, long-term debt
obligations expose CME Group to financial risk. Additionally,
interest rate volatility and rising competition pose an operational
risk to the company.
Yet we believe that a gradual economic recovery and stable debt
ratings are expected to drive volumes further. Moreover, the
company’s efforts to promote, expand and cross-sell its core
exchange-traded business through meaningful acquisitions, a strong
portfolio along with its global presence will generate decent
growth in the long run.
CME GROUP INC (CME): Free Stock Analysis Report
INTERCONTINENTL (ICE): Free Stock Analysis Report
NASDAQ OMX GRP (NDAQ): Free Stock Analysis Report
NYSE EURONEXT (NYX): Free Stock Analysis Report
Zacks Investment Research
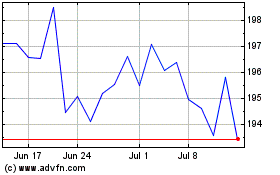
CME (NASDAQ:CME)
Historical Stock Chart
From May 2024 to Jun 2024

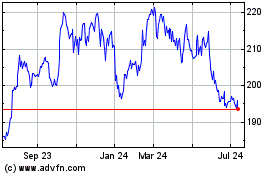
CME (NASDAQ:CME)
Historical Stock Chart
From Jun 2023 to Jun 2024
