Citigroup Down For Fourth Consecutive Day -- Data Talk
March 22 2019 - 2:55PM
Dow Jones News
Citigroup Inc. (C) is currently at $60.80, down $3.11 or
4.87%
-- Would be lowest close since Jan. 14, 2019, when it closed at
$58.93
-- On pace for largest percent decrease since Feb. 5, 2018, when
it fell 4.87%
-- Citigroup has let go of eight equity traders in Hong Kong
following a company review to determine if the bank's financial
interest in stock trades was being properly disclosed to clients,
Bloomberg reported Friday, citing "people familiar with the
matter"
-- Financial stocks were broadly lower Friday, with the sector
headed for a fourth-straight loss, in the wake of the Federal
Reserve's downbeat economic outlook and disappointing eurozone
data, MarketWatch reported
-- Currently down four consecutive days; down 7.78% over this
period
-- Longest losing streak since March 7, 2019, when it fell for
four straight trading days
-- Worst four-day stretch since the four days ending Dec. 24,
2018, when it fell 8.66%
-- Down 4.97% month-to-date
-- Up 16.79% year-to-date
-- Down 89.22% from its all-time closing high of $564.10 on Dec.
27, 2006
-- Traded as low as $60.45; lowest intraday level since Jan. 15,
2019, when it hit $59.55
-- Down 5.41% at today's intraday low; largest intraday percent
decrease since Dec. 6, 2018, when it fell as much as 6.26%
All data as of 2:13:39 PM
Source: Dow Jones Market Data, FactSet
(END) Dow Jones Newswires
March 22, 2019 14:40 ET (18:40 GMT)
Copyright (c) 2019 Dow Jones & Company, Inc.
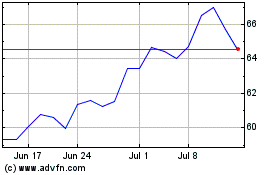
Citigroup (NYSE:C)
Historical Stock Chart
From Apr 2024 to May 2024

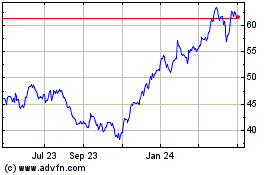
Citigroup (NYSE:C)
Historical Stock Chart
From May 2023 to May 2024
