Merck KGaA's 1Q Sales Decline, Dragged by Currency Headwinds
May 15 2018 - 2:04AM
Dow Jones News
By Donato Paolo Mancini
Merck KGaA (MRK.XE) said Tuesday that despite attaining organic
growth its first-quarter sales declined, dragged down by currency
headwinds.
The company reported a 4.4% sales decline to 3.69 billion euros
($4.41 billion), affected by negative exchange rates. Its net
income decreased to EUR341 million, dropping 35% from EUR523
million in the same period a year earlier.
Earnings before interest, taxes, depreciation and amortization
before one-time items, or Ebitda--an important figure for the
company--were EUR1.01 billion, down from EUR1.24 billion. The
company said favorable one-time effects in its healthcare sector
buoyed numbers from the year before.
According to consensus estimates compiled by FactSet, the
company was expected to post sales of EUR3.70 billion, Ebitda of
EUR998 million and net income of EUR596 million.
Merck said it continues to expect a moderate organic net sales
increase of between 3% and 5% in 2018, with sales in the region of
EUR15 billion to EUR15.5 billion. The planned sale of its
consumer-health business to Procter & Gamble Co. (PG) is likely
to reduce group sales by between EUR900 million-EUR1 billion,
lowering sales estimates to between EUR14 billion and EUR14.5
billion. Ebitda before exceptional items are expected to be between
EUR3.95 billion and EUR4.15 billion.
The Darmstadt, Germany-based multinational's drug pipeline
suffered a series of setbacks. Drug Avelumab, co-developed with
Pfizer Inc. (PFE), didn't deliver in a lung-cancer study, whereas
relapsing multiple sclerosis drug Evobrutinib met a Phase 2 trial
endpoint.
Tepotinib, a cancer drug, received its first regulatory
designation in Japan, with analysts closely watching its potential
to treat a specific sub-population--at least 13,000 individuals in
the U.S.--of lung cancer patients affected by mutation METex14.
Wimal Kapadia, an analyst at Bernstein, sees Novartis AG's
(NOVN.EB) Capmatinib and Pfizer's Xalkori as likely competitors to
the drug.
Write to Donato Paolo Mancini at
donatopaolo.mancini@dowjones.com
(END) Dow Jones Newswires
May 15, 2018 01:49 ET (05:49 GMT)
Copyright (c) 2018 Dow Jones & Company, Inc.
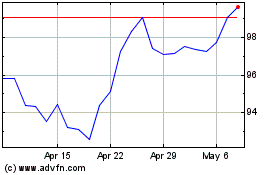
Novartis (NYSE:NVS)
Historical Stock Chart
From Mar 2024 to Apr 2024

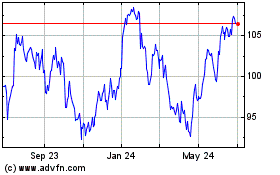
Novartis (NYSE:NVS)
Historical Stock Chart
From Apr 2023 to Apr 2024
