Adobe Data Shows U.K. Retail Sales Drop Following Brexit
September 23 2016 - 5:00AM
Business Wire
Online Pricing Data for August Shows Continued Deflation in
the U.K. and U.S.; Adobe Also Collaborates with U.K.’s Office for
National Statistics (ONS)
Adobe (Nasdaq:ADBE) today announced the release of its monthly
Digital Price Index (DPI) for August. For the first time, Adobe
released online sales and pricing data for TVs, computers and
groceries in the U.K. Prices across categories declined and online
sales for durable goods like computers and TVs dropped sharply
Year-over-Year (YoY). While demand in both categories was up in May
and June YoY - 33.0 and 28.0 percent respectively - growth in July
slowed to 16.0 percent and turned negative in August with a 10.0
percent YoY decrease in sales, likely due to Brexit and other
factors driving uncertainty in Europe. Demand in the U.S. in the
same categories saw strong growth in July and August with 33.7 and
30.2 percent increases, respectively.
As they did in the U.S., prices in the U.K. continued to
decline. The DPI shows 13.4 and 2.7 percent deflation YoY for
computers and groceries respectively, while TVs saw minor deflation
at 0.5 percent YoY. Additionally, London flights and hotel prices
increased slightly and showed signs of stabilization, but remained
much lower than last year. Following two months of consecutive
deflation after the Brexit referendum, London airfares rose 3.1
percent Month-over-Month (MoM) and are down by 1.0 percent YoY.
Hotel prices in London declined a nominal 0.8 percent MoM, but are
down 16.0 percent YoY.
DPI data across specific product categories indicates connected
economies in which prices rise and fall. TVs, computers and other
durable goods saw a 60.0 percent correlation between prices in the
U.K. and U.S. Non-durable goods like groceries, which rely much
less on imports, saw less correlation (20.0 percent) between both
countries. Adobe is collaborating with the Office for National
Statistics (ONS) as part of its effort to develop a global
methodology for the DPI.
Adobe leverages machine learning in Adobe Marketing Cloud to
surface economic insights from billions of data points. By tracking
seven dollars and fifty cents out of every ten dollars spent online
with the top 500 U.S. retailers* and over six dollars out of every
ten dollars spent online with the top 100 European retailers,** the
DPI is able to analyze billions of digital transactions. Adobe is
the first company to conduct a digital-centric analysis based on
real-time access to price-paid data and actual quantities sold.
Unlike other models, Adobe Digital Insights leverages the Fisher
Ideal Price method, which uses actual quantities purchased to
measure inflation and is recognized by leading economists as the
gold standard for the calculation of inflation. To produce the
August DPI, Adobe analyzed 15 billion U.S. website visits, 3
billion U.K. website visits and online transactions for over 2.4
million different products.
“There has been little good, micro-level data on the real
economy in the U.K. to help us understand the impact of the Brexit
vote,” said Austan Goolsbee, professor of economics, The University
of Chicago’s Booth School of Business and former chairman of the
Council of Economic Advisers for President Obama. “The Adobe DPI
data suggest that prices for groceries and electronics did not
change significantly. It will be important to keep monitoring the
data in the months ahead.”
“New data sources such as those being used by Adobe provide
innovative ways to understand our increasingly digital economy in
real time,” said Jonathan Athow, deputy national statistician, U.K.
Office for National Statistics. “Many of these opportunities will
be realised by bringing together independent, official
statisticians and others in the U.K. and across the world who are
using these new data sources and techniques.”
“We may be seeing early signs of hesitancy in spending on
durable goods in the U.K., whereas spending remains stable for
essential goods like groceries,” said Mickey Mericle, vice
president, Marketing and Customer Insights at Adobe. “It will take
time to fully grasp Brexit’s effect on the economy and as we expand
the U.K. data we’re incorporating in the DPI, we expect to uncover
more trends. We are also excited to start working with government
agencies like the ONS to further refine the methodology and surface
more insights.”
U.S. Inflation Data
For electronics, nonprescription drugs, flights and hotels, the
U.S. saw continued deflation MoM. Appliances and furniture saw
seasonal increases MoM - 1.8 percent and 0.2 percent, respectively.
This inflation is likely due to increased demand for back-to-school
and upcoming Labor Day sales. Grocery prices remained stable after
five months of consecutive decline while toys saw price inflation.
Pokémon merchandise saw 4.4 percent inflation MoM., after falling
2.9 percent in July. Demand for Pokémon items increased 227.0
percent YoY since the launch of Pokémon Go (July 6 through August
31).
Latest U.S. findings include:
- Groceries: The DPI reports that
prices were stagnant MoM for groceries after five months of
deflation, with a 0.9 percent decrease YoY. In July, the DPI saw
prices drop 0.8 percent YoY, while the CPI reported a 1.6 percent
deflation during the same time period. DPI data covers 20 to 30
percent of online grocery transactions for approximately 195,000
products, and is heavily comprised of groceries purchased online
picked up in-store.
- Toys: In August, prices for toys
rose 0.3 percent. The DPI showed U.S. prices dropped 6.0 percent
YoY in July, whereas the CPI reported 9.3 percent deflation. Data
contains transactions for approximately 249,000 products, including
toys, games and playground equipment.
- Nonprescription Drugs: Prices
for nonprescription drugs decreased 0.8 percent MoM. While the CPI
reported prices dropped 1.6 percent YoY in July, the DPI saw
inflation of 0.1 percent during the same time period. DPI findings
are based on transactions of 16,000 products.
- Electronics: In August, prices
for electronics continued to decrease. The DPI reported 0.5 percent
deflation MoM and 11.0 percent deflation YoY. The CPI, which does
not break out electronics overall, reported that prices fell 7.7
percent for computers and 20.0 percent YoY for TVs in July. For
that same time period, the DPI saw 12.8 percent deflation for
computers. TV prices dropped 20.2 percent. Data is based on online
transactions of one million electronic products.
- Flights: Domestic airfares
decreased 3.4 percent MoM and 6.2 percent YoY. Internationally,
prices dropped significantly between July and August at 4.3
percent. Additionally, the DPI shows a 1.2 percent inflation YoY.
Data is based on approximately 370,000 flight routes.
- Hotels: Domestic hotel prices
saw 2.1 percent deflation MoM. While the CPI reported no change in
prices YoY in July, the DPI saw a 2.2 percent increase during the
same time period. Internationally, hotels decreased 2.8 percent
YoY. Data is based on approximately 250,000 hotel properties and
includes associated fees.
The Adobe Digital Economy Project August report can be found
here.
About Adobe
Adobe is changing the world through digital experiences. For
more information, visit www.adobe.com.
*Source: Internet Retailer’s 2015 Top 500 eGuide
** Source: Internet Retailer’s 2016 Europe 500
© 2016 Adobe Systems Incorporated. All rights reserved. Adobe
and the Adobe logo are either registered trademarks or trademarks
of Adobe Systems Incorporated in the United States and/or other
countries. All other trademarks are the property of their
respective owners.
View source
version on businesswire.com: http://www.businesswire.com/news/home/20160923005133/en/
AdobeMelissa Chanslor,
415-832-5489chanslor@adobe.comorAdobeStefan Offermann,
408-536-4023sofferma@adobe.com
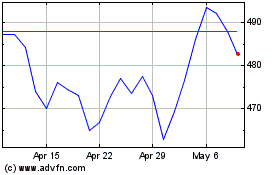
Adobe (NASDAQ:ADBE)
Historical Stock Chart
From Mar 2024 to Apr 2024

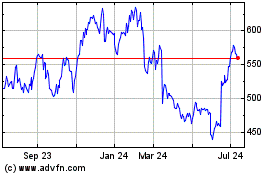
Adobe (NASDAQ:ADBE)
Historical Stock Chart
From Apr 2023 to Apr 2024
