Newmont Mining Cuts Production Guidance Ahead of Indonesian Mine Sale
July 20 2016 - 6:03PM
Dow Jones News
By Maria Armental
Newmont Mining Corp. on Wednesday cut its production guidance
sharply, reflecting the planned sale of its stake in an Indonesian
mine.
The mine -- one of Indonesia's largest copper deposits -- has
been a largely profitable venture for Newmont since it started
commercial operations there in 2000.
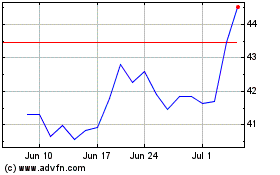
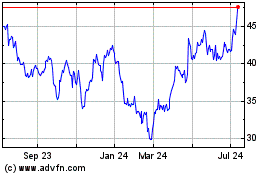
Newmont's stock, the best performer on the S&P 500 this year
by more than doubling in value, rose 1.6% to $39.90 in after-hours
trading as results beat expectations.
The world's second-largest gold miner by production behind
Barrick Gold Corp., Newmont now projects 4.7 million ounces to 5
million ounces this year and 4.9 million ounces to 5.4 million
ounces next year, compared with its previous guidance of 4.8
million ounces to 5.3 million ounces in 2016 and 5.2 million ounces
to 5.7 million ounces in 2017. It affirmed its long-term guidance
through 2020.
The Colorado miner, meanwhile, cut its projected copper output
to a range of 40,000 metric tons and 60,000 metric tons this year
and 40,000 metric tons to 65,000 metric tons in 2017 and 2018. It
had previously projected 120,000 metric tons to 160,000 metric tons
in 2016 and 2017 and 70,000 metric tons to 110,000 metric tons in
2018.
Over all, Newmont reported a quarterly profit of $23 million, or
4 cents a share, compared with $72 million, or 14 cents a share, a
year earlier. Excluding certain items, profit rose to 44 cents a
share from 26 cents.
Revenue rose 6.8% to $2.04 billion.
Analysts surveyed by Thomson Reuters had projected a profit of
29 cents a share on $1.92 billion in revenue.
The average realized gold price rose to $1,260 a troy ounce,
from $1,179 in the year-ago period, while copper fell to $1.94 a
pound, from $2.41 a pound a year earlier.
Newmont's gold production rose to 1.3 million ounces from 1.2
million ounces, while copper output fell to 38,000 metric tons from
42,000 metric tons a year earlier.
Gold prices have rebounded this year as investors turn to
so-called safe-haven assets.
Meanwhile, prices of copper, considered a global economic
barometer because the metal is used widely across manufacturing and
construction, sunk amid an economic slowdown in China, the world's
top copper buyer, and the stronger U.S. dollar.
Most commodities are priced in dollars, making them more
expensive for buyers abroad when the dollar strengthens.
--Sara Schonhardt contributed to this story.
Write to Maria Armental at maria.armental@wsj.com
(END) Dow Jones Newswires
July 20, 2016 17:48 ET (21:48 GMT)
Copyright (c) 2016 Dow Jones & Company, Inc.
Newmont (NYSE:NEM)
Historical Stock Chart
From Aug 2024 to Sep 2024

Newmont (NYSE:NEM)
Historical Stock Chart
From Sep 2023 to Sep 2024
