Major equity indexes traded sideways for most of the week as
earnings and economic data reports flooded the scene. Much to the
bulls’ surprise, steep profit-taking pressures permeated Wall
Street on Thursday, sparking a wave of selling that sent virtually
every asset class tumbling; the S&P 500 Index shed 2% on the
day, effectively erasing all of its prior gains accumulated
throughout the month of July [see also How Well Do Defensive ETFs
Actually Work?].
To help investors keep up with
markets, we present our ETF Scorecard, which takes a step back and
looks at how various asset classes across the globe are performing.
For most of the return comparisons below, we reference trailing
1-week and trailing 1-month returns; this offers a good
insight into the prevailing sentiment in the markets by capturing
the performances across short-term and longer-term time
intervals [for more ETF news and analysis subscribe to
our free newsletter].
Risk Appetite Review
The bears took over this week and selling pressures were the
dominant force; not surprisingly, High Beta led the way lower:
google.load('visualization', '1', {packages: ['corechart']});
function drawVisualization() { // Create and populate the data
table. var data = google.visualization.arrayToDataTable([
['Ticker', '5-Day Return', {role: 'style'}], ['S&P 500 (SPY)',
-2.8, 'blue'], ['Equal Weight (RSP)', -2.81, 'orange'], ['High Beta
(SPHB)', -3.58, 'red'], ['Low Volatility (SPLV)', -3.37, 'green'],
]); var formatter = new google.visualization.NumberFormat( {suffix:
"%"}); formatter.format(data,1); // Create and draw the
visualization. new
google.visualization.BarChart(document.getElementById('visualization102875')).
draw(data, {title:"Comparing Risk Preferences", width:700,
height:400, vAxis: {title: ""}, hAxis: {title: ""}} ); }
google.setOnLoadCallback(drawVisualization);
Major Index Review
The “Risk Off” theme is further evidenced given the negative
performances across the board, with Small Caps being the biggest
losers overall:
google.load('visualization', '1', {packages: ['corechart']});
function drawVisualization() { // Create and populate the data
table. var data = google.visualization.arrayToDataTable([ ['Index',
'1-Week Return', '1-Month Return'], ['S&P 500 (SPY)', -2.8,
-2.58], ['Nasdaq 100 (QQQ)', -2.16, -0.71], ['Dow 30 (DIA)', -3.02,
-2.94], ['Russell 2000 (IWM)', -3.01, -7.2], ['Developed Markets
(EFA)', -2.4, -3.8], ['Emerging Markets (EEM)', -2.54, -0.77], ]);
var formatter = new google.visualization.NumberFormat( {suffix:
"%"}); formatter.format(data,1); formatter.format(data,2); var
options = { title:"Comparing Major Equity Benchmarks", width:700,
height:400, hAxis: {title: ""}, }; // Create and draw the
visualization. new
google.visualization.ColumnChart(document.getElementById('visualization102879')).
draw(data, options); } google.setOnLoadCallback(drawVisualization);
Domestic Sector Review
The Consumer Staples, Energy, and Industrial sectors were the
worst performers over the last five days:
google.load('visualization', '1', {packages: ['corechart']});
function drawVisualization() { // Create and populate the data
table. var data = google.visualization.arrayToDataTable([ ['Index',
'1-Week Return', '1-Month Return'], ['Discretionary (XLY)', -2.49,
-3.2], ['Financials (XLF)', -2.65, -2.73], ['Energy (XLE)', -3.93,
-3.75], ['Utilities (XLU)', -3.58, -2.94], ['Staples (XLP)', -4.07,
-4.32], ['Technology (XLK)', -1.94, 0.13], ['Health Care (XLV)',
-1.85, -2.26], ['Materials (XLB)', -2.74, -2.97], ['Industrials
(XLI)', -3.89, -5.33], ]); var formatter = new
google.visualization.NumberFormat( {suffix: "%"});
formatter.format(data,1); formatter.format(data,2); var options = {
title:"Comparing Sectors", width:700, height:400, hAxis: {title:
""}, colors: ["purple", "limegreen"] }; // Create and draw the
visualization. new
google.visualization.ColumnChart(document.getElementById('visualization102881')).
draw(data, options); } google.setOnLoadCallback(drawVisualization);
Sector Valuations
Sector P/Es dropped across the board, with the Discretionary
sector leading the way lower in terms of contracting valuations:
google.load('visualization', '1', {packages: ['corechart']});
function drawVisualization() { // Create and populate the data
table. var data = google.visualization.arrayToDataTable([ ['Index',
'Last Weeks P/E', 'This Weeks P/E'], ['Discretionary (XLY)', 19.63,
18.5], ['Financials (XLF)', 14.82, 14.75], ['Energy (XLE)', 15.88,
15.64], ['Utilities (XLU)', 16.3, 16.02], ['Staples (XLP)', 18.69,
18.3], ['Technology (XLK)', 16.47, 16.42], ['Health Care (XLV)',
17.44, 17.2], ['Materials (XLB)', 19.14, 18.84], ['Industrials
(XLI)', 17.21, 16.75], ]); // Create and draw the visualization.
new
google.visualization.ColumnChart(document.getElementById('visualization102884')).
draw(data, {title:"Valuation Review: Comparing Sector P/E's",
width:700, height:400, hAxis: {title: ""}} ); }
google.setOnLoadCallback(drawVisualization);
Foreign Equity Review
Chinese equities held their ground best this week while the rest
of the foreign market lineup turned in a negative
performance:
google.load('visualization', '1', {packages: ['corechart']});
function drawVisualization() { // Create and populate the data
table. var data = google.visualization.arrayToDataTable([ ['Index',
'1-Week Return', '1-Month Return'], ['Brazil (EWZ)', -5.77, 1.38],
['Russia (RSX)', -4, -11], ['India (EPI)', -3.78, -5.48], ['China
(FXI)', 0.87, 5.31], ['Japan (EWJ)', -0.74, -1.48], ['Australia
(EWA)', -1.59, 0.19], ['Germany (EWG)', -4.65, -8.04], ['United
Kingdom (EWU)', -2.35, -4.27], ]); var formatter = new
google.visualization.NumberFormat( {suffix: "%"});
formatter.format(data,1); formatter.format(data,2); var options = {
title:"", width:700, height:400, title: "Geographic Review:
Comparing Single Countries", colors: ["green", "orange"] }; //
Create and draw the visualization. new
google.visualization.ColumnChart(document.getElementById('visualization102887')).
draw(data, options); } google.setOnLoadCallback(drawVisualization);
Regional Valuations
Regional P/Es were either flat or dropped lower, with the
ex-U.S. group posting a very small improvement:
google.load('visualization', '1', {packages: ['corechart']});
function drawVisualization() { // Create and populate the data
table. var data = google.visualization.arrayToDataTable([ ['Index',
'Last Weeks P/E', 'This Weeks P/E'], ['United States (SPY)', 16.77,
16.48], ['ex-U.S. (CWI)', 13.98, 14.01], ['Asia Pacific (GMF)',
12.88, 12.94], ['Dev. Europe (FEZ)', 14.45, 14.43], ['Em. Europe
(GUR)', 7.3, 7.1], ['Latin America (GML)', 13.92, 13.8], ['Middle
East & Africa (GAF)', 15.8, 15.77], ]); // Create and draw the
visualization. new
google.visualization.ColumnChart(document.getElementById('visualization102889')).
draw(data, {title:"Valuation Review: Comparing Regional P/E's",
width:700, height:400, hAxis: {title: ""}} ); }
google.setOnLoadCallback(drawVisualization); Alternatives Review
Commodities
Oil prices posted the biggest decline over the last week, while
natural gas prices remain at the bottom of the barrel from a
monthly perspective:
// //
Currencies
The U.S. dollar is the only currency that managed to stay in
positive territory this week, and it’s also the best performer from
a monthly perspective as well:
google.load('visualization', '1', {packages: ['corechart']});
function drawVisualization() { // Create and populate the data
table. var data = google.visualization.arrayToDataTable([ ['Index',
'1-Week Return', '1-Month Return'], [' U.S. Dollar (UUP)', 0.74,
1.64], ['Euro (FXE)', -0.53, -1.61], ['Yen (FXY)', -1.09, -0.67],
['Pound (FXB)', -0.63, -1.58], ['Aussie (FXA)', -1.31, -0.53],
['Emerging Markets (CEW)', -0.68, -0.24], ]); var formatter = new
google.visualization.NumberFormat( {suffix: "%"});
formatter.format(data,1); formatter.format(data,2); var options = {
title:"", width:700, height:400, title: "Comparing Currencies",
colors: ["skyblue", "yellowgreen"] }; // Create and draw the
visualization. new
google.visualization.ColumnChart(document.getElementById('visualization102894')).
draw(data, options); } google.setOnLoadCallback(drawVisualization);
*All data as of market close 7/31/2014.
Follow me on Twitter @Sbojinov
[For more ETF analysis, make sure to sign up for our free
ETF newsletter]
Disclosure: No positions at time of writing.
Click here to read the original article on ETFdb.com.
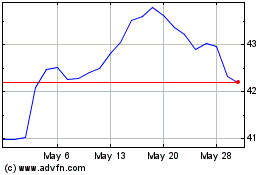
iShares MSCI Emerging Ma... (AMEX:EEM)
Historical Stock Chart
From Mar 2024 to Apr 2024

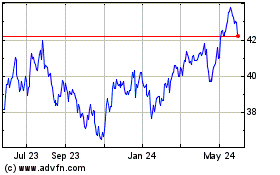
iShares MSCI Emerging Ma... (AMEX:EEM)
Historical Stock Chart
From Apr 2023 to Apr 2024
