The broad U.S. equity markets have seen rough trading over the past
few days as concerns over stretched valuation keep investors away
from the momentum stocks. Some sluggish global economic indicators,
possible interest rates hike in U.S. sooner than expected, Chinese
slowdown, and ongoing turmoil in Russia-Ukraine are adding to the
woes.
In such a challenging situation, several ETFs have easily managed
to hold higher and are currently trending upward. In fact, these
funds actually hit all-time highs, suggesting that these are better
positioned to endure the ups and downs of the current volatile
financial market than the other products (read: 3 Low Beta ETFs for
This Volatile Market).
The winners are not confined to a particular segment or industry
but are spread across many corners of the space. Below, we have
highlighted three funds surging to fresh highs that could be
compelling choices for investors seeking to recycle their exposure
in the equity markets.
iShares High Dividend ETF (HDV)
After fallen out of investors’ favor following the taper talk,
dividend ETFs are gaining increased traction over the past few
weeks. This is because interest rates have actually declined
year-to-date despite the fact that the Fed is curtailing its
monetary stimulus. The 10-year Treasury yield has fallen to 2.62%
currently from 3.03% on April 11 (read: 3 Bond ETFs Surging as
Interest Rates Tumble).
This has resulted in dividend ETFs riding high and HDV becoming an
intriguing option for investors. This ETF tracks the Morningstar
Dividend Yield Focus Index, holding 75 U.S. stocks in its basket
that offers relatively high dividend yields on a consistent basis.
It is a large cap centric fund as 96% of total asset is allocated
to this market cap level.
The product is highly concentrated on the top 10 holdings at 60.36%
of assets with the largest allocation to AT&T (T), Chevron
(CVX), Johnson & Johnson (JNJ). The product is slightly tilted
toward consumer goods at 24.6%, closely followed by healthcare
(20.07%), utilities (13.93%) and communication services
(10.98%).
The fund is among the largest and most popular in the space with
AUM of about $3.5 billion while charging 40 bps in fees per year.
It trades in good volume of more than 342,000 shares a day and
sports a dividend yield of 3.16%. HDV hit its record high of $73.62
per share on Monday, representing a gain of about 10.9% in the past
one-year time frame.
iShares MSCI USA Minimum Volatility ETF (USMV)
Low volatility ETFs appear safe in the current market turbulence.
These generally offer above-average returns while at the same time
protect investors from downside risk. Further, investing in low
volatility stocks may provide some hedge to the portfolio.
This is especially true as USMV recently hit its fresh high of
$36.37 per share, and the fund has moved higher by about 10.8% in
the past one year. The ETF provides exposure to 139 U.S. stocks
having lower volatility characteristics relative to the broader
U.S. equity market. It follows the MSCI USA Minimum Volatility
(USD) Index.
The fund is widely spread across a number of securities as none of
these holds more than 1.94% of assets. The ETF focuses deeply on
large cap securities at 87% of total assets. Further, the product
provides diverse exposure to a number of sectors with healthcare,
consumer staples, information technology, financials and consumer
discretionary accounting for double-digit allocation in the
basket.
USMV is the second largest and a popular ETF in the low volatility
space with AUM of $2.5 billion and average daily volume of around
419,000 shares. The fund is a low cost choice, charging only 15 bps
in annual fees (read: 3 Dirt Cheap Top Ranked ETFs to Buy Now).
First Trust North American Energy Infrastructure Fund
(EMLP)
MLPs are one of the major beneficiaries of the current turmoil in
the financial market as these have solid growth potential and
stable cash flows in addition to attractive yields. Additionally,
the ongoing energy production boom in the U.S. continues to drive
MLP firms higher.
One of the attractive picks in this corner of the broader U.S.
market is EMLP, which surged to all-time high of $25.20,
representing nearly 8% gain over the past one year. EMLP is an
actively managed fund designed to provide exposure to the
securities headquartered or incorporated in the U.S. and Canada and
are engaged in the energy infrastructure sector (read: 3 MLP ETFs
Riding Out Market Volatility).
The ETF has amassed $523 million in its asset base while trades in
moderate volume of roughly 101,0000 shares a day. The fund charges
a higher annual fee of 95 bps from investors. Holding 60 securities
in its basket, the product is concentrated on the top two firms –
Enbridge Energy and Kinder Morgan – with more than 7% share
each.
From a sector look, more than half of the portfolio is allocated to
pipelines while electric power companies round off the top two at
30.4%. The fund has a slight tilt toward large cap stocks with 51%
share while mid and small caps take the remainder.
Bottom Line
Investors should note that while the above-mentioned products have
underperformed the broad market fund (SPY) over the past one year,
these easily crushed the broad fund in the past three months. HDV,
USMV and EMLP added 8.26%, 5.42% and 9.24%, respectively, compared
to a gain of 5.4% for SPY (see: all the Large Cap ETFs here).
These funds would continue to emerge as strong winners as long as
market volatility remains in place or more political issues creep
into the picture.
Want the latest recommendations from Zacks Investment Research?
Today, you can download
7 Best Stocks for the Next 30
Days. Click to get this free report >>
FT-NA EGY INFRA (EMLP): ETF Research Reports
ISHARS-HI DIV (HDV): ETF Research Reports
SPDR-SP 500 TR (SPY): ETF Research Reports
ISHARS-MS US MV (USMV): ETF Research Reports
To read this article on Zacks.com click here.
Zacks Investment Research
Want the latest recommendations from Zacks Investment Research?
Today, you can download 7 Best Stocks for the Next 30 Days. Click
to get this free report
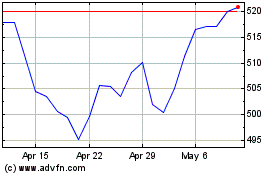
SPDR S&P 500 (AMEX:SPY)
Historical Stock Chart
From Mar 2024 to Apr 2024

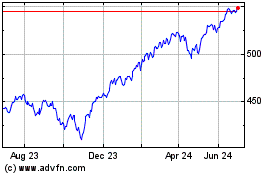
SPDR S&P 500 (AMEX:SPY)
Historical Stock Chart
From Apr 2023 to Apr 2024
