FORM 6-K
UNITED STATES
SECURITIES AND EXCHANGE COMMISSION
Washington, D.C. 20549
Report of Foreign Private Issuer
Pursuant to Rule 13a-16 or 15d-16
of the Securities Exchange Act of 1934
Date: December 4, 2019
Commission File Number 001-31528
| IAMGOLD Corporation |
| (Translation of registrant's name into English) |
| |
| 401 Bay Street Suite 3200, PO Box 153 |
| Toronto, Ontario, Canada M5H 2Y4 |
| Tel: (416) 360-4710 |
| (Address of principal executive offices) |
Indicate by check mark whether the registrant files or will file annual reports under cover Form 20-F or Form 40-F.
|
Form 20-F
|
[ ]
|
Form 40-F
|
[X]
|
Indicate by check mark if the registrant is submitting the Form 6-K in paper as permitted by Regulation S-T Rule 101(b)(1): ____
|
|
Note: Regulation S-T Rule 101(b)(1) only permits the submission in paper of a Form 6-K if submitted solely to provide an attached annual report to security holders.
|
Indicate by check mark if the registrant is submitting the Form 6-K in paper as permitted by Regulation S-T Rule 101(b)(7): ____
|
|
Note: Regulation S-T Rule 101(b)(7) only permits the submission in paper of a Form 6-K if submitted to furnish a report or other document that the registrant foreign private issuer must furnish and make public under the laws of the jurisdiction in which the registrant is incorporated, domiciled or legally organized (the registrant's "home country"), or under the rules of the home country exchange on which the registrant's securities are traded, as long as the report or other document is not a press release, is not required to be and has not been distributed to the registrant's security holders, and, if discussing a material event, has already been the subject of a Form 6-K submission or other Commission filing on EDGAR.
|
Indicate by check mark whether by furnishing the information contained in this Form, the registrant is also thereby furnishing the information to the Commission pursuant to Rule 12g3-2(b) under the Securities Exchange Act of 1934.
If "Yes" is marked, indicate below the file number assigned to the registrant in connection with Rule 12g3-2(b): 82-_
Signatures
Pursuant to the requirements of the Securities Exchange Act of 1934, the registrant has duly caused this report to be signed on its behalf by the undersigned, thereunto duly authorized.
|
|
|
|
|
|
IAMGOLD CORPORATION
|
| |
|
|
|
Date: December 4, 2019
|
By:
|
/s/ Tim Bradburn
|
|
|
Vice President, Legal and Corporate Secretary
|
|
|
|
 |
Val-d'Or Head Office
560, 3e Avenue
Val-d'Or (Québec) J9P 1S4 |
Québec Office
725, boulevard Lebourgneuf
Suite #310-12
Québec (Québec) G2J 0C4 |
Montréal Office
859, boulevard Jean-Paul-Vincent
Suite 201
Longueuil (Québec) J4G 1R3 |
Phone: 819-874-0447
Toll Free: 866-749-8140
Email: info@innovexplo.com
Website: www.innovexplo.com |
| |
NI 43-101 Technical Report and Initial Mineral Resource
Estimate for the Nelligan Project, Québec, Canada |
| |
Prepared for

IAMGOLD Corporation
401 Bay Street, Suite 3200
Toronto, Ontario
Canada M5H 2Y4

Vanstar Mining Resources Inc.
824 Taschereau Blvd.
La Prairie, Québec
Canada J5R 1V9
Project Location
Latitude: 49°23' North; Longitude: 74°40' West
Province of Québec, Canada
|
Prepared by:
|
Alain Carrier, M.Sc., P.Geo.
Vincent Nadeau-Benoit, P.Geo.
Stéphane Faure, PhD, P.Geo.
|
|
InnovExplo Inc.
|
Effective Date: October 22, 2019
Signature Date: December 4, 2019
SIGNATURE PAGE - INNOVEXPLO
NI 43-101 Technical Report and Initial Mineral Resource
Estimate for the Nelligan Project, Québec, Canada
Prepared for
IAMGOLD Corporation
401 Bay Street, Suite 3200
Toronto, Ontario
Canada M5H 2Y4
Vanstar Mining Resources Inc.
824 Taschereau Blvd.
La Prairie, Québec
Canada J5R 1V9
Project Location
Latitude: 49°23' North; Longitude: 74°40' West
Province of Québec, Canada
|
(Original signed and sealed)
|
Signed at Val-d'Or on December 4th, 2019
|
|
Alain Carrier, M.Sc., P.Geo.
InnovExplo Inc.
Val-d'Or (Québec)
|
|
|
|
|
|
(Original signed and sealed)
|
Signed at Val-d'Or on December 4th, 2019
|
|
Vincent Nadeau-Benoit, P.Geo.
InnovExplo Inc.
Val-d'Or (Québec)
|
|
|
|
|
|
(Original signed and sealed)
|
Signed at Longueuil on December 4th, 2019
|
|
Stéphane Faure, PhD, P.Geo.
InnovExplo Inc.
Longueuil (Québec)
|
|
CERTIFICATE OF AUTHOR - ALAIN CARRIER
I, Alain Carrier, M.Sc., P.Geo. (OGQ No. 281, PGO No. 1719, NAPEG No. L2701), do hereby certify that:
1. I am a professional geoscientist, employed as Co-President Founder of InnovExplo Inc., located at 560, 3e Avenue, Val-d'Or, Québec, Canada, J9P 1S4.
2. This certificate applies to the technical report entitled "NI 43-101 Technical Report and Initial Mineral Resource Estimate for the Nelligan Project, Québec, Canada" (the "Technical Report") with an effective date of October 22, 2019, and a signature date of December 4, 2019, prepared for Iamgold Corporation and Vanstar Mining Resources Inc..
3. I am a member in good standing of the Ordre des Géologues du Québec (OGQ licence No. 281), the Association of Professional Geoscientists of Ontario (PGO licence No. 1719), Northwest Territories and Nunavut Association of Professional Engineers and Geoscientists (NAPEG No. L2701), the Canadian Institute of Mines, Metallurgy and Petroleum (CIM 91323), and of the Society of Economic Geologists (SEG 132243). I graduated with a mining technician degree in geology (1989) from Cégep de l'Abitibi-Témiscamingue) and a Bachelor's degree in Geology (1992; B.Sc.) and a Master's in Earth Sciences (1994; M.Sc.) from Université du Québec à Montréal (Montréal, Québec). I initiated a PhD in geology at INRS-Géoressources (Sainte-Foy, Québec) for which I completed the course program but not the thesis.
4. I have practiced my profession continuously as a geologist for a total of twenty-seven (27) years during which time I have been involved in mineral exploration, mine geology, ore control and resource modelling projects for gold, copper, zinc, silver, nickel, lithium, graphite and uranium properties in Canada and internationally.
5. I have read the definition of "qualified person" set out in National Instrument 43-101/Regulation 43-101 ("NI 43-101") and certify that by reason of my education, affiliation with a professional association (as defined in NI 43-101) and past relevant work experience, I fulfill the requirements to be a qualified person for the purposes of NI 43-101.
6. I have visited the Nelligan Project on August 30 and 31, 2018, and on April 10, 2019 for the purpose of this Technical Report.
7. I am the co-author of items 1 to 3, 12, 14 and 25 to 27 of the Technical Report, which I share the responsibility.
8. I have not had prior involvement with the property that is the subject of this Technical Report.
9. I am independent of the issuer in accordance with the application of Section 1.5 of NI 43-101.
10. I have read NI 43-101 and Form 43-101F1, and the sections of the Technical Report for which I am responsible have been prepared in accordance with that instrument and form.
11. I am not aware of any material fact or material change with respect to the subject matter of the Technical Report that is not reflected in the Technical Report, the omission to disclose which makes the Technical Report misleading.
Signed this 4th day of December 2019 in Val d'Or, Québec, Canada.
(Original signed and sealed)
Alain Carrier, M.Sc., P.Geo. (OGQ No. 281)
InnovExplo Inc.
alain.carrier@innovexplo.com
CERTIFICATE OF AUTHOR - VINCENT NADEAU-BENOIT
I, Vincent Nadeau-Benoit, P.Geo. (OGQ No. 1535, NAPEG No. L4154), do hereby certify that:
1. I am a professional geoscientist, employed as Geologist of InnovExplo Inc., located at 560, 3e Avenue, Val-d'Or, Québec, Canada, J9P 1S4.
2. This certificate applies to the technical report entitled "NI 43-101 Technical Report and Initial Mineral Resource Estimate for the Nelligan Project, Québec, Canada" (the "Technical Report") with an effective date of October 22, 2019, and a signature date of December 4, 2019, prepared for Iamgold Corporation and Vanstar Mining Resources Inc..
3. I am a member in good standing of the Ordre des Géologues du Québec (OGQ licence No. 1535) and the Northwest Territories and Nunavut Association of Professional Engineers and Geoscientists (NAPEG No. L4154). I graduated with a Bachelor's degree in Earth and Atmosphere Science (Geology) from Université du Québec à Montréal (Montréal, Québec) in 2010.
4. I have practiced my profession continuously as a geologist for a total of 8 years since graduating from university during which time I have been involved in mineral exploration and mine geology projects for precious and base metal properties in Canada.I acquired my expertise with Royal Nickel Corporation and Glencore.
5. I have read the definition of "qualified person" set out in National Instrument 43-101/Regulation 43-101 ("NI 43-101") and certify that by reason of my education, affiliation with a professional association (as defined in NI 43-101) and past relevant work experience, I fulfill the requirements to be a qualified person for the purposes of NI 43-101.
6. I have visited the Nelligan Project on August 30 to 31, 2018 and on April 10, 2019, specifically for this Technical Report
7. I am the author of items 4 to 6, 9 to 11, 13, 23 and 24 in this Technical Report and co-author of all other items for which I share the responsibility.
8. I have not had prior involvement with the property that is the subject of this Technical Report.
9. I am independent of the issuer in accordance with the application of Section 1.5 of NI 43-101.
10. I have read NI 43-101 and Form 43-101F1, and the sections of the Technical Report for which I am responsible have been prepared in accordance with that instrument and form.
11. I am not aware of any material fact or material change with respect to the subject matter of the Technical Report that is not reflected in the Technical Report, the omission to disclose which makes the Technical Report misleading.
Signed this 4th day of December 2019 in Val d'Or, Québec, Canada.
(Original signed and sealed)
Vincent Nadeau-Benoit, P.Geo. (OGQ No. 1535)
InnovExplo Inc.
vincent.nadeau-benoit@innovexplo.com
CERTIFICATE OF AUTHOR - STÉPHANE FAURE
I, Stéphane Faure, PhD, P.Geo. (OGQ No. 306, PGO No. 2662, NAPEG No. L3536), do hereby certify that:
1. I am a professional geoscientist, employed as Senior Geologist of InnovExplo Inc., located at 859, Boulevard Jean-Paul Vincent, Bureau 201, Longueuil, Québec, Canada, J4G 1R3.
2. This certificate applies to the technical report entitled "NI 43-101 Technical Report and Initial Mineral Resource Estimate for the Nelligan Project, Québec, Canada" (the "Technical Report") with an effective date of October 22, 2019 and a signature date of December 4, 2019, prepared for Iamgold Corporation and Vanstar Mining Resources Inc.
3. I am a member in good standing of the Ordre des Géologues du Québec (OGQ licence No. 306), the Association of Professional Geoscientists of Ontario (PGO licence No. 2662), and the Northwest Territories and Nunavut Association of Professional Engineers and Professional Geoscientists (NAPEG No. L3536). I graduated with a Bachelor of Geology degree from Université du Québec à Montréal (Montréal, Québec) in 1987, a Master's degree in Earth Sciences from Université du Québec à Montréal in 1990 and a PhD degree in Geology from the Institut National de la Recherche Scientifique (Québec City, Québec) in 1995.
4. I have practiced my profession continuously as a geologist for a total of twenty-four (24) years since graduating in 1995. I acquired my expertise in mineral exploration with Inmet Mining in Central America and South America, Cambior Inc. in Canada and numerous exploration companies through the Research Consortium in Mineral Exploration. I have been a geological consultant for InnovExplo Inc. since January 2016.
5. I have read the definition of "qualified person" set out in National Instrument 43-101/Regulation 43-101 ("NI 43-101") and certify that by reason of my education, affiliation with a professional association (as defined in NI 43-101) and past relevant work experience, I fulfill the requirements to be a qualified person for the purposes of NI 43-101.
6. I have visited the Nelligan Project on August 30 and 31, 2018 for the purpose of this Technical Report.
7. I am co-author and share responsibility for items 1 to 3, 7, 8 and 25 to 27 of the Technical Report.
8. I have not had prior involvement with the Property that is the subject of this Technical Report.
9. I am independent of the issuer in accordance with the application of Section 1.5 of NI 43-101.
10. I have read NI 43-101 and Form 43-101F1, and the sections of the Technical Report for which I am responsible have been prepared in accordance with that instrument and form.
11. I am not aware of any material fact or material change with respect to the subject matter of the Technical Report that is not reflected in the Technical Report, the omission to disclose which makes the Technical Report misleading.
Signed this 4th day of December 2019 in Longueuil, Québec, Canada.
(Original signed and sealed)
Stéphane Faure, PhD, P.Geo. (OGQ No. 306)
InnovExplo Inc.
stephane.faure@innovexplo.com
TABLE OF CONTENTS
LIST OF FIGURES
LIST OF TABLES
1. SUMMARY
At the request of IAMGOLD Corporation ("IAMGOLD"), InnovExplo Inc. was retained to prepare a Technical Report to present and support the results of the Initial Mineral Resource Estimate for the Nelligan Project in accordance with Canadian Securities Administrators' National Instrument 43-101 Respecting Standards of Disclosure for Mineral Projects ("NI 43-101") and Form 43-101F1.
The Project is under an earn-in option in a joint agreement between IAMGOLD and Vanstar Mining Resources Inc. ("Vanstar").
The Technical Report is addressed to IAMGOLD and Vanstar ("the issuers") for the purpose of regulatory obligations and public filing on SEDAR.
Property description and ownership
The Project is located in the Nord-du-Québec administrative region in the northwest of the Province of Quebec, Canada.The Project is approximately 45 km south of the town of Chapais, 60 km southwest of the town of Chibougamau and 280 km northeast of the town of Val-d'Or. The approximate centre of the project is at Latitude 49°23'N and Longitude 74°40'W.
The Project comprises the Nelligan (Main and West blocks), Émile and Miron properties and an additional 9 claims, forming a block of 167 active claims covering an aggregate area of 9,356.35 ha. The Project claims are registered 51% to IAMGOLD Inc. and 49% to Vanstar, except for nine (9) claims registered 100% to IAMGOLD.
In 2014, Vanstar and IAMGOLD entered into an option agreement allowing the latter to acquire up to 80% of the Nelligan Property. In 2018, the original agreement was replaced by an Amending Agreement where Vanstar granted IAMGOLD an exclusive and irrevocable first option to acquire an undivided 51% interest in the Project.
Following the exercise of the first option of the Amending Agreement, IAMGOLD holds an option to earn an additional 24% interest in consideration of cash payments, as well as the completion by March 2022 of a 43-101 Mineral Resource Estimate and supporting technical report. If these conditions are met, 50% of the 2% NSR royalty on the original claim of the Nelligan Property will be cancelled by Vanstar.
If IAMGOLD chooses not to earn the additional 24% interest, Vanstar may then redeem its 51% interest in the Project by repaying IAMGOLD the equivalent of the exploration expenses it will have incurred to this day. Once vested to an undivided 75% interest, IAMGOLD will have a further option to earn an additional 5% interest, to hold an 80% interest in the Nelligan project, by completing and delivering a feasibility study. Vanstar would then retain a 20% undivided non-contributory carried interest until the commencement of commercial production, after which: (1) the 20% undivided interest becomes participating; and (2) Vanstar will pay its attributable portion of the total development and construction costs to the commencement of commercial production from 80% of its share of any ongoing distributions from the Joint Venture. Vanstar will also retain a 1% NSR royalty on the original claims of the project.
Geology and mineralization
The Project is located in the Caopatina-Desmaraisville volcano-sedimentary segment of the Abitibi Subprovince of the Archean Superior Province. The main gold mineralization currently known on the Project is hosted in strongly altered sedimentary rocks of the Caopatina Formation and is located within the Nelligan MRE area where four (4) gold zones have been discovered and intersected by numerous drill holes: Dan, Liam, Zone 36 and Renard.
The best gold intervals on the Project have been found in strongly silicified rocks. These silicified and gold mineralized zones are up to 200 m thick. Silica alteration is pervasive and seals the ductile structural fabric, suggesting that the timing of gold mineralization is either syn- to late deformation.
Pyrite is the main sulphide mineral associated with the mineralized zones. It is mainly observed as finely disseminated grains. Gold content is only weakly correlated with pyrite abundance.
Status of the project
The Project is at an early exploration stage with some significant drilling results, known gold occurrences and with a first Mineral Resources statement. The Project is characterized by three main periods of data acquisition: historical (before 2012); Vanstar (2012-2014); and IAMGOLD (since 2015). Overall, the historical period represents very little data. Vanstar increased the exploration and drilling effort on the Project, and the most intensive period of data acquisition was the recent period since IAMGOLD's involvement.
Mineral resource estimates
The main objective of this mandate and supporting report was to prepare the initial mineral resource estimate for the Project, including the Renard, Liam, Dan and 36 zones. The 2019 MRE herein follows CIM Definition Standards for Mineral Resources and Mineral Reserves ("CIM Definition Standards") and was prepared by InnovExplo, using all available information.
The 2019 MRE covers a strike length of 3.5 km and a width of approximately 1.5 km, down to a vertical depth of 500 m below surface. The resource database includes all drill holes completed up to the end of the Winter 2019 drilling program and contains a total of 191 drilled surface holes. Of these 191 drill holes, 176 informed the 2019 MRE.
The mineralized zone model comprises four (4) gold-bearing zones (Dan, Liam, 36 and Renard) subdivided into eleven (11) domains for estimation purposes. The modelled zones were created according to alteration type and intensity, and on gold grade continuity within each zone. A minimum true thickness of 3.0 m was used. Two distinct high-grade domains (Renard-HG inside Renard-1 and Liam-HG inside Liam) were modelled to better constrain higher gold values.
Basic univariate statistics were performed on the overall assay data and on datasets grouped by individual domains. The capping on raw assays consisted of a single top cap of 30 g/t Au for the Renard-HG domain and 15 g/t Au for all other zones and domains. A cap of 2.5 g/t Au was applied to some exceptional sample intervals characterized by very poor recovery and sample lengths exceeding 2.0 m.
The interpolation profiles were customized for the eleven (11) mineralized domains using hard boundaries. The variography study provided the parameters used to interpolate the grade model using capped composites. The interpolation was run on the 3m composite dataset. A cumulative 3-pass search was used for the resource estimate. The ordinary kriging ("OK") method was selected for the final resource estimate as it better honours the raw assays and composites grade distribution for the deposit.
A rounded value of 0.50 g/t Au was selected as the in-pit cut-off grade given the early stage of the project and the few preliminary metallurgical test results for estimating processing cost and mill recovery. The Whittle pit shell used to constrain the 2019 MRE was based only on inferred blocks and was optimized on the basis of a cut-off grade value of 0.50 g/t Au.
InnovExplo is of the opinion that the current mineral resource estimate can be classified as inferred mineral resources based on data density, search ellipsoid criteria, drill hole spacing and interpolation parameters. InnovExplo considers the 2019 MRE to be reliable and based on quality data, reasonable assumptions, and parameters that follow CIM Definition Standards.
Nelligan Project Mineral Resource Estimate at 0.5 g/t cut-off for an open pit mining scenario
| Resource Category |
Zones |
Tonnage (t) |
Grade (g/t Au) |
Gold ounces (oz) |
| Inferred |
Dan |
1,525,000 |
1.00 |
48,900 |
| Liam |
2,939,000 |
1.47 |
139,100 |
| 36 |
809,000 |
0.87 |
22,500 |
| Renard |
91,716,000 |
1.01 |
2,983,400 |
| Total |
96,990,000 |
1.02 |
3,193,900 |
Notes to accompany the Mineral Resource Estimate:
1. The Independent and Qualified Persons for the Mineral Resource Estimate, as defined by NI 43-101, are Alain Carrier, P.Geo., and Vincent Nadeau-Benoit P.Geo., both from InnovExplo Inc., and the effective date is October 2, 2019.
2. These mineral resources are not mineral reserves, as they do not have demonstrated economic viability.
3. The mineral resource estimate follows current CIM definitions and guidelines for mineral resources.
4. The results are presented undiluted and are considered to have reasonable prospects of economic viability.
5. The estimate encompasses four (4) gold-bearing zones (Renard, 36, Liam and Dan), subdivided into 11 subdomains each defined by individual wireframes with a minimum true thickness of 3.0 m, using the grade of the material when assayed or a value of zero when not assayed. The resource was estimated using GEOVIA GEMS 6.8.
6. High-grade capping supported by statistical analysis was done on raw assay data before compositing and established on a per-zone basis. All zones and their subdomains were capped at 15 g/t, except for the High-grade domain of the Renard Zone which was capped at 30 g/t. Raw assays associated with a core recovery below 60% and/or with an interval length of more than 2.0 m were capped at 2.5 g/t.
7. Grade interpolation was performed by Ordinary Kriging on 3.0 m composites from drill hole intersections falling within the mineralized zones in a block model with a block size of 10.0 m by 10.0 m by 10.0 m.
8. Bedrock was assigned a density value of 2.73 g/cm3 corresponding to the mean of SG measurements for the Project. A fixed density value of 2.20 g/cm3 was assigned to highly fractured domains and 2.00 g/cm3 to the overburden.
9. The estimate is categorized as inferred mineral resources. The inferred category is only defined with a minimum of two (2) drill holes in areas where the drill spacing is less than 100 metres and reasonable geological and grade continuity has been demonstrated.
10. The Mineral Resource Estimate is pit-constrained with a bedrock slope angle of 45° and an overburden slope angle of 25°. It is reported at a rounded cut-off grade of 0.50 g/t Au. The cut-off grades were calculated using the following parameters: mining cost = CA$ 3.00; processing cost = CA$ 12.00; G&A = CA$ 2.50; refining and selling costs = CA$ 5.00; gold price = US$ 1,500.00/oz; US$:CA$ exchange rate = 1.1; and mill recovery = 92.0%. The cut-off grades should be re-evaluated in light of future prevailing market conditions (metal prices, exchange rates, mining costs etc.).
11. The number of metric tonnes was rounded to the nearest thousand, following the recommendations in NI 43-101 and any discrepancies in the totals are due to rounding effects. The metal contents are presented in troy ounces (tonnes x grade / 31.10348).
12. InnovExplo Inc. is not aware of any known environmental, permitting, legal, title-related, taxation, socio-political, or marketing issues, or any other relevant issue not reported in the Technical Report, that could materially affect the Mineral Resource Estimate.
Conclusions and recommendations
The objective of InnovExplo's mandate was to present and support an initial mineral resource estimate for the Nelligan Project. This Technical Report and the 2019 MRE results herein meet these objectives.
After conducting a detailed review of all pertinent information and completing the 2019 MRE mandate, InnovExplo concludes the following:
- The database supporting the 2019 MRE is complete, valid and up to date;
- Geological and gold grade continuity has been demonstrated for the four mineralized zones (Dan Zone, Liam Zone, Zone 36 and Renard Zone) and the subdomains;
- The 2019 MRE key parameters (density, capping, compositing, interpolation, search ellipsoid, etc.) are supported by data and statistical and/or geostatistical analysis;
- The 2019 MRE was prepared as a pit-constrained (Whittle optimized pit shell) inferred resource at a cut-off grade of 0.5 g/t;
- Cut-off grades were calculated at a gold price of US$1,500 per troy ounce and an exchange rate of 1.1 USD/CAD, using reasonable mining, processing and G&A costs;
- All blocks were classified as inferred resources. There are no measured or indicated resources;
- The pit-constrained inferred resource is estimated at 96,990,000 tonnes at an average grade of 1.02 g/t Au for a total of 3,193,900 ounces of gold;
- The 2019 MRE is considered to be reliable, thorough, based on quality data, reasonable hypotheses, and parameters compliant with NI 43-101 requirements and CIM Definition Standards;
- Opportunities exist to potentially add additional mineral resources to the Project;
- It is likely that additional in-fill drilling could upgrade some of the inferred resources to the indicated category.
Based on the results of the 2019 MRE, InnovExplo recommends additional exploration and delineation drilling, further geological interpretation, and improvement of the metallurgical characterization to gain a better overall understanding of the risks and opportunities for the Project.
Additional metallurgical testwork will yield a better assessment of the recovery rate and milling cost assumptions in the cut-off grade calculation for a future MRE update and associated optimized pit shell. In particular, InnovExplo recommends documenting the gold recovery rate for different gold grade ranges, from lower to higher grade material, and for different mineralized zones on the Project.
Infill drilling using a regular 50-m drilling grid should be completed to test continuity and potentially convert some of the inferred resources to the indicated category.
Exploration drilling should target the known potential in the western extension of the Renard Zone and the lateral and at-depth extensions of the Liam Zone. Conditional on the success of the drilling programs, some satellite clusters of inferred resources could be connected to the current main volume of inferred resources.
The highly fractured domains and faults could be characterized using borehole televiewer surveys in about ten (10) previously drilled holes in strategic locations. The surveys would improve the structural understanding of the Project and will better constrain the width, extent and in-situ characteristics of the highly fractured domains and faults.
In parallel, InnovExplo also recommends maintaining a pro-active and transparent strategy and communication plan with local communities and First Nations. An environmental baseline study should also be carried out.
In summary, InnovExplo recommends the following two-phase work program:
Phase 1:
- 1A) Pro-active and transparent strategy and communication plan;
- 1B) Additional metallurgical testwork;
- 1C) Conversion and exploration drilling;
- 1D) Acoustic televiewer survey campaign; and
- 1E) MRE update
Phase 2 (conditional on the success of Phase 1):
- 2A) Pro-active and transparent strategy and communication plan;
- 2B) Environmental baseline study;
- 2C) Conversion and exploration drilling; and
- 2D) MRE update and PEA
InnovExplo has prepared a cost estimate for the recommended work program to serve as a guideline for the Project. The budget estimate for the proposed program is presented in Table 26.1. The estimated cost for Phase 1 is C$4,439,000 (incl. 15% for contingencies); the estimated cost for Phase 2 is C$3,070,500 (incl. 15% for contingencies). The grand total is C$7,509,500 for both phases. Phase 2 is contingent upon the success of Phase 1.
2. INTRODUCTION
2.1 Issuers
At the request of Marie-France Bugnon, General Manager Exploration (Americas) of IAMGOLD Corporation ("IAMGOLD"), InnovExplo Inc. ("InnovExplo") was retained to prepare a Technical Report (the "Technical Report") to present and support the results of the Initial Mineral Resource Estimate (the "2019 MRE") for the Nelligan Project (the "Project" or the "Property") in accordance with Canadian Securities Administrators' National Instrument 43-101 Respecting Standards of Disclosure for Mineral Projects ("NI 43-101") and Form 43-101F1.
The Project is under an earn-in option in a joint agreement between IAMGOLD and Vanstar Mining Resources Inc. ("Vanstar"). IAMGOLD holds an undivided 51% interest in the Project following the execution of an Amending Agreement on February 27, 2018, and is the operator of the agreement.
The Technical Report is addressed to IAMGOLD and Vanstar ("the issuers") for the purpose of regulatory obligations and public filing on SEDAR.
IAMGOLD is a mid-tier mining company with four operating gold mines in Canada, South America and West Africa. The corporate headquarters is located at 401 Bay Street, Suite 3200, Toronto, Ontario, M5H 2Y4. IAMGOLD is a Toronto-based public company trading on the Toronto Stock Exchange (TSX) under the symbol IMG since March 19, 1996, and on the New York Stock Exchange (NYSE) under the symbol IAG since December 20, 2005.
Vanstar is a Canadian exploration company with corporate headquarters located at 824 Taschereau Boulevard, La Prairie, Québec, J5R 1V9. Vanstar is trading publicly on the TSX Venture Exchange ("TSXV") under the symbol VSR and on the Frankfurt Exchange under the symbol 1V8.
InnovExplo is an independent mining and exploration consulting firm based in Val-d'Or, Québec.
The 2019 MRE herein follows CIM Definition Standards for Mineral Resources and Mineral Reserves ("CIM Definition Standards").
2.2 Terms of Reference / Basis of the Technical Report
The Project includes all mining titles from the Nelligan, Émile and Miron properties, corresponding to 167 active claims and covering a total area of 9,356.35 ha. The main assets of the Project are four gold mineralized zones: Dan, Liam, 36 and Renard. The Project is located in the Nord-du-Québec administrative region, south of the towns of Chibougamau and Chapais, in the Province of Quebec.
In November 2014, Vanstar and IAMGOLD reached an option agreement allowing the latter to acquire up to 80% of the Nelligan Property subject to certain conditions. In February 2018, the original agreement was replaced by an Amending Agreement in which Vanstar granted IAMGOLD an exclusive and irrevocable first option to acquire an undivided 51% interest in the Nelligan Project which, from that point on, included the Nelligan, Miron and Émile properties, by paying to Vanstar an additional amount of $2,150,000 on the date of the Amending Agreement. Following the exercise of the first option of the Amending Agreement, IAMGOLD may earn an additional 24% interest in return for cash payments totalling $2,750,000 over a 4-year period, as well as the completion by March 2022 of a 43-101 compliant Mineral Resource Estimate and the filing of a supporting technical report.
Initial MRE results were announced by the issuers in a press release on October 22, 2019, for which this Technical Report has been completed.
2.3 Report Responsibility and Qualified Persons
This Technical Report was prepared by Alain Carrier, M.Sc., P.Geo., Co-President Founder of InnovExplo, Vincent Nadeau-Benoit, P.Geo., Project Geologist, and Stéphane Faure, PhD, P.Geo., Geoscience Expert. Each are independent qualified persons ("QPs") as defined by NI 43-101.
Mr. Carrier is a professional geologist in good standing with the Ordre des Géologues du Québec (OGQ No. 281), the Association of Professional Geoscientists of Ontario (PGO No. 1719), and the Northwest Territories and Nunavut Association of Professional Engineers and Geoscientists (NAPEG No. L2701). He is the co-author of items 1 to 3, 12, 14 and 25 to 27 of the Technical Report for which he shares responsibility.
Mr. Nadeau-Benoit is a professional geologist in good standing with the Ordre des Géologues du Québec (OGQ No. 1535) and the Northwest Territories and Nunavut Association of Professional Engineers and Geoscientists (NAPEG No. L4154). He is the author of items 4 to 6, 9 to 11, 13, 23 and 24 in this Technical Report and co-author of all other items for which he shares responsibility.
Mr. Faure is a professional geologist in good standing with the Ordre des Géologues du Québec (OGQ No. 306), the Association of Professional Geoscientists of Ontario (PGO No. 2662) and the Northwest Territories and Nunavut Association of Professional Engineers and Geoscientists (NAPEG No. L3536). He is the co-author of items 1 to 3, 7, 8 and 25 to 27 of the Technical Report for which he shares responsibility.
2.4 Site visits
Alain Carrier, Stéphane Faure and Vincent Nadeau-Benoit of InnovExplo visited the Project on August 30 to 31, 2018, as part of the current mandate. They visited the two (2) logging facilities and the core storage facilities at Chibougamau during the on-going campaign. They also reviewed drill sites and collar locations in the field. Their visit also included a review of selected core intervals and an independent resampling program, as well as a review of assay results, the QA/QC program, and the descriptions of lithologies, alteration, mineralization and structures.
A second site visit was conducted by Alain Carrier and Vincent Nadeau-Benoit on April 10, 2019, in order to review additional results from the 2019 drilling program.
2.5 Effective Date
The close-out date of the mineral resource database is July 23, 2019.
The effective date of the 2019 MRE is October 22, 2019.
The effective date and signature date of this Technical Report is October 22, 2019, and December 4, 2019, respectively.
2.6 Sources of Information
The documentation listed in items 3 and 27 were used to support this Technical Report. Excerpts or summaries from documents authored by other consultants are indicated in the text.
The authors' assessment of the Project was based on published material in addition to data, professional opinions and unpublished material submitted by the issuer. The author reviewed all relevant information provided by the issuer and/or by its agents.
The author also consulted other sources of information, mainly the Government of Québec's online claim management and assessment work databases (GESTIM and SIGEOM, respectively), as well as the issuers' technical reports, annual information forms, MD&A reports and press releases published on SEDAR (www.sedar.com).
The author reviewed and appraised the information used to prepare this Technical Report, including the conclusions and recommendations, and believe that such information is valid and appropriate considering the status of the project and the purpose for which this Technical Report is prepared. The authors have fully researched and documented the conclusions and recommendations made in this Technical Report.
2.7 Currency, Units of Measure, and Acronyms
A list of acronyms and a list of units used in this report are provided in Table 2.1 and Table 2.2. All currency amounts are stated in Canadian Dollars ($, C$, CAD) or US dollars (US$, USD). Quantities are stated in metric units, as per standard Canadian and international practice, including metric tons (tonnes, t) and kilograms (kg) for weight, kilometres (km) or metres (m) for distance, hectares (ha) for area, percentage (%) for copper and nickel grades, and gram per metric ton (g/t) for precious metal grades. Wherever applicable, imperial units have been converted to the International System of Units (SI units) for consistency (Table 2.3).
Table 2.1 - List of Acronyms
| Acronyms |
Term |
| 43-101 |
National Instrument 43-101 (Regulation 43-101 in Québec) |
| C$:US$ |
Canadian-American exchange rate |
| CIM |
Canadian Institute of Mining, Metallurgy and Petroleum |
| CIM Definition Standards |
CIM Definition Standards for Mineral Resources and Mineral Reserves |
| CoG |
cut-off grade |
| CRM |
Certified reference material |
| CSA |
Canadian Securities Administrators |
| CV |
Coefficient of variation |
| DDH |
Diamond drill hole |
| ECCC |
Environment and Climate Change Canada |
| Acronyms |
Term |
| G&A |
General and administration |
| GESTIM |
Gestion des titres miniers (the MERN's online claim management system) |
| ID2 |
Inverse distance squared |
| ISO |
International Organization for Standardization |
| MERN |
Ministère de l'Énergie et des Ressources Naturelles du Québec (Québec's Ministry of Energy and Natural Resources) |
| mesh |
US mesh |
| MRC |
Municipalité régionale de comté (Regional county municipality in English) |
| MRE |
Mineral resource estimate |
| MRN |
Former name of MERN |
| n/a |
Not applicable |
| N/A |
Not available |
| NAD 83 |
North American Datum of 1983 |
| nd |
Not determined |
| NI 43-101 |
National Instrument 43-101 (Regulation 43-101 in Québec) |
| NN |
Nearest neighbour |
| NRC |
Natural Resources Canada |
| NSR |
Net smelter return |
| NTS |
National Topographic System |
| OK |
Ordinary kriging |
| QA |
Quality assurance |
| QA/QC |
Quality assurance/quality control |
| QC |
Quality control |
| QP |
Qualified person (as defined in National Instrument 43-101) |
| Regulation 43-101 |
National Instrument 43-101 (name in Québec) |
| RQD |
Rock quality designation |
| SCC |
Standards Council of Canada |
| SD |
Standard deviation |
| SG |
Specific gravity |
| SIGÉOM |
Système d'information géominière (the MERN's online spatial reference geomining information system) |
| UTM |
Universal Transverse Mercator coordinate system |
Table 2.2 - List of units
| Symbol |
Unit |
| % |
Percent |
| $, C$ |
Canadian dollar |
| Symbol |
Unit |
| $/t |
Dollars per metric ton |
| ° |
Angular degree |
| °C |
Degree Celsius |
| μm |
Micron (micrometre) |
| cm |
Centimetre |
| cm3 |
Cubic centimetre |
| ft |
Foot (12 inches) |
| g |
Gram |
| Ga |
Billion years |
| g/cm3 |
Gram per cubic centimetre |
| g/t |
Gram per metric ton (tonne) |
| h |
Hour (60 minutes) |
| ha |
Hectare |
| k |
Thousand (000) |
| kg |
Kilogram |
| km |
Kilometre |
| L |
Litre |
| lb |
Pound |
| M |
Million |
| m |
Metre |
| m3 |
Cubic metre |
| Mtpa |
Million ton per year (annum) |
| Ma |
Million years (annum) |
| masl |
Metres above mean sea level |
| mm |
Millimetre |
| Moz |
Million (troy) ounces |
| Mt |
Million metric tons |
| oz |
Troy ounce |
| oz/t |
Ounce (troy) per short ton (2,000 lbs) |
| ppb |
Parts per billion |
| ppm |
Parts per million |
| t |
Metric tonne (1,000 kg) |
| ton |
Short ton (2,000 lbs) |
| US$ |
American dollar |
| wt% |
Weight percent |
| y |
Year (365 days) |
| yd3 |
Cubic yard |
Table 2.3 - Conversion Factors for Measurements
| Imperial Unit |
Multiplied by |
Metric Unit |
| 1 inch |
25.4 |
mm |
| 1 foot |
0.3048 |
m |
| 1 acre |
0.405 |
ha |
| 1 ounce (troy) |
31.1035 |
g |
| 1 pound (avdp) |
0.4535 |
kg |
| 1 ton (short) |
0.9072 |
t |
| 1 ounce (troy) / ton (short) |
34.2857 |
g/t |
3. RELIANCE ON OTHER EXPERTS
This Technical Report has been prepared by InnovExplo at the request of IAMGOLD and addressed to both issuers.
The QPs relied on the following people or sources of information during the preparation of this Technical Report:
- In addition to technical information, IAMGOLD also supplied information on mining titles, option agreements, royalty agreements, environmental liabilities, permits, social acceptability and First Nations. InnovExplo verified the status of the mining titles online and consulted the information provided by IAMGOLD as well as public sources of relevant technical information. InnovExplo is not qualified to express any legal opinion with respect to property titles, current ownership or possible litigation;
- Simon Boudreau, P.Eng., of InnovExplo, provided the parameters used to calculate the official cut-off grade and pit shell for the initial MRE; and
- Venetia Bodycomb, M.Sc., of Vee Geoservices, provided critical and linguistic editing of a draft version of this Technical Report.
InnovExplo would like to acknowledge the support and collaboration provided by IAMGOLD personnel for this assignment. In particular, InnovExplo would like to acknowledge the contribution of Mrs Shana Dickenson, Senior Geologist at the Val-d'Or Exploration office of IAMGOLD, and Mrs Coraline Crozier, Project Geologist on the Nelligan Project. Their collaboration was greatly appreciated and instrumental to the success of this assignment.
In addition, InnovExplo has relied on information provided in an internal memorandum written by Mrs. Martine Deshaies, Corporate Metallurgist for IAMGOLD Corporation, for Section 13 of this report.
4. PROPERTY DESCRIPTION AND LOCATION
4.1 Location
The Project is located in the Nord-du-Québec administrative region in the Province of Quebec, Canada (Figure 4.1). The Project is approximately 45 km south of the town of Chapais, 60 km southwest of the town of Chibougamau and 280 km northeast of the town of Val-d'Or. It is located on map sheet 32G/07 in the townships of Hazeur and Gamache. The approximate centre of the project is at Latitude 49°23'N and Longitude 74°40'W (UTM coordinates 5470953mN and 523819mE, NAD 83, Zone 18).
4.2 Claim Status
The Project comprises the Nelligan, Émile and Miron properties and additional claims, forming a block of 167 active claims staked by electronic map designation covering an aggregate area of 9,356.35 ha (Figure 4.2).
Claim status was supplied by Marie-France Bugnon, General Manager Exploration (Americas) of IAMGOLD Corporation. The status of all claims was verified using GESTIM, the government's online claim management system available at the following website address: gestim.mines.gouv.qc.ca.
InnovExplo has not performed an independent verification of the legality of any underlying agreement(s) that may exist concerning the claims or other agreement(s) between third parties but has relied on information provided by Marie-France Bugnon, General Manager Exploration (Americas) of IAMGOLD Corporation who has validated the information provided in Section 4.3.
According to GESTIM, the Project claims are registered 51% to IAMGOLD Corporation Inc. and 49% to Vanstar Mining Ressources Inc., except for seven (7) contiguous claims at the southern boundary of the Property and two (2) contiguous isolated claims registered 100% to IAMGOLD Corporation.
The mining claims are subject to terms under several agreements as described in the following sections.
A detailed list of mining titles, ownership and royalties is provided in Appendix I and illustrated on Figure 4.2.
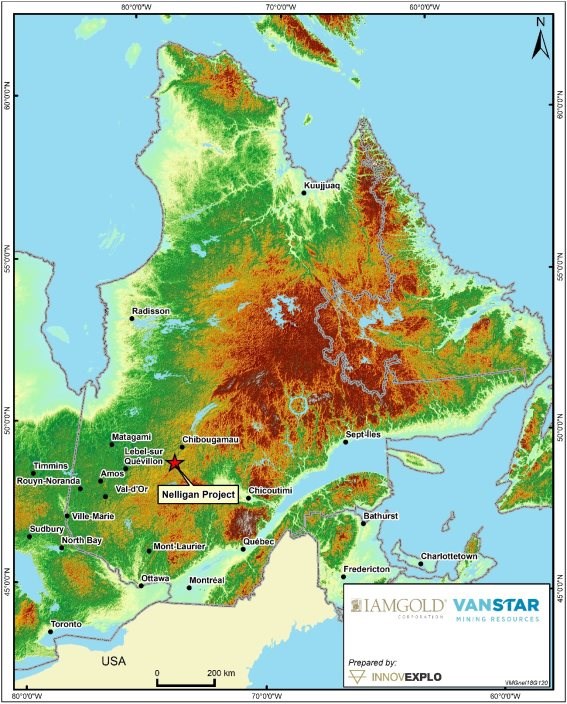
Figure 4.1 - Location of the Nelligan Project in the Province of Quebec

Figure 4.2 - Claim map for the Nelligan Project as of December 4, 2019
4.2.1 Nelligan Property
In September 2010, Vanstar Mining Resources Inc. ("Vanstar") signed an agreement to acquire 12 claims of the Nelligan Property from two independent prospectors and referred as Nelligan-Philibert, in consideration of a cash payment of $4,160 and the issue of 225,000 common shares, valued at $42,750. In 2012, 52 of the 92 originally acquired claims were not renewed when they expired. The vendors have retained a 2% NSR royalty from which 1% can be purchased for an amount of C$1.0M. An additional 80 claims were acquired by Vanstar by map designation to form the original Nelligan project.
During 2012, 52 of the 92 claims acquired originally were not renewed when they expired.
In 2013, 35 claims were acquired by Vanstar by map designation and 23 claims were acquired for 350,000 common shares of Vanstar to be issued, valued at $30,750. No royalty was retained.
On January 13, 2014, four (4) of the twelve (12) original claims were sold by Vanstar to Stellar Africagold. On May 28, 2014, Vanstar acquired four (4) claims for a cash consideration of $2,000 and 60,000 common shares of Vanstar valued at $5,400. On June 30, 2014, Vanstar acquired nine (9) claims for a cash consideration of $4,500 and the issuance of 80,000 common shares valued at $8,000. No royalty was retained.
During 2015, 23 claims were not renewed as agreed between Vanstar and IAMGOLD.
In February 2017, Vanstar signed an agreement with the original prospectors to re-purchase their 2% NSR royalty granted on the remaining 8 claims acquired originally in 2010, in exchange for the issuance in their favour of 1,200,000 common shares of Vanstar valued at $72,000 and a payment of $75,000. In May 2017, this agreement was amended so that the cash payment of $75,000 was replaced by the issue of two convertible debentures of $37,500 for a 36-month term bearing interest at the rate of 10% per year.
The Nelligan property currently comprises 84 active claims in two blocks of contiguous claims and covering a total surface area of 4,705.40 ha.
4.2.2 Émile Property
In November 2014, Vanstar signed an agreement to acquire 100% of the Émile Property, consisting of 13 claims, in exchange for the issue of 400,000 common shares valued at $22,000. In February 2015, Vanstar acquired five (5) additional claims by map designation.
In May 2016, Vanstar acquired a 100% interest in 33 claims, which were included in the Émile Property, in consideration of 1,000,000 common shares, valued at $60,000. Of those a bloc of 21 claims is subject to a 1% NSR Royalty.
In June 2016, Vanstar acquired nine (9) additional claims through map designation.
The Émile property currently comprises one block of 60 contiguous active claims covering a total surface area of 3,361.91 ha.
4.2.3 Miron Property
The Miron Property, acquired through map designation by Vanstar in April 2015, was originally composed of six (6) claims located along the western edge of the Nelligan Property.
In October 2016, Vanstar acquired one (1) additional claim through map designation and in 2017 they acquired seven (7) additional claims by map designation.
The Miron property currently comprises one block of 14 contiguous active claims covering a total surface area of 784.40 ha.
4.2.4 IAMGOLD Claims
In December 2016 and June 2018, IAMGOLD has also acquired nine additional claims by map designation, seven located at the southern border of the Émile property, and two forming an isolated block located further south of the Émile property.
The IAMGOLD claims currently comprise two blocks of claims covering a total surface area of 504.64 ha.
4.3 IAMGOLD-Vanstar Agreement
On November 17, 2014, Vanstar and IAMGOLD entered into an option agreement allowing the latter to acquire up to 80% of the Nelligan Property subject to certain conditions. The agreement specified that IAMGOLD could earn an initial interest of 50% on ownership by making instalment payments of $500,000 and incurring $4,000,000 in exploration expenditures over a period of four and a half years (4.5 years). In addition, IAMGOLD could earn an additional 25% to 30% interest by conducting pre-feasibility and feasibility studies and making additional cash payments of $500,000.
On February 22, 2018, the original agreement was replaced by an Amending Agreement where Vanstar granted IAMGOLD an exclusive and irrevocable first option to acquire an undivided 51% interest in the Nelligan Project which, from that point on, includes the Nelligan, Miron and Émile properties, by paying to Vanstar an additional amount of $2,150,000 on the date of the Amending Agreement.
Following the exercise of the first option of the Amending Agreement, IAMGOLD may earn an additional 24% interest in consideration of cash payments totalling $2,750,000 over a 4-year period, as well as the completion by March 2022 of a 43-101 compliant Mineral Resource Estimate and the filing of a supporting technical report. The $2,750,000 sum will be paid out in three (3) annual payments of $400,000 and a final amount of $1,550,000 on or before the 4th anniversary of the acquisition of the 51% interest. If these conditions are met, 50% of the 2% NSR royalty on the original claim cells of the Nelligan Property acquired from the original owners in February 2017 will be cancelled by Vanstar.
If IAMGOLD chooses not to earn the additional 24% interest, Vanstar may then redeem its 51% interest in the Project by repaying IAMGOLD the equivalent of the exploration expenses it will have incurred to this day.
Once vested to an undivided 75% interest, IAMGOLD will have a further option to earn an additional 5% interest, to hold an 80% interest in the Nelligan project, by completing and delivering a feasibility study. Vanstar would then retain a 20% undivided non-contributory carried interest until the commencement of commercial production, after which: (1) the 20% undivided interest becomes participating; and (2) Vanstar will pay its attributable portion of the total development and construction costs to the commencement of commercial production from 80% of its share of any ongoing distributions from the Joint Venture. Vanstar will also retain a 1% NSR royalty on the original claims of the project.
4.4 Permits and Environment
IAMGOLD has the required permits to execute the drilling and stripping programs.
InnovExplo is not aware of any environmental liabilities with respect to the Project.
4.5 Communication and Consultation with the Community
The Project is located in Eeyou Istchee James Bay territory on Category III lands belonging to the Government of Québec and is subject to the James Bay and Northern Quebec Agreement. Mineral exploration is allowed under specific conditions. The issuers shall be submitted to the Environmental Regime, which takes into account the Hunting, Fishing and Trapping Regime. On Category III lands, Eeyou Istchee peoples have exclusive rights to harvest certain species of wildlife and to conduct trapping activities. Each hunting area has a tallyman. The issuers had, from time to time, communicated with the regional level of government and the Cree Nation Government on these matters.
5. ACCESSIBILITY, CLIMATE, LOCAL RESOURCES, INFRASTRUCTURE AND PHYSIOGRAPHY
5.1 Accessibility
The Project is located in the Nord-du-Québec administrative region, which comprises the northern part of the province of Quebec, Canada. The Project is approximately 45 km south of the town of Chapais, 60 km southwest of the town of Chibougamau and 280 km northeast of the town of Val-d'Or. As shown in Figure 5.1, the Project is located south of Caopatina Lake and is accessible by taking Highway 113 from Chapais or Chibougamau and then taking the Barette-Sud (R1009) logging road and a series of smaller logging roads. From Chapais, it is an 85-km drive taking approximately 90 minutes.
Mining and drilling operations may be carried out year-round with some limitations in specific areas of the Project, but surface exploration work (mapping, channel sampling) should be planned from mid-May to mid-October. Lakes are usually frozen and suitable for drilling from January to April. Conditions may be difficult when the snow melts in May and for a few weeks during moose hunting season in the fall.
5.2 Climate
The Project area has a subarctic climate, despite its position below latitude 50°. Winters are long, cold and snowy, and summers are short, warm and mild. According to Environment Canada (climat.meteo.gc.ca/climate_normals), statistics for the town of Chapais during the 1981-2010 period show a daily average temperature for July of 16.4°C and a daily average temperature for January of -18.8°C. The record low was -43.3°C, and the record high was 35°C. Overall, precipitation is high for a subarctic climate with an average annual precipitation of 996 mm, and 313 cm of snow in the winter season, which runs from October to May with a peak from November to March. There are, on average, 231 days without frost. Precipitation is considerable year-round, although February through April are drier. Climatic conditions do not seriously hinder exploration or mining activities, with only some seasonal adjustments for certain types of work (e.g., conducting mapping in summer and drilling boggy areas in winter).
5.3 Local Resources and Infrastructure
Social and health services, as well as services related to the mining industry, can be found in the towns of Chibougamau and Chapais or in the community of Oujé-Bougoumou (Figure 5.1). Qualified personnel can be found throughout the region. Chibougamau has a population of approximately 7,500, Chapais 1,500, and Oujé-Bougoumou 740 (Canada Census, 2016). These localities have quarry-specific equipment, and workers specialized in quarrying. The Project area is well serviced by exploration and mining industries, Chibougamau and Chapais are former mining towns with approximately 60 years of mining history.
Mobile connections, electricity, railroads and other services are found within 50 km of the project. The Chibougamau/Chapais Airport is located 20 km southwest of Chibougamau or about halfway to Chapais along Highway 113. A high voltage line crosses the Property on the eastern side. Water is readily available from the many creeks and lakes found on the Project.
IAMGOLD uses two core logging and storage facilities situated in the town of Chibougamau. There is no permanent infrastructure on the Property.

Figure 5.1 - Map showing access to the Nelligan Property
5.4 Physiography
Based on the vegetation zones map of Quebec, the Project lies within the boreal zone and the continuous boreal forest subzone. Forest cover consists of various types of broad-leaved trees and conifers dominated by birch, black spruce and larch in wet areas. The forest has been harvested over most of the Project. Fauna is typical for this type of forest, with moose, black bears, foxes, partridges, hares, beavers and numerous small mammals. The region is fairly flat with the presence of numerous lakes and wetlands and drainage is generally poor throughout the area. The approximate elevation of the Project varies from 381 to 411 masl. The Project is covered by thick glacial deposits. Outcrop exposure on the Project is poor.
6. HISTORY
This review summarizes all work and activities completed prior to 2017. Historical information (prior to December 2014) is mainly based on information from the MERN's SIGEOM database (sigeom.mrnf.gouv.qc.ca), whereas information for the period from December 2014 to 2017 was obtained from IAMGOLD.
Because no technical reports have been published to date, the information for the period from January 2017 to December 2018 will be considered as "current" and will be presented in items 9 and 10 of this report.
The following sections summarize all historical work by period, such as geophysical surveys, mapping, trenching, rock and soil sampling, as well as drilling for each area of interest on the Property. Table 6.1 summarizes the historical work done in the area of the Nelligan Project between 1977 and 2016.
6.1 1950 to 1967
The first documented work on the Project was in 1951 by Wright-Hargreaves Mines Limited and Paymaster. Prospecting, mapping and geophysical work were conducted after gold was discovered in the Joe Mann deposit, 18 km ENE of the Project. The Joe Mann discovery (historical production of 1.08 M oz of gold and 22.5 M lb of copper from 1956 to 2003) sparked great interest in the Chibougamau-Chapais area (Harris, 1951; Low, 1951), but significant exploration work did not occur until the late 1960s.
In 1952, the first local Mag survey was performed by Kerromac Mining Co. Ltd in Hazeur Township, as well as detailed prospecting and exploration work on a portion of the Project.
In 1958, subsequent geophysical Mag and EM surveys were completed by New Jersey Zinc, leading to the first trenching on the Project in 1959 (Low, 1951).
In 1964, iron prospecting by McAdam and Flanagan took place after the publication of the Lac Surprise aeromagnetic survey over the Gamache and Hazeur townships. Detailed geophysical work targeted aeromagnetic anomalies. In 1965, a 152-m hole was drilled, yielding poor results for iron prospects, and McAdam and Flanagan performed no further work (Duquette, 1965).
The authors of various reports during this period mentioned the difficulties caused by the thick overburden cover and sparse outcrops.
6.2 1977 to 1986
In 1977, Falconbridge Nickel Mines conducted EM surveys with horizontal loops using a 300 to 400 ft cable combined with a Mag survey. A gravity survey was performed the next year to refine potential targets. In 1978, nine (9) holes were drilled for 2,409 ft on different geophysical anomalies. One of the holes (777-5) was drilled on the Project (Lavoie, 1977; Lavoie, 1978; Simoneau et al., 1978).
From 1978 to 1982, Patino Mines Limited conducted some geological and geophysical surveys (HEM, Mag and Max-Min) (Larivière, 1982; Murdy, 1978; Kennedy, 1983; Kennedy, 1984).
From 1983 to 1984, SOQUEM conducted geophysical surveys (HEM, Mag, PP), prospecting, drilling and boulder prospecting (Thériault, 1984). In 1986, Société d'Exploration Minière Pontiac and SOQUEM performed a variety of work in the area, including overburden stripping, boulder sampling and prospecting, which led to the discovery of the Tour de Feu showing (2.2 g/t Au) in the northeast part of the Project (Grenier, 1986).
6.3 1987 to 1996
From 1987 to 1988, SOQUEM continued its fieldwork with mapping, trenching and drilling. A total of 17 holes were drilled for 1,910 m (DDH 87-01 to 88-17), 13 of which were on the Project (Miron,1988). SOQUEM compiled the geophysical reports and performed a heliborne combined Mag, EM and VLF survey over the Lac Surprise area, covering part of the Project (De Carle, 1987; Hubert, 1988).
In 1988, Exploration Muscocho performed a gradiometer survey and drilled 13 holes. They also conducted a biochemical survey on their Hazeur iron property in the same year (Brodie-Brown and Zuiderveen, 1988). Exploration Noramco drilled seven (7) holes (Tremblay, 1988). In 1989, Abbey Exploration carried out several geophysical surveys on the Project (Killin, 1989).
In 1994, 2736-1179 Quebec Inc. conducted a drilling program consisting of four (4) holes for 1,213 m, two (2) of which were drilled on the Project (AD-94-1, D 1-94) but neither yielded significant results (Fournier, 1994). From 1994 to 1996, SOQUEM and Ressources Unifiées Oasis Inc., both part of the Syndicat du Beep Mat, completed work as contractors while the property was optioned by a group comprising Pontiac Exploration Inc., Ressources Abbey and R.W. Metcalfe. An extensive Beep Mat survey was performed. Eighteen (18) holes were drilled for 1,557 m (1138-94-01, 1138-94-04 to 1138-94-20), four (4) of which were on the Project (De Chavigny, 1994). An additional 19 holes were drilled in 1995, 10 of which were on the Project (Chainey, 1995a;1995b; 1995c; 1995d 1996a). In 1996, Ressources Unifiées Oasis Inc. conducted a till sampling program in the northwestern part of the Project (Chainey, 1996b).
6.4 2012 to 2016
In 2012, Vanstar carried out a drilling program on the Lac d'Eu showing for a total of 11 holes totalling 1,968 m (Tazerout, 2012a; 2012b).
In 2013, following the results of a detailed geophysical survey (ground magnetic; Lambert, 2013), compilation and interpretation, Vanstar developed new drill targets which has led to the discoveries of Liam (hole NE-13-04) and Mila zones (hole NE-13-01). In 2013-2014, additional drilling was completed on those gold discoveries demonstrating the continuity of the Liam zone and allowing the additional gold discoveries of Dan and 36 zones. During the 2013-2014 period , Vanstar drilled 24 holes for a total of 3,806 m (Lambert, 2014; Kelly, 2014a, 2014b; Boivin, 2014). In 2014, Vanstar and IAMGOLD concluded an option agreement on the Project.
From 2014 to 2016, IAMGOLD drilled 29 holes for a total of 9,879 m on the Liam, Dan, and 36 zones which has also led to the discovery of the Renard Zone. IAMGOLD also conducted field mapping and prospecting in the summer of 2015 and different geophysical surveys (PP, resistivity and EM) over the summers of 2015 and 2016 (Gauthier, 2015).
Table 6.1 - Historical work carried out on the Nelligan Project
| Year |
Company |
Type of work |
Areas of interest |
| 1977 |
Falconbridge Nickel Mines |
- Geophysical: EM and Mag surveys |
Hazeur and Gamache townships |
| 1978 |
- Geophysical: Gravity survey
- Diamond Drilling: 1 hole; 76 m |
Hazeur and Gamache townships |
| Patino Mines Ltd |
- Geophysical: Mag and HEM surveys |
Hazeur Township |
| 1982 |
Mines Northgate Patino Inc
|
- Geological survey |
Hazeur Township |
| 1983 |
- Geophysical: HEM survey |
Hazeur and Gamache townships |
| 1984 |
- Geophysical: Max-Min survey |
Hazeur Township |
| 1986 |
Société d'Exploration Minière Pontiac |
- Geological: Overburden stripping, boulder sampling and prospecting |
Hazeur and Gamache townships |
| 1987 |
SOQUEM |
- Geophysical: EM and VLF surveys |
Hazeur Township |
| Exploration Muscocho |
- Geophysical: Gradiometer survey |
Hazeur Township |
| 1988 |
SOQUEM |
- Diamond drilling: 13 holes |
Hazeur Township |
| Exploration Noramco |
- Diamond drilling: 7 holes |
Hazeur Township |
| Exploration Muscocho |
- Diamond drilling: 13 holes
- Geochemistry: Hummus biochemical |
Hazeur Township |
| 1989 |
Abbey exploration |
- Geophysical: EM, VLF and Mag surveys |
Hazeur and Gamache townships |
| 1994 |
2736-1179 Quebec Inc |
- Diamond drilling: 2 holes |
Hazeur Township |
| SOQUEM and Ressources Unifiées Oasis Inc. |
- Diamond drilling: 4 holes |
Hazeur Township |
| 1995 |
Syndicat du Beep Mat |
- Geophysical: Beep Mat survey (231 samples) |
Hazeur and Gamache townships |
| SOQUEM and Ressources Unifiées Oasis Inc. |
- Diamond drilling: 10 holes |
Hazeur Township |
| 1996 |
Ressources Unifiées Oasis Inc. |
- Geochemistry: Till sampling |
Hazeur Township |
| 2012 |
Vanstar |
- Geophysical: Magnometer survey |
Hazeur and Gamache townships |
| 2013 |
- Diamond drilling: 11 holes; 1,968 m |
Discoveries and Mila zones |
| - Diamond drilling: 9 holes; 1,406 m |
Mostly on Liam Zone |
| Year |
Company |
Type of work |
Areas of interest |
| 2014 |
|
- Geophysical: Mag survey |
Hazeur and Gamache townships |
| - Diamond drilling: 15 holes; 2,400 m |
Liam, Dan and 36 zones |
| IAMGOLD |
- Diamond drilling: 3 holes; 585 m |
Liam Zone |
| 2015 |
- Diamond drilling: 6 holes; 2,516 m |
Liam and Dan zones |
| - Geological: mapping and prospecting |
Nelligan Property |
| - Geophysical: IP (OreVision®) survey |
Liam Zone |
| - Geophysical: EM survey (VTEM™ Plus) |
Nelligan Property |
| 2016 |
- Diamond drilling: 20 holes; 6,778 m |
Liam, Dan, 36 zones and discovery of the Renard Zone |
| - Geophysical: IP and Resistivity |
Nelligan Property |
7. GEOLOGICAL SETTING AND MINERALIZATION
The Project is located in the northeastern corner of the Abitibi Subprovince of the Archean Superior Province, approximately 15 km west of the contact with the Mesoproterozoic aged Grenville Province, also known as the Grenville Front (Figure 7.1).
7.1 Regional Geology
7.1.1 Abitibi greenstone belt
The Abitibi greenstone belt (Abitibi Subprovince) is composed of east-trending synclines of largely volcanic rocks and intervening domes cored by synvolcanic and/or syntectonic plutonic rocks (gabbro-diorite, tonalite, and granite in composition), alternating with east-trending sedimentary basins (Ayer et al., 2002; Daigneault et al., 2004; Goutier and Melançon, 2007). Most of the volcanic and sedimentary strata dip vertically and are generally separated by abrupt, east-trending faults with variable dips. Some of these faults, such as the Porcupine-Destor Fault, display evidence for overprinting deformation events, including early thrusting and later strike-slip and extension events (Goutier, 1997; Benn and Peschler, 2005; Bateman et al., 2008). Two ages of unconformable successor basins occur early: widely distributed "Porcupine-style" basins of fine-grained clastic rocks; followed by Timiskaming-style basins of coarser clastic and minor volcanic rocks which are largely fault-bounded proximal to major regional faults (Porcupine-Destor, Larder-Cadillac, and similar faults in the northern Abitibi greenstone belt; Ayer et al., 2002; Goutier and Melançon, 2007). In addition, the Abitibi greenstone belt is cut by numerous late-tectonic plutons from syenite and gabbro to granite with lesser dikes of lamprophyre and carbonatite. The metamorphic grade in the greenstone belt displays greenschist to sub-greenschist facies, except around plutons where amphibolite grade prevails (Joly, 1978; Powell et al., 1993; Dimroth et al., 1983; Benn et al., 1994; Faure 2015).
The Abitibi greenstone belt is subdivided into seven discrete volcanic stratigraphic episodes based on groupings of numerous U-Pb zircon ages (Thurston et al., 2008). These episodes denote a geochronological constrained stratigraphy; they are listed from oldest to youngest:
- Pre-2750 Ma volcanic episode 1;
- Pacaud Assemblage (2750-2735 Ma);
- Deloro Assemblage (2734-2724 Ma);
- Stoughton-Roquemaure Assemblage (2723-2720 Ma);
- Kidd-Munro Assemblage (2719-2711 Ma);
- Tisdale Assemblage (2710-2704 Ma); and
- Blake River Assemblage (2704-2695 Ma).
U-Pb zircon ages and recent mapping by the Ontario Geological Survey and Géologie Québec show similarity in timing of volcanic episodes and ages of plutonic activity between the northern and southern Abitibi Greenstone Belt as indicated in Figure 7.1. Therefore, the geographic limit between the northern and southern parts of the Abitibi greenstone belt had only stratigraphic and structural significance, no tectonic significance (Thurston et al., 2008).

Modified from Thurston et al. (2008)
Figure 7.1 - Stratigraphic map of the Abitibi Greenstone Belt
| NI 43-101 Technical Report and Initial Mineral Resource Estimate - Nelligan Project - December 2019 |
37 |
7.1.2 The Caopatina-Desmaraisville segment
The Project is located in the Caopatina-Desmaraisville volcano-sedimentary segment (Figure 7.2). The following description of the eastern part of the segment is mostly modified and summarized from Midra et al. (1992); Dion and Simard (1999); and Faure (2012), and retains the references therein.
The eastern part of the Caopatina-Desmaraisville is mainly composed of volcanic rocks belonging to the 2734-2724 Ma Deloro Assemblage (Figure 7.2). Several volcanic cycles are distinguished in this area (Daigneault and Allard, 1990; Guha et al., 1991; Leclerc et al., 2011; Leclerc et al., 2017):
The first volcanic cycle surrounds the Eau Jaune intrusive complex and is named the Chrissie Formation. This formation is divided into two segments: a lower member of basalts and an upper member of felsic volcanics.
The Roy Group consists of two volcanic cycles:
1. The first cycle includes the Obatogamau and Waconichi formations. The Obatogamau Formation consists of thick sequences of mafic lavas. The overlying volcaniclastic rocks, pyroclastic rocks and felsic flows of the Waconichi Formation mark the end of the first volcanic cycle.
2. The second cycle includes the Bruneau Formation (tholeiitic basalts) and the Blondeau Formation (calc-alkaline basalts, volcaniclastic and sedimentary rocks).
The sedimentary rocks of the Caopatina Formation, which host the mineralized zones of the Project, overlay the volcanic cycles and are composed, in order of importance, of feldspathic wackes, siltstones-mudstones-argillites (turbidites), greywackes, conglomerates, and layers of iron formations. Locally, basalts and gabbro sills are intercalated between sediment beddings. They probably correspond to the last volcanic pulses during the sedimentation phase.
Several regional pre-deformation folds are preserved in the region (Daigneault and Allard, 1990). These folds, associated with the Kenorean orogeny, are oriented N-S to NNW without the development of a schistosity.
Following the development of these folds, the main deformation occurred and was characterized by regional N-S shortening. This structural episode was the origin of the E-W tectonic fabric marked by the direction of large folds axes, the regional schistosity, and the large deformation corridor shown by longitudinal faults. Three large structures are known in the region: 1) the Druillettes Syncline 2) the La Dauversière Anticline, and 3) the Opawica Anticline (Figure 7.2). The regional schistosity is well developed and is generally trending E-W, except when approaching the intrusions where it molds itself to the contacts of these intrusions.

Adapted and modified from SIGEOM and Faure (2012)
Figure 7.2 - Geological map of the eastern part of the Caopatina-Desmaraisville segment
The late deformation episode is represented by two shear cleavages that cut or fold the main regional schistosity where the deformation is weak. In strongly deformed areas, a crenulation cleavage affects the regional schistosity and the schistosity related to deformation corridors. Asymmetric "Z" folds can be observed where the cleavage is well developed.
In the Caopatina-Desmaraisville segment, faults are grouped into four groups based on their direction: E-W, SE, NE, and NNE faults. The E-W and SE longitudinal faults are the oldest and associated with the main episode of deformation. The NE faults cut the regional schistosity and the E-W faults. Late NNE faults are commonly related to the Grenvillian orogeny.
The Kapunapotagen and Guercheville faults are the main regional deformation corridors. The two faults are typical of east-trending ductile faults that crosscut the Abitibi Subprovince and are characterized by pure shear with dextral reactivation (Daigneault and Archambault 1990; Daigneault, 1996). They reach up to 1 km wide and are characterized by an intense schistosity, mylonitic zones, and carbonate- and sericite-rich alteration. The Guercheville Fault has a typical magnetic signature characterized by anomalies mainly associated with graphitic sedimentary rocks.
The NE faults are well documented in the Fancamp Deformation Corridor ("FDC") area between the Eau Jaune Complex and the Verneuil Pluton. The FDC is oriented NE-SW and has an average width of 600 m (Tait, 1992; Legault et al., 1997; Legault and Daigneault, 2006). It can be traced for up to 32 km and dips steeply (80°) toward the SE. The FDC is different from other deformation zones in the Abitibi Subprovince by its NE orientation and the presence of two intense cleavages.
Regional metamorphism is mainly associated with the Kenoran orogeny and varies from greenschist in the northwest to amphibolite facies towards the south and southeast approaching the Grenville Front. Amphibolite contact metamorphism is also present around some felsic intrusions.
The only mine in the eastern part of the Caopatina-Desmaraisville segment was the former Joe Mann mine (Figure 7.2), 17 km to the ENE of the Project, which produced 4,754,375 t at 8.26 g/t Au and 0.3% Cu (Houle, 2011).
at the most notable deposit in the Project area is the Philibert deposit located 7 km to the NE. In 1991, SOQUEM reported a historical mineral resource estimate of 1,393,042 t grading 5.3 g/t Au.
These "Resources" are historical in nature and should not be relied upon. It is unlikely they conform to current NI 43-101 requirements or follow CIM Definition Standards, and they have not been verified to determine their relevance or reliability. They are included in this section for illustrative purposes only and should not be disclosed out of context.
7.2 Property Geology
The Property is characterized by overburden cover ranging from 10 to 50 m thick. Outcrops are rare and found mainly in the west-central part of the Property. Most of the recent geological information was obtained from diamond drill holes, mainly in the northern part of the Property, in addition to geophysical interpretations.
The Property is bordered to the north by the Hazeur Pluton and to the south by the Lac Surprise Batholith, both Archean in age and tonalitic in composition (Figure 7.3). The E-W oriented Druillettes syncline cuts across the middle of the Property.
7.2.1 Lithologies
The Caopatina Formation is a sequence of sedimentary rocks that occupies the heart of the Druillettes syncline. It is delimited to the north and south by major longitudinal E-W faults. The principal units, described by IAMGOLD (2018a), are a succession of mudrock and quartz-feldspar wackes. Some conglomeratic units are also present (mainly in the northwestern part of the Property), in addition to an iron formation composed of centimetric magnetite banding (locally more hematized), intercalated with black graphitic mudstones. It is estimated that the Caopatina Formation is 1-2 km thick, but the maximum thickness is not known as drill holes did not intersect the contact characterizing the bottom of the formation. Heavily weathered sediments (supergene argilic material) have been intersected in some drill holes down to depths of 350 m.
The Obatogamau Formation is present on both sides of the Druillettes syncline. It consists of basalts and gabbros of tholeiitic composition.
7.2.2 Metamorphism
The transition zone between greenschist facies and amphibolite facies occurs at the western limit of the Property (Midra,1992). Metamorphic minerals belonging to upper greenschist and lower amphibolite facies in metasedimentary and volcanic rocks have been observed on the Property (hornblende, albite, biotite, phlogopite, chlorite, quartz and garnet).

Geology map adapted and modified from SIGEOM, Faure (2012), and a local Mag geophysical survey (total mag field)
Figure 7.3 - Project geology map
7.3 Mineralization
The following descriptions of mineralized zones is taken from Crozier (2018) and retains the references therein. It is supplemented by observations made by InnovExplo during site visits and by geological drill hole interpretations combined with geophysical survey results.
The main gold mineralization currently known on the Project is located in the northeast part. within the Nelligan MRE area where four (4) gold zones have been discovered and intersected by numerous drill holes: Dan, Liam, Zone 36 and Renard.
Figure 7.4, the zones are interpreted as a series of more or less parallel, ENE-trending altered envelopes, with an average dip of 60° to the SSE. The interpreted zones are vertically stacked, separated by waste gaps of 25 to 75 m.

Figure 7.4 - Mineralized zones in the Nelligan MRE area
Mineralization is hosted in strongly altered sedimentary rocks of the Caopatina Formation. The main alteration types are silicification, carbonatization (dolomite + ankerite ± siderite ± calcite), potassic alteration, and occasionally albitization and hematization. Secondary minerals include amphibole, garnet, biotite, sericite and rutile.
Thus far, the best gold intervals on the Project have been found in strongly silicified rocks. Silicification affects the host rocks in most known mineralized zones, locally obliterating the protolith and rendering protolith identification difficult. These silicified and gold mineralized zones are up to 200 m thick. Silica alteration is pervasive and seals the ductile structural fabric, suggesting that the timing of gold mineralization is either syn- to late deformation. Horizons of quartz-sericite schists, often with traces of fuchsite, have been documented, particularly in the walls of these silicified zones or in the immediate vicinity of iron formations. A phlogopite-carbonate alteration zone, around 50 m thick, is also observed above the lower contact of the Renard Zone. The main alteration, moderate to strong within the mineralized zones, decreases gradually in intensity toward their margins and continues to decrease in intensity, moving away from their interpreted boundaries.
Pyrite is the main sulphide mineral associated with the mineralized zones. It is mainly observed as finely disseminated grains (mainly between 1 and 3%; locally up to 10-30% in silicified zones), but also as semi-massive beds, bandings, fracture fillings and millimetric veinlets parallel to schistosity. Local occurrences of chalcopyrite and molybdenite are generally associated with quartz-carbonate veinlets. Visible gold is rare, but when observed, it is found in association with quartz-carbonate veinlets or between pyrite grains. Gold content is only weakly correlated with pyrite abundance.

Clockwise from top-left corner: Pyrite as fracture fillings in hole NE-18-75, as fine disseminations in NE-17-54, and as disseminations and semi-massive beds in NE-19-124.
Figure 7.5 - Example of pyrite mineralization in drill core from the Nelligan Project
7.3.1 Dan Zone
The Dan Zone is the southernmost of the mineralized zones in the resource area. It includes three tabular mineralized envelopes, each 20 to 30 m thick and separated by roughly 60-m-thick waste gaps. Mineralization is hosted in clastic sedimentary rocks, namely conglomeratic and wacke (feldspathic) units. The top and bottom envelopes have a lateral extent of 300 m, and the middle envelope extends for 500 m. The two upper envelopes are constrained down-dip; the bottom envelope remains open down-dip.
The entire zone is strongly silicified. Pervasive hematization and potassic alteration are common and the intensity ranges from strong to moderate. Fracture-controlled albitization is also present. A hematite and silica alteration halo occurs around the silicified zone: distal, pervasive and weak in some places, fracture-controlled in others.
7.3.2 Liam Zone
The Liam Zone is 25 to 35 m thick with a lateral extent of 690 m. It remains open down-dip. The zone is confined between two faults. The mineralized envelope is parallel to the faults and is hosted in three different units: an upper unit of sericitized schist, a middle unit of banded iron formation with centimetric alternations of magnetite and hematite bands, and a lower heavily silicified unit with an unidentified protolith.
Alteration is characterized by an assemblage of silica, K-feldspar, carbonate and sericite. Potassic alteration and silicification are pervasive and moderate to strong in intensity, or fracture controlled. Carbonatization (mainly dolomite and ankerite) is weak and also pervasive and fracture-controlled. Sericite is locally associated with faulting within the zone, footwall or hanging wall.
7.3.3 Zone 36
Zone-36 consists of two envelopes, each approximately 25 m thick, one partially above the other. The zone is mainly hosted by a heavily silicified unit. Silicification tapers to the SW and NE. The zone extends 400 m laterally and is still open down-dip.
The zone is characterized by an alteration assemblage of silica, K-feldspar, ±sericite, ±fuchsite. Silicification is strong and pervasive throughout the zone. Sericite is weak and occurs as disseminated flakes. Pervasive potassic alteration and disseminated fuchsite appear locally. Less well-developed external alteration is also documented on both side of the zone.
7.3.4 Renard Zone
The Renard Zone is the northernmost and thickest mineralized lens. It is 200 m thick, locally up to 250 m, and hosted in heavily silicified sediments (mainly wacke). A sheared phlogopite zone cuts across the unit and is subparallel to the footwall. The footwall is characterized by progressively less silicification, finally grading into fresher wackes. In a few holes, a gabbroic unit acts as the footwall. The hanging wall is characterized by a halo, 10 to 20 m wide, of hematization and/or potassic alteration and by tectonic breccia. SW-NE faults obliquely cut across the zone at a low angle. The zone remains open in all directions.
Throughout the Renard Zone, silicification is mainly strong and pervasive. Sericite appears to be mainly associated with shears. Potassic alteration or hematization is locally present in the southwestern part of the zone, mainly pervasive or associated with fractures. Less well-developed external alteration is also documented on both side of the zone.
8. DEPOSIT TYPES
The gold mineralization on the Project is hosted in sedimentary rocks of the Caopatina Formation. No major deposits in the Abitibi are known to be hosted in such successor sedimentary basins, making Nelligan a rare and atypical deposit.
The main alteration types on the Project are silicification, carbonatization, potassic-alteration, and occasionally albitization and hematization. The best gold intervals correspond to intense, pervasive silicification that locally obliterates the protolith. Quartz-carbonate veins are rare and weakly auriferous (< 1 g/t Au).
Deformation is mainly ductile, marked by a variety of schists and mylonites. Conglomerate clasts are strongly flattened and stretched, and when present, the quartz-carbonate veins are sheared and folded. The timing of gold mineralization is not fully constrained but appears to be syn- or late-deformation due to the gold-bearing silica alteration overprint and sealed ductile fabric.
The mineralized zones are located at the boundary between the upper greenschist and amphibolite facies and may have formed relatively deep in the crust if they are synchronous to metamorphism. The zones are also adjacent to first-order, probably deep-seated, crustal faults (e.g., Guercheville Fault) and proximal to syn-orogenic intrusions (i.e., Hazeur Pluton and Lac Surprise Batholith).
8.1 Orogenic Deposits
Figure 8.1 presents the different types of gold deposits and the inferred deposit clan relative to their depth of formation. Thirteen (13) globally significant types of gold deposits have been recognized, each with its own well-defined characteristics and environment of formation. As proposed by Robert et al. (1997) and Poulsen et al. (2000), many of these gold deposit types can be grouped into families of deposits that either formed by related processes or that are distinct products of large-scale hydrothermal systems.
Epigenetic gold deposits in metamorphic terranes, particularly Late Archean greenstone belts and Paleoproterozoic fold belts, formed synchronously with late stages of orogeny and are classified as orogenic gold deposits, which may be subdivided into epizonal, mesozonal, and hypozonal subtypes based on pressure-temperature conditions of ore formation (Goldfarb et al. 2005).
The regional geology and structural context at the Project fit with greenstone-hosted gold deposit classification (or Greenstone Vein and Slate Belt Clans) of Poulsen et al. (2000). More specifically, the pervasive alteration and the replacement and disseminated mineralization (rather than mineralized veins) observed on the Project are more typical of the deeper, ductile environments of orogenic deposits (Goldfarb and al., 2005).
The local occurrences of chalcopyrite and molybdenite in the Project's mineralized zones also suggest an input of a magmatic fluid. On a regional scale, there is a spatial association between gold ores and plutons. The Hazeur syn-orogenic pluton is located 2.5 km north of the Nelligan gold zones. On the Property, there is a kilometre-scale oval magnetic low less than 1 km east of the mineralized zones (see Figure 7.3). This geophysical anomaly may correspond to a buried pluton. These plutons may have acted as a heat source and been responsible for large-scale fluid circulation and convection. Sedimentary beds could have acted as permeable units that trapped gold-bearing fluids. Considering these facts, the Nelligan deposit may share some characteristics with the Intrusion-related Clan classification, more specifically, non-carbonate stockwork-disseminated deposits. The potassic metasomatism (sericite, biotite and K-feldspar) observed in every mineralized zone on the Project is a common feature of this type of deposit (Poulsen et al., 2000).

Note the logarithmic depth scale. Modified from Poulsen et al., 2000.
Figure 8.1 - Inferred crustal levels of gold deposition showing different types of gold deposits and their inferred deposit clan
9. EXPLORATION
This item presents the exploration programs completed by IAMGOLD from 2017 to 2019. Previous exploration work programs are summarized in Item 6.
9.1 Thin Section Petrography
In 2017, COREM was mandated to complete a petrographic description of 20 samples from the Project. Each sample was chosen by IAMGOLD to provide a better understanding of the Project's mineralization and alteration. Mineral identification was performed on polished thin sections of those samples using transmitted and polarizing light and using reflected light for oxides, sulphides and gold. Gold grains were analyzed with a scanning electron microscope. Modal analysis was also performed.
The main results of this study are the following:
- Gold occurs as very fine grains, usually between <10 to 40 µm, with some traces of silver, and locally as electrum;
- The reddish colour (alteration) documented on the core appears to be mostly related to potassic alteration rather than hematite alteration as described in the field; and
- The whitish to beige colour (alteration) on the core correlates with significant amounts of carbonate (dolomite) rather than albitization as described in the field.
Host rocks are strongly altered sedimentary rocks. Locally, intrusive rock textures were suspected but could not be confirmed at this stage.
9.2 UAV Magnetic Survey
Stratus Aeronautics performed a magnetic survey from September 29 to October 3, 2018, by Unmanned Aerial Survey ("UAV"). The UAV survey was part of a research project supported by IAMGOLD in partnership with the École de Technologie Supérieure and the Natural Sciences and Engineering Research Council of Canada ("NSERC"). The results yielded a response for the folded iron formations. A contour map of the magnetism survey on the Nelligan Project was produced using the survey results (IAMGOLD, 2018c).
9.3 Mapping Programs
In August 2018, a mapping program was completed over the two southernmost claims. Ten (10) grab samples were taken from laminated mudrock units but did not return significant gold values (IAMGOLD, 2018c).
In August 2019, a mapping program targeted the Nelligan, Émile and Miron claim blocks on the Project. A total of 323 outcrops were found and 86 grab samples collected. On the Émile claim block, several outcrops exposed a folded iron formation consistent with the magnetic high documented by the UAV survey. Resuls are still being compiled and integrated in the Project scale compilation. Faults on the Miron and Nelligan claim blocks confirmed the interpretation based on the VTEM survey (IAMGOLD, 2019).
9.4 Soil sampling program
A soil sampling program began on August 15, 2019. Lines were established over the Émile and Nelligan claim blocks. Lines on the Miron claim block were initially planned but was postponed to a future soil sampling program (Figure 9.1).
In September 2019, the survey was completed and 526 soil samples were collected on both the Émile and Nelligan claim blocks. Results and interpretation were still pending at the time of the report filling.

Modified from IAMGOLD, 2019
Figure 9.1 - Soil sampling lines for the 2019 soil sampling program on the Nelligan Project
10. DRILLING
This item presents the drilling programs completed by IAMGOLD from 2017 to 2019. Previous drilling programs on the Project are summarized in Item 6.
10.1 Drilling Methodology
The 2017, 2018 and 2019 drilling programs were performed by Chibougamau Diamond Drilling Ltd based in Chibougamau, Québec. The drilling was conducted with NQ caliber (47.6 mm core diameter) using a conventional surface drill rig according to the methodology described below.
A handheld Garmin GPSMAP 62s is used to locate the planned drill holes. Once the drill rig is lined up using a compass on the planned location, the hole's starting dip is measured using a clinometer. Subsequent to completion, all collars are surveyed by Paul Roy, Land Surveyor, a.t.c. using a DGPS (GNSS Leica GS15). The casings are left intact, covered with a steel cap and a steel marker with the collar identification.
The downhole dip and azimuth are surveyed using a Reflex EZ-Trac unit. Reflex surveys start 15 m below the end of the casing depth, and the following single-shot readings are taken every 30 m until the hole is completed. When the hole has reached its targeted depth, a downhole survey is completed using the multi-shot mode every 3 m. The instrument is handled by the drilling contractors and the survey information is then electronically transferred via a USB drive to the Gems Logger database by a member of the IAMGOLD team. Once a day, an IAMGOLD technician transports the core boxes to the logging facility where the boxes are opened and cleaned. The hole length is checked (quality control) and the core is oriented.
Magnetic susceptibility readings, using a SM-30 meter (only in 2018), along with core recovery and RQD (all years), are measured and recorded for every 3-metre drill run in the GEMS logger database. A geological description of the core is completed (lithologies, major structures, alteration) and/or supervised by a registered geologist or engineer. Photographs of the dry and wet core are taken once the geologist has laid out the samples and inserted the sample tags. Those photographs are then archived on IAMGOLD's server.
IAMGOLD's sampling procedure allows for a sample length of 0.5 to 1.5 m, with exceptions being made up to 3.0 m when core recovery is below 60%. The lithological and structural contacts are used as sampling boundaries. The core of each selected interval is sawn in half by an IAMGOLD technician using a typical table-feed circular rock saw. The top half is placed in a numbered plastic bag along with a corresponding ID tag for shipment to the laboratory. The core is sawed slightly to one side of the orientation reference line to preserve it for future studies. If the orientation line cannot be continued through the run, the geologist draws a cut line (dashed line) on affected pieces of core so representative samples can be collected. The bottom half with the orientation line is retained as a witness sample and returned to the core box. A tag bearing the same sample number is stapled in the box, at the end of each sampled interval.
At the end of each drilling program, the core is palleted and moved from the Chibougamau logging and core storage facilities to the IAMGOLD's storage facility in Rouyn-Noranda (Destor) where it is stored in a secure fenced area.
10.1.1 Downhole core orientation survey
The core from the Project is oriented. The drillers mark the core at the end of each run using a Reflex ACT III electronic orientation tool. Before the core is removed from the core spring and then the core tube, the drillers use the tool to orient and trace a short line, at the end of the drill run, representing the bottom of the hole. This line corresponds to the in-situ underside of the core.
Once the core is received at the logging facility, each piece of core is replaced in its original position. The technician continues the driller's short line with a grease pencil along the whole run. For drilling runs with poor recovery (faults, broken core), the orientation line is compared to the line of the previous run. Arrows pointing down-hole are marked on the orientation line of each piece of core.
Accurate beta angle measurements are made using specially constructed circular protractors or, more simply, a flexible wrap-around protractor printed on a transparent film. Both angles (alpha and beta) are then entered into Gems Logger, along with the hole orientation survey data. The orientations can then be determined using stereographic plotting software.
10.1.2 Core recovery and RQD measurements
Core recovery and rock quality designation ("RQD") measurements for each run are recorded in the Gems Logger database.
Core recovery is calculated by measuring borehole core recovery in percentage over each 3-m drilling run.
RQD is a measure of the degree of naturally induced jointing or fracture in a rock mass, measured as a percentage of the drill core in lengths of 10 cm or more for each 3-m drill run.
The Project has some fractured and heavily weathered areas that are characterized by poor core recovery and low RQD. Such areas can locally reach core lengths of 6 m and may include mineralized intervals. IAMGOLD worked closely with the drilling contractor to try different drilling fluids and mud suppliers, and recoveries have improved.
10.2 Recent Drilling Programs
The 2017 to 2019 drilling programs concentrated on testing geophysical anomalies, testing geological and structural targets, and defining gold mineralized zones in the first 600 m from surface (Figure 10.1).
A total of 99 holes were completed for a total of 38,559 m, Table 10.1 presents the breakdown by year.
Table 10.2 presents the significant results of these programs.

Figure 10.1 - Drill hole locations for the 2017, 2018 and 2019 drilling programs
Table 10.1 - Drilling summary
|
Year
|
DDH
|
Metres
|
|
2017
|
17
|
7,669
|
|
2018
|
32
|
13,362
|
|
2019
|
50
|
17,528
|
|
Total
|
99
|
38,559
|
Table 10.2 - Significant results of the drilling programs
| Hole Number |
Hole length (m) |
From (m) |
To (m) |
Interval (m) |
Grade Au (g/t) |
Zone |
| NE-17-62 |
525 |
369.65 |
384 |
14.35 |
2.07 |
Renard |
| including |
|
370.5 |
382.5 |
12 |
2.38 |
|
| including |
|
381 |
382.5 |
1.5 |
12.3 |
|
| |
|
399 |
405 |
6 |
0.87 |
Renard |
| |
|
423 |
457.8 |
34.8 |
2.01 |
Renard |
| including |
|
424.25 |
445 |
20.75 |
2.88 |
|
| including |
|
433.1 |
437.6 |
4.5 |
7.66 |
|
| |
|
508 |
510 |
2 |
2.25 |
|
| NE-17-63 |
369 |
97.5 |
111 |
13.5 |
1.68 |
Renard |
| including |
|
100.5 |
106.6 |
6.1 |
2.58 |
|
| Hole Number |
Hole length (m) |
From (m) |
To (m) |
Interval (m) |
Grade Au (g/t) |
Zone |
| |
|
135 |
153 |
18 |
0.92 |
Renard |
| including |
|
139.5 |
141 |
1.5 |
2.43 |
|
| |
|
162 |
172.5 |
10.5 |
1.33 |
Renard |
| including |
|
162 |
163.5 |
1.5 |
3.23 |
|
| including |
|
166.5 |
169.5 |
3 |
1.95 |
|
| |
|
184.5 |
189 |
4.5 |
1.31 |
Renard |
| |
|
300 |
303 |
3 |
1.42 |
Renard |
| NE-17-65 |
363 |
63 |
69 |
6 |
0.88 |
36 |
| |
|
147.6 |
159 |
11.4 |
0.66 |
Renard |
| |
|
171 |
180 |
9 |
0.91 |
Renard |
| |
|
195 |
250.5 |
55.5 |
1.16 |
Renard |
| including |
|
201 |
208.5 |
7.5 |
2.62 |
|
| including |
|
217.5 |
225 |
7.5 |
1.7 |
|
| including |
|
229.5 |
232.5 |
3 |
2.25 |
|
| including |
|
235.5 |
238.5 |
3 |
1.47 |
|
| including |
|
244.5 |
247.5 |
3 |
1.7 |
|
| |
|
267 |
268.5 |
1.5 |
2.53 |
Renard |
| |
|
273 |
276 |
3 |
1.35 |
Renard |
| NE-18-69 |
466 |
305.2 |
312.5 |
7.3 |
6.84 |
Renard |
| including |
|
308.2 |
309.7 |
1.5 |
29.3 |
|
| |
|
318.4 |
375 |
56.6 |
1.81 |
Renard |
| including |
|
318.4 |
349.2 |
30.8 |
2.66 |
|
| including |
|
326.9 |
328.4 |
1.5 |
15.45 |
|
| including |
|
344.7 |
346.2 |
1.5 |
6.08 |
|
| |
|
385.5 |
396 |
10.5 |
0.54 |
Renard |
| |
|
409.5 |
435.5 |
26 |
0.65 |
Renard |
| NE-18-73 |
297 |
37.5 |
48.22 |
10.72 |
1.31 |
Renard |
| including |
|
37.5 |
40.5 |
3 |
2.85 |
|
| |
|
57.22 |
68.32 |
11.1 |
0.79 |
Renard |
| |
|
144 |
145.5 |
1.5 |
14.9 |
Renard |
| |
|
153.37 |
181.5 |
28.13 |
1.4 |
Renard |
| including |
|
153.37 |
157.13 |
3.76 |
4.65 |
|
| including |
|
179.27 |
181.5 |
2.23 |
3.82 |
|
| |
|
213.87 |
223.48 |
9.61 |
1.17 |
Renard |
| including |
|
220.57 |
223.48 |
2.91 |
2.42 |
|
| |
|
235.22 |
267.5 |
32.28 |
0.89 |
Renard |
| including |
|
241.22 |
244.8 |
3.58 |
1.8 |
|
| including |
|
250.2 |
253.2 |
3 |
2.33 |
|
| |
|
276.5 |
283.15 |
6.65 |
1.24 |
Renard |
| NE-18-75 |
498 |
105.35 |
111.73 |
6.38 |
0.86 |
36 |
| |
|
139.64 |
149.1 |
9.46 |
0.65 |
36 |
| including |
|
147.9 |
149.1 |
1.2 |
2.53 |
|
| Hole Number |
Hole length (m) |
From (m) |
To (m) |
Interval (m) |
Grade Au (g/t) |
Zone |
| |
|
233 |
256.25 |
23.25 |
1.51 |
Renard |
| including |
|
234.5 |
250.45 |
15.95 |
1.81 |
|
| |
|
296.9 |
320 |
23.1 |
2.59 |
Renard |
| including |
|
297.9 |
299.9 |
2 |
5.91 |
|
| including |
|
309.7 |
310.7 |
1 |
15.65 |
|
| |
|
326.65 |
348.75 |
22.1 |
2.08 |
Renard |
| including |
|
341.3 |
343.95 |
2.65 |
11.53 |
|
| |
|
355.75 |
375.8 |
20.05 |
1.09 |
Renard |
| |
|
395.75 |
462 |
66.25 |
1.18 |
Renard |
| including |
|
398.25 |
399 |
0.75 |
17.05 |
|
| including |
|
444 |
445.5 |
1.5 |
8.42 |
|
| NE-18-78 |
339 |
51 |
59.07 |
8.07 |
0.67 |
Renard |
| |
|
95.75 |
106.1 |
10.35 |
1.23 |
Renard |
| |
|
129 |
153 |
24 |
0.96 |
Renard |
| including |
|
135.5 |
147 |
11.5 |
1.3 |
|
| |
|
165 |
199.95 |
34.95 |
0.84 |
Renard |
| including |
|
174 |
175.5 |
1.5 |
1.81 |
|
| including |
|
181.15 |
199.95 |
18.8 |
1.12 |
|
| |
|
235.85 |
300.81 |
64.96 |
0.82 |
Renard |
| including |
|
243.7 |
274.56 |
30.86 |
1.01 |
|
| including |
|
283.08 |
287.34 |
4.26 |
1.14 |
|
| including |
|
299.36 |
300.81 |
1.45 |
2.77 |
|
| |
|
326.6 |
339 |
12.4 |
0.53 |
Renard |
| NE-18-91 |
381 |
95.5 |
117.5 |
22 |
1.43 |
Renard |
| including |
|
100.6 |
106.55 |
5.95 |
2.9 |
|
| |
|
126.3 |
159.2 |
32.9 |
1.28 |
Renard |
| including |
|
132 |
136.5 |
4.5 |
3.29 |
|
| |
|
167 |
178.3 |
11.3 |
0.71 |
Renard |
| |
|
182 |
197.5 |
15.5 |
0.88 |
Renard |
| including |
|
189 |
192 |
3 |
2.13 |
|
| |
|
214 |
271.5 |
57.5 |
1.87 |
Renard |
| including |
|
232.47 |
245.18 |
12.71 |
3.98 |
|
| including |
|
265 |
265.5 |
0.5 |
33.2 |
|
| |
|
352.5 |
367.5 |
15 |
0.56 |
Renard |
| NE-18-95 |
630 |
51 |
59.8 |
8.8 |
0.76 |
36 |
| |
|
183.6 |
237.3 |
53.7 |
0.97 |
Renard |
| including |
|
222 |
237.3 |
15.3 |
1.55 |
|
| |
|
250.2 |
265 |
14.8 |
1.63 |
Renard |
| including |
|
251.6 |
256 |
4.4 |
2.34 |
|
| including |
|
257.9 |
261 |
3.1 |
3.09 |
|
| |
|
378.1 |
420.2 |
42.1 |
3.59 |
Renard |
| including |
|
378.1 |
379.5 |
1.4 |
14.25 |
|
| Hole Number |
Hole length (m) |
From (m) |
To (m) |
Interval (m) |
Grade Au (g/t) |
Zone |
| including |
|
399.5 |
402.5 |
3 |
12.8 |
|
| |
|
441 |
450.9 |
9.9 |
1.31 |
Renard |
| |
|
495.5 |
504.5 |
9 |
1.23 |
Renard |
| |
|
510.5 |
514.5 |
4 |
3.07 |
Renard |
| |
|
522 |
538.5 |
16.5 |
1.09 |
Renard |
| NE-19-102 |
375 |
87.12 |
96.31 |
9.19 |
0.92 |
Renard |
| including |
|
87.12 |
91.5 |
4.38 |
1.34 |
|
| |
|
116.42 |
153.51 |
37.09 |
1.81 |
Renard |
| including |
|
116.42 |
123.17 |
6.75 |
2.82 |
|
| including |
|
126.91 |
129.92 |
3.01 |
3.8 |
|
| including |
|
141.69 |
151.5 |
9.81 |
2.73 |
|
| |
|
164.83 |
179.46 |
14.63 |
0.58 |
Renard |
| |
|
192.3 |
200.2 |
7.9 |
1.05 |
Renard |
| |
|
223.4 |
232 |
8.6 |
0.61 |
Renard |
| NE-19-114 |
552 |
128.64 |
143.55 |
14.91 |
0.56 |
Renard |
| |
|
238 |
254.7 |
16.7 |
4.04 |
Renard |
| including |
|
246 |
253.73 |
7.73 |
7.02 |
|
| including |
|
247 |
248 |
1 |
38.5 |
|
| |
|
281.25 |
309.67 |
28.42 |
2.11 |
Renard |
| including |
|
302.8 |
307.8 |
5 |
7.05 |
|
| |
|
326.15 |
372 |
45.85 |
1.04 |
Renard |
| including |
|
332.53 |
336.2 |
3.67 |
3.85 |
|
| |
|
427.5 |
436.5 |
9 |
1.55 |
Renard |
| |
|
507.7 |
530.2 |
22.5 |
1.04 |
Renard |
| NE-19-118 |
372 |
57 |
59.1 |
2.1 |
2.73 |
Renard |
| |
|
120 |
166.8 |
46.8 |
1.59 |
Renard |
| including |
|
138.83 |
145.5 |
6.67 |
5.96 |
|
| |
|
202 |
228.9 |
26.9 |
1.16 |
Renard |
| including |
|
208.62 |
215 |
6.38 |
2.5 |
|
| |
|
268.77 |
294.5 |
25.73 |
1.08 |
Renard |
| including |
|
291.5 |
294.5 |
3 |
3.57 |
|
| |
|
306.5 |
308 |
1.5 |
6.84 |
Renard |
| NE-19-144 |
450 |
69 |
75 |
6 |
0.93 |
36 |
| |
|
105 |
110.35 |
5.35 |
1.5 |
Renard |
| |
|
142 |
158.5 |
16.5 |
1.92 |
Renard |
| |
|
189 |
204 |
15 |
1.39 |
Renard |
| |
|
211.5 |
249 |
37.5 |
2 |
Renard |
| including |
|
223.5 |
228 |
4.5 |
9.49 |
|
| including |
|
223.5 |
225 |
1.5 |
20.9 |
|
| |
|
274 |
283 |
9 |
0.74 |
Renard |
| |
|
295.5 |
328.5 |
33 |
0.68 |
Renard |
| |
|
373.5 |
397.65 |
24.15 |
0.58 |
Renard |
| Hole Number |
Hole length (m) |
From (m) |
To (m) |
Interval (m) |
Grade Au (g/t) |
Zone |
| |
|
421.5 |
423 |
1.5 |
4.27 |
Renard |
| NE-19-145 |
522 |
109.5 |
118.5 |
9 |
1.79 |
36 |
| |
|
127.5 |
131.12 |
3.62 |
1.73 |
36 |
| |
|
243.99 |
294.22 |
50.23 |
1.82 |
Renard |
| including |
|
251.84 |
258.4 |
6.56 |
2.48 |
|
| including |
|
272.65 |
273.52 |
0.87 |
20.5 |
|
| including |
|
276.5 |
287.13 |
10.63 |
2.93 |
|
| |
|
314.8 |
332.8 |
18 |
1.01 |
Renard |
| including |
|
320.8 |
322.3 |
1.5 |
5.4 |
|
| |
|
410.8 |
432 |
21.2 |
0.66 |
Renard |
| NE-19-146 |
621 |
72.85 |
77.35 |
4.5 |
1.3 |
36 |
| |
|
335.8 |
351.97 |
16.17 |
0.95 |
Renard |
| |
|
373.8 |
404.4 |
30.6 |
2.87 |
Renard |
| including |
|
382.2 |
383.7 |
1.5 |
24.4 |
|
| |
|
413.5 |
435.7 |
22.2 |
0.69 |
Renard |
| |
|
449 |
481.4 |
32.4 |
0.93 |
Renard |
| including |
|
449 |
461.9 |
12.9 |
1.5 |
|
| |
|
524.35 |
539.35 |
15 |
1.46 |
Renard |
| |
|
548.05 |
573.5 |
25.45 |
0.76 |
Renard |
| including |
|
548.05 |
558.65 |
10.6 |
1.07 |
|
| NE-19-149 |
342 |
94.8 |
109.7 |
14.9 |
1.39 |
Renard |
| |
|
117 |
134.25 |
17.25 |
5.3 |
Renard |
| |
|
143.6 |
174.75 |
31.15 |
1.03 |
Renard |
| including |
|
143.6 |
144.9 |
1.3 |
7.38 |
|
| |
|
186.8 |
209.2 |
22.4 |
0.75 |
Renard |
10.2.1 2017 Drilling Program
In 2017, the program tested the extensions of the gold zones intersected in 2016 (Renard Zone), geophysical IP anomalies (follow-up on the 2016 IP survey by TMC Geophysics), and structural and geological targets. A general objective was to improve the general understanding of the geological setting.
Six (6) holes (NE-17-51 to NE-17-56, NE-17-62, NE-17-63, NE-17-65 and NE-17-66) were drilled in the Renard Zone for a total of 4,488 m. The 2017 program increased the volume of the Renard Zone, which remained open in all directions. Some holes also intersected and increased the volume of the Dan, Liam and 36 zones (Figure 10.1).
10.2.2 2018 Drilling Program
In 2018, the objectives were to define mineralized zones and follow up on the 2017 program to confirm the presence of mineralization in the four known zones (Renard, Dan, Liam and 36). Step-out drilling was done in the 36 and Renard zones.
Thirty-two (32) holes were drilled (13,362 m) (Figure 10.1), including one HQ caliber hole (63.5 mm core diameter) to see if core recovery increases by using a bigger drilling diameter. Twenty-nine (29) of the holes (12,477 m) were drilled on the Renard Zone. All holes intersected significant gold values, either confirming or extending the interpreted zone (Table 10.2). At the end of the 2018 program, the Renard Zone remained open in every direction and Zone 36 was extended.
10.2.3 2019 Drilling Program
In 2019, the objectives were mainly to test the western and depth extensions of the Renard Zone and to confirm the presence of mineralization.
Fifty (50) holes were drilled for 17,528 m (Figure 10.1)
The 2019 drilling program confirmed the extension and continuity of mineralization in the Renard and 36 zones (Table 10.2). The zones remained open in all directions.
11. SAMPLE PREPARATION, ANALYSES AND SECURITY
The following item describes the sample preparation, analysis and security procedures for the drilling results included in the current resource estimate.
The Project is characterized by three periods of data acquisition:
1. Historical: before May 10, 2012;
2. Vanstar: from May 10, 2012 to May 26, 2014; and
3. IAMGOLD: since January 28, 2015.
Overall, the historical period represents very little data, with 12 drill holes and 909 samples. InnovExplo recovered the assay certificates for one hole (95-19; Chainey, 1996a), but could not find any documentation confirming sampling procedures for the other holes or whether a QA/QC program was in place at the time. The issuers have not performed re-sampling or quality control checks on the historical holes. For these reasons, all 11 holes lacking certificates of analysis were discarded from the 2019 MRE database.
Although Vanstar increased the exploration and drilling effort on the Project, the most intensive period of data acquisition was the recent period since IAMGOLD's involvement.
This item focuses on the core handling, sampling, security, laboratory preparation and assaying aspects during IAMGOLD's period of data acquisition, and on the QA/QC results obtained during both the Vanstar and IAMGOLD periods.
11.1 Core Handling, Sampling and Security
This description applies only to the IAMGOLD period for which InnovExplo had access to detailed procedures.
Drill core is placed into wooden core boxes at the drill site with the end of each drill run marked with a small wooden block displaying the depth of the hole. The boxes are labelled and strapped at the drill site. An IAMGOLD technician brings the boxes to the logging facility. Drill core is logged and sampled by or under the supervision of registered professionals (geologists and engineers, or geologist-in-trainings and junior engineers under the supervision of a professional).
Sample length is allowed to range from 0.5 to 1.5 m, and samples must not cross geological contacts. Exceptionally, for intervals with poor recovery rates, the sample length can go up to 3.0 m.
Using a circular saw with a diamond blade, the core is sawn in half lengthwise along the dashed line drawn by the geologist. The dashed line is drawn beside the orientation in order to preserve it. The top half is placed in a numbered plastic bag along with the corresponding numbered tag, for shipment to the laboratory. A tag bearing the same sample number is stapled in the box at the end of each sampled interval for future reference.
Individual sample bags are placed in rice or jute bags (maximum of 4 samples per bag) along with the list of samples included. Every bag is sealed. The bag number is written on the tape or the string used to close each bag. A line is then traced with an indelible marker on the knot and the bag to prevent non-protocol handling or falsification/alteration of the samples. If such actions are suspected, the laboratory will communicate with IAMGOLD.
Samples are transported by a bus service (Autobus Maheux) to the ALS laboratories in Val-d'Or ("ALS").
11.2 Laboratory Accreditation and Certification
This description applies only to the IAMGOLD period for which InnovExplo had access to detailed procedures.
The International Organization for Standardization ("ISO") and the International Electrotechnical Commission ("IEC") form the specialized system for worldwide standardization. ISO/IEC 17025 General Requirements for the Competence of Testing and Calibration Laboratories sets out the criteria for laboratories wishing to demonstrate that they are technically competent, operating an effective quality system, and able to generate technically valid calibration and test results. The standard forms the basis for the accreditation of competence of laboratories by accreditation bodies. ISO 9001 applies to management support, procedures, internal audits and corrective actions. It provides a framework for existing quality functions and procedures.
Since the IAMGOLD period, samples from the Project two (2) laboratories were to prepare and assay the Project samples. AGAT Laboratories in Val-d'Or, Québec, was used from January 2015 until March 2016 and ALS in Val-d'Or, Québec was used from March 2016 to July 2019. Both are commercial laboratories independent of IAMGOLD with no interests in the Nelligan Project. Both laboratories received ISO/IEC 17025 accreditation through the Standards Council of Canada ("SCC").
11.3 Laboratory Preparation and Assays
This description applies to the IAMGOLD period, which was the only period for which InnovExplo had access to detailed procedures.
- Samples are received at the ALS facility where they are sorted, barcoded and logged into the ALS LIMS program;
- Samples are dried and weighed (WEI-21);
- Samples are crushed to +90% passing 2 mm (CRU-32);
- The crushed sample is split to 1,000 g with a riffle splitter (SPL-21);
- The sub-sample is then pulverized to 95% passing a 106 μm mesh (PUL-35a);
- A 50-g pulp aliquot is analyzed by fire assay ("FA") with atomic absorption ("AA") (Au-AA24);
- When assay results are higher than 5 g/t Au, a second 50-g pulp aliquot is re-assayed by FA with gravimetric finish (Au-GRA22);
- When assay results are higher than 10 g/t Au, metallic sieve analysis is completed from the 1 kg split or remaining reject and a new pulp is obtained and screen at 106 microns;
- If visible gold is observed during core logging, the sample is directly sent for metallic sieve. In that case, the entire sample is pulverized and assayed (Au-SCR24);
- Assay results are provided on Excel spreadsheets. All the results presented in the database come from the first analysis, with predominance of the metallic sieve value, then the gravimetric value when present.
11.4 Quality Assurance and Quality Control (Vanstar period)
For the Vanstar period, the insertion rate of control samples was extrapolated from the drill hole database because InnovExplo could not obtain details of the quality control procedures used at that time. Protocols included the insertion of blanks and standards (certified reference materials or "CRMs") and the reanalysis of coarse reject as pulp duplicates. About 4% of the samples were control samples included in the sampling and assaying process:
- An average of 2.5 blanks were inserted every 100 samples;
- An average of 1.3 standards were inserted every 100 samples; and
- 8% of the samples were re-assayed (pulp duplicates).
During this period, 2,944 samples, including 116 QA/QC samples, were submitted to the laboratories. The discussion below details the QA/QC results.
11.4.1 Certified reference materials (standards)
Four (4) CRMs were used to monitor the assaying results during the Vanstar period. According to information in the assay results database, the CRMs appear to have been randomly selected and inserted systematically into the sampling and assaying process. The purpose of standards is to monitor accuracy and detect assay problems with specific sample batches and long-term biases in the overall dataset.
Forty-one (41) standards were inserted into sample batches and sent to the laboratories during the Vanstar period. Table 11.1 shows the details for each CRM.
Although the insertion rates are low according to best practices, all results for the standards fall within three standard deviations (±3SD) of the target values (Rafini, 2013). The standards for the Project support the validity and reliability of the Vanstar data.
Table 11.1 - Results of standards from the Vanstar period
| CRM |
Lab. |
CRM
value
(g/t Au) |
Number inserted |
Average (g/t Au) |
Accuracy
% |
Precision
% |
Outliers |
Gross
outliers |
%
Passing
QC |
| SE58 |
Lab. Expert |
0.607 |
10 |
0.597 |
-1.7 |
1.7 |
0 |
0 |
100.0 |
| SG40 |
Lab. Expert |
0.976 |
9 |
0.987 |
1.1 |
1.4 |
0 |
0 |
100.0 |
| SP37 |
Lab. Expert |
18.14 |
14 |
18.105 |
-0.2 |
1.2 |
0 |
0 |
100.0 |
| SQ36 |
Lab. Expert |
30.04 |
8 |
29.939 |
-0.3 |
1.2 |
0 |
0 |
100.0 |
| TOTAL |
|
|
41 |
|
|
|
0 |
0 |
100.0% |
11.4.2 Blank samples
During the Vanstar period, blanks were made from an unknown material. Seventy-five (75) blanks were inserted in the sampling and assaying process to monitor whether contamination or sample cross-contamination had occurred during the process. Results are compiled in Figure 11.1. The most common industry standards for the exploration stages are thresholds of either 5 or 10 times the detection limit (Rafini, 2013). The fire assay detection limit at Laboratoire Expert Inc. ("Lab Expert") was 0.05 g/t Au.
No blanks used during the Vanstar period exceeded the "5 times" threshold limit (Figure 11.1).
The use of blanks was appropriate to monitor potential contamination during the Project's drilling programs. The blanks for the Project support the validity and reliability of the Vanstar data.

Figure 11.1 - Results of blanks from the Vanstar period (n=75)
11.4.3 Duplicates
Duplicates are used to check the representativeness of the results for a given population and to monitor precision during the preparation and analysis process. Sixty (60) pulp duplicates were analyzed by Lab Expert during the Vanstar period. The Vanstar QA/QC program did not include field or coarse duplicates.
Pulp duplicates are used to monitor proper preparation procedures during pulverization. By measuring the precision of pulp duplicates, the incremental loss of precision can be determined for the pulverization stage of the process, thus indicating whether two subsamples taken after pulverizing is sufficiently representative for the given pulverized particle size.
The pulp duplicates consist of second splits of the sample prior to the pulverization and homogenization. Both original and duplicate samples are assayed according to regular sample procedures.
During the Vanstar period, 234 duplicate pulps were assayed. Sixty (60) pairs of samples returned results greater or equal to 0.1 g/t Au. A study of these 60 pairs indicates a good reproducibility of gold values for all ranges of values within ±10 % of the regression line (Figure 11.2).
The duplicates for the Project support the validity and reliability of the Vanstar data.

Figure 11.2 - Results of pulp duplicates (>0.1 g/t) from the Vanstar period
11.5 Quality Assurance and Quality Control (IAMGOLD period)
QA/QC protocols have been followed by IAMGOLD since their first involvement in the Project and has included the insertion of blanks, standards and duplicates in the flow stream of core samples, accounting for a minimum of 5%. The protocols also include check assays at a secondary laboratory. During the IAMGOLD period, the overall insertion rate was 13%, according to the following protocol:
- One (1) blank at the start and end of every sample batch, and every 25 samples;
- One (1) standard every 25 samples;
- One (1) coarse duplicate every 50 samples, after the crushing and splitting step; and
- One (1) pulp duplicate every 50 samples, after the final pulverization step.
Both laboratories ran duplicates, standards and field blanks as part of their internal QA/QC programs.
A total of 30,442 samples, including 2,881 QA/QC samples, were submitted to the laboratories during IAMGOLD's period.
The discussion below details the results.
11.5.1 Certified reference materials (standards)
Sixteen (16) CRMs were used as standards during the IAMGOLD period. The CRMs were randomly selected. A total of 1,334 standards were inserted for an average insertion rate of 4.8% (Table 11.2). IAMGOLD's definition of a quality control failure is when CRM results are outside ±3SD.
Sixty-seven (67) CRM samples returned results above or below the ±3SD criterion. Twelve (12) of these problematic samples had insufficient material (NSS) and could not be re-assayed. Of the remaining 55 failures (as per IAMGOLD protocol), the project manager decided to re-assay 12 batches that had significant gold values; the problematic pulps were re-assayed along with 15 additional pulps before and after the sample identification number sequence. Once the results of the re-assaying were received, IAMGOLD staff determined that the original and the re-assay values were approximately the same. As a result, the original data remained the reference value, and no re-assay value was entered in the "Au final" column in the database.
In 2018, IAMGOLD switched from Rocklabs standards to OREAS standards to resolve the NSS issue, with an average of 0.1% NSS since switching.
The standards for the Project support the validity and reliability of the IAMGOLD data.
Table 11.2 - Results of standards from the IAMGOLD period
| CRM |
Laboratory |
CRM
value
(g/t Au) |
Number inserted |
Average (g/t Au) |
Accuracy
% |
Precision
% |
Outliers |
Gross
outliers |
% passing QC |
| OxF125 |
AGAT |
0.806 |
37 |
0.811 |
0.6 |
2.1 |
0 |
0 |
100.0 |
| Oxi121 |
AGAT |
1.834 |
6 |
1.757 |
-4.2 |
5.7 |
0 |
1 |
83.3 |
| Oxi121 |
ALS |
1.834 |
92 |
1.811 |
-1.3 |
2.4 |
0 |
3 (3 NSS) |
96.7 |
| SE68 |
ALS |
0.599 |
51 |
0.598 |
-0.1 |
3.5 |
1 |
1 |
96.1 |
| SF67 |
AGAT |
0.835 |
42 |
0.838 |
0.3 |
2.7 |
0 |
1 |
97.6 |
| SF67 |
ALS |
0.835 |
63 |
0.813 |
0.6 |
2.4 |
2 |
2 (2 NSS) |
93.7 |
| SF85 |
ALS |
0.848 |
27 |
0.826 |
-2.7 |
2.0 |
0 |
0 |
100.0 |
| SH82 |
ALS |
1.333 |
33 |
1.306 |
-2.0 |
4.3 |
0 |
1 |
97.0 |
| OxF125* |
ALS |
0.806 |
8 |
0.777 |
-3.6 |
2.8 |
0 |
0 |
100.0 |
| SK78 |
AGAT |
4.134 |
28 |
4.121 |
-0.3 |
2.2 |
0 |
0 |
100.0 |
| SK78 |
ALS |
4.134 |
83 |
4.090 |
-1.1 |
2.7 |
2 |
7 (6 NSS) |
89.2 |
| OREAS 215 |
ALS |
3.54 |
132 |
3.497 |
-1.2 |
3.3 |
5 |
1 |
96.2 |
| OREAS 217 |
ALS |
0.338 |
304 |
0.336 |
-0.4 |
2.9 |
12 |
1 |
96.1 |
| OREAS 220 |
ALS |
0.866 |
246 |
0.863 |
-0.4 |
2.8 |
8 |
2 (1 NSS) |
95.9 |
| OREAS 221 |
ALS |
1.062 |
175 |
1.073 |
1.1 |
2.9 |
4 |
1 |
97.1 |
| OREAS 229 |
ALS |
12.11 |
7 |
11.914 |
-1.6 |
9.2 |
0 |
0 |
100.0 |
| TOTAL |
|
|
1334 |
|
|
|
34 |
21 (12 NSS) |
95.0% |
| 95.9% |
NSS: Not sufficient sample
11.5.2 Blank samples
During the IAMGOLD period, field blanks were made of barren rock (decorative quartz pebbles). Each sample of the blank material was placed into a plastic sample bag and given a sample identification number. Blanks were sent to both laboratories and went through the same sample preparation and analytical procedures as the core samples.
A total of 1,423 blank samples (5% insertion rate; 1 in 20 samples) were inserted in the batches analysed during the IAMGOLD period, and the results are compiled in Figure 11.3 and Figure 11.4. According to IAMGOLD's quality control protocol, if any blank yields a gold value above 10x the detection limit (0.02 ppm for AGAT and 0.05 ppm for ALS), then the pulps for the five (5) samples before and after in the sample identification number sequence are re-assayed. Once the re-assay results are received, IAMGOLD staff checks whether the value of the blank is below 10x the detection limit and that the samples results are approximately the same between the original data and the re-assay data. If these conditions are met, the original data remains the reference value and no re-assay value is entered in the "Au final" column in the database. If the blank fails but no significant gold values are present in the original certificate, the project manager can decide to treat it as an exception and not re-assay.
Seven (7) blanks exceeded the recommended threshold (5 at AGAT and 2 at ALS), representing 0.5% of the failures for the IAMGOLD period.
The blanks for the Project support the validity and reliability of the IAMGOLD data.

Figure 11.3 - Results of blanks from the IAMGOLD period, from AGAT (n=122)

Figure 11.4 - Results of blanks from the IAMGOLD period, from ALS (n=1301)
11.5.3 Duplicates
During the IAMGOLD period, 2,396 duplicates were analyzed: 825 coarse duplicates and 1,571 pulp duplicates The IAMGOLD QA/QC program did not include field duplicates.
11.5.3.1 Coarse-reject duplicates
A total of 825 coarse duplicates were assayed (2.71% of the total samples assayed). The insertion rate was 1 in 25 samples from 2015 to 2017, and 1 in 50 samples for the 2018 and 2019 programs.
Figure 11.5 plots 444 coarse duplicate pairs with gold values greater or equal to 0.1 g/t. One pair was interpreted as an outlier and was removed (17.15 g/t Au, 24.0 g/t Au). The results indicate a good reproducibility of gold values for all values within ±10% of the regression line.
The coarse duplicates for the Project support the validity and reliability of the IAMGOLD data.

Note: One pair was interpreted as an outlier and was removed (17.15 g/t Au, 24.0 g/t Au)
Figure 11.5 - Results of coarse duplicates (>0.1 g/t) from the IAMGOLD period
11.5.3.2 Pulp duplicates
During the IAMGOLD period, 1,571 pulp duplicates were assayed (5.16% of the assays). The insertion rate was 1 in 10 samples from 2015 to 2017 and 1 in 50 samples for the 2018 and 2019 programs.
A total of 751 pulp duplicate pairs with gold values greater or equal to 0.1g/t were plotted in Figure 11.6. Two (2) pairs, interpreted as gross outliers, were removed. The results indicate a good reproducibility of gold values for all the range of values within ±10% of the regression line.
The pulp duplicates for the Project support the validity and reliability of the IAMGOLD data.
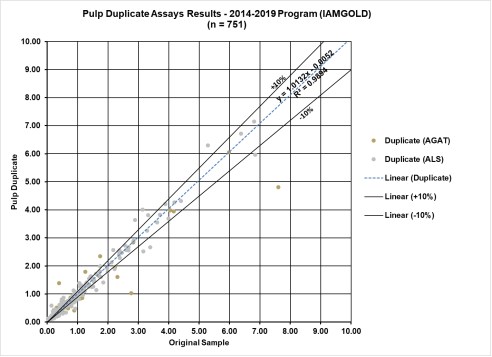
Figure 11.6 - Results of pulp duplicates (>0.1 g/t) from the IAMGOLD period
11.5.4 Check assays
During the IAMGOLD period, 1 in 20 samples (5%) were routinely selected and sent to a secondary laboratory to assess the accuracy of the assays. The check-assay was a pulp subsample. ALS acted as the umpire laboratory when AGAT was chosen as the principal laboratory during the 2015 drilling program. Since 2016, AGAT has acted as the umpire laboratory, with ALS as the principal laboratory.
For the 2015 program, 59 samples were sent to ALS as check assays (including standards, blanks and duplicates). Fifty-five (55) results with gold greater or equal to 0.1 g/t are plotted in Figure 11.9 (the plot does not include 3 gross outliers with a calculated difference of 300% or more between the duplicate and the original sample). The results indicate an average reproducibility of gold values. The linear regression equation falls above the +10% limit from the ideal (Y=X), and 41.8% of the data plots outside this interval, which explains an R2 value of 0.846.

Figure 11.7 - Results of check assays (>0.1 g/t) from the IAMGOLD period, with AGAT as the primary laboratory
Of the 1,128 check assays sent to AGAT as the umpire laboratory, 626 had gold values greater or equal to 0.1 g/t and these are plotted in Figure 11.10 (the plot does not include 3 gross outliers with a calculated difference of 300% or more between the check assay subsample and the original sample). The results indicate a good reproducibility of gold values. The linear regression equation falls within the ±10% interval of the ideal (Y=X), and 28.0% of the data plots outside this interval; the data is closely fitted to the regression line (R2=0.9281).
The check assay results for the Project support the validity and reliability of the IAMGOLD data.

Figure 11.8 - Results of check assays (>0.1 g/t) from the IAMGOLD period, with ALS as the primary laboratory
11.6 Conclusions
InnovExplo is of the opinion that the sample preparation, security, analysis, and QA/QC protocols used during the drilling programs on the Project follow generally accepted industry standards, and that the data is valid and of sufficient quality for a mineral resource estimation.
12. DATA VERIFICATION
This item covers InnovExplo's verification of the diamond drill hole database used for the 2019 MRE (the "IAMGOLD database").
All drill hole results from the Winter 2019 drilling program (the latest program completed on the Project) were available for verification. The database close-out date for the 2019 MRE is July 23, 2019.
InnovExplo's data verification included visits to the Project (including drill sites and the core logging and storage facilities), as well as an independent review of the data for selected drill holes (surveyor certificates, assay certificates, QA/QC program and results, downhole surveys, lithologies, alteration and structures).
12.1 Historical work
Of the 12 historical drill holes, 11 were excluded from the 2019 MRE database. The historical information used in this report was taken in part from reports produced before the implementation of NI 43-101. Little information is available about sample preparation, analytical or security procedures in the reviewed documents from the historical period. InnovExplo assumes that exploration activities conducted by previous companies were in accordance with prevailing industry standards at the time.
12.2 IAMGOLD database
12.2.1 Coordinate system
The coordinate system for the GEMS project is NAD83 UTM Zone 18.
12.2.2 Drill hole location
A total of 92 of the 140 holes have been professionally surveyed by Paul Roy, Land Surveyor of Chibougamau. Some location errors were detected between the database and the coordinates on the surveyor's reports, and these were corrected. They were likely the result of mistakes during automated data input. Post-input validation procedures would help avoid this kind of error. Seven (7) casings were validated during the site visit using a GPSMAP 76CSx (Figure 12.1). The differences between InnovExplo measurements and those recorded in the IAMGOLD database are within the order of precision of the instrument. The authors concluded that the collar locations are adequate and reliable.

A) Photograph showing the GPSMAP 76CSx used to verify the location of the NE-16-49 drill collar during the site visit. B) Photograph showing the measured azimuth, with a compass, at the collar of NE-16-49.
Figure 12.1 - Drill hole location validation (site visit, 2019)
12.2.3 Down-hole Survey
Downhole surveys were systematically conducted on the holes retained for the 2019 MRE database. The following methods and instruments were used for the surveys: Acid, Pajari (historical period), Flexit (Vanstar period), single-shot (IAMGOLD period) and multi-shot downhole surveys (IAMGOLD period since 2015). Down-hole survey information was verified for all DDHs and minor issues were identified and corrected. The survey data are considered valid and reliable.
12.2.4 Assays
InnovExplo was granted access to the original assay certificates (.csv and .pdf files) for all holes drilled by Vanstar and IAMGOLD (2012 to 2019). For the historical period, the assay certificates from only one (1) hole (95-19) were retrieved, the 11 remaining historical holes were discarded.
The assay results in the database were compared to the original laboratory certificates. The laboratory sends the results via e-mail and IAMGOLD's protocol of electronically transferring the emailed results into the database allows for immediate error detection and prevents typing errors.
Minor errors of the type normally encountered in a project database were found and corrected. The final database is considered to be of good overall quality. InnovExplo considers the database for the Project to be valid and reliable.
12.3 Logging, Sampling and Assaying Procedures (IAMGOLD)
InnovExplo reviewed several sections of mineralized core while visiting the onsite core logging and core storage facilities. All core boxes were labelled and properly stored outside. Sample tags were still present in the boxes and it was possible to validate sample numbers and to confirm the presence of mineralization in witness half-core samples from the mineralized zones (Figure 12.2). InnovExplo is of the opinion that the protocols in place are adequate.

A) Certified reference materials; B) Sample tags stapled in core boxes with length and depth of sample indicated; C) Proper labelling of the drill core boxes; D) Core from the on-going drilling campaign stored outdoors at the Chibougamau facility; E) Core reception and logging facility in Chibougamau.
Figure 12.2 - Core logging facilities at the Nelligan Project
12.4 Independent Resampling
InnovExplo selected a series of intervals from the 2018 drilling program for the resampling. During the QPs site visit, quarter-splits of selected core intervals were sawed by IAMGOLD personnel. InnovExplo bagged the samples and transported them to ALS to be analyzed.
The resampling results indicate a good reproducibility of the original sample assay results. InnovExplo believes the field duplicate results from the independent resampling program are reliable and valid for a gold project.
Table 12.1 shows the resampling results for the seven (7) samples.
Figure 12.4 shows the regression plot of the seven (7) original-duplicate pairs.
Table 12.1 - Independent resampling
| Original (IMG) |
Field Duplicate (IE) |
Δ |
Zone |
| Sample Number |
Au
(ppm) |
Sample Number |
Au (AA26E) (ppm) |
Au (GRA22) (ppm) |
Au
(%) |
| IMGVD13236 |
15.65 |
W035451 |
14.25 |
15.85 |
1.28 |
Renard-HG |
| IMGVD13254 |
1.79 |
W035452 |
1.66 |
- |
-7.00 |
Renard-HG |
| IMGVD12220 |
2.40 |
W035453 |
1.5 |
- |
-37.50 |
Renard-HG |
| IMGVD12705 |
1.90 |
W035454 |
2.54 |
- |
33.68 |
Liam-HG |
| IMGVD14508 |
1.60 |
W035455 |
2.07 |
- |
24.70 |
36-C |
| IMGVD12611 |
0.33 |
W035456 |
2.02 |
- |
504.79 |
Dan-N |
| IMGVD13338 |
2.04 |
W035457 |
1.81 |
- |
-11.27 |
Renard-HG |

Figure 12.3 - Regression plot of the independent resampling results
12.5 Conclusion
InnovExplo's data verification demonstrates that the data and protocols for the Project are acceptable. InnovExplo considers the IAMGOLD database to be valid and of sufficient quality for a mineral resource estimate.
13. MINERAL PROCESSING AND METALLURGICAL TESTING
In 2019, basic metallurgical, mineralogical and environmental testwork was carried out on samples from the two main zones of the Project by SGS Minerals. Three (3) composites were used: 2 from the Renard Zone and 1 from Zone 36.
Mineralogy testing included a characterization for screened metallic for Au and Ag, sulphur, whole rock analysis (ICP method), and graphitic carbon. A gold deportment study was also completed to provide information on gold distribution, grain size, and metallic and mineral associations. Metallurgical testing included standard pre-robbing tests (Whole + CIL), flotation followed by cyanidation of the tails (Flotation + CN), gravity separation followed by gravity tailing cyanidation (Gravity + CN Gravity Tails), and whole-ore cyanidation (Whole + CN). Environmental testing included acid-base accounting (ABA).
The gold deportment study results showed that gold is primarily contained within pyrite. For composite 1, 38.5% was locked in the mineral; for composite 2, 21.7%; and for composite 3, 64%. The study also showed that composite 3, from Zone 36, contains finer gold compared to the Renard Zone composites (Table 13.1).
Table 13.1 - Gold deportment study (Deshaies, 2019)
| Sample ID |
Gold grade (g/t Au) |
Association |
Number of Gold grains |
Gold distribution (%) |
Size range (µm) |
Average size (µm) |
Gold mineral abundance |
Minerals associated with exposed and locked Au-minerals |
| Comp 1 |
1.18 |
Liberated |
20 |
30.0 |
0.6 - 53.2 |
10.9 |
Native Gold (~83%), Calaverite (~13%), Electrum (~3%), Pertzite, and Au-Ag-Hg (~1%) |
Altaite/Pyrite (41.9%), Pyrite (40.2%), Dolomite (13.1%), Barite (3.5%), and Tennantite/Pyrite, FeAs/Altaite, Sulphur/Pyrite (<1%) |
| Exposed |
51 |
31.4 |
0.6 - 37.3 |
3.3 |
| Locked |
76 |
38.5 |
0.6 - 4.4 |
1.6 |
| |
147 |
100 |
|
3.5 |
| Comp 2 |
1.36 |
Liberated |
17 |
20.3 |
1.0 - 32.8 |
8.0 |
Native Gold (~73%), Calaverite (~9%), Pertzite (~8%), Au-Te (~6%), Sylvanite (2%), and other gold minerals (~2%) |
Pyrite (45.0%), Silicates (19.4%), Calcite (9.91%), Altaite/Silicates (8.74%), Altaite/Pyrite (5.95%), Sulphur/Silicates (3.17%), Tennantite/Pyrite (3.07%), Altaite/Calcite (2.14%), and other gold minerals (<2%) |
| Exposed |
49 |
58.0 |
0.6 - 7.9 |
2.3 |
| Locked |
108 |
21.7 |
0.6 - 6.7 |
1.6 |
| |
174 |
100 |
|
2.4 |
| Comp 3 |
0.80 |
Liberated |
5 |
18.1 |
1.1 - 28.8 |
8.0 |
Native Gold (~75%), Au-Ag-Te (~11%), Pertzite (~10%), Calaverite (~2%), and other gold minerals (~2%) |
Pyrite (62.7%), Dolomite (24.5%), Silicates/Pyrite (5.44%), Chalcopyrite/Pyrite (4.15%), and trace amounts (<2%), of Silicates, Dolomite/Pyrite, Rutile/Chalcopyrite/Pyrite, Rutile/ Iron oxides/Pyrite, Tennantale/Pyrite |
| Exposed |
26 |
18.2 |
0.8 - 4.1 |
2.1 |
| Locked |
104 |
63.7 |
0.6 - 6.6 |
1.5 |
| |
135 |
100 |
|
1.8 |
Following this study, several scenarios were performed to try to improve the gold recovery. The best results were obtained using the flotation scenario with a recovery of about 94% of the sulphides and 84% of the gold in the concentrate with an average mass pull of 17%. With 16% gold remaining in the flotation tails, it is necessary to also cyanide the tails to verify the possibility of extracting more. Thus, by regrinding the concentrate to 10 µm and separately leaching the concentrate and tails, it was possible to enhance the gold recovery rate as shown in Table 13.2 (Deshaies, 2019).
Table 13.2 - Gold recovery rate according to the scenarios tested (Deshaies, 2019)
| Tests |
Au Recovery (%) |
| Flotation+CN (tails 53 µm +Conc10 µm) |
Whole+CIL (53 µm) |
Whole+CN (53 µm) |
Whole+CN (75 µm) |
Gravity+CN Gravity Tails (53 µm) |
| 500 ppm |
500 ppm |
1000 ppm |
500 ppm |
500 ppm |
1000 ppm |
| Zone Renard |
Comp 1 |
90.4 |
80.7 |
81.7 |
83.5 |
79.8 |
85.3 |
80.5 |
| Comp 2 |
93.5 |
86.1 |
86.0 |
86.1 |
83.2 |
88.9 |
87.6 |
| Zone 36W |
Comp 3 |
78.1 |
71.0 |
72.4 |
74.3 |
67.1 |
78.3 |
77.8 |
Combined with the gold deportment, results showed that to be able to access the gold, which is very fine, and a significant percentage is contained in the minerals, it would be necessary to proceed with an ultra-fine particle grinding which would be too expensive to realize on the all-coming. The most economical alternative is to flotation the ore and then to regrind the concentrate before leaching it (Deshaies, 2019).
Further metallurgical testing should be performed to clarify the recovery potential of the Project and a diagnostic leach should also be completed on the CN tails. The comminution tests should also be done. IAMGOLD's metallurgist recommends a fixed gold recovery at 92% (average of the Renard zone composites) until a more representative metallurgical testing is completed. The metallurgist also recommends using a milling operating cost value of 12 CAD/t, which would also include the tailing management for annual tonnage ranging from 8 to 10 Mtpa.
14. MINERAL RESOURCE ESTIMATES
The 2019 Mineral Resource Estimate for the Nelligan Project (the "2019 MRE") was prepared by Vincent Nadeau-Benoit, P.Geo. and Alain Carrier, M.Sc., P.Geo., both of InnovExplo, using all available information.
The main objective of the mandate assigned by IAMGOLD was to prepare the initial compliant mineral resource estimate for the Project, including the Renard, Liam, Dan and 36 zones.
The mineral resources herein are not mineral reserves as they do not have demonstrated economic viability. The effective date of this mineral resource estimate is October 2, 2019.
14.1 Methodology
The 2019 MRE covers a strike length of 3.5 km and a width of approximately 1.5 km, down to a vertical depth of 500 m below surface.
The model was prepared using LeapFrog Geo™ v.4.5 ("LeapFrog") and GEOVIA GEMS v.6.8 ("GEMS"). LeapFrog was used to model the mineralized zones and fault wireframes. GEMS was used for the estimation, which consisted of 3D block modelling and grade interpolation. Statistical studies, capping and variography were completed using Snowden Supervisor v.8.9.0 ("Supervisor") and Microsoft Excel.
The main steps in the methodology were as follows:
- Compile and validate the database for the diamond drill holes used in the mineral resource estimate;
- 3D modelling of the mineralized zones and the faults affecting density;
- Drill hole intercepts and composite generation for each mineralized zone;
- Basic statistics;
- Geostatistical analysis including variography;
- Block modelling and grade interpolation;
- Block model validation;
- Establish resource classification criteria and clipping areas to classify the mineral resources;
- Assess the "reasonable prospect for economic extraction" and select the appropriate cut-off grades; and
- Generate a mineral resource statement.
14.2 Drill Hole Database
The Nelligan database (in Microsoft Access Database format (*.accdb) but generated by GEMS) was provided on July 23, 2019, which is the database close-out date and includes all drill holes completed up to the end of the Winter 2019 drilling program. It contains a total of 191 drilled surface holes. Of these 191 drill holes, 176 informed the 2019 MRE (the "resource database"; Figure 14.1).

Figure 14.1 - Plan view of the validated diamond drill holes used for the 2019 MRE
14.3 Geological Model
14.3.1 Fracture domains and faults
Following a review and analysis of surface geophysical data, structural drill hole data, core recoveries and RQD, and a regional interpretation, InnovExplo identified six (6) highly fractured domains within the boundaries of the 2019 MRE (Figure 14.2). They were named Fault 1 to 6 and were modelled as 3D solids in Leapfrog.
Fault 1 and Fault 3 correlate with multiple brittle structures (core not recovered (CNR), heavy fracturing, fault gouge) and intervals of low RQD (ranging from 0-20%) intersected in-hole, and they were built are interpreted in 3D as internally continuous domains.
Fault 5 (in red, Figure 14.2), was interpreted by the QP and added to the model. Fault 5 represents a significant area of low RQD and thick intervals of CNR in eight (8) contiguous holes. This fault is subparallel to the drilling sections.
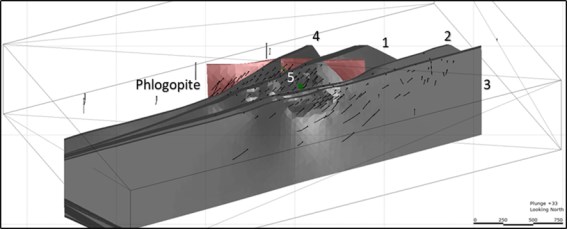
Figure 14.2 - Fractured domains and fault model for the Nelligan Project
14.3.2 Mineralized Zones
The mineralized zone model comprises four (4) gold-bearing zones (Dan, Liam, 36 and Renard) subdivided into eleven (11) domains for estimation purposes. The zones and domains were interpreted directly in 3D on a hole-by-hole basis. IAMGOLD's 2018 internal 3D model was used as a guideline to complete the current model.
Alteration seems to be the main control on gold mineralization. The modelled zones were created according to alteration type (or assemblage) and intensity, and on gold grade continuity within each zone. A minimum true thickness of 3.0 m was used.
Two distinct high-grade domains (Renard-HG inside Renard-1 and Liam-HG inside Liam) were modelled to better constrain higher gold values.
Two surfaces were also created to define topography and bedrock. The topography surface was created from CanVec data from Natural Resources Canada and refined with professionally surveyed hole collars. The bedrock surface was generated using casing depths. A waste solid was also created corresponding to the block model boundaries.
14.4 High-grade Capping
Basic univariate statistics were performed on the overall assay data and on datasets grouped by individual domains (Table 14.1). The capping on raw assays consisted of a single top cap of 30 g/t Au for the Renard-HG domain and 15 g/t Au for all other zones and domains. The capping values were selected by combining the dataset analysis (COV, decile analysis, metal content) with the probability plot, the log normal grade distribution (Figure 14.3, Figure 14.4), and the proximity to Fault 1, Fault 3 and Fault 5.
A cap of 2.5 g/t Au was applied to some exceptional sample intervals characterized by very poor recovery and sample lengths exceeding 2.0 m. These samples are found in the highly fractured domains of Faults 1, 3 and 5. Drilling in those areas resulted in frequent and significant intervals of poor unrecovered core, causing excessively long sample lengths.
Table 14.1- Summary statistics for raw assays by zone
| Zone |
Domains |
Number of samples |
Max (Au g/t) |
Mean (Au g/t) |
Standard deviation |
COV |
| Dan |
Dan-Sud |
151 |
16.80 |
0.59 |
1.58 |
2.70 |
| Dan-Central |
310 |
22.50 |
0.93 |
2.08 |
2.24 |
| Dan-Nord |
820 |
8.70 |
0.42 |
0.94 |
2.26 |
| Liam |
Liam-HG |
429 |
16.15 |
1.41 |
1.91 |
1.35 |
| Liam |
924 |
8.91 |
0.25 |
0.57 |
2.23 |
| Liam-Nord |
375 |
8.06 |
0.32 |
0.71 |
2.20 |
| 36 |
36-Central |
333 |
16.50 |
0.80 |
1.67 |
2.09 |
| 36-Nord |
182 |
39.80 |
0.76 |
2.98 |
3.92 |
| Renard |
Renard-HG |
5,755 |
79.40 |
1.02 |
2.56 |
2.51 |
| Renard-2 |
2,981 |
38.50 |
0.48 |
1.31 |
2.75 |
| Renard-1 |
9,103 |
224.00 |
0.38 |
2.44 |
6.37 |
In the IAMGOLD database, 387 samples are from intervals with core recoveries below 60% (a value considered 'unreliable' to 'unacceptable' according to Annels and Dominy, 2003; Table 14.2) and 247 samples have a length exceeding 2.0 m.
In order to minimize the impact of these less reliable 634 samples in the 2019 MRE, an aggressive capping value of 2.5 g/t Au was applied to minimize the possibility of over-estimation on a local basis. Sixteen (16) of the 634 samples were capped at 2.5 g/t Au.
Figure 14.5 presents an example of a sample from an interval with low core recovery.
Table 14.3 presents the summary statistics for capped assays by zone.
Table 14.2 - Confidence rating of core recovery values (Annels and Dominy, 2003)
| Core recovery (CR%) |
Rating |
Description |
| > 85% |
4 |
High confidence |
| 60-84% |
3 |
Moderately reliable |
| 30-59% |
2 |
Unreliable |
| < 30% |
1 |
Unacceptably low |

Figure 14.3 - Graphs supporting a capping value of 15 g/t Au for the Renard 1 domain

Figure 14.4 - Graphs supporting a capping value of 30 g/t Au for the Renard HG domain
Table 14.3 - Summary statistics for capped assays per zone
| Zone |
Domains |
Capping value
(Au g/t) |
Number of samples capped |
Percent of samples capped |
Mean
(Au g/t) |
COV |
Metal loss factor
(%) |
| Dan |
Dan Sud |
15 |
1 |
0.66 |
0.57 |
2.55 |
1.05 |
| Dan Central |
15 |
2 |
0.65 |
0.90 |
2.04 |
2.93 |
| Dan Nord |
15 |
0 |
0.00 |
0.42 |
2.26 |
0.00 |
| Liam |
Liam HG |
15 |
1 |
0.23 |
1.41 |
1.34 |
0.16 |
| Liam |
15 |
0 |
0.00 |
0.25 |
2.23 |
0.00 |
| Liam Nord |
15 |
0 |
0.00 |
0.32 |
2.2 |
0.00 |
| 36 |
36 Central |
15 |
1 |
0.30 |
0.79 |
2.05 |
0.44 |
| 36 Nord |
15 |
1 |
0.55 |
0.63 |
2.04 |
8.61 |
| Renard |
Renard HG |
30 |
7 |
0.12 |
0.99 |
2.03 |
2.59 |
| Renard 2 |
15 |
4 |
0.13 |
0.46 |
2.04 |
2.78 |
| Renard 1 |
15 |
2 |
0.02 |
0.36 |
1.66 |
7.23 |

Figure 14.5 - Example of sample length exceeding 1.5 m with low core recovery
14.5 Compositing
In order to minimize any bias introduced by variable sample lengths, the gold assays of the DDH data were composited within each of the mineralized veins. The thickness of the mineralized veins, the proposed block size, and the original sample length were taken into consideration for the selected composite length, which was set at 3 m. All intervals defining each of the mineralized domains were composited to 3-m equal lengths. A grade of 0.00 g/t Au was assigned to missing sample intervals. A total of 9,870 composites were generated within the mineralized domains.
Table 14.4 presents the summary statistics for the composites per zone.
Table 14.4 - Summary statistics for composites by zone
| Zone |
Domains |
Number of samples |
Max
(Au g/t) |
Mean
(Au g/t) |
Standard deviation |
COV |
| Dan |
Dan Sud |
74 |
3.84 |
0.43 |
0.68 |
1.59 |
| Dan Central |
114 |
8.25 |
0.82 |
1.18 |
1.45 |
| Dan Nord |
392 |
5.18 |
0.34 |
0.61 |
1.81 |
| Liam |
Liam HG |
174 |
6.51 |
1.34 |
1.26 |
0.94 |
| Liam |
409 |
4.06 |
0.23 |
0.36 |
1.52 |
| Liam Nord |
175 |
3.11 |
0.28 |
0.50 |
1.77 |
| 36 |
36 Central |
135 |
6.62 |
0.73 |
0.97 |
1.32 |
| 36 Nord |
81 |
4.14 |
0.54 |
0.69 |
1.27 |
| Renard |
Renard HG |
2,621 |
19.83 |
0.96 |
1.41 |
1.47 |
| Renard 2 |
1,416 |
7.54 |
0.42 |
0.58 |
1.39 |
| Renard 1 |
4,279 |
7.17 |
0.35 |
0.42 |
1.21 |
14.6 Bulk Density
Bulk densities are used to calculate tonnage from the estimated volumes in the resource-grade block model.
Specific bulk gravity ("SG") started being measured in 2018 on the Project (1,652 measurements). Eleven (11) holes drilled before 2018 also have SG measurements (209 measurements). IAMGOLD used standard water immersion methods on core samples. Measurements were taken at least every 30 m or closer if there was a change in major lithologies.
Table 14.5 provides a breakdown of SG measurements by zone.
Table 14.5 - Mean measured value for bulk specific gravity per domain
| Zone |
Domain |
Number of samples |
Mean (g/cm3) |
| Outside zones |
|
470 |
2.758 |
| Dan |
Dan Sud |
14 |
2.763 |
| Dan Central |
9 |
2.734 |
| Dan Nord |
3 |
2.501 |
| Liam |
Liam HG |
26 |
2.749 |
| Liam |
8 |
2.665 |
| Liam Nord |
14 |
2.734 |
| 36 |
36 Central |
19 |
2.712 |
| 36 Nord |
12 |
2.656 |
| Renard |
Renard HG |
166 |
2.703 |
| Renard 2 |
599 |
2.733 |
| Renard 1 |
521 |
2.733 |
| Total |
|
1,861 |
2.735 |
An average bulk density of 2.73 g/cm3 was selected based on the SG results and the geological similarity between the zones and the domains. This value was applied to all blocks except those for which more than 50% falls within the 3D solids of Fault 1, 3 and 5; these highly fractured domains were assigned a bulk density of 2.20 g/cm3.
Overburden was attributed a bulk density of 2.00 g/cm3.
14.7 Block Model
A block model was established to cover the 2019 MRE area, including a buffer zone sufficient to host an open pit. The 2019 MRE block model corresponds to a multi-folder percent block model in GEMS and was rotated 25° to the west. All blocks with more than 0.01% of their volume falling within a selected solid were assigned the corresponding solid block code in their respective folder. A percent block model was generated, reflecting the proportion of every block inside each solid (i.e., individual mineralized zones, dilution envelope, overburden, and waste).
The block model origin is the lower left corner. Block dimensions reflect the sizes of mineralized zones and plausible mining methods. Table 14.6 provides the block model properties.
Table 14.7 provides details about the naming convention for the corresponding GEMS solids, as well as the rock codes and precedence assigned to each individual solid.
Table 14.6 - Block model properties
| Properties |
X (Columns) |
Y (Rows) |
Z (Levels) |
| Origin coordinates (UTM NAD 83 Zone 18) |
521,600 |
5,472,000 |
495 |
| Number of blocks |
400 |
250 |
69 |
| Block size (m) |
10 |
10 |
10 |
| Block extent (m) |
4,000 |
2,500 |
690 |
| Rotation |
25° to the west |
Table 14.7 - Block model naming convention and rock codes
| Workspace |
Description |
Rock code |
GEMS Triangulation Name |
Precedence |
| NAME1 (Block Code) |
NAME2 |
NAME3 |
| Mineralized Domains |
Dan Sud |
100 |
100 |
DAN_S |
20190819 |
100 |
| Dan Central |
101 |
101 |
DAN_CENT |
20190819 |
101 |
| Dan Nord |
102 |
102 |
DAN_N |
20190819 |
102 |
| Liam HG |
110 |
110 |
LIAM_HG |
20190819 |
110 |
| Liam |
111 |
111 |
LIAM |
20190819 |
111 |
| Liam Nord |
112 |
112 |
LIAM_N |
20190819 |
112 |
| 36 Central |
120 |
120 |
36_CENT |
20190819 |
120 |
| 36 Nord |
121 |
121 |
36_N |
20190819 |
121 |
| Renard HG |
130 |
130 |
RENARD |
20190819 |
130 |
| Renard 2 |
131 |
131 |
RENARDHG |
20190819 |
131 |
| Renard 1 |
132 |
132 |
RENARD2 |
20190819 |
132 |
| Lithologies |
Dilution |
Waste |
999 |
Waste |
20190819 |
999 |
| Overburden |
OVB |
6 |
OVB |
20190819 |
6 |
14.8 Variography and Search Ellipsoids
14.8.1 Variography
Three-dimensional directional variography was carried out in Snowden Supervisor on capped composites grouped as follows:
- DAN_ALL: all three (3) Dan domains;
- LIAM36: all three (3) Liam domains and the two (2) Zone 36 domains;
- RENARD2: the Renard 2 domain;
- RENARD1: the Renard 1 and Renard HG domains; and
- WAST_999: the dilution (the Waste domain).
Performed in connection with the geological knowledge of the deposit, the main steps in the variography process are:
- Examine the strike, dip and dip plane of the mineralized zones to define the direction and plunge of the best continuity in the mineralization;
- Estimate the nugget effect (C0) based on the downhole variogram;
- Model the major, semi-major and minor axes of continuity.
Table 14.8 documents the variogram model parameters of each domain group.
Figure 14.6 shows examples of the variography study for each domain group.
Table 14.8 - Variogram model parameters by domain group
| Dataset |
Variogram Components |
| Nugget (C0) |
First Structure - Spherical |
Second Structure - Spherical |
| Sill |
Range |
Sill |
Range |
| X (m) |
Y (m) |
Z (m) |
X (m) |
Y (m) |
Z (m) |
| DAN_ALL |
0.40 |
0.60 |
55 |
55 |
25 |
- |
- |
- |
- |
| LIAM36 |
0.40 |
0.60 |
70 |
45 |
20 |
- |
- |
- |
- |
| RENARD2 |
0.40 |
0.60 |
90 |
90 |
45 |
- |
- |
- |
- |
| RENARD1 |
0.40 |
0.07 |
80 |
47 |
58 |
0.46 |
140 |
120 |
70 |
| WAST_999 |
0.40 |
0.60 |
55 |
55 |
25 |
- |
- |
- |
- |

Figure 14.6 - Variography study and search ellipsoid ranges by domain group
The 3D variography yielded the best-fit model along an orientation that roughly corresponds to the strike and dip of the mineralized zones. This best-fit model was adjusted to fit the mean orientation of each mineralized zone.
14.8.2 Search Ellipsoids
Five (5) sets of search ellipsoids were built using the ranges of the best-fit variogram model for each domain group.
The interpolation strategy involved three (3) cumulative passes (except for WAST_999 which had only 1 pass) characterized by increasing search ranges. The ranges of the search ellipsoids correspond to 1x the variography range results for the first interpolation pass, 1.5x the variography results for the second pass, and 2x the variography results for the third and last pass.
Table 14.9 summarizes the parameters of the search ellipsoids used to select composites. Figure 14.7 to Figure 14.10 show examples of the ellipsoids in isometric views.
Table 14.9 - Search ellipsoid parameters
| Domain group |
Block code |
Search
Ellipse |
Orientation |
Ranges |
| Az. |
Dip |
Az. |
X (m) |
Y (m) |
Z (m) |
| DAN_ALL |
100, 101, 102 |
Pass 1 |
67 |
-19 |
17 |
55.0 |
55.0 |
25.0 |
| Pass 2 |
82.5 |
82.5 |
37.5 |
| Pass 3 |
110.0 |
110.0 |
50.0 |
| LIAM36 |
110, 111, 112, 120, 121 |
Pass 1 |
54 |
28 |
276 |
70.0 |
45.0 |
20.0 |
| Pass 2 |
105.0 |
67.5 |
30.0 |
| Pass 3 |
140.0 |
90.0 |
40.0 |
| RENARD2 |
131 |
Pass 1 |
60 |
17 |
124 |
90.0 |
90.0 |
45.0 |
| Pass 2 |
135.0 |
135.0 |
67.5 |
| Pass 3 |
180.0 |
180.0 |
90.0 |
RENARD1
|
130, 132 |
Pass 1 |
102 |
-59 |
79 |
80.0 |
47.0 |
58.0 |
| Pass 2 |
120.0 |
70.5 |
87.0 |
| Pass 3 |
160.0 |
94.0 |
116.0 |
| WAST_999 |
999 |
Pass 1 |
67 |
-19 |
17 |
55.0 |
55.0 |
25.0 |
| Pass 2 |
|
|
|
|
|
|
| Pass 3 |
|
|
|
|
|
|

DAN_ALL search ellipsoid, first pass
Figure 14.7 - Isometric view of the search ellipsoid used for the Dan Zone

RENARD2 search ellipsoid, first pass
Figure 14.8 - Isometric view of the search ellipsoid used for the Renard-2 domain in the Renard Zone

RENARD1 search ellipsoid, first pass
Figure 14.9 - Isometric view of the search ellipsoid used for the Renard-1 and Renard-HG domains in the Renard Zone

LIAM36 search ellipsoid, first pass
Figure 14.10 - Isometric view of the search ellipsoid used for the Liam and 36 zones
14.9 Grade Interpolation
The interpolation profiles were customized for the eleven (11) mineralized domains using hard boundaries.
The variography study provided the parameters used to interpolate the grade model using capped composites. The interpolation was run on a point area workspace extracted from the 3m composite dataset (flagged by domains) in GEMS. A cumulative 3-pass search was used for the resource estimate.
The ordinary kriging ("OK") method was selected for the final resource estimate as it better honours the raw assays and composites grade distribution for the deposit.
The strategy and parameters used for the grade estimation are summarized in Table 14.10.
Table 14.10 - Interpolation strategy for grouped domains
| Grouped Domains |
Pass |
Number of Composites |
| Min |
Max |
Max per Hole |
| LIAM36 |
1 |
4 |
12 |
3 |
| 2 |
3 |
12 |
2 |
| 3 |
2 |
12 |
1 |
| DAN_ALL, RENARD1, RENARD2, WAST_999 |
1 |
7 |
24 |
6 |
| 2 |
6 |
24 |
5 |
| 3 |
2 |
24 |
1 |
14.10 Block Model Validation
The block models were validated visually and statistically.
A visual comparison between block model grades, composite grades and gold assays was conducted on sections, plans and longitudinal views for both densely and sparsely drilled areas. No significant differences were observed during the comparison and it generally provided a good match in grade distribution without excessive smoothing in the block model. The visual validation confirmed that the block model honours the drill hole composite data (Figure 14.11).
A Nearest Neighbor (NN) model and an Inverse Distance Squared (ID2) model were also produced to check the local bias in the OK model. The NN and ID2 models matched well with the OK model and the differences in the high-grade composite areas are within acceptable limits. The apparent over-smoothing of the Dan Sud domain is related to the clustered drilling patterns in the area (Table 14.11).
The trend and local variation of the estimated OK model was also compared to the NN, ID2 model and to the composites in the three (3) directions of the swath plots (North, East and Elevation) for blocks estimated during the first pass. The swath plots show an acceptable amount of smoothing in the grade distribution regarding each method (Figure 14.12).

Section L000, Clipping ±25m
Figure 14.11 - Validation of the Nelligan Project interpolation results, comparing drill hole assays and block model grade values
Table 14.11 - Statistical comparison of the composite mean grades to block model mean grades for different interpolation methods
| Domains |
Block
code |
Composite |
Interpolation |
| Number of Composites |
Mean
(Au g/t) |
Number of Interpolated Blocks |
OK
(Au g/t) |
ID2
(Au g/t) |
NN
(Au g/t) |
| Dan Sud |
100 |
74 |
0.43 |
32 |
0.15 |
0.15 |
0.12 |
| Dan Central |
101 |
114 |
0.81 |
519 |
0.82 |
0.86 |
0.72 |
| Dan Nord |
102 |
392 |
0.33 |
2278 |
0.29 |
0.27 |
0.30 |
| Liam HG |
110 |
174 |
1.34 |
1829 |
1.58 |
1.56 |
1.69 |
| Liam |
111 |
409 |
0.23 |
3353 |
0.27 |
0.27 |
0.29 |
| Liam Nord |
112 |
175 |
0.28 |
1432 |
0.22 |
0.22 |
0.24 |
| 36 Central |
120 |
135 |
0.73 |
988 |
0.71 |
0.70 |
0.72 |
| 36 Nord |
121 |
81 |
0.54 |
589 |
0.53 |
0.54 |
0.57 |
| Renard HG |
130 |
2621 |
0.96 |
39570 |
1.03 |
1.01 |
1.10 |
| Renard 2 |
131 |
1416 |
0.42 |
23716 |
0.42 |
0.42 |
0.43 |
| Renard 1 |
132 |
4279 |
0.35 |
83257 |
0.36 |
0.36 |
0.37 |
All interpolated blocks during first pass

Cross-strike at 60°
Figure 14.12 - Swath plot for all domains in the Nelligan Project
14.11 Cut-off Parameters
The 2019 MRE was prepared for an open pit scenario only, and results were compiled using a minimum cut-off grade of 0.5 g/t Au.
The open pit potential mining scenario was used for supporting the criteria of reasonable prospects of economic viability and for establishing reasonable cut-off grades for the deposit. No PEA, PFS or FS studies have been completed to support the economic viability or technical feasibility of mining any portion of the mineral resource by any particular mining method.
The cut-off grade must be re-evaluated in light of prevailing market conditions and other factors, such as gold price, exchange rate, mining method, related costs, etc.
The parameters and assumptions used to determine the cut-off grade ("CoG") are presented in Table 14.12.
The final selected Whittle input parameters and CoG for the in-pit resource estimate are also presented in Table 14.12.
Table 14.12 - Input parameters used to calculate the cut-off grade
| Input Parameter |
Unit |
Value |
| Gold price |
CA$/oz |
1,650 |
| Gold price |
US$/oz |
1,500 |
| Refining and selling cost |
CA$/oz |
5.00 |
| Exchange rate |
US$:CA$ |
1.1 |
| Mining cost |
CA$/t mined |
3.00 |
| Overburden removal cost |
CA$/t excavated |
3.00 |
| G&A cost |
CA$/t milled |
2.50 |
| Mill recovery |
% |
92 |
| Dilution |
% |
5 |
| Processing cost (C$/t milled) |
CA$/t milled |
12.00 |
| Slope angle in overburden |
Degree |
25 |
| Slope angle in bedrock |
Degree |
45 |
| Calculated CoG |
Au g/t |
0.33 |
| Resource in-pit CoG (rounded) |
Au g/t |
0.50 |
Using the parameters shown in the table above, the CoG of 0.33 g/t was calculated as follows:

A rounded value of 0.50 g/t Au was selected as the in-pit CoG given the early stage of the project and the few preliminary metallurgical test results (only 3) for estimating processing cost and mill recovery. The Whittle pit shell used to constrain the 2019 MRE was based only on inferred blocks and was optimized on the basis of a cut-off grade value of 0.50 g/t Au.
14.12 Mineral Resource Classification
14.12.1 Mineral resource classification
All blocks in the 2019 MRE were classified as inferred mineral resources. The inferred category was only defined where blocks were interpolated in Pass 1 by a minimum of 2 drill holes and where drill hole spacing was less than 100 m. The blocks interpolated by Pass 1 shows reasonable geological and grade continuities. Some blocks from Pass 2 were locally upgraded to the inferred category, and some blocks from Pass 1 were locally downgraded to unclassified material in order to avoid isolated blocks. Inferred blocks must also be included within the optimized pit shell and must have a grade above 0.5 g/t.
Final block classification was assigned by clipping 3D solids (built on a domain-by-domain basis on either longitudinal view or in cross-sections).
Figure 14.13 shows an example of mineral resource classification.

Figure 14.13 - Example of the Renard 1 domain showing the clipping boundary, built on cross-sections, for inferred classification before pit optimization
14.13 Mineral Resource Estimate
InnovExplo is of the opinion that the current mineral resource estimate can be classified as inferred mineral resources based on data density, search ellipsoid criteria, drill hole spacing and interpolation parameters. InnovExplo considers the 2019 MRE to be reliable and based on quality data, reasonable assumptions, and parameters that follow CIM Definition Standards.
Table 14.13 and Figure 14.14 presents the results of the 2019 MRE for the Project at a cut-off of 0.5 g/t Au for an open pit mining scenario.
Table 14.14 presents the sensitivity of the 2019 MRE at different cut-off grades for an open pit scenario. The reader should be cautioned that the figures provided in this table should not be interpreted as a mineral resource statement. The reported quantities and grade estimates at different cut-off grades are presented for the sole purpose of demonstrating the sensitivity of the resource model to the selection of a reporting cut-off grade.
Table 14.13 - Nelligan Project Mineral Resource Estimate at 0.5 g/t cut-off for an open pit mining scenario
| Resource Category |
Zones |
Tonnage (t) |
Grade (g/t Au) |
Gold ounces (oz) |
| Inferred |
Dan |
1,525,000 |
1.00 |
48,900 |
| Liam |
2,939,000 |
1.47 |
139,100 |
| 36 |
809,000 |
0.87 |
22,500 |
| Renard |
91,716,000 |
1.01 |
2,983,400 |
| Total |
96,990,000 |
1.02 |
3,193,900 |
Notes to accompany the Mineral Resource Estimate:
1. The Independent and Qualified Persons for the Mineral Resource Estimate, as defined by NI 43-101, are Alain Carrier, P.Geo., and Vincent Nadeau-Benoit P.Geo., both from InnovExplo Inc., and the effective date is October 2, 2019.
2. These mineral resources are not mineral reserves, as they do not have demonstrated economic viability.
3. The mineral resource estimate follows current CIM definitions and guidelines for mineral resources.
4. The results are presented undiluted and are considered to have reasonable prospects of economic viability.
5. The estimate encompasses four (4) gold-bearing zones (Renard, 36, Liam and Dan), subdivided into 11 subdomains each defined by individual wireframes with a minimum true thickness of 3.0 m, using the grade of the material when assayed or a value of zero when not assayed. The resource was estimated using GEOVIA GEMS 6.8.
6. High-grade capping supported by statistical analysis was done on raw assay data before compositing and established on a per-zone basis. All zones and their subdomains were capped at 15 g/t, except for the High-grade domain of the Renard Zone which was capped at 30 g/t. Raw assays associated with a core recovery below 60% and/or with an interval length of more than 2.0 m were capped at 2.5 g/t.
7. Grade interpolation was performed by Ordinary Kriging on 3.0 m composites from drill hole intersections falling within the mineralized zones in a block model with a block size of 10.0 m by 10.0 m by 10.0 m.
8. Bedrock was assigned a density value of 2.73 g/cm3 corresponding to the mean of SG measurements for the Project. A fixed density value of 2.20 g/cm3 was assigned to highly fractured domains and 2.00 g/cm3 to the overburden.
9. The estimate is categorized as inferred mineral resources. The inferred category is only defined with a minimum of two (2) drill holes in areas where the drill spacing is less than 100 metres and reasonable geological and grade continuity has been demonstrated.
10. The Mineral Resource Estimate is pit-constrained with a bedrock slope angle of 45° and an overburden slope angle of 25°. It is reported at a rounded cut-off grade of 0.50 g/t Au. The cut-off grades were calculated using the following parameters: mining cost = CA$ 3.00; processing cost = CA$ 12.00; G&A = CAD 2.50; refining and selling costs = CA$ 5.00; gold price = US$ 1,500.00/oz; US$:CAD exchange rate = 1.1; and mill recovery = 92.0%. The cut-off grades should be re-evaluated in light of future prevailing market conditions (metal prices, exchange rates, mining costs etc.).
11. The number of metric tonnes was rounded to the nearest thousand, following the recommendations in NI 43-101 and any discrepancies in the totals are due to rounding effects. The metal contents are presented in troy ounces (tonnes x grade / 31.10348).
12. InnovExplo Inc. is not aware of any known environmental, permitting, legal, title-related, taxation, socio-political, or marketing issues, or any other relevant issue not reported in the Technical Report, that could materially affect the Mineral Resource Estimate.
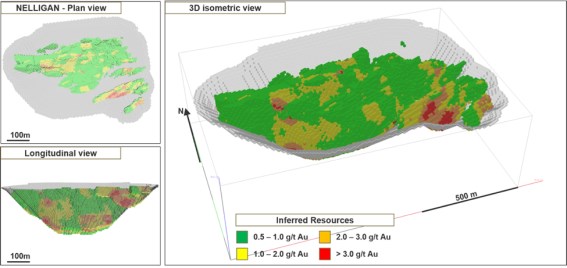
Figure 14.14 - Nelligan Project Mineral Resource Estimate results illustrations
Table 14.14 - Sensitivity of the pit-constrained Nelligan Project Inferred Mineral Resource Estimate to cut-off grade
|
Cut-off (g/t)
|
Inferred Resources
|
|
Tonnage (t)
|
Grade (g/t Au)
|
Ounces (Au)
|
|
>1.75
|
9,431,000
|
2.35
|
713,900
|
|
>1.50
|
13,971,000
|
2.11
|
949,900
|
|
>1.00
|
34,844,000
|
1.57
|
1,758,000
|
|
>0.75
|
60,023,000
|
1.27
|
2,455,800
|
|
>0.60
|
81,498,000
|
1.11
|
2,921,000
|
|
>0.50
|
96,990,000
|
1.02
|
3,193,900
|
|
>0.40
|
118,674,000
|
0.92
|
3,505,200
|
|
>0.35
|
134,551,000
|
0.85
|
3,696,300
|
|
>0.30
|
152,765,000
|
0.79
|
3,886,600
|
15. MINERAL RESERVE ESTIMATES
Not applicable at the current stage of the Project.
16. MINING METHODS
Not applicable at the current stage of the Project.
17. RECOVERY METHODS
Not applicable at the current stage of the Project.
18. PROJECT INFRASTRUCTURE
Not applicable at the current stage of the Project.
19. MARKET STUDIES AND CONTRACTS
Not applicable at the current stage of the Project.
20. ENVIRONMENTAL STUDIES, PERMITTING, AND SOCIAL OR COMMUNITY IMPACT
Not applicable at the current stage of the Project.
21. CAPITAL AND OPERATING COSTS
Not applicable at the current stage of the Project.
22. ECONOMIC ANALYSIS
Not applicable at the current stage of the Project.
23. ADJACENT PROPERTIES
At the effective date of this report, the GESTIM database contains records for numerous mineral exploration properties in the area of the Project. A map of adjacent properties is shown on Figure 23.1; claims held by prospectors are listed as "Other" in the legend.
All the information presented below for properties adjacent to the Project come from the public domain and have not been verified by InnovExplo. The nearby mines and deposits are not necessarily indicative that the project hosts similar types of mineralization.
23.1 Anik Property
Owned by Exploration Kintavar Inc. ("Kintavar"), the Anik property is located along the northern boundary of the Nelligan Project and comprises 120 claims. Kintavar also holds three (3) other clusters of claims, respectively consisting of 5, 12 and 67 claims, in the surrounding area. In January 25, 2019, Kintavar announced it had entered into a letter of intent ("LOI") with the TomaGold spin-out corporation, Monster Exploration, to sell Anik Gold Property for $5 million. Upon closing the spin-out, Monster Exploration will have a 100% interest in the Anik property.
The Anik property (Charbonneau and Pelletier, 2016) is an exploration project on which gold anomalies were identified in iron formations hosted in a sedimentary sequence (Duquette 1965). The STR-91-03 trench discovered in 1991 returned values of 22.1 g/t Au and 66.6 g/t Au (Pelletier, 2015). In 2014, the Orbi, Bobby, Kovi and Mirador sector were discovered. Subsequent drilling on the Bobby Zone revealed downward extension and returned gold values of 0.41 g/t Au over 56.5 m, including 1 g/t Au over 15 m (Pelletier and Cayer, 2015) and 1.28 g/t Au over 7.96 m, including 3.06 g/t Au over 1.54 m (Pelletier, 2017).
A 43-101 compliant technical report on the Anik property, documenting the gold potential and exploration activities, was prepared by Inlandsis Consultants and was filed in December 2016. Inlandsis Consultants concluded that low-grade but continuous mineralization is present on the project. They recommended that the compilation of historical data be completed, the interpretation updated, exploration targets generated, and follow-up sampling conducted through field work (Charbonneau and Pelletier, 2016).
23.2 Lac Surprise Property
Owned by Northern Superior Resources Inc. ("Northern Superior") (100%), the Lac Surprise Property is an exploration project located along the western boundary of the Nelligan Project (Figure 23.1). It consists of 333 claims (18,555 ha). Most of the following information can be found on the Northern Superior web site.
From 2016 to 2017, a 1,500-m diamond drill program tested gold showings and IP trends on the Amber Zone. The best results were: 2.26 g/t Au over 4.85 m (BA-16-02); 2.52 g/t Au and 5.4 g/t Ag over 2.18 m, including 2.73 g/t Au and 1.5% Zn over 0.53 m (BA-16-08); and 1.56 g/t Au over 3.0 m (BA-16-12) (Armstrong, and Kilbourne, 2016). Two exploration programs were completed as well as an IP survey and high-definition Mag survey east of the Black Phoenix showing. Mineralized grab samples on the Black Phoenix returning values of 19.9 g/t Au and 5.77 g/t Au (Parsons and Tremblay, 2015). Four (4) priority anomalous trends were identified by the geophysical survey, followed by a drill program of five (5) holes totalling 1,185 m. The drilling program confirmed one of the anomalous trends as a hydrothermal system bearing gold mineralization. The best intersection was 1.12 g/t Au over 6.34 m, including 4.50 g/t Au over 0.73 m (Northern Superior news release of March 9, 2017).
In September 2019, a drill program consisting of ten (10) holes totalling 3,000 m was initiated to confirm the extension of the Renard Zone from the Nelligan Project and to test the extensions of the Black Phoenix Zone (Northern Superior news release of September 10, 2019).
23.3 Opawica and Philibert-1 properties
Owned by Mozaic Minerals Corporation ("Mozaic"), the Opawica and Philibert-1 exploration properties consist of two (2) claims blocks of eighty (80) and four (4) claims (respectively 4,480 and 224 ha). It is located northeast of the Nelligan Project, directly adjacent to Kintavar's Anik property.
In 1993, 25 holes were drilled on the property totalling 11,959 m. The objective was to evaluate the continuity of five (5) mineralized zones as well as punctual testing of exploration targets (Zn- and Au-rich boulders).
In 2016, airborne Mag and VLF surveys were completed over the Opawica and Philibert I properties. An exhaustive interpretation by MB Geosolutions Inc. outlined eight (8) gold and three (3) copper-rich polymetallic exploration targets. Two (2) of the copper targets are located in the Opawica South Block and one (1) in the Philibert I block; four (4) of the gold targets are located in the Opawica North block, three (3) in the Opawica South block and one (1) in the Philibert I block (Stellar Africagold Inc. press release of June 13, 2016).
23.4 Philibert
Owned by SOQUEM, the Philibert property consists of 110 mining titles (5,392.57 ha). In 1990, SOQUEM published a historical mineral resource estimate of 1.4 M t at 5.3 g/t Au.
These "resources" are historical in nature and should not be relied upon. It is unlikely they conform to current NI 43 101 requirements or follow CIM Definition Standards, and they have not been verified to determine their relevance or reliability. They are included in this section for illustrative purposes only and should not be disclosed out of context.
From 1983 to 2014, SOQUEM conducted multiple drill programs and several geophysical surveys (Mag survey, TBF, IP) as well as prospecting and trenching programs on the Philibert property. Several gold occurrences were discovered, with the following assay highlights: 5.62 g/t Au over 4.8 m including 7.67 g/t Au over 2.8 m for Zone 179; 2.45 g/t Au over 11.5 m for Zone 182 (Desjardins and Gilbert, 1994); 4.45 g/t Au over 13.2 m for Zone 37-2, 7.63 g/t Au over 6.0 m for Zone Ai (Gagnon et al., 2013); 2.36 g/t Au over 25.8 m for Zone 106 (hole 981-14-297); and 6.42 g/t Au over 3.5 m for Zone 37-1 (Gagnon, 2014). After the 2014 program, SOQUEM recommended that a mineral resource estimate be generated (Gagnon, 2014).
23.5 Joe Mann
Owned by Ressources Jessie Inc. (65%) and SOQUEM (35%), the Joe Mann property hosts the former Joe Mann mine and consists of two (2) blocks totalling 77 claims (2,904.54 ha). It is located northeast of the Nelligan Project. Several gold occurrences delineate the gold corridor that hosts the Joe Mann mine. The Joe Mann mine is located in the northeastern part of the property and was in operation from 1956 to 1959, 1974 to 1975, and 1987 to 2007. The production total was 4,754,375 t at 8.26 g/t Au as of August 2007 (MERNQ, 2008). The mine has a historical mineral reserve of 1,525,838 t at 11.0 g/t Au and 0.28% Cu as of December 31, 1987 (Dion and Guha, 1988). The Meston Lake gold occurrence is located in the northwestern part of the property and has a historical mineral resource estimate of 1.235 Mt at 6.25 g/t Au (Northern Miner, March 28, 1974).
These "resources" are historical in nature and should not be relied upon. It is unlikely they conform to current NI 43 101 requirements or follow CIM Definition Standards, and they have not been verified to determine their relevance or reliability. They are included in this section for illustrative purposes only and should not be disclosed out of context.
SOQUEM re-sampled historical drill holes and re-interpreted geophysical surveys (resistivity and PP surveys) between 2014 and 2016, yielding new anomalies (Malo Lalande, 2016; Schmitt, 2015).
23.6 Monster Lake property
The Monster Lake property is owned 45% by TomaGold corporation, 50% by IAMGOLD and 5% by Quinto Resources Inc. The property consists of 114 claims covering an area of 3,336 ha. The property is at an advanced exploration stage. The main zones are 325, Annie and Mégane. The property is characterized by gold mineralization associated with NE and NW shear zones cutting mafic volcanic and intrusive rocks.
A 43-101 compliant technical report presenting an initail mineral resource estimate was published in April 2018. Inferred resources were estimated to be 1,109,700 t at 12.14 g/t Au (433,300 oz Au) (Athurion et al., 2018). The report concluded that continuity had been demonstrated for four (4) mineralized zones. Additional exploration/delineation drilling and further geological interpretation were recommended to gain a better understanding of the deposit before updating the current mineral resource estimate (Athurion et al., 2018).
In 2018-2019, IAMGOLD drilled 40 DDH to improve confidence in the continuity of the mineralization, to test extensions of the known zones, and to find additional zones in order to increase the total mineral resources on the property. Gold occurrences were intersected in several drill holes.
23.7 Chevrier property
The Chevrier property consists of 455 mining claims (22,959.27 ha). Of this total, 326 claims are held by Chevrier Metals Corporation, IAMGOLD Corporation has an interest in 30 claims, First Quantum Minerals has an interest in two (2) claims, and André Liboiron holds 97 (currently being transferred to Chevrier Metals Corp). The property is characterized by disseminated pyrite mineralization in an altered shear zone (ankerite-sericite-leucoxene with variable amounts of fuchsite).
In February 2019, a 43-101 technical report and mineral resource estimate were prepared by Géologica Groupe-Conseil Inc. Indicated mineral resources were estimated to be 10.793 Mt at 1.22 g/t Au, for a total of 423,000 oz of gold, and inferred mineral resources were estimated to be 7.438 Mt at 1.27 g/t Au, for a total of 303,000 oz of gold (Beauregard et al., 2019). The report recommended that exploration work continue (prospecting, stripping, mapping, sampling and drilling) to gain a better understanding of the mineralization on the property. A detailed 3D compilation of gold-rich zones was also recommended to gain a better understanding of how structural patterns affect the mineralization (Beauregard et al., 2019).
23.8 Muus, Muus East and Nisk properties
The Muus property is located to the northwest of the Nelligan Project, the Muus East property is located to the northeast and the Nisk property is adjacent to the south. These properties consist of four (4) blocks of 855 claims (47,377 ha) and are wholly owned by Blue Thunder Mining Corporation ("Blue Thunder"). One (1) block of one (1) claim (51 ha) on the Nisk property is owned 50% by Blue Thunder and 50% by Rafael Moncayo.
Several historical gold occurrences are present on these properties. The Lac des Vents showing is characterized by mineralization composed of 1 to 5% cubic pyrite in quartz clusters. A grab sample returned a gold value of 2.56 g/t Au (Bernier, 1990). The Welb (Rrk) outcrop, characterized by mineralization composed of 1 to 2% disseminated pyrite and traces of chalcopyrite contained in a smoky quartz veins stockwork, returned several gold values including a grab sample of 1 m grading 8 g/t Au (Morasse, 1989). In 2019, ground sampling and airborne Mag surveys were completed on the Muus property.

Figure 23.1 - Map of the Nelligan Project and adjacent properties
24. OTHER RELEVANT DATA AND INFORMATION
Not applicable at the current stage of the Project.
25. INTERPRETATION AND CONCLUSIONS
The objective of InnovExplo's mandate was to present and support an initial mineral resource estimate (the "2019 MRE") for the Nelligan Project. This Technical Report and the 2019 MRE results herein meet these objectives.
After conducting a detailed review of all pertinent information and completing the 2019 MRE mandate, InnovExplo concludes the following:
- The database supporting the 2019 MRE is complete, valid and up to date;
- Geological and gold grade continuity has been demonstrated for the four mineralized zones (Dan Zone, Liam Zone, Zone 36 and Renard Zone) and the subdomains;
- The 2019 MRE key parameters (density, capping, compositing, interpolation, search ellipsoid, etc.) are supported by data and statistical and/or geostatistical analysis;
- The 2019 MRE was prepared as a pit-constrained (Whittle optimized pit shell) inferred resource at a cut-off grade of 0.5 g/t;
- Cut-off grades were calculated at a gold price of US$1,500 per troy ounce and an exchange rate of 1.1 US$/CA$, using reasonable mining, processing and G&A costs;
- All blocks were classified as inferred resources. There are no measured or indicated resources;
- The pit-constrained inferred resource is estimated at 96,990,000 tonnes at an average grade of 1.02 g/t Au for a total of 3,193,900 ounces of gold;
- The 2019 MRE is considered to be reliable, thorough, based on quality data, reasonable hypotheses, and parameters compliant with NI 43-101 requirements and CIM Definition Standards;
- Opportunities exist to potentially add additional mineral resources to the Project;
- It is likely that additional in-fill drilling could upgrade some of the inferred resources to the indicated category.
Table 25.1 identifies any important internal risks, potential impacts and possible risk mitigation measures that could affect the economic outcome of the Project. This excludes the external risks that apply to all mining projects (e.g., changes in metal prices, exchange rates, availability of investment capital, change in government regulations, local communities and social acceptability, etc.). Significant opportunities that could improve the economics, timing and permitting of the project are also identified in this table. Further information and evaluation are required before these opportunities can be included in the economics of the project.
Table 25.1 - Risks and opportunities of the Nelligan Project
| RISK |
Potential Impact |
Possible Risk Mitigation |
| Environment and lakes |
Resource's pit shell could be smaller and affect the project.. |
Conduct an environmental baseline study to evaluate potential environmental impact. Continue to organize information sessions, publish information on the mining project, and meet with host communities. |
| RISK |
Potential Impact |
Possible Risk Mitigation |
| Difficulty in attracting experienced professionals |
The ability to attract and retain competent, experienced professionals is a key factor for success. |
An early search for professionals can identify and attract critical people. It may be necessary to provide accommodation for key people (not included in the project costs). |
| Low-recovery areas; highly fractured domains need better support for interpretation |
The interpreted fracture domains may have a different shape and orientation, and the bulk density of these domains could be lower, causing local loss of mineral resources. |
Definition drilling will improve the understanding and definition of highly fractured areas. Downhole televiewer surveys could also help asses the in-situ aspect of these areas. |
| Metallurgical recoveries are based on limited testwork |
Recovery might be lower than what is currently being assumed. |
Conduct additional metallurgical tests. |
| OPPORTUNITY |
Explanation |
Potential Benefit |
| Infill drilling |
Positive results could upgrade inferred resources to the indicated category. |
Increased confidence level of future MRE, potentially allows economic study on the indicated category |
| Exploration potential |
Potential for additional inferred resources by drilling targets in the known extension of the project. |
Adding inferred resources increases the economic value of the Project. |
| Low recovery areas; highly fractured domains need better support for interpretation |
A better interpretation of these domains may show that the mitigation addressed in the 2019 MRE is too conservative. |
Definition drilling will help to understand and more precisely define the highly fractured areas, and potentially confirm and increase the resources. |
| Metallurgical recoveries are based on limited testwork |
Recovery may be variable and possibly better than what is currently being assumed. |
Conduct additional metallurgical tests for more precise assumptions of the recovery rate and milling cost. |
| Potential synergy with Monster Lake project |
Potential to mine material from both projects (IAMGOLD has interests in both) and create synergies in the workforce, milling and mining facilities, etc. |
Potentially increase the economic value of the Project |
26. RECOMMENDATIONS
Based on the results of the 2019 MRE, InnovExplo recommends additional exploration and delineation drilling, further geological interpretation, and improvement of the metallurgical characterization to gain a better overall understanding of the risks and opportunities for the Project.
Additional metallurgical testwork will yield a better assessment of the recovery rate and milling cost assumptions in the cut-off grade calculation for a future MRE update and associated optimized pit shell. In particular, InnovExplo recommends documenting the gold recovery rate for different gold grade ranges, from lower to higher grade material, and for different mineralized zones on the Project.
Infill drilling using a regular 50-m drilling grid should be completed to test continuity and potentially convert some of the inferred resources to the indicated category.
Exploration drilling should target the known potential in the western extension of the Renard Zone and the lateral and at-depth extensions of the Liam Zone. Conditional on the success of the drilling programs, some satellite clusters of inferred resources could be connected to the current main volume of inferred resources.
The highly fractured domains and faults could be characterized using borehole televiewer surveys in about ten (10) previously drilled holes in strategic locations. The surveys would improve the structural understanding of the Project and will better constrain the width, extent and in-situ characteristics of the highly fractured domains and faults.
In parallel, InnovExplo also recommends maintaining a pro-active and transparent strategy and communication plan with local communities and First Nations. An environmental baseline study should also be carried out.
In summary, InnovExplo recommends the following two-phase work program:
Phase 1:
- 1A) Pro-active and transparent strategy and communication plan;
- 1B) Additional metallurgical testwork;
- 1C) Conversion and exploration drilling;
- 1D) Acoustic televiewer survey campaign; and
- 1E) MRE update
Phase 2 (conditional on the success of Phase 1):
- 2A) Pro-active and transparent strategy and communication plan;
- 2B) Environmental baseline study;
- 2C) Conversion and exploration drilling; and
- 2D) MRE update and PEA
InnovExplo has prepared a cost estimate for the recommended work program to serve as a guideline for the Project. The budget estimate for the proposed program is presented in Table 26.1. The estimated cost for Phase 1 is C$4,439,000 (incl. 15% for contingencies); the estimated cost for Phase 2 is C$3,070,500 (incl. 15% for contingencies). The grand total is C$7,509,500 for both phases. Phase 2 is contingent upon the success of Phase 1.
InnovExplo is of the opinion that the recommended work program and proposed expenditures are appropriate and well thought out. InnovExplo believes that the proposed budget reasonably reflects the type and amount of the contemplated activities.
Table 26.1 - Estimated costs for the recommended work program
|
Phase 1 - Work Program
|
Cost Estimate ($)
|
|
1A) Community relation and communication plan
|
40,000
|
|
1B) Additional metallurgical testwork
|
150,000
|
|
1C) Conversion and exploration drilling (±35,000m)
|
3,500,000
|
|
1D) Acoustic televiewer survey
|
20,000
|
|
1E) MRE update
|
150,000
|
|
Subtotal
|
3,860,000
|
|
Contingency (15%)
|
579,000
|
|
Total Phase 1
|
4,439,000
|
|
|
|
|
Phase 2 - Work Program
|
Cost Estimate ($)
|
|
2A) Community relation and communication plan
|
60,000
|
|
2B) Environmental baseline study
|
110,000
|
|
2C) Conversion and exploration drilling (±20,000m)
|
2,000,000
|
|
2D) MRE update and PEA
|
500,000
|
|
Subtotal
|
2,670,000
|
|
Contingency (15%)
|
400,500
|
|
Total Phase 2
|
3,070,500
|
|
TOTAL Phase 1 and 2
|
7,509,500
|
27. REFERENCES
Annels, A.E. and Dominy, S.C., 2003, Core recovery and quality: important factors in mineral resource estimation, Applied Earth Science (Trans. Inst. Min. Metall. B) Vol. 112 B311, p.305-312.
Athurion, C., Brousseau, K. and Carrier, A., 2018. NI 43-101 Technical report and maiden mineral resource estimate for the Monster Lake Project as of April 9, 2018, Val-d'Or, Québec, Canada. Prepared by InnovExplo Inc. for IAMGOLD Corporation, 231p. SEDAR website.
Ayer, J., Amelin, Y., Corfu, F., Kamo, S., Ketchum, J.F., Kwok, K., and Trowell, N.F., 2002, Evolution of the Abitibi greenstone belt based on U-Pb geochronology: Autochthonous volcanic construction followed by plutonism, regional deformation and sedimentation: Precambrian Research, v. 115, p. 63-95.
Bateman, R., Ayer, J.A., and Dubé, B., 2008, The Timmins-Porcupine gold camp, Ontario: Anatomy of an Archean greenstone belt and ontogeny of gold mineralization. Economic Geology, v. 103, p. 1285-1308.
Benn, K., and Peschler, A., 2005, A detachment fold model for fault zones in the Late Archean Abitibi greenstone belt. Tectonophysics, v. 400., p. 85-104.
Boivin, M., 2014. Rapport de compilation et d'interprétation géophysique couvrant le secteur d'intérêt du projet Nelligan Chibougamau, Québec. Vanstar Mining Ressources Inc. GM68306. 11p.
Brodie-Brown, H., Zuiderveen, J., Diamond drill record, Hazeur Iron. GM48483. 116p.
Chainey, D., 1995a. Rapport des résultats des forage (95-1 à 95-12) effectué en février et mars 1995 sur la propriété Pontiac de Ressources Unifiées Oasis et SOQUEM. GM54435. 55p.
Chainey, D., 1995b. Rapport des résultats des forage (95-13 à 95-18) effectué en juin et juillet 1995 sur la propriété Pontiac de Ressources Unifiées Oasis et SOQUEM. GM54434. 53p.
Chainey, D., 1995c. Rapport des résultats des forage (95-1 à 95-12) effectué en février et mars 1994 sur la propriété Pontiac de Ressources Unifiées Oasis et SOQUEM. GM55026. 55p.
Chainey, D., 1995d. Rapport préliminaire projet Pontiac mars 1995. GM55025. 5p.
Chainey, D., 1996a. Rapport des résultats d'un forage (95-19) effectué en novembre 1995 sur la propriété Pontiac de Ressources Unifiées Oasis et SOQUEM. GM53900. 22p.
Chainey, D., 1996b. Résultats de l'échantillonnage du till effectué sur la propriété Pontiac de Ressources Unifiées Oasis Inc. au cours de l'été 1996. GM55641. 31p.
Daigneault R., 1996. Couloirs de déformation de la Sous-Province de l'Abitibi. Ministère des Ressources naturelles du Québec, Québec, 115p., MB 96-33.
Daigneault, R., and Allard, G.O., 1990. Le Complexe du Lac Doré et son environnement géologique (région de Chibougamau-sous-province de l'Abitibi). Ministère de l'Énergie des Mines et des Ressources du Québec. 275p. MM 89-03.
Daigneault, R., and Archambault, G., 1990, Les grands couloirs de déformation de la Sous-Province de l'Abitibi, in Rive, M., Verpaelst, P., Gagnon, Y., Lulin, J.M., Riverin, G., and Simard, A., eds., The Northwestern Quebec Polymetallic Belt: A Summary of 60 Years of Mining and Exploration: Canadian Institute of Mining and Metallurgy, Special Volume 43, p. 43-64.
Daigneault, R., Mueller, W.U., Chown, E.H., 2004. Abitibi greenstone belt plate tectonics: the diachronous history of arc development, accretion and collision. In Eriksson, P.G., Altermann, W., Nelson, D.R., Mueller, W.U., Catuneanu, O. (Eds.). The Precambrian Earth: Tempos and Events, Series: Developments in Precambrian geology, vol. 12, Elsevier, p. 88-103.
De Carle, R.J., 1987. Report on combiened helicopter borne magnetic, electromagnetic and VLF survey Lac Surprise project Chibougamau area, Quebec. SOQUEM. GM45666. 78p.
De Chavigny, P., Chainey, D. and Trudeau, Y., 1994. Campagne de sondage hiver 1994 Propriété Pontiac. SOQUEM. GM52837. 154p.
Deshaies, M., 2019. Metallurgical Testwork Results of Nelligan Project. IAMGOLD Corporation. Internal Report. 13 p.
Dion, C. and Simard, A., 1999. Compilation et synthèse géologique et métallogénique du Segment de Caopatina, région de Chibougamau. Ministère des Ressources naturelles. 80p., MB 99-33.
Faure, S., 2012. Réévaluation de la géologie et des modèles d'exploration pour l'or dans le segment Caopatina-Desmaraisville, sud de Chibougamau. Rapport, Projet CONSOREM 2012-02, 57 p.
Faure, S., 2015. Relation entre les minéralisations aurifères et les isogrades métamorphiques en Abitibi. Rapport, Projet CONSOREM 2013-03, 52 p.
Fournier, R., 1994. Journaux de sondages. 2736-1179 Quebec Inc. GM53406. 18p.
Gagné, M. R., and Masson, J., 2013. A Step Foward! An Act to Amend the Mining Act (2013 S.Q., c. 32). Mining Bulletin. Fasken Martineau. 7 pages.
Gauthier, N., 2015. Rapport des travaux de prospection Juin 2015. Propriété Nelligan - Vanstar Mining Ressources Inc. IAMGOLD Corporation. GM69037. 42p.
Goldfarb, R.J., Baker, T., Dubé, B., Groves, D.I., Hart, G.J., and Gosselin, P. 2005. Distribution, Character, and Genesis of Gold Deposits in Metamorphic Terranes. Economic Geology 100th Anniversary Volume, pp. 407-450.
Goutier, J., 1997, Géologie de la région de Destor: Ministère des Ressources naturelles du Québec, 37p., RG 96-13.
Goutier, J., and Melançon, M., 2007, Compilation géologique de la Sous-province de l'Abitibi (version préliminaire): Ministère des Ressources naturelles et de la Faune du Québec.
Grenier, J., 1986. Travaux de scalpage, de décapage et d'échantillonnage de blocs erratiques et de roches en place; projet du Lac d'Eu, cantons de Hazeur et de Gamache, Abitibi. Pontiac, Société d'Exploration Minière Inc. GM44225. 35p.
Guha, J., Chown, E.H., et Daigneault, R., 1991. Litho-tectonic framework and associated mineralization of the eastern extremity of the Abitibi Greenstone Belt, Québec (Field Trip 3). Geological Survey of Canada, Open File 2158, 131 p.
Guzon, V., 2012. Mining Rights in the Province of Quebec. Blakes Bulletin Real Estate- Mining Tenures July 2012. Blake, Cassels & Graydon LLP. 7 pages.
Harris, J.J., 1951. The Stewart Group. Wright-Heargreaves Mines Limited. GM01343. 3p.
Houle, P., 2011. Nouvelle vision du potentiel aurifère de la région Chapais-Chibougamau. Présentation publique dans le cadre du Symposium Mines Baie-James 2011. (http://www.mrn.gouv.qc.ca/mines/quebec-mines/2011-03/31mai/am/01-patrick.pdf).
Hubert, J.M., 1988. Vérification au sol d'anomalies électromagnétiques d'un levé héliporté projet Surprise. GM46552. 6p.
IAMGOLD Exploration, 2010. Assay quality control guidelines for discovery phase to preliminary economic evaluation stage projects. IAMGOLD Corporation. Internal Procedure. 40p.
IAMGOLD Exploration, 2017. Manuel de procédure de Logging. IAMGOLD Corporation. Internal Procedure. 26p.
IAMGOLD Report, 2018a. Rapport des travaux de forage au diamant 2014-2016 - Propriété Nelligan (#277). IAMGOLD Corporation. Assessment Report. 1944p.
IAMGOLD Report, 2018b. Rapport des travaux de forage au diamant Hiver 2017 - Propriété Nelligan (#277). IAMGOLD Corporation. Assessment Report. 1176p.
IAMGOLD Report, 2018c. Report on Exploration Activities on Nelligan Property - September 2018. IAMGOLD Corporation. Internal Report. 7p.
IAMGOLD Report, 2019. Monthly Report - Quebec exploration activities August 2019. IAMGOLD Corporation. Internal Report. 9p.
IAMGOLD. (August 13, 2019). IAMGOLD Reports Remaining Assay Results from the 2019 Delineation Drilling Program at the Nelligan Gold Project, Quebec. [News release]. Retrieved from http://www.iamgold.com/investors/news-releases/default.aspx
Kelly, D., 2014a. Forages 2013-2014, Propriété Nelligan. GM68304. 247p.
Kelly, D., 2014b. Forages au diamant, Propriété Nelligan. GM68503. 25p.
Kennedy, I., 1983. Projet Hazeur, levé HEM. GM40094. 10p.
Kennedy, I., 1984. Rapport de Levé Max-Min. Mines Northgate Patino Inc. GM41038. 4p.
Killin, K., 1989. Logistics report on combined helicopter-borne magnetic, electromagnetic and VLF-EM. Abbey exploration. GM48705. 36p.
Lambert, G., 2013. Levés magnétométriques champ total. Ressources Minières Vanstar Inc. GM68305. 11p.
Lambert, G., 2014. Levés magnétométriques champ total (Janvier-Février 2014). Vanstar Mining Resources Inc. GM68319. 11p.
Larivière, L., 1982. Rapport géologique Canton Hazeur. Mines Northgate Patino Inc. GM39182. 6p.
Lavoie, C., 1977. Report on geophysical surveys on part of the property owned by Falconbridge Nickel Mines Limited. GM33500. 15p.
Lavoie, C., 1978. Report on E.M.H. and gravity surveys on part of the property owned by Falconbridge Nickel Mines Limited. GM33657. 11p.
Leclerc, F., Bédard, J.H., Harris, L.B., McNicoll, V.J., Goulet, N., Roy, P., and Houle, P., 2011. Tholeiitic to calc-alkaline cyclic volcanism in the Roy Group, Chibougamau area, Abitibi greenstone belt-revised stratigraphy and implications for VHMS exploration: Canadian Journal of Earth Sciences, v. 48, p. 661−694.
Leclerc, F., Roy, P. Houle, P., Pilote, P. Bédard, J. Harris, L.B., McNicoll, V.J., Van Breemen, O., David, J. and Goulet, N., 2017. Géologie de la region de Chibougamau. Ressources naturelles du Québec. RG 2015-03.
Legault, M. and Daigneault, R., 2006. Synvolcanic gold mineralization within a deformation zone: the Chevrier deposit, Chibougamau, Abitibi Subprovince, Canada. Mineralium Deposita, 41, p. 203-228.
Legault, M., Daigneault, R., Coututre, J.-F., 1997. Contexte structural et métallogénique des indices aurifères du couloir de déformation de Fancamp. Ministère des Ressources naturelles du Québec, Secteur des mines. 63p. MB 97-32.
Méndez, A.S., 2011. A Discussion on current quality-control practices in mineral exploration, in applications and experiences of quality control, Ognyan Ivanov (Ed.), ISBNL 978-953-307-236-4, 704p.
Midra, R., Lauzière, K., Edward, H.C. and Mueller, W.,1992, Géologie du secteur du lac Surprise -Bande Caopatina-Desmaraisville Sous-province de l'Abitibi. Ministère de l'Énergie et des Ressources, 124p., 4 maps. MB 92-16
Miron, G., 1988. Synthèse des travaux d'exploration Avril-Décembre 1987. SOQUEM. GM49908. 93p.
MRNQ, 1969. Fiche de gîtes (découverte). GM01444. 9p.
Murdy, A., 1978. Report on Hazeur Township. Patino Mines Limited. GM33832. 10p.
National Assembly, 2013. Bill 70 (2013, chapter 32) An Act to amend the Mining Act. Québec Official Publisher, 2013. 32 pages.
Poulsen, K. H., Robert, F., and Dubé, B., 2000. Geological classification of Canadian cold deposits. Geological Survey of Canada, Bulletin 540, 106p.
Rafini, S., 2015. Assurance et contrôle de la qualité (QA/QC) en exploration minérale : synthèse et évaluation des usages. Rapport, Projet CONSOREM 2013-05, 52 p.
Ressources Minières Vanstar Inc. États financiers Annuels aux 31 décembre 2016 et 2015, Québec, Canada. Prepared by BRD Comptables agrees. 45 pages. SEDAR Website.
Ressources Minières Vanstar Inc. États financiers Annuels aux 31 décembre 2010 et 2009, Québec, Canada. Prepared by BRD Comptables agréés. 34 pages. SEDAR Website.
Robert, F, Poulsen, K.H., and Dubé, B., 1997. Gold deposits and their geological classification. In: A.G. Gubins (ed.), Proceedings of Exploration '97: Fourth Decennial International Conference on Mineral Exploration, p. 209-220.
Simoneau, D., Cormier, M. and Cloutier, J.P., 1978. Diamond Drilling Program Hazeur-Gamache Townships, Quebec. Falconbridge Nickel Mines Limited. GM33659. 76p.
Tait, L., 1992. Géologie de la région du lac à l'Eau Jaune (Territoire-du-Nouveau-Québec). Ministère de l'Énergie et des Ressources du Québec. 80p. MB 91-29.
Tazerout, H., 2012a. Rapport de la campagne de forage 2012 Canton Hazeur, Quebec, Canada. Vanstar Mining Resources Inc. GM66674. 175p.
Tazerout, H., 2012b. Journaux de forage, Projet Nelligan. Vanstar Mining Resources Inc. GM67200. 58p.
Thériault, G., 1984. Rapport de la campagne d'exploration 1983-1984 Projet Philibert. GM41259. 335p.
Thurston, P.C., Ayer, J.A., Goutier, J., and Hamilton, M.A., 2008, Depositional gaps in the Abitibi greenstone belt stratigraphy: A key to exploration for syngenetic mineralization. Economic Geology, v. 103, p. 1097−1134.
Tremblay, D., 1988. Diamond drill log, Messine Lake Property. GM47605. 112p.
Vallee, M.A., 1998, Sampling quality control: Exploration and Mining Geology, v.7, p.107-116.
APPENDIX I - LIST OF MINING TITLES
| No. Title |
NTS |
Type |
Area (ha) |
Registration Date |
Expiration Date |
Status |
Owners (GESTIM reference ID) |
Royalty |
Claim Block |
| 2393584 |
32G07 |
CL |
56.04 |
2013-10-31 |
2019-10-30 |
Active |
Ressources Minières Vanstar inc. (83671) 49 %; IAMGold Corporation (87628) 51 % |
|
Émile |
| 2393585 |
32G07 |
CL |
56.03 |
2013-10-31 |
2019-10-30 |
Active |
Ressources Minières Vanstar inc. (83671) 49 %; IAMGold Corporation (87628) 51 % |
|
Émile |
| 2393586 |
32G07 |
CL |
56.03 |
2013-10-31 |
2019-10-30 |
Active |
Ressources Minières Vanstar inc. (83671) 49 %; IAMGold Corporation (87628) 51 % |
|
Émile |
| 2393587 |
32G07 |
CL |
56.03 |
2013-10-31 |
2019-10-30 |
Active |
Ressources Minières Vanstar inc. (83671) 49 %; IAMGold Corporation (87628) 51 % |
|
Émile |
| 2393588 |
32G07 |
CL |
56.03 |
2013-10-31 |
2019-10-30 |
Active |
Ressources Minières Vanstar inc. (83671) 49 %; IAMGold Corporation (87628) 51 % |
|
Émile |
| 2393589 |
32G07 |
CL |
56.03 |
2013-10-31 |
2019-10-30 |
Active |
Ressources Minières Vanstar inc. (83671) 49 %; IAMGold Corporation (87628) 51 % |
|
Émile |
| 2393590 |
32G07 |
CL |
56.02 |
2013-10-31 |
2019-10-30 |
Active |
Ressources Minières Vanstar inc. (83671) 49 %; IAMGold Corporation (87628) 51 % |
|
Émile |
| 2393591 |
32G07 |
CL |
56.02 |
2013-10-31 |
2019-10-30 |
Active |
Ressources Minières Vanstar inc. (83671) 49 %; IAMGold Corporation (87628) 51 % |
|
Émile |
| 2393592 |
32G07 |
CL |
56.02 |
2013-10-31 |
2019-10-30 |
Active |
Ressources Minières Vanstar inc. (83671) 49 %; IAMGold Corporation (87628) 51 % |
|
Émile |
| 2393593 |
32G07 |
CL |
56.02 |
2013-10-31 |
2019-10-30 |
Active |
Ressources Minières Vanstar inc. (83671) 49 %; IAMGold Corporation (87628) 51 % |
|
Émile |
| 2393594 |
32G07 |
CL |
56.01 |
2013-10-31 |
2019-10-30 |
Active |
Ressources Minières Vanstar inc. (83671) 49 %; IAMGold Corporation (87628) 51 % |
|
Émile |
| 2393595 |
32G07 |
CL |
56.01 |
2013-10-31 |
2019-10-30 |
Active |
Ressources Minières Vanstar inc. (83671) 49 %; IAMGold Corporation (87628) 51 % |
|
Émile |
| 2393596 |
32G07 |
CL |
56.01 |
2013-10-31 |
2019-10-30 |
Active |
Ressources Minières Vanstar inc. (83671) 49 %; IAMGold Corporation (87628) 51 % |
|
Émile |
| 2420806 |
32G07 |
CL |
56.04 |
2014-12-30 |
2020-12-29 |
Active |
Ressources Minières Vanstar inc. (83671) 49 %; IAMGold Corporation (87628) 51 % |
|
Émile |
| 2420807 |
32G07 |
CL |
56.04 |
2014-12-30 |
2020-12-29 |
Active |
Ressources Minières Vanstar inc. (83671) 49 %; IAMGold Corporation (87628) 51 % |
|
Émile |
| 2420835 |
32G07 |
CL |
56.04 |
2014-12-30 |
2020-12-29 |
Active |
Ressources Minières Vanstar inc. (83671) 49 %; IAMGold Corporation (87628) 51 % |
|
Émile |
| No. Title |
NTS |
Type |
Area (ha) |
Registration Date |
Expiration Date |
Status |
Owners (GESTIM reference ID) |
Royalty |
Claim Block |
| 2420836 |
32G07 |
CL |
56.04 |
2014-12-30 |
2020-12-29 |
Active |
Ressources Minières Vanstar inc. (83671) 49 %; IAMGold Corporation (87628) 51 % |
|
Émile |
| 2420837 |
32G07 |
CL |
56.04 |
2014-12-30 |
2020-12-29 |
Active |
Ressources Minières Vanstar inc. (83671) 49 %; IAMGold Corporation (87628) 51 % |
|
Émile |
| 2442435 |
32G07 |
CL |
56.05 |
2016-04-20 |
2020-04-19 |
Active |
Ressources Minières Vanstar inc. (83671) 49 %; IAMGold Corporation (87628) 51 % |
1% NSR to Pierre Gervais |
Émile |
| 2442436 |
32G07 |
CL |
56.05 |
2016-04-20 |
2020-04-19 |
Active |
Ressources Minières Vanstar inc. (83671) 49 %; IAMGold Corporation (87628) 51 % |
1% NSR to Pierre Gervais |
Émile |
| 2442437 |
32G07 |
CL |
56.05 |
2016-04-20 |
2020-04-19 |
Active |
Ressources Minières Vanstar inc. (83671) 49 %; IAMGold Corporation (87628) 51 % |
1% NSR to Pierre Gervais |
Émile |
| 2442438 |
32G07 |
CL |
56.05 |
2016-04-20 |
2020-04-19 |
Active |
Ressources Minières Vanstar inc. (83671) 49 %; IAMGold Corporation (87628) 51 % |
1% NSR to Pierre Gervais |
Émile |
| 2442439 |
32G07 |
CL |
56.05 |
2016-04-20 |
2020-04-19 |
Active |
Ressources Minières Vanstar inc. (83671) 49 %; IAMGold Corporation (87628) 51 % |
1% NSR to Pierre Gervais |
Émile |
| 2442440 |
32G07 |
CL |
56.05 |
2016-04-20 |
2020-04-19 |
Active |
Ressources Minières Vanstar inc. (83671) 49 %; IAMGold Corporation (87628) 51 % |
1% NSR to Pierre Gervais |
Émile |
| 2442441 |
32G07 |
CL |
56.05 |
2016-04-20 |
2020-04-19 |
Active |
Ressources Minières Vanstar inc. (83671) 49 %; IAMGold Corporation (87628) 51 % |
1% NSR to Pierre Gervais |
Émile |
| 2442442 |
32G07 |
CL |
56.05 |
2016-04-20 |
2020-04-19 |
Active |
Ressources Minières Vanstar inc. (83671) 49 %; IAMGold Corporation (87628) 51 % |
1% NSR to Pierre Gervais |
Émile |
| 2442443 |
32G07 |
CL |
56.05 |
2016-04-20 |
2020-04-19 |
Active |
Ressources Minières Vanstar inc. (83671) 49 %; IAMGold Corporation (87628) 51 % |
1% NSR to Pierre Gervais |
Émile |
| 2442444 |
32G07 |
CL |
56.05 |
2016-04-20 |
2020-04-19 |
Active |
Ressources Minières Vanstar inc. (83671) 49 %; IAMGold Corporation (87628) 51 % |
1% NSR to Pierre Gervais |
Émile |
| 2442445 |
32G07 |
CL |
56.05 |
2016-04-20 |
2020-04-19 |
Active |
Ressources Minières Vanstar inc. (83671) 49 %; IAMGold Corporation (87628) 51 % |
1% NSR to Pierre Gervais |
Émile |
| 2442446 |
32G07 |
CL |
56.05 |
2016-04-20 |
2020-04-19 |
Active |
Ressources Minières Vanstar inc. (83671) 49 %; IAMGold Corporation (87628) 51 % |
1% NSR to Pierre Gervais |
Émile |
| 2442447 |
32G07 |
CL |
56.05 |
2016-04-20 |
2020-04-19 |
Active |
Ressources Minières Vanstar inc. (83671) 49 %; IAMGold Corporation (87628) 51 % |
1% NSR to Pierre Gervais |
Émile |
| No. Title |
NTS |
Type |
Area (ha) |
Registration Date |
Expiration Date |
Status |
Owners (GESTIM reference ID) |
Royalty |
Claim Block |
| 2442448 |
32G07 |
CL |
56.05 |
2016-04-20 |
2020-04-19 |
Active |
Ressources Minières Vanstar inc. (83671) 49 %; IAMGold Corporation (87628) 51 % |
1% NSR to Pierre Gervais |
Émile |
| 2442449 |
32G07 |
CL |
56.05 |
2016-04-20 |
2020-04-19 |
Active |
Ressources Minières Vanstar inc. (83671) 49 %; IAMGold Corporation (87628) 51 % |
1% NSR to Pierre Gervais |
Émile |
| 2442450 |
32G07 |
CL |
56.04 |
2016-04-20 |
2020-04-19 |
Active |
Ressources Minières Vanstar inc. (83671) 49 %; IAMGold Corporation (87628) 51 % |
1% NSR to Pierre Gervais |
Émile |
| 2442451 |
32G07 |
CL |
56.04 |
2016-04-20 |
2020-04-19 |
Active |
Ressources Minières Vanstar inc. (83671) 49 %; IAMGold Corporation (87628) 51 % |
1% NSR to Pierre Gervais |
Émile |
| 2442452 |
32G07 |
CL |
56.04 |
2016-04-20 |
2020-04-19 |
Active |
Ressources Minières Vanstar inc. (83671) 49 %; IAMGold Corporation (87628) 51 % |
1% NSR to Pierre Gervais |
Émile |
| 2442453 |
32G07 |
CL |
56.04 |
2016-04-20 |
2020-04-19 |
Active |
Ressources Minières Vanstar inc. (83671) 49 %; IAMGold Corporation (87628) 51 % |
1% NSR to Pierre Gervais |
Émile |
| 2442454 |
32G07 |
CL |
56.04 |
2016-04-20 |
2020-04-19 |
Active |
Ressources Minières Vanstar inc. (83671) 49 %; IAMGold Corporation (87628) 51 % |
1% NSR to Pierre Gervais |
Émile |
| 2442455 |
32G07 |
CL |
56.04 |
2016-04-20 |
2020-04-19 |
Active |
Ressources Minières Vanstar inc. (83671) 49 %; IAMGold Corporation (87628) 51 % |
1% NSR to Pierre Gervais |
Émile |
| 2443588 |
32G07 |
CL |
56.02 |
2016-04-28 |
2020-04-27 |
Active |
Ressources Minières Vanstar inc. (83671) 49 %; IAMGold Corporation (87628) 51 % |
|
Émile |
| 2443589 |
32G07 |
CL |
56.02 |
2016-04-28 |
2020-04-27 |
Active |
Ressources Minières Vanstar inc. (83671) 49 %; IAMGold Corporation (87628) 51 % |
|
Émile |
| 2443590 |
32G07 |
CL |
56.02 |
2016-04-28 |
2020-04-27 |
Active |
Ressources Minières Vanstar inc. (83671) 49 %; IAMGold Corporation (87628) 51 % |
|
Émile |
| 2443591 |
32G07 |
CL |
56.02 |
2016-04-28 |
2020-04-27 |
Active |
Ressources Minières Vanstar inc. (83671) 49 %; IAMGold Corporation (87628) 51 % |
|
Émile |
| 2443592 |
32G07 |
CL |
56.02 |
2016-04-28 |
2020-04-27 |
Active |
Ressources Minières Vanstar inc. (83671) 49 %; IAMGold Corporation (87628) 51 % |
|
Émile |
| 2443593 |
32G07 |
CL |
56.02 |
2016-04-28 |
2020-04-27 |
Active |
Ressources Minières Vanstar inc. (83671) 49 %; IAMGold Corporation (87628) 51 % |
|
Émile |
| 2443594 |
32G07 |
CL |
56.02 |
2016-04-28 |
2020-04-27 |
Active |
Ressources Minières Vanstar inc. (83671) 49 %; IAMGold Corporation (87628) 51 % |
|
Émile |
| 2443595 |
32G07 |
CL |
56.01 |
2016-04-28 |
2020-04-27 |
Active |
Ressources Minières Vanstar inc. (83671) 49 %; IAMGold Corporation (87628) 51 % |
|
Émile |
| No. Title |
NTS |
Type |
Area (ha) |
Registration Date |
Expiration Date |
Status |
Owners (GESTIM reference ID) |
Royalty |
Claim Block |
| 2443596 |
32G07 |
CL |
56.01 |
2016-04-28 |
2020-04-27 |
Active |
Ressources Minières Vanstar inc. (83671) 49 %; IAMGold Corporation (87628) 51 % |
|
Émile |
| 2443597 |
32G07 |
CL |
56.01 |
2016-04-28 |
2020-04-27 |
Active |
Ressources Minières Vanstar inc. (83671) 49 %; IAMGold Corporation (87628) 51 % |
|
Émile |
| 2443598 |
32G07 |
CL |
56.01 |
2016-04-28 |
2020-04-27 |
Active |
Ressources Minières Vanstar inc. (83671) 49 %; IAMGold Corporation (87628) 51 % |
|
Émile |
| 2443599 |
32G07 |
CL |
56.01 |
2016-04-28 |
2020-04-27 |
Active |
Ressources Minières Vanstar inc. (83671) 49 %; IAMGold Corporation (87628) 51 % |
|
Émile |
| 2449613 |
32G07 |
CL |
56.03 |
2016-06-17 |
2020-06-16 |
Active |
Ressources Minières Vanstar inc. (83671) 49 %; IAMGold Corporation (87628) 51 % |
|
Émile |
| 2449614 |
32G07 |
CL |
56.03 |
2016-06-17 |
2020-06-16 |
Active |
Ressources Minières Vanstar inc. (83671) 49 %; IAMGold Corporation (87628) 51 % |
|
Émile |
| 2449615 |
32G07 |
CL |
56.03 |
2016-06-17 |
2020-06-16 |
Active |
Ressources Minières Vanstar inc. (83671) 49 %; IAMGold Corporation (87628) 51 % |
|
Émile |
| 2449616 |
32G07 |
CL |
56.03 |
2016-06-17 |
2020-06-16 |
Active |
Ressources Minières Vanstar inc. (83671) 49 %; IAMGold Corporation (87628) 51 % |
|
Émile |
| 2449617 |
32G07 |
CL |
56.03 |
2016-06-17 |
2020-06-16 |
Active |
Ressources Minières Vanstar inc. (83671) 49 %; IAMGold Corporation (87628) 51 % |
|
Émile |
| 2449618 |
32G07 |
CL |
56.03 |
2016-06-17 |
2020-06-16 |
Active |
Ressources Minières Vanstar inc. (83671) 49 %; IAMGold Corporation (87628) 51 % |
|
Émile |
| 2449619 |
32G07 |
CL |
56.03 |
2016-06-17 |
2020-06-16 |
Active |
Ressources Minières Vanstar inc. (83671) 49 %; IAMGold Corporation (87628) 51 % |
|
Émile |
| 2449620 |
32G07 |
CL |
56.01 |
2016-06-17 |
2020-06-16 |
Active |
Ressources Minières Vanstar inc. (83671) 49 %; IAMGold Corporation (87628) 51 % |
|
Émile |
| 2449621 |
32G07 |
CL |
56.01 |
2016-06-17 |
2020-06-16 |
Active |
Ressources Minières Vanstar inc. (83671) 49 %; IAMGold Corporation (87628) 51 % |
|
Émile |
| 2426076 |
32G07 |
CL |
56.04 |
2015-04-09 |
2021-04-08 |
Active |
Ressources Minières Vanstar inc. (83671) 49 %; IAMGold Corporation (87628) 51 % |
|
Miron |
| 2426077 |
32G07 |
CL |
56.04 |
2015-04-09 |
2021-04-08 |
Active |
Ressources Minières Vanstar inc. (83671) 49 %; IAMGold Corporation (87628) 51 % |
|
Miron |
| No. Title |
NTS |
Type |
Area (ha) |
Registration Date |
Expiration Date |
Status |
Owners (GESTIM reference ID) |
Royalty |
Claim Block |
| 2426078 |
32G07 |
CL |
56.03 |
2015-04-09 |
2021-04-08 |
Active |
Ressources Minières Vanstar inc. (83671) 49 %; IAMGold Corporation (87628) 51 % |
|
Miron |
| 2426079 |
32G07 |
CL |
56.02 |
2015-04-09 |
2021-04-08 |
Active |
Ressources Minières Vanstar inc. (83671) 49 %; IAMGold Corporation (87628) 51 % |
|
Miron |
| 2426080 |
32G07 |
CL |
56.02 |
2015-04-09 |
2021-04-08 |
Active |
Ressources Minières Vanstar inc. (83671) 49 %; IAMGold Corporation (87628) 51 % |
|
Miron |
| 2426085 |
32G07 |
CL |
56.04 |
2015-04-09 |
2021-04-08 |
Active |
Ressources Minières Vanstar inc. (83671) 49 %; IAMGold Corporation (87628) 51 % |
|
Miron |
| 2468024 |
32G07 |
CL |
56.02 |
2016-11-07 |
2020-11-06 |
Active |
Ressources Minières Vanstar inc. (83671) 49 %; IAMGold Corporation (87628) 51 % |
|
Miron |
| 2482191 |
32G07 |
CL |
56.04 |
2017-03-01 |
2021-02-28 |
Active |
Ressources Minières Vanstar inc. (83671) 49 %; IAMGold Corporation (87628) 51 % |
|
Miron |
| 2482192 |
32G07 |
CL |
56.02 |
2017-03-01 |
2021-02-28 |
Active |
Ressources Minières Vanstar inc. (83671) 49 %; IAMGold Corporation (87628) 51 % |
|
Miron |
| 2482193 |
32G07 |
CL |
56.02 |
2017-03-01 |
2021-02-28 |
Active |
Ressources Minières Vanstar inc. (83671) 49 %; IAMGold Corporation (87628) 51 % |
|
Miron |
| 2491937 |
32G07 |
CL |
56.03 |
2017-05-09 |
2021-05-08 |
Active |
Ressources Minières Vanstar inc. (83671) 49 %; IAMGold Corporation (87628) 51 % |
|
Miron |
| 2491938 |
32G07 |
CL |
56.03 |
2017-05-09 |
2021-05-08 |
Active |
Ressources Minières Vanstar inc. (83671) 49 %; IAMGold Corporation (87628) 51 % |
|
Miron |
| 2491939 |
32G07 |
CL |
56.03 |
2017-05-09 |
2021-05-08 |
Active |
Ressources Minières Vanstar inc. (83671) 49 %; IAMGold Corporation (87628) 51 % |
|
Miron |
| 2491940 |
32G07 |
CL |
56.02 |
2017-05-09 |
2021-05-08 |
Active |
Ressources Minières Vanstar inc. (83671) 49 %; IAMGold Corporation (87628) 51 % |
|
Miron |
| 2120693 |
32G07 |
CL |
55.99 |
2007-09-11 |
2020-04-13 |
Active |
Ressources Minières Vanstar inc. (83671) 49 %; IAMGold Corporation (87628) 51 % |
2% NSR to Vanstar |
Nelligan |
| 2120695 |
32G07 |
CL |
55.99 |
2007-09-11 |
2020-04-13 |
Active |
Ressources Minières Vanstar inc. (83671) 49 %; IAMGold Corporation (87628) 51 % |
2% NSR to Vanstar |
Nelligan |
| 2215499 |
32G07 |
CL |
56.00 |
2010-04-19 |
2020-04-13 |
Active |
Ressources Minières Vanstar inc. (83671) 49 %; IAMGold Corporation (87628) 51 % |
2% NSR to Vanstar |
Nelligan |
| 2215500 |
32G07 |
CL |
56.00 |
2010-04-19 |
2020-04-13 |
Active |
Ressources Minières Vanstar inc. (83671) 49 %; IAMGold Corporation (87628) 51 % |
2% NSR to Vanstar |
Nelligan |
| No. Title |
NTS |
Type |
Area (ha) |
Registration Date |
Expiration Date |
Status |
Owners (GESTIM reference ID) |
Royalty |
Claim Block |
| 2215501 |
32G07 |
CL |
56.00 |
2010-04-19 |
2020-04-13 |
Active |
Ressources Minières Vanstar inc. (83671) 49 %; IAMGold Corporation (87628) 51 % |
2% NSR to Vanstar |
Nelligan |
| 2215502 |
32G07 |
CL |
56.00 |
2010-04-19 |
2020-04-13 |
Active |
Ressources Minières Vanstar inc. (83671) 49 %; IAMGold Corporation (87628) 51 % |
2% NSR to Vanstar |
Nelligan |
| 2215503 |
32G07 |
CL |
55.99 |
2010-04-19 |
2020-04-13 |
Active |
Ressources Minières Vanstar inc. (83671) 49 %; IAMGold Corporation (87628) 51 % |
2% NSR to Vanstar |
Nelligan |
| 2215504 |
32G07 |
CL |
55.99 |
2010-04-19 |
2020-04-13 |
Active |
Ressources Minières Vanstar inc. (83671) 49 %; IAMGold Corporation (87628) 51 % |
2% NSR to Vanstar |
Nelligan |
| 2248358 |
32G07 |
CL |
56.02 |
2010-09-01 |
2020-04-13 |
Active |
Ressources Minières Vanstar inc. (83671) 49 %; IAMGold Corporation (87628) 51 % |
|
Nelligan |
| 2248359 |
32G07 |
CL |
56.02 |
2010-09-01 |
2020-04-13 |
Active |
Ressources Minières Vanstar inc. (83671) 49 %; IAMGold Corporation (87628) 51 % |
|
Nelligan |
| 2248360 |
32G07 |
CL |
56.01 |
2010-09-01 |
2020-04-13 |
Active |
Ressources Minières Vanstar inc. (83671) 49 %; IAMGold Corporation (87628) 51 % |
|
Nelligan |
| 2248361 |
32G07 |
CL |
56.01 |
2010-09-01 |
2020-04-13 |
Active |
Ressources Minières Vanstar inc. (83671) 49 %; IAMGold Corporation (87628) 51 % |
|
Nelligan |
| 2248362 |
32G07 |
CL |
56.01 |
2010-09-01 |
2020-04-13 |
Active |
Ressources Minières Vanstar inc. (83671) 49 %; IAMGold Corporation (87628) 51 % |
|
Nelligan |
| 2248363 |
32G07 |
CL |
56.01 |
2010-09-01 |
2020-04-13 |
Active |
Ressources Minières Vanstar inc. (83671) 49 %; IAMGold Corporation (87628) 51 % |
|
Nelligan |
| 2248364 |
32G07 |
CL |
56.00 |
2010-09-01 |
2020-04-13 |
Active |
Ressources Minières Vanstar inc. (83671) 49 %; IAMGold Corporation (87628) 51 % |
|
Nelligan |
| 2248365 |
32G07 |
CL |
56.00 |
2010-09-01 |
2020-04-13 |
Active |
Ressources Minières Vanstar inc. (83671) 49 %; IAMGold Corporation (87628) 51 % |
|
Nelligan |
| 2248366 |
32G07 |
CL |
56.00 |
2010-09-01 |
2020-04-13 |
Active |
Ressources Minières Vanstar inc. (83671) 49 %; IAMGold Corporation (87628) 51 % |
|
Nelligan |
| 2248370 |
32G07 |
CL |
55.99 |
2010-09-01 |
2020-04-13 |
Active |
Ressources Minières Vanstar inc. (83671) 49 %; IAMGold Corporation (87628) 51 % |
|
Nelligan |
| 2248371 |
32G07 |
CL |
55.99 |
2010-09-01 |
2020-04-13 |
Active |
Ressources Minières Vanstar inc. (83671) 49 %; IAMGold Corporation (87628) 51 % |
|
Nelligan |
| No. Title |
NTS |
Type |
Area (ha) |
Registration Date |
Expiration Date |
Status |
Owners (GESTIM reference ID) |
Royalty |
Claim Block |
| 2248372 |
32G07 |
CL |
55.99 |
2010-09-01 |
2020-04-13 |
Active |
Ressources Minières Vanstar inc. (83671) 49 %; IAMGold Corporation (87628) 51 % |
|
Nelligan |
| 2248373 |
32G07 |
CL |
55.99 |
2010-09-01 |
2020-04-13 |
Active |
Ressources Minières Vanstar inc. (83671) 49 %; IAMGold Corporation (87628) 51 % |
|
Nelligan |
| 2248374 |
32G07 |
CL |
55.99 |
2010-09-01 |
2020-04-13 |
Active |
Ressources Minières Vanstar inc. (83671) 49 %; IAMGold Corporation (87628) 51 % |
|
Nelligan |
| 2248375 |
32G07 |
CL |
55.99 |
2010-09-01 |
2020-04-13 |
Active |
Ressources Minières Vanstar inc. (83671) 49 %; IAMGold Corporation (87628) 51 % |
|
Nelligan |
| 2248385 |
32G07 |
CL |
55.98 |
2010-09-01 |
2020-04-13 |
Active |
Ressources Minières Vanstar inc. (83671) 49 %; IAMGold Corporation (87628) 51 % |
|
Nelligan |
| 2248386 |
32G07 |
CL |
55.98 |
2010-09-01 |
2020-04-13 |
Active |
Ressources Minières Vanstar inc. (83671) 49 %; IAMGold Corporation (87628) 51 % |
|
Nelligan |
| 2248387 |
32G07 |
CL |
55.98 |
2010-09-01 |
2020-04-13 |
Active |
Ressources Minières Vanstar inc. (83671) 49 %; IAMGold Corporation (87628) 51 % |
|
Nelligan |
| 2248388 |
32G07 |
CL |
55.98 |
2010-09-01 |
2020-04-13 |
Active |
Ressources Minières Vanstar inc. (83671) 49 %; IAMGold Corporation (87628) 51 % |
|
Nelligan |
| 2248389 |
32G07 |
CL |
55.98 |
2010-09-01 |
2020-04-13 |
Active |
Ressources Minières Vanstar inc. (83671) 49 %; IAMGold Corporation (87628) 51 % |
|
Nelligan |
| 2248390 |
32G07 |
CL |
55.98 |
2010-09-01 |
2020-04-13 |
Active |
Ressources Minières Vanstar inc. (83671) 49 %; IAMGold Corporation (87628) 51 % |
|
Nelligan |
| 2248391 |
32G07 |
CL |
55.98 |
2010-09-01 |
2020-04-13 |
Active |
Ressources Minières Vanstar inc. (83671) 49 %; IAMGold Corporation (87628) 51 % |
|
Nelligan |
| 2248392 |
32G07 |
CL |
55.98 |
2010-09-01 |
2020-04-13 |
Active |
Ressources Minières Vanstar inc. (83671) 49 %; IAMGold Corporation (87628) 51 % |
|
Nelligan |
| 2248642 |
32G07 |
CL |
56.03 |
2010-09-03 |
2020-04-13 |
Active |
Ressources Minières Vanstar inc. (83671) 49 %; IAMGold Corporation (87628) 51 % |
|
Nelligan |
| 2248643 |
32G07 |
CL |
56.03 |
2010-09-03 |
2020-04-13 |
Active |
Ressources Minières Vanstar inc. (83671) 49 %; IAMGold Corporation (87628) 51 % |
|
Nelligan |
| 2248644 |
32G07 |
CL |
56.03 |
2010-09-03 |
2020-04-13 |
Active |
Ressources Minières Vanstar inc. (83671) 49 %; IAMGold Corporation (87628) 51 % |
|
Nelligan |
| 2248645 |
32G07 |
CL |
56.03 |
2010-09-03 |
2020-04-13 |
Active |
Ressources Minières Vanstar inc. (83671) 49 %; IAMGold Corporation (87628) 51 % |
|
Nelligan |
| No. Title |
NTS |
Type |
Area (ha) |
Registration Date |
Expiration Date |
Status |
Owners (GESTIM reference ID) |
Royalty |
Claim Block |
| 2248646 |
32G07 |
CL |
56.03 |
2010-09-03 |
2020-04-13 |
Active |
Ressources Minières Vanstar inc. (83671) 49 %; IAMGold Corporation (87628) 51 % |
|
Nelligan |
| 2353537 |
32G07 |
CL |
56.03 |
2012-07-03 |
2020-07-02 |
Active |
Ressources Minières Vanstar inc. (83671) 49 %; IAMGold Corporation (87628) 51 % |
|
Nelligan |
| 2353538 |
32G07 |
CL |
56.03 |
2012-07-03 |
2020-07-02 |
Active |
Ressources Minières Vanstar inc. (83671) 49 %; IAMGold Corporation (87628) 51 % |
|
Nelligan |
| 2353540 |
32G07 |
CL |
56.02 |
2012-07-03 |
2020-07-02 |
Active |
Ressources Minières Vanstar inc. (83671) 49 %; IAMGold Corporation (87628) 51 % |
|
Nelligan |
| 2370084 |
32G07 |
CL |
55.98 |
2012-11-08 |
2020-11-07 |
Active |
Ressources Minières Vanstar inc. (83671) 49 %; IAMGold Corporation (87628) 51 % |
|
Nelligan |
| 2372518 |
32G07 |
CL |
56.03 |
2012-12-10 |
2020-12-09 |
Active |
Ressources Minières Vanstar inc. (83671) 49 %; IAMGold Corporation (87628) 51 % |
|
Nelligan |
| 2372519 |
32G07 |
CL |
56.03 |
2012-12-10 |
2020-12-09 |
Active |
Ressources Minières Vanstar inc. (83671) 49 %; IAMGold Corporation (87628) 51 % |
|
Nelligan |
| 2372520 |
32G07 |
CL |
56.03 |
2012-12-10 |
2020-12-09 |
Active |
Ressources Minières Vanstar inc. (83671) 49 %; IAMGold Corporation (87628) 51 % |
|
Nelligan |
| 2372521 |
32G07 |
CL |
56.03 |
2012-12-10 |
2020-12-09 |
Active |
Ressources Minières Vanstar inc. (83671) 49 %; IAMGold Corporation (87628) 51 % |
|
Nelligan |
| 2372522 |
32G07 |
CL |
56.03 |
2012-12-10 |
2020-12-09 |
Active |
Ressources Minières Vanstar inc. (83671) 49 %; IAMGold Corporation (87628) 51 % |
|
Nelligan |
| 2372526 |
32G07 |
CL |
56.02 |
2012-12-10 |
2020-12-09 |
Active |
Ressources Minières Vanstar inc. (83671) 49 %; IAMGold Corporation (87628) 51 % |
|
Nelligan |
| 2372527 |
32G07 |
CL |
56.02 |
2012-12-10 |
2020-12-09 |
Active |
Ressources Minières Vanstar inc. (83671) 49 %; IAMGold Corporation (87628) 51 % |
|
Nelligan |
| 2372528 |
32G07 |
CL |
56.02 |
2012-12-10 |
2020-12-09 |
Active |
Ressources Minières Vanstar inc. (83671) 49 %; IAMGold Corporation (87628) 51 % |
|
Nelligan |
| 2386455 |
32G07 |
CL |
56.01 |
2013-06-12 |
2021-06-11 |
Active |
Ressources Minières Vanstar inc. (83671) 49 %; IAMGold Corporation (87628) 51 % |
|
Nelligan |
| 2389235 |
32G07 |
CL |
56.03 |
2013-08-21 |
2021-08-20 |
Active |
Ressources Minières Vanstar inc. (83671) 49 %; IAMGold Corporation (87628) 51 % |
|
Nelligan |
| No. Title |
NTS |
Type |
Area (ha) |
Registration Date |
Expiration Date |
Status |
Owners (GESTIM reference ID) |
Royalty |
Claim Block |
| 2389236 |
32G07 |
CL |
56.03 |
2013-08-21 |
2021-08-20 |
Active |
Ressources Minières Vanstar inc. (83671) 49 %; IAMGold Corporation (87628) 51 % |
|
Nelligan |
| 2389237 |
32G07 |
CL |
56.02 |
2013-08-21 |
2021-08-20 |
Active |
Ressources Minières Vanstar inc. (83671) 49 %; IAMGold Corporation (87628) 51 % |
|
Nelligan |
| 2389238 |
32G07 |
CL |
56.02 |
2013-08-21 |
2021-08-20 |
Active |
Ressources Minières Vanstar inc. (83671) 49 %; IAMGold Corporation (87628) 51 % |
|
Nelligan |
| 2389239 |
32G07 |
CL |
56.01 |
2013-08-21 |
2021-08-20 |
Active |
Ressources Minières Vanstar inc. (83671) 49 %; IAMGold Corporation (87628) 51 % |
|
Nelligan |
| 2389240 |
32G07 |
CL |
56.01 |
2013-08-21 |
2021-08-20 |
Active |
Ressources Minières Vanstar inc. (83671) 49 %; IAMGold Corporation (87628) 51 % |
|
Nelligan |
| 2389241 |
32G07 |
CL |
56.01 |
2013-08-21 |
2021-08-20 |
Active |
Ressources Minières Vanstar inc. (83671) 49 %; IAMGold Corporation (87628) 51 % |
|
Nelligan |
| 2389242 |
32G07 |
CL |
56.01 |
2013-08-21 |
2021-08-20 |
Active |
Ressources Minières Vanstar inc. (83671) 49 %; IAMGold Corporation (87628) 51 % |
|
Nelligan |
| 2389243 |
32G07 |
CL |
56.01 |
2013-08-21 |
2021-08-20 |
Active |
Ressources Minières Vanstar inc. (83671) 49 %; IAMGold Corporation (87628) 51 % |
|
Nelligan |
| 2389244 |
32G07 |
CL |
56.00 |
2013-08-21 |
2021-08-20 |
Active |
Ressources Minières Vanstar inc. (83671) 49 %; IAMGold Corporation (87628) 51 % |
|
Nelligan |
| 2389245 |
32G07 |
CL |
56.00 |
2013-08-21 |
2021-08-20 |
Active |
Ressources Minières Vanstar inc. (83671) 49 %; IAMGold Corporation (87628) 51 % |
|
Nelligan |
| 2391263 |
32G07 |
CL |
56.04 |
2013-10-02 |
2021-10-01 |
Active |
Ressources Minières Vanstar inc. (83671) 49 %; IAMGold Corporation (87628) 51 % |
|
Nelligan |
| 2391264 |
32G07 |
CL |
56.04 |
2013-10-02 |
2021-10-01 |
Active |
Ressources Minières Vanstar inc. (83671) 49 %; IAMGold Corporation (87628) 51 % |
|
Nelligan |
| 2391265 |
32G07 |
CL |
56.04 |
2013-10-02 |
2021-10-01 |
Active |
Ressources Minières Vanstar inc. (83671) 49 %; IAMGold Corporation (87628) 51 % |
|
Nelligan |
| 2391266 |
32G07 |
CL |
56.04 |
2013-10-02 |
2021-10-01 |
Active |
Ressources Minières Vanstar inc. (83671) 49 %; IAMGold Corporation (87628) 51 % |
|
Nelligan |
| 2391267 |
32G07 |
CL |
56.04 |
2013-10-02 |
2021-10-01 |
Active |
Ressources Minières Vanstar inc. (83671) 49 %; IAMGold Corporation (87628) 51 % |
|
Nelligan |
| 2391268 |
32G07 |
CL |
56.04 |
2013-10-02 |
2021-10-01 |
Active |
Ressources Minières Vanstar inc. (83671) 49 %; IAMGold Corporation (87628) 51 % |
|
Nelligan |
| No. Title |
NTS |
Type |
Area (ha) |
Registration Date |
Expiration Date |
Status |
Owners (GESTIM reference ID) |
Royalty |
Claim Block |
| 2394524 |
32G07 |
CL |
56.04 |
2013-11-22 |
2021-11-21 |
Active |
Ressources Minières Vanstar inc. (83671) 49 %; IAMGold Corporation (87628) 51 % |
|
Nelligan |
| 2394525 |
32G07 |
CL |
56.04 |
2013-11-22 |
2021-11-21 |
Active |
Ressources Minières Vanstar inc. (83671) 49 %; IAMGold Corporation (87628) 51 % |
|
Nelligan |
| 2394526 |
32G07 |
CL |
56.04 |
2013-11-22 |
2021-11-21 |
Active |
Ressources Minières Vanstar inc. (83671) 49 %; IAMGold Corporation (87628) 51 % |
|
Nelligan |
| 2394527 |
32G07 |
CL |
56.04 |
2013-11-22 |
2021-11-21 |
Active |
Ressources Minières Vanstar inc. (83671) 49 %; IAMGold Corporation (87628) 51 % |
|
Nelligan |
| 2394528 |
32G07 |
CL |
56.04 |
2013-11-22 |
2021-11-21 |
Active |
Ressources Minières Vanstar inc. (83671) 49 %; IAMGold Corporation (87628) 51 % |
|
Nelligan |
| 2394529 |
32G07 |
CL |
56.04 |
2013-11-22 |
2021-11-21 |
Active |
Ressources Minières Vanstar inc. (83671) 49 %; IAMGold Corporation (87628) 51 % |
|
Nelligan |
| 2394615 |
32G07 |
CL |
56.04 |
2013-11-25 |
2021-11-24 |
Active |
Ressources Minières Vanstar inc. (83671) 49 %; IAMGold Corporation (87628) 51 % |
|
Nelligan |
| 2394616 |
32G07 |
CL |
56.04 |
2013-11-25 |
2021-11-24 |
Active |
Ressources Minières Vanstar inc. (83671) 49 %; IAMGold Corporation (87628) 51 % |
|
Nelligan |
| 2394617 |
32G07 |
CL |
56.04 |
2013-11-25 |
2021-11-24 |
Active |
Ressources Minières Vanstar inc. (83671) 49 %; IAMGold Corporation (87628) 51 % |
|
Nelligan |
| 2394618 |
32G07 |
CL |
56.03 |
2013-11-25 |
2021-11-24 |
Active |
Ressources Minières Vanstar inc. (83671) 49 %; IAMGold Corporation (87628) 51 % |
|
Nelligan |
| 2394619 |
32G07 |
CL |
56.03 |
2013-11-25 |
2021-11-24 |
Active |
Ressources Minières Vanstar inc. (83671) 49 %; IAMGold Corporation (87628) 51 % |
|
Nelligan |
| 2396140 |
32G07 |
CL |
56.05 |
2013-12-16 |
2021-12-15 |
Active |
Ressources Minières Vanstar inc. (83671) 49 %; IAMGold Corporation (87628) 51 % |
|
Nelligan |
| 2396141 |
32G07 |
CL |
56.05 |
2013-12-16 |
2021-12-15 |
Active |
Ressources Minières Vanstar inc. (83671) 49 %; IAMGold Corporation (87628) 51 % |
|
Nelligan |
| 2396142 |
32G07 |
CL |
56.05 |
2013-12-16 |
2021-12-15 |
Active |
Ressources Minières Vanstar inc. (83671) 49 %; IAMGold Corporation (87628) 51 % |
|
Nelligan |
| 2396143 |
32G07 |
CL |
56.05 |
2013-12-16 |
2021-12-15 |
Active |
Ressources Minières Vanstar inc. (83671) 49 %; IAMGold Corporation (87628) 51 % |
|
Nelligan |
| No. Title |
NTS |
Type |
Area (ha) |
Registration Date |
Expiration Date |
Status |
Owners (GESTIM reference ID) |
Royalty |
Claim Block |
| 2396144 |
32G07 |
CL |
56.05 |
2013-12-16 |
2021-12-15 |
Active |
Ressources Minières Vanstar inc. (83671) 49 %; IAMGold Corporation (87628) 51 % |
|
Nelligan |
| 2396145 |
32G07 |
CL |
56.05 |
2013-12-16 |
2021-12-15 |
Active |
Ressources Minières Vanstar inc. (83671) 49 %; IAMGold Corporation (87628) 51 % |
|
Nelligan |
| 2409718 |
32G07 |
CL |
56.04 |
2014-08-21 |
2020-08-20 |
Active |
Ressources Minières Vanstar inc. (83671) 49 %; IAMGold Corporation (87628) 51 % |
|
Nelligan |
| 2520070 |
32G07 |
CL |
56.06 |
2018-06-28 |
2020-06-27 |
Active |
IAMGold Corporation (87628) 100 % |
|
|
| 2520071 |
32G07 |
CL |
56.06 |
2018-06-28 |
2020-06-27 |
Active |
IAMGold Corporation (87628) 100 % |
|
|
| 2520072 |
32G07 |
CL |
56.06 |
2018-06-28 |
2020-06-27 |
Active |
IAMGold Corporation (87628) 100 % |
|
|
| 2520073 |
32G07 |
CL |
56.06 |
2018-06-28 |
2020-06-27 |
Active |
IAMGold Corporation (87628) 100 % |
|
|
| 2520074 |
32G07 |
CL |
56.06 |
2018-06-28 |
2020-06-27 |
Active |
IAMGold Corporation (87628) 100 % |
|
|
| 2520079 |
32G07 |
CL |
56.11 |
2018-06-28 |
2020-06-27 |
Active |
IAMGold Corporation (87628) 100 % |
|
|
| 2520080 |
32G07 |
CL |
56.11 |
2018-06-28 |
2020-06-27 |
Active |
IAMGold Corporation (87628) 100 % |
|
|
| 2470420 |
32G07 |
CL |
56.06 |
2016-12-01 |
2020-11-30 |
Active |
IAMGold Corporation (87628) 100 % |
|
|
| 2470421 |
32G07 |
CL |
56.06 |
2016-12-01 |
2020-11-30 |
Active |
IAMGold Corporation (87628) 100 % |
|
|
This regulatory filing also includes additional resources:
exhibit99-1.pdf
Iamgold (NYSE:IAG)
Historical Stock Chart
From Mar 2024 to Apr 2024

Iamgold (NYSE:IAG)
Historical Stock Chart
From Apr 2023 to Apr 2024
