FTSE 350 Financial Servi... Key Figures
|
FTSE 350 Financial Servi... Balance Sheet| %1$s Balance Sheet | | Sorry No Data Available |
|
 Share Price Performance| Share Price Performance | | Sample Period † | High | Low | | 1 week | 84.98 | 82.73 |
| 4 weeks | 93.24 | 82.73 |
| 12 weeks | 94.44 | 82.73 |
| 1 year | 98.99 | 69.35 |
Share Price Chart (5 years)| Share Price Chart (5 years) | 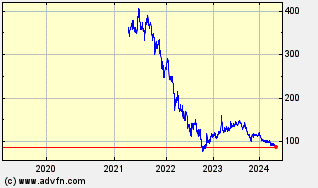 |
|
FTSE 350 Financial Servi... Historic Returns| %1$s Historic Returns | | Giorni da oggi † | Open | Change | % | Open Avg. | Avg. Daily Vol [m] | Total Vol [m] | VWAP | | 1 week | 84.15 | -0.74 | -0.88 | 82.73 | - | | - |
| 4 weeks | 92.06 | -8.65 | -9.40 | 82.73 | - | | - |
| 12 weeks | 87.92 | -4.51 | -5.13 | 82.73 | - | | - |
| 26 weeks | 82.10 | 1.31 | 1.60 | 70.63 | - | | - |
| 1 year | 97.30 | -13.89 | -14.28 | 69.35 | - | | - |
| 3 years | 195.68 | -112.27 | -57.37 | 69.35 | - | | - |
| 5 years | 50.98 | 32.43 | 63.61 | 50.98 | - | | - |
| † periods calculated are whole weeks rather than calendar months | |
|
FTSE 350 Financial Servi... Key Management Ratios
|
FTSE 350 Financial Servi... Investment Ratios
|
FTSE 350 Financial Servi... Financial Ratios
| Beta coefficients | | Beta (60-Mnth) | Beta (36-Mnth) | | Sorry No Data Available | Sorry No Data Available |
|
FTSE 350 Financial Servi... Operating Ratios
|
FTSE 350 Financial Servi... Dividends
|
|
FTSE 350 Financial Servi... Fundamentals |
|
|
FTSE 350 Financial Servi... Balance Sheet
|
FTSE 350 Financial Servi... Cash Flow Statement
|
FTSE 350 Financial Servi... Brokers| Broker infomation is not available for this class of share. |
|
| |
| |
| |
| |