0000275880falseDEF 14A000027588042023-01-012023-12-310000275880ecd:PeoMemberpsn:ChangeInFairValueOfPriorYearAwardsThatAreOutstandingAndUnvestedMemberpsn:CareyASmithMember2022-01-012022-12-310000275880psn:YearEndValueOfAwardsGrantedInFiscalYearThatAreUnvestedAndOutstandingMemberecd:PeoMemberpsn:CharlesLHarringtonMember2020-01-012020-12-31000027588032023-01-012023-12-3100002758802023-01-012023-12-310000275880ecd:NonPeoNeoMemberpsn:ChangeInFairValueOfPriorYearAwardsThatAreOutstandingAndUnvestedMember2020-01-012020-12-310000275880ecd:NonPeoNeoMemberpsn:BeforeCorrectionOfChangeInFairValueOfPriorYearAwardsOutstandingAndUnvestedMember2022-01-012022-12-310000275880ecd:PeoMemberpsn:TotalAdjustmentsMemberpsn:CareyASmithMember2022-01-012022-12-310000275880ecd:NonPeoNeoMemberpsn:ChangeInFairValueFromPriorYearEndOfPriorYearAwardsMember2022-01-012022-12-310000275880ecd:PeoMemberpsn:CharlesLHarringtonMemberpsn:ChangeInFairValueFromPriorYearEndOfPriorYearAwardsMember2021-01-012021-12-310000275880psn:CareyASmithMember2021-01-012021-12-3100002758802021-01-012021-12-310000275880ecd:PeoMemberpsn:ChangeInFairValueOfPriorYearAwardsThatAreOutstandingAndUnvestedMemberpsn:CareyASmithMember2023-01-012023-12-310000275880ecd:PeoMemberpsn:ChangeInFairValueOfPriorYearAwardsThatAreOutstandingAndUnvestedMemberpsn:CharlesLHarringtonMember2020-01-012020-12-310000275880ecd:PeoMemberpsn:CharlesLHarringtonMemberpsn:TotalAdjustmentsMember2021-01-012021-12-310000275880ecd:PeoMemberpsn:ChangeInFairValueFromPriorYearEndOfPriorYearAwardsMemberpsn:CareyASmithMember2022-01-012022-12-310000275880ecd:NonPeoNeoMemberpsn:ValueOfStockAwardsReportedInSctMember2022-01-012022-12-310000275880ecd:PeoMemberpsn:CareyASmithMemberpsn:ValueOfStockAwardsReportedInSctMember2021-01-012021-12-310000275880ecd:NonPeoNeoMemberpsn:ChangeInFairValueOfPriorYearAwardsThatAreOutstandingAndUnvestedMember2021-01-012021-12-310000275880psn:FmvOfAwardsGrantedThisYearAndThatVestedThisYearMemberecd:NonPeoNeoMember2022-01-012022-12-310000275880ecd:NonPeoNeoMemberpsn:ValueOfStockAwardsReportedInSctMember2021-01-012021-12-310000275880ecd:PeoMemberpsn:BeforeCorrectionOfChangeInFairValueOfPriorYearAwardsOutstandingAndUnvestedMemberpsn:CareyASmithMember2021-01-012021-12-310000275880ecd:PeoMemberpsn:BeforeCorrectionOfChangeInFairValueOfPriorYearAwardsOutstandingAndUnvestedMemberpsn:CharlesLHarringtonMember2021-01-012021-12-310000275880psn:YearEndValueOfAwardsGrantedInFiscalYearThatAreUnvestedAndOutstandingMemberecd:PeoMemberpsn:CareyASmithMember2021-01-012021-12-310000275880psn:YearEndValueOfAwardsGrantedInFiscalYearThatAreUnvestedAndOutstandingMemberecd:NonPeoNeoMember2020-01-012020-12-310000275880ecd:NonPeoNeoMemberpsn:YearEndValueOfAwardsGrantedInFiscalYearThatAreUnvestedAndOutstandingMember2021-01-012021-12-310000275880ecd:NonPeoNeoMemberpsn:YearEndValueOfAwardsGrantedInFiscalYearThatAreUnvestedAndOutstandingMember2023-01-012023-12-310000275880psn:YearEndValueOfAwardsGrantedInFiscalYearThatAreUnvestedAndOutstandingMemberecd:PeoMemberpsn:CareyASmithMember2022-01-012022-12-310000275880ecd:PeoMemberpsn:TotalAdjustmentsMemberpsn:CareyASmithMember2021-01-012021-12-310000275880ecd:NonPeoNeoMemberpsn:ChangeInFairValueFromPriorYearEndOfPriorYearAwardsMember2023-01-012023-12-310000275880ecd:NonPeoNeoMemberpsn:TotalAdjustmentsMember2022-01-012022-12-310000275880ecd:PeoMemberpsn:CharlesLHarringtonMemberpsn:ValueOfStockAwardsReportedInSctMember2021-01-012021-12-310000275880psn:YearEndValueOfAwardsGrantedInFiscalYearThatAreUnvestedAndOutstandingMemberecd:PeoMemberpsn:CharlesLHarringtonMember2021-01-012021-12-310000275880ecd:NonPeoNeoMemberpsn:ChangeInFairValueFromPriorYearEndOfPriorYearAwardsMember2021-01-012021-12-310000275880ecd:PeoMemberpsn:ChangeInFairValueOfPriorYearAwardsThatAreOutstandingAndUnvestedMemberpsn:CareyASmithMember2021-01-012021-12-3100002758802020-01-012020-12-310000275880psn:YearEndValueOfAwardsGrantedInFiscalYearThatAreUnvestedAndOutstandingMemberecd:NonPeoNeoMember2022-01-012022-12-310000275880ecd:NonPeoNeoMemberpsn:TotalAdjustmentsMember2023-01-012023-12-310000275880ecd:NonPeoNeoMemberpsn:ValueOfStockAwardsReportedInSctMember2020-01-012020-12-310000275880ecd:NonPeoNeoMemberpsn:ChangeInFairValueOfPriorYearAwardsThatAreOutstandingAndUnvestedMember2023-01-012023-12-310000275880psn:CharlesLHarringtonMember2020-01-012020-12-310000275880ecd:NonPeoNeoMemberpsn:TotalAdjustmentsMember2020-01-012020-12-310000275880psn:CharlesLHarringtonMember2021-01-012021-12-310000275880ecd:PeoMemberpsn:CharlesLHarringtonMemberpsn:TotalAdjustmentsMember2020-01-012020-12-310000275880ecd:PeoMemberpsn:CareyASmithMemberpsn:ValueOfStockAwardsReportedInSctMember2022-01-012022-12-310000275880ecd:PeoMemberpsn:TotalAdjustmentsMemberpsn:CareyASmithMember2023-01-012023-12-31000027588022023-01-012023-12-3100002758802022-01-012022-12-310000275880ecd:NonPeoNeoMemberpsn:BeforeCorrectionOfChangeInFairValueOfPriorYearAwardsOutstandingAndUnvestedMember2021-01-012021-12-310000275880ecd:NonPeoNeoMemberpsn:ChangeInFairValueOfPriorYearAwardsThatAreOutstandingAndUnvestedMember2022-01-012022-12-310000275880ecd:PeoMemberpsn:ChangeInFairValueFromPriorYearEndOfPriorYearAwardsMemberpsn:CareyASmithMember2023-01-012023-12-310000275880ecd:PeoMemberpsn:ChangeInFairValueFromPriorYearEndOfPriorYearAwardsMemberpsn:CareyASmithMember2021-01-012021-12-310000275880psn:CareyASmithMember2023-01-012023-12-310000275880ecd:PeoMemberpsn:BeforeCorrectionOfChangeInFairValueOfPriorYearAwardsOutstandingAndUnvestedMemberpsn:CareyASmithMember2022-01-012022-12-310000275880ecd:PeoMemberpsn:CareyASmithMemberpsn:ValueOfStockAwardsReportedInSctMember2023-01-012023-12-31000027588052023-01-012023-12-310000275880ecd:NonPeoNeoMemberpsn:TotalAdjustmentsMember2021-01-012021-12-310000275880ecd:NonPeoNeoMemberpsn:ValueOfStockAwardsReportedInSctMember2023-01-012023-12-310000275880ecd:PeoMemberpsn:ChangeInFairValueOfPriorYearAwardsThatAreOutstandingAndUnvestedMemberpsn:CharlesLHarringtonMember2021-01-012021-12-310000275880ecd:NonPeoNeoMemberpsn:ChangeInFairValueFromPriorYearEndOfPriorYearAwardsMember2020-01-012020-12-31000027588012023-01-012023-12-310000275880psn:CareyASmithMember2022-01-012022-12-310000275880ecd:PeoMemberpsn:CharlesLHarringtonMemberpsn:ChangeInFairValueFromPriorYearEndOfPriorYearAwardsMember2020-01-012020-12-310000275880ecd:PeoMemberpsn:CharlesLHarringtonMemberpsn:ValueOfStockAwardsReportedInSctMember2020-01-012020-12-310000275880psn:YearEndValueOfAwardsGrantedInFiscalYearThatAreUnvestedAndOutstandingMemberecd:PeoMemberpsn:CareyASmithMember2023-01-012023-12-31xbrli:pureiso4217:USD
UNITED STATES
SECURITIES AND EXCHANGE COMMISSION
Washington, D.C. 20549
SCHEDULE 14A
Proxy Statement Pursuant to Section 14(a) of the Securities
Exchange Act of 1934 (Amendment No.)
Filed by the Registrant ☒
Filed by a Party other than the Registrant ☐
|
|
Check the appropriate box: |
|
|
☐ |
Preliminary Proxy Statement |
☐ |
Confidential, for Use of the Commission Only (as permitted by Rule 14a-6(e)(2)) |
☒ |
Definitive Proxy Statement |
☐ |
Definitive Additional Materials |
☐ |
Soliciting Material under §240.14a-12 |
Parsons Corporation
(Name of Registrant as Specified In Its Charter)
(Name of Person(s) Filing Proxy Statement, if other than the Registrant)
|
|
Payment of Filing Fee (Check the appropriate box): |
|
|
☒ |
No fee required. |
☐ |
Fee paid previously with preliminary materials. |
☐ |
Fee computed on table in exhibit required by Item 25(b) per Exchange Act Rules 14a-6(i)(1) and 0-11. |

Notice of 2024
Annual Meeting
of Stockholders
and Proxy Statement
April 16, 2024
Carey Smith, Chair, President and Chief Executive Officer
To Our Shareholders
Imagine next. At Parsons, we create the future of national security and global infrastructure. We examine every element, including future customer needs, macroenvironment trends, technology evolution, and business model innovation to invent what has never been done. For 80 years, that momentum has driven Parsons forward, and we plan for it to fuel our success for the next 80 years.
Managing a transformational linear city driven by 100% renewable energy; applying artificial intelligence (AI) to determine a cyber adversary’s next move; creating innovative means to investigate and remediate emerging contaminants from surface water, groundwater, and soil; countering unmanned air systems; providing air base air defense; protecting critical infrastructure from cyber attacks; applying a commercial as-a-service business model to space command and control—80 years ago, these tasks would have astounded the world. Today, they are what Parsons is doing around the globe every day to imagine next.
Global Trends
We are in an unprecedented time. In national security, the United States is engaged in simultaneous conflicts abroad, preventing the proliferation of weapons of mass destruction, and countering cyberattacks against United States critical infrastructure, while carefully managing near-peer economic, diplomatic, and military ambitions. The US defense budget is projected to grow at a rate of 3% in the upcoming year, and there is record investment in the research, development, test, and evaluation budget.
In parallel, the demand for global infrastructure is unprecedented, with shifting priorities, including sustainability, innovative financing, new trends post-COVID, resiliency, and technology application. According to Research and Markets, the global infrastructure sector market is estimated at $2.57 trillion in 2023 and is projected to reach $3.48 trillion by 2028, for a compound annual growth rate of 6.27% from 2023 to 2028.
Parsons has the right team and the right portfolio at the right time. We are a solutions integrator that differentiates through advanced technology, including AI, cybersecurity, cloud-enabled solutions, and critical infrastructure protection. We have a unique and complementary portfolio at a time when critical infrastructure is under cyber attack and a company must both understand the domain and have the capabilities to protect it. Our dedicated global team consistently performs, and our status as a destination employer enables strong hiring and retention.
With a macroenvironment aligned to our six core markets of cyber and intelligence, space and missile defense, critical infrastructure protection, transportation, environmental remediation, and urban development, Parsons is able to deliver consistent results year-over-year and quarter-over-quarter for our shareholders. Our more than 18,500 employees are focused on executing our customers’ national security and infrastructure missions at a time when operationally relevant solutions are needed.
2023 Results
During our March 2023 Investor Day, we defined our strategy to move up the solutions integration value chain in our six end markets. Our strategy is working. Total revenue for fiscal year 2023 was $5.4 billion, which was a 30% increase from the prior year and was up 23% on an organic basis. Fiscal year 2023 adjusted EBITDA of $465 million increased 32% from 2022, and adjusted EBITDA margin increased 13 basis points, to 8.5%. Operating cash flow for the full year increased 72%, to $408 million dollars. Ramping up new business wins, delivering on contract growth, and continued strong hiring and retention were key drivers to achieving these outstanding results. As a result of our strong performance, we saw stock price appreciation of 35.6% during the year.
In 2023, we set records for major financial metrics, including industry-leading organic revenue growth in both our Federal Solutions and Critical Infrastructure segments, total revenue growth, adjusted EBITDA which also grew faster than revenue, and all-time highs for cash flow and contract awards. These are the best results Parsons has delivered since our initial public offering.
Significant Accomplishments
– M&A: We completed three strategic acquisitions in 2023, two in our Critical Infrastructure segment and one in our Federal Solutions segment. Each brings enhanced and complementary capabilities to Parsons with immediate synergies.
oI.S. Engineers, LLC: a full-service consulting engineering firm that specializes in transportation engineering, including roads and highways, and program management, located in Texas. Texas is poised to receive nearly $30 billion in total transportation funding from the Infrastructure Investment and Jobs Act between 2022 and 2026.
oSealing Technologies, Inc.: expands Parsons’ customer base across the Department of Defense and Intelligence Community and further enhances Parsons’ capabilities in defensive cyber operations, integrated mission-solutions powered by AI and machine learning (ML), edge computing and edge access modernization, critical infrastructure protection, and secure data management that protects national security.
oIPKeys Power Partners, Inc.: enhances Parsons’ critical infrastructure protection capabilities through comprehensive cloud-based cybersecurity, software solutions that operate at the intersection of information and operational technology (IT and OT), and technologies that will help accelerate the global clean energy transition. This acquisition expands Parsons’ presence in two rapidly growing end markets: grid modernization and cyber resiliency for critical infrastructure.
– Win Rates: Parsons had record win rates, at 66% overall. The recompete win rate was 93%, and we have now won four of our major recompetes, each valued at ~$2 billion, by securing the Federal Aviation Administration Technical Support Services Contract in 2023.
– Won 15 programs > $100 million,including the largest new business contracts we have ever won in both segments. Representative wins include the following:
o$1.8 billion ceiling recompete contract to support the FAA’s Aviation System Capital Investment Plan
o$1.2 billion classified ceiling contract from GSA—our largest new business win in Federal Solutions
o$750 million State Department confidential contract
o$250 million, a single-award classified contract for new and continued work in support of the US government
o$164 million Army Corps of Engineers contract to deliver a new Explosive Decomposition Chamber facility at Holston Army Ammunition Plant
o$160 million Intelligence Community contract to develop hardware and software solutions that enable intelligence operations
o$150 million Southern Nevada Water Authority contract to enhance system reliability, increase water use efficiency, and improve community health
o$150 million contract to serve as lead designer on a major infrastructure replacement project in the northeast United States
o$130 million contract as lead designer for the Port Authority of New York and New Jersey to enhance infrastructure at the John F. Kennedy International Airport
o$100 million for the development of NEOM’s THE LINE, an infrastructure project in the Kingdom of Saudi Arabia
– Book-to-bill: We accomplished a trailing 12-month book-to-bill of 1.1x, and our Critical Infrastructure segment had 13 consecutive quarters of > 1.0x book-to-bill. In addition to our $8.6 billion backlog, we have $14 billion in contracts that have been awarded but not yet booked.
– Recognition: We were recognized for our performance, including placing as one of Engineering News-Record’s top three companies in four categories: program management, construction management, professional services, and program/construction for fee. We received the Development Project of the Year award for the Lusail City Residential Project in Qatar. Parsons EMEA was also recognized by both Dubai Municipality and ROSHN for exemplary consultancy and design services. The Office of the Director of National Intelligence gave us the National Intelligence Collection Award. The Department of Defense recognized us with our fourth mentor-protégé Nunn-Perry Award.
– Blue Grass/Pueblo chemical weapons elimination: Parsons was part of the team that helped the United States comply with the 1997 Chemical Weapons Convention agreement by destroying our country’s last chemical weapon.
– Achieved AS9100 certification: This is a testament to our aerospace quality management system.
– Delivered first Recovery of Airbase Denied by Ordnance (RADBO) system: Parsons delivered our first RADBO system, which included the first ground-based directed energy weapon system to be approved for production, to the Air Force.
Vision And Investment Thesis
Our vision is to move up the value chain as a solutions integrator that differentiates through advanced technology and to prime and win larger, more profitable contracts. Our mission is to deliver digitally enabled solutions in an operationally relevant time for our defense, intelligence, and infrastructure customers.
So, what makes Parsons different and why are we well positioned for the future?
– We have an experienced management team that delivers on commitments.
– Our people-first culture and mission focus attracts destination employees.
– All six of our end markets are growing, enduring, and profitable, each with estimated compound annual revenue growth rates over the next three years between 5% and 12%.
– We have a distinguished national security portfolio positioned to deliver solutions that outpace near-peer threats.
– There is unprecedented global infrastructure spend, including $1.5 trillion in MEA, $1.2 trillion in the US, and $140 billion in Canada expected in the future.
– We have a favorable financial outlook and proven, effective capital deployment strategy. We have a strong balance sheet, and at the end of the year had low debt, enabling further acquisitions as we enter 2024.
Responsible Corporation
Parsons has an 80-year history of cultivating a responsible enterprise. Driven by our core values, Parsons has long been recognized for excellence in corporate citizenship. 2023 continued that legacy of recognitions and our commitment to advancing sustainability, equity, and engagement. In 2023, Parsons was named one of the World’s Most Ethical Companies by Ethisphere for the 14th consecutive year, reinforcing the critical importance of ethics and integrity in driving our culture of performance. That success is built on our active participation in the communities where we live and work, supporting organizations like the Tragedy Assistance Program for Survivors (TAPS), where we have raised $1.3 million in support of military families in the 16 years of our partnership; in 100 employees volunteering a total of 450 hours to support global technology education nonprofit Technovation in its efforts to advance women in STEM; and in a global back-to-school fundraiser where we supported 1,300 students in communities where we work with school supplies, meals, and uniforms. In total, Parsons employees logged more than 35,000 volunteer hours in 2023, a company record which illustrates our commitment to being a responsible partner.
In 2023 we announced our commitment to set near- and long-term targets for Greenhouse Gas (GHG) emissions aligned with 1.5C and net-zero through the Business Ambition for 1.5C campaign, a leading global coalition committed to taking urgent climate action.
Our initiatives have been recognized by leading organizations, including the following:
•Best for Vets company by the Military Times for supporting veterans’ post-military careers
•Best of the Best 2023 Top Veteran-Friendly Companies list by US Veterans Magazine
•A perfect score of 100 on the Human Rights Campaign Foundation Corporate Equality Index for active support and inclusion of the LGBTQ+ community
•STEM Workforce Diversity magazine for the eighth consecutive year as a top national science, technology, engineering, and mathematics employer for minorities, women, and people with disabilities
•Named one of America’s Best Employers for Diversity by Forbes and received recognition for our diversity efforts from Women Engineering Magazine, Newsweek, the American Council of Engineering Companies, and both the Los Angeles Business Journal and the Washington Business Journal.
The Future
In a world of uncertainty and change, our strategy for the future remains constant and focused on continuing to move up the value chain in our six well-funded and growing core end markets. Our expertise in innovative technologies, our mission-focused ethos, and our commitment to solving our customers’ toughest challenges, as outlined in our strategy, are the foundation for our future. While no one can predict the future, we can certainly imagine next and know that digital technology, particularly AI and cyber, will play a significant role.
In closing, I want to thank the employees of Parsons Corporation for delivering results for our customers and shareholders in 2023. It is our mission plus our unique culture that engage and excite our employees to imagine next.
Carey Smith
Chair, President, and CEO

NOTICE OF PARSONS CORPORATION 2023 ANNUAL MEETING OF STOCKHOLDERS
|
|
|
Time and Date: |
|
9:00 a.m. (EDT), April 16, 2024 |
|
|
Place: |
|
Virtual Meeting accessible via: www.virtualshareholdermeeting.com/PSN2024. |
|
|
Agenda: |
|
1. The election of four director nominees named in the proxy statement; |
|
|
|
|
2. The ratification of the selection of PricewaterhouseCoopers LLP as the Company’s independent registered public accounting firm for the Company’s fiscal year 2024; |
|
|
|
|
3. A non-binding advisory vote on the compensation program for the Company’s named executive officers, as disclosed in the Compensation Discussion and Analysis section of the proxy statement; and |
|
|
|
|
4. The transaction of any business that may be properly brought before the annual meeting. |
|
|
|
|
The Board of Directors recommends that you vote FOR Proposals 1, 2, and 3. |
|
|
Record Date: |
|
Only holders of record of the Company’s common stock on February 20, 2024 will be entitled to vote at the annual meeting. |
|
|
Date of Distribution: |
|
This proxy statement and the accompanying materials are being mailed to stockholders on or about March 5, 2024. |
|
|
Proxy Voting: |
|
Your vote is important. Whether or not you plan to attend the annual meeting, you may access electronic voting via the Internet or the automated telephone voting feature, both of which are described on your enclosed proxy card, or you may sign, date, and return the proxy card in the envelope provided. If you plan to attend the annual meeting, you may vote in person. |
On Behalf of the Board of Directors,
/s/ Michael R. Kolloway
Michael R. Kolloway
Chief Legal Officer and Secretary
March 3, 2024
Important Notice Regarding the Availability of Proxy Materials for the Annual Meeting of Stockholders to be held on April 16, 2024. This Notice of Annual Meeting and Proxy Statement and our 2023 Annual Report are available at www.parsons.com.
TABLE OF CONTENTS TO PROXY STATEMENT
PROXY STATEMENT SUMMARY
This summary highlights certain information contained elsewhere in this proxy statement. The summary does not contain all of the information that you should consider, and you should review our Annual Report on Form 10-K for the year ended December 31, 2023 and the entire proxy statement carefully before voting.
Unless the context otherwise requires, (i) the terms “Parsons,” “the Company,” “we,” “us” and “our” refer to Parsons Corporation and its consolidated subsidiaries, (ii) “our Board” or “the Board” means the Board of Directors of the Company; (iii) “stockholder” means holders of our common stock; and (iv) “you,” “your,” “yours,” or other words of similar import in this proxy statement refers to stockholders entitled to vote on the matters to be presented at the annual meeting.
2024 Annual Meeting of Stockholders
|
|
|
Date and Time: |
|
April 16, 2024 at 9:00 a.m. EDT |
|
|
Place: |
|
Virtual Meeting (www.virtualshareholdermeeting.com/PSN2024) |
|
|
Record date: |
|
February 20, 2024 |
|
|
Admission: |
|
Annual meeting admission is limited to our registered and beneficial stockholders as of the record date and persons holding valid proxies from stockholders. Admission to our annual meeting requires proof of your stock ownership as of the record date, and valid, government-issued identification. See “Important Information about Annual Meeting and Proxy Procedures” in this proxy for additional information. |
Voting Matters and Board Recommendations
Stockholders are being asked to vote on the following matters at the 2024 Annual Meeting of Stockholders:
|
|
|
|
Proposal |
Description |
Board’s Voting
Recommendation |
Page
Reference |
|
|
|
|
No. 1 |
Election of four director nominees |
FOR each nominee |
7 |
|
|
|
|
|
|
|
|
No. 2 |
Ratification of appointment of PricewaterhouseCoopers LLP (“PwC”) as the Company’s independent registered accounting firm for fiscal year 2024 |
FOR |
72 |
|
|
|
|
|
|
|
|
No. 3 |
A non-binding advisory vote on the compensation program for the Company’s named executive officers, as disclosed in the Compensation Discussion and Analysis (“CD&A”) of the proxy statement |
FOR |
73 |
|
|
|
|
|
|
|
|
How to Vote
Stockholders as of the record date may vote in person at the meeting or vote in advance by submitting a proxy by Internet, telephone, or mail as follows:
•In person by attending the Annual Meeting and following the instructions provided in the Notice;
•Via the Internet by following the instructions provided in the Notice;
•If you request printed copies of the proxy materials by mail, by filling out the proxy card included with the materials; or
•By calling the toll-free number found on the proxy card or the Notice
Company Performance and 2023 Highlights
We are very proud of our accomplishments in 2023:
•Record Revenue of $5.4 billion
•Net income of $161.1 million
•Record adjusted earnings before interest, taxes, depreciation and amortization (“EBITDA”) of $464.7 million
•Record cash flow from operating activities of $408 million
•Achieved significant improvement in retention and record recruiting
•Completed the acquisition of Sealing Technologies, Inc. to enhance our capabilities in defensive cyber operations, integrated mission-solutions powered by artificial intelligence (AI) and machine learning (ML), edge computing and edge access to modernization, critical infrastructure protection, and secure data management that protects national security
•Completed the acquisitions of IPKeys Power Partners, Inc. and I.S. Engineers LLC to enhance our capabilities in critical infrastructure protection and transportation engineering and to position the company for projects receiving transportation funding under the Infrastructure Investment and Jobs Act between 2024 and 2026
•Won fifteen large contracts each worth more than $100 million or more in growing and enduring markets
•Continued to build on our long-standing commitment to sustainability and corproate responsibility initiatives
•Achieved notable recognition as an employer of choice from military/veterans, diversity, and other groups and achieved several notable highlights as shown in the environmental, social, governance (ESG) and corporate citizen highlights throughout the document
We calculate adjusted EBITDA as net income attributable to Parsons Corporation, adjusted to include net income attributable to noncontrolling interests and to exclude interest expense (net of interest income), provision for income taxes, depreciation and amortization and certain other items that we do not consider in our evaluation of ongoing operating performance. These other items include, among other things, impairment of goodwill, intangible and other assets, interest and other expenses recognized on litigation matters, expenses incurred in connection with acquisitions and other non-recurring transaction costs, equity-based compensation, and expenses related to our corporate
restructuring initiatives. EBITDA and adjusted EBITDA are non-GAAP metrics, and we include a reconciliation of both EBITDA and adjusted EBITDA to net income for fiscal years 2023 and 2022 as Appendix A. It is an important component of our compensation programs described in this proxy statement.
Our Board of Directors
This year’s Board nominees include four current Class II Directors—Mark K. Holdsworth, Steven F. Leer, M. Christian Mitchell, and David C. Wajsgras. Each nominee is listed below along with the continuing Directors,and you can find additional information under “Proposal 1: Election of Directors” beginning on page 7.
Corporate Governance Highlights
•In 2023, nine of our eleven Directors were independent, and the Audit and Risk, Compensation and Management Development, and Corporate Governance and Responsibility Committees are 100% independent.
•Our Board of Directors reflects diversity in gender, ethnicity, experience, qualifications, attributes, and skills.
•The Board undertakes an annual evaluation of its performance, and each Committee of the Board undertakes an annual evaluation of the Committee’s performance and of the adequacy of its charter.
•The Board of Directors holds regular executive sessions of non-management Directors.
•The Board of Directors conducts an annual discussion on management and level 2 leadership succession planning.
•Our investor relations and management teams regularly engage with current and potential investors.
•Note: Mark Van Andel to update In 2023, Parsons elected to disclose information related to our climate-related governance, risk management and metrics utilizing the Task Force on Climate-Related Financial Disclosures (TCFD) framework. We conducted climate risk and opportunity workshops with senior leaders representing a cross-section of our geographies, markets, and corporate functions. Our Chief Executive Officer holds overall executive-level responsibility for Environmental, Social and Governance (ESG), and primary responsibility for ESG risk and opportunity identification and management is assigned to our vice president for ESG.
•The Charter of the Compensation and Management Development Committee was amended to confirm the Committee’s ability to claw back executive compensation in conformance with the Dood-Frank Act.
•The Charter of the Corporate Governance and Responsibility Committee (CG&R) confirms the Committee’s oversight of the Corporation’s ESG policies, procedures and initiatives, including policies and documentation related to climate-related initiatives and disclosures.
•The CG&R Committee’s charter also confirms the Committee’s responsibility for reviewing and considering all Stockholder proposals and ensuring compliance with all applicable disclosure requirements.
•Parsons’ Insider Trading Policy requires all members of the board of directors and the direct reports of the CEO and the CFO to adopt SEC Rule 10b5-1 trading plans prior to selling any of the Corporation’s securities.
•During fiscal 2023, all incumbent directors attended at least 90% of the aggregate of meetings of the Board of Directors and/or the Committees on which they served.
Executive Compensation Highlights
•Together with our Compensation and Management Development Committee, we are committed to managing a compensation program that is competitive and aligns the interests of our executives with the long-term interests of our stockholders. We continuously seek to evolve our approach and stay connected with the views of our stockholders.
•Our executive compensation programs and policies have been designed to support the development and performance of a strong executive team who are provided with incentives that align with our business strategy and values, attract and retain top talent and address different risks associated with compensation. We provide a total compensation package that fairly and equitably rewards our senior leadership as a team and as individuals, from which we expect superior performance.
•We have designed our executive pay programs to reward executives for positive company performance and align their interests with those of our stockholders by having a significant portion of compensation composed of performance-based or “at-risk” compensation. We provide an appropriate balance of short- and long-term compensation, with payouts based on the Company’s achievement of certain objective financial and non-financial metrics. We have structured our short-term incentive opportunities to focus on the achievement of specific annual financial objectives that will further our longer-term growth objectives. We use our long-term incentive compensation to provide incentives for our executive team to focus on the growth of our overall enterprise value and, correspondingly, to create value for our employee stockholders.
•In designing and implementing our executive compensation programs, we follow practices that promote proper governance and serve the interests of our stockholders, with maximum payout caps in place for annual cash incentives and long-term performance awards.
•For more details on our compensation program, please see our discussion in the CD&A section of this proxy.
Corporate Citizenship Highlights
Imagine Next extends to our commitment to imagining what’s next for the communities where we live and work. Driven by our core values – safety, quality, innovation, sustainability, integrity, and diversity – and underpinned by our CARE (Cultivating a Responsible Enterprise) strategy,our Parsons Gives Back program outlines our active charitable and engagement support to communities and organizations towards imagining a safer, healthier, more connected, and more secure world.
Our Parsons Gives Back efforts are employee-driven and focused on veteran/military, Educational/STEM Outreach, and Vibrant Communities causes. The CG&R Committee of the Board oversees Parsons Corporation’s ESG efforts and receives regular reports from the Chief Business Operations Officer and ESG vice president.
Recognitions and initiatives include:
•We were recognized by the Ethisphere Institute as one of the World’s Most Ethical Companies for the 14th consecutive year. The World’s Most Ethical (WME) Companies assessment is based upon the Ethisphere Institute’s Ethics Quotient (EQ) framework, which offers a quantitative way to assess a company’s performance in an objective,consistent and standardized manner. Scores are generated in five key categories: ethics and compliance program,culture of ethics,corporate citizenship and responsibility, governance and leadership, and reputation.
•We proudly support those actively serving our country, veterans of the armed forces, and military families. Part of that commitment is our long-held partnership with TAPS (Tragedy Assistance Program for Survivors), where in 2023 we hosted the 16th annual TAPS Golf Outing, raising over $100,000 for the organization. In the 16 years we have partnered with TAPS for the event, we have raised more than $1,289,984.
•We teamed up with global tech education nonprofit Technovation for their annual Girls Challenge, forming a panel of 100 judges from Parsons who volunteered more than 450 hours to review and score the girls’ (aged 8-18) submittals highlighting local challenges in their communities and the AI apps they developed to help solve the issues.
•We held a global back-to-school fundraiser, supporting three non-profits (Kids in Need, Education Above All, and Start2Finish), raising $26,768, which provided school supplies, backpacks, meals, school uniforms, and education for nearly 1,300 students around the world.
•We supported social entrepreneurship nonprofit 48in48’s Social Justice Build, building four web sites over a 48-hour period for non-profits who are working toward social justice and equality. 48in48 connects nonprofits in need with skilled volunteers who give of their own time and talents to help build organization websites in a 48-hour period. Our volunteers have supported 48in48’s web site builds since 2019.
•In 2023, Parsons employees set a new record of logged volunteer hours, totaling more than 35,000 hours globally.
Our commitment to enhancing diversity, equity and inclusion as fundamental to our corporate culture is evident through our support of active duty and veteran employees (MILVET), employees in the LGTBQ+ community (PRIDE Alliance), employees of African/American heritage (BELONG),employees of Hispanic/Latino heritage (HOLA), Parsons’Women’s Roundtable (PWR), and employees of Asian and Pacific Islander heritage (SOAR), and their allies. Parsons also launched its seventh employee resource group, the Formation of Rising Career Employees (FORCE), designed to provide a supportive community for employees who are in the early stages of their careers at Parsons.
Other notable recognitions include:
•Los Angeles Business Journal: 2023 Diversity, Equity + Inclusion Symposium & Awards: DEI Company of the Year
•The Gazette (Colorado Springs): 2023 Gazette Best Places to Work - Extra Large Division Companies
•Minority Engineer Magazine: 2023 Top 50 Diversity Employer
•STEM Workforce Diversity Magazine: 2023 Top 50 Employers: STEM Workforce Diversity (Reader's Choice) #27)
•USA Today: America's Climate Leaders
•Military Times Magazine: Best for Vets 2023 (#27)
•American Council of Engineering Companies, New York: Diversity, Equity, Inclusion & Belonging Award: Community Impact 2023
•Human Rights Campaign Foundation - Corporate Equality Index: Equality 100 - Leader in LGBTQ+ Workplace Inclusion
•Forbes Magazine: 2023 Best Employers for Diversity
•G.I. Jobs: Corporate Champion
•Newsweek: America's Greatest Workplaces for Diversity 2024
•Newsweek: America's Greenest Companies (2024) - 5 Stars
•U.S. Veterans Magazine: Best of the Best 2023
•U.S. Veterans Magazine: VETS Indexes: 4 Star Employer 2023
•Washington Business Journal: Corporate Diversity Index (Large Companies) #19
•Washington Business Journal: Women on Public Company Boards List #21
•Woman Engineer Magazine: Top Employers 2023
PROPOSAL 1: ELECTION OF DIRECTORS
Board Structure
Our Board of Directors currently consists of eleven members. In accordance with our certificate of incorporation, our Board of Directors are divided into three classes with staggered three-year terms. At each annual meeting of stockholders after the initial classification, the successors to the Directors whose terms will then expire will be elected to serve from the time of election and qualification until the third annual meeting following their election. Our current Directors are divided among the three classes as follows:
•The Class I Directors are Letitia A. Long, Harry T. McMahon and Carey A. Smith, and their terms will expire at the 2026 annual meeting of stockholders;
•The Class II Directors are Mark K. Holdsworth, Steven F. Leer, M. Christian Mitchell, and David C. Wajsgras, and their terms will expire at the annual meeting of stockholders to be held on April 16, 2024. Directors Holdsworth, Leer, Mitchell, and Wajsgras are seeking re-election at the 2024 annual meeting of stockholders; and
•The Class III Directors are George L. Ball, Ellen M. Lord, Darren W. McDew, and Suzanne M. Vautrinot, and their terms will expire at the 2025 annual meeting of stockholders.
Any increase or decrease in the number of Directors will be distributed among the three classes so that, as nearly as possible, each class will consist of one-third of the Directors. This classification of our Board of Directors may have the effect of delaying or preventing changes in control of our company.
Class II Election
The four nominees for election as Class II Directors are listed below. If elected, the nominees for election as Class II Directors will serve for a term of three years and until their successors are elected and qualify. Unless you instruct us on the proxy card to vote differently, we will vote signed, returned proxies FOR the election of such nominees. If for any reason any nominee cannot or will not serve as a Director, we may vote such proxies for the election of a substitute nominee designated by the Board.
Class II Nominees
To be elected in, a nominee must receive a plurality of the votes cast. The Corporate Governance and Responsibility Committee and the Board believe that each Class I Nominee brings a strong and diverse set of skills and experiences to the Company, including significant government, public company, financial, and strategic experience, that strengthen our Board’s independent leadership and effectiveness with respect to our business and long-term strategy. The Class II Nominees are as follows:
|
|
|
Mark K. Holdsworth (Class II) 
Age: 58 Director Since: 2006 Committees: •Corporate Governance & Responsibility Management Development |
|
Mark K. Holdsworth is the founder and managing partner of The Holdsworth Group, LLC, a trusted capital partner, advisor and curator of alternative investments for family offices and corporations worldwide. From 1999-2018, Mr. Holdsworth was a Co-Founder, managing partner and an operating partner of Tennenbaum Capital Partners, LLC, a Los Angeles-based private multi-strategy investment firm that was acquired by BlackRock, Inc. in August 2018, and he was a managing director at BlackRock until April 2019. Additionally, Mr. Holdsworth is the chairman of the board of directors of RF Industries, Ltd. (NASDAQ: RFIL) and a member of the board of directors for PlantsExpress.com. Mr. Holdsworth has over 25 years of board experience and specializes in active management oversight, strategy, M&A activity and complex financings, and assessing quality and performance in a wide variety of corporate sectors. He has also served as a board member or board chairperson of several public and private companies in a variety of industries. Mr. Holdsworth earned a bachelor-of-arts degree from Pomona College, a bachelor-of-science degree from the California Institute of Technology and a master-of-business administration degree from Harvard Business School. We believe that Mr. Holdsworth is qualified to serve on our Board of Directors due to his unique qualifications and skills, as further described in the Board Skills Matrix set forth in this Proxy Statement. |
|
|
|
Steven F. Leer (Class II) 
Age: 70 Director Since: 2013 Committees: •Compensation & Management Development |
|
Steven F. Leer is the former chairman of the board of directors of Arch Coal, Inc., a position he held from 2006 to April 2014. Mr. Leer served as director of Arch Coal, Inc. and its predecessor company from 1992 to 2014 and as chief executive officer from 1992 to 2012. As CEO, Mr. Leer successfully managed numerous acquisitions and sales of public and private businesses and has experience with environmental agencies and regulators. In addition, he serves on the boards of Norfolk Southern Corporation and Cenovus Energy. Mr. Leer is a former regent of the University of the Pacific, a former trustee of Washington University in St. Louis and previously served on the board of directors of USG Corporation. Mr. Leer earned a bachelor-of-science degree in electrical engineering from the University of the Pacific and a master-of-business administration degree from Washington University’s Olin School of Business. Mr. Leer was appointed the Lead Independent Director for Parsons effective April 14, 2022. We believe that Mr. Leer is qualified to serve on our Board of Directors due to his unique qualifications and skills, as further described in the Board Skills Matrix set forth in this Proxy Statement. |
|
|
|
M. Christian Mitchell (Class II) 
Age: 68 Director Since: 2011 Committees: •Corporate Governance & Responsibility |
|
M. Christian Mitchell has served on public and private company boards and has gained extensive experience addressing corporate governance and enterprise risk issues in large and complex professional services. Mr. Mitchell was a national managing partner of Deloitte & Touche LLP and previously served as regional managing partner for various practices with the firm, including assurance, enterprise risk services, and financial services. He was also a founding member of the board of directors of Deloitte Consulting. Mr. Mitchell currently serves as a director for Pacific Premier Bancorp, Inc. and AG Mortgage Investment Trust, Inc. Mr. Mitchell is chair emeritus of the Pacific Southwest Chapter of the NACD and served on the national board of directors from 2017 to 2019. He was awarded NACD Directorship 100 recognition in 2011 and 2012. Mr. Mitchell is on the Board of Visitors for the Culverhouse College of Business at the University of Alabama. Mr. Mitchell earned a bachelor-of-science degree in accounting, summa cum laude, from the University of Alabama. We believe that Mr. Mitchell is qualified to serve on our Board of Directors due to his unique qualifications and skills, as further described in the Board Skills Matrix set forth in this Proxy Statement. |
|
|
|
David C. Wajsgras (Class II) 
Age: 63 Director Since: 2020 Committees: •Compensation & Management Development |
|
David C. Wajsgras is the Chief Executive Officer of Intelstat, operator of the world’s first global satellite network and a leader in integrated satellite communications. Intelstat delivers critical broadband connectivity and content distribution that impacts and transforms businesses and communities in more than 200 countries. Mr. Wajsgras become CEO of Intelstat in 2022 and focuses on driving innovation and generating long-term value for the company’s stakeholders across the government, media, mobile network operators, commercial aviation and other mobility sectors. He joined Intelstat after two decades of providing operational, strategic, and financial leadership in both the commercial and defense industries. Previously, Mr. Wajsgras served as president of the Intelligence, Information and Services (IIS) business at the former Raytheon Company, now part of Raytheon Technologies (RTX). Mr. Wajsgras was named to Executive Mosaic’s Wash 100 list of top government contracting leaders for seven years and was also selected as WashingtonExec’s CEO of the year in 2023, Intel Industry Executive of the year in 2019 and Federal Computer Week’s Industry Eagle award winner in 2018. Mr. Wajsgras earned his bachelor-of-science degree in accounting from the University of Maryland and his master-of-business administration from American University. We believe that Mr. Wajsgras is qualified to serve on our Board of Directors due to his unique qualifications and skills, as further described in the Board Skills Matrix set forth in this Proxy Statement. |
|
The Board of Directors recommends a vote FOR each of the Class II nominees. |
CONTINUING DIRECTORS
The seven Directors whose terms will continue after the annual meeting and will expire at the 2025 annual meeting (Class III) or the 2026 annual meeting (Class II) are listed below.
|
|
|
George L. Ball (Class III) 
Age: 65 Director Since: 2022 |
|
George L. Ball joined Parsons’ Board of Directors in 2022 following his tenure as the corporation’s Chief Financial Officer (CFO) from 2008-2022. As CFO, Ball played an integral role in guiding the transformation of the company and led its IPO in 2019. He joined Parsons in 1995 and served in multiple financial and operational positions with global portfolios prior to serving as CFO. Mr. Ball serves on the board of directors of BrandSafway and has also served on the boards of directors of multiple public and non-profit organizations, including Cornerstone Building Brands, Inc., Wells Fargo Real Estate Investment Corporation, the Ronald McDonald House Charities of Southern California, and the Board of Trustees of the Los Angeles County Arboretum Foundation. He has NACD Directorship (NACD.DC) and cyber certifications. Mr. Ball holds a bachelor’s degree in accounting from Drexel University. |
|
|
|
Ellen M. Lord (Class III) 
Age: 64 Director Since: 2022 Committees: •Compensation & Management Development •Corporate Governance & Responsibility |
|
Ellen M. Lord served as the Under Secretary of Defense for Acquisition and Sustainment for the United States Department of Defense from August 2017 until January 2021. In this role, she was responsible for all matters about acquisition; developmental testing; contract administration; logistics and materiel readiness; installations and environment; operational energy; chemical, biological, and nuclear weapons; the acquisition workforce; and the defense industrial base. Before her government service, Ms. Lord served as the President and Chief Executive Officer of Textron Systems from October 2012 to August 2017, where she led a multi-billion-dollar company with products and services supporting defense, homeland security, aerospace and infrastructure protection. Prior to that, she served in other leadership positions at Textron Systems and related companies. Ms. Lord is the former Vice Chairman of the National Defense Industrial Association and has previously served on the boards of the U.S. Naval Institute, the U.S. India Business Council and the Defense Technology Initiative. She also serves on the boards of directors of AAR Corporation, Comtech Telecommunications Corporation, and Voyager Space Holdings, and as an advisor to a number of companies. She earned a Master of Science degree in chemistry from the University of New Hampshire and a Bachelor of Arts degree in chemistry from Connecticut College. Ms. Lord currently is an independent consultant for the aerospace, defense and industrial industries. |
|
|
|
Gen Darren W. McDew USAF (ret.) (Class III) 
Age: 63 Director Since: 2020 Committees: •Corporate Governance & Responsibility •Compensation & Management Development |
|
Gen. Darren W. McDew (USAF, Ret.) served as the Commander, United States Transportation Command (USTRANSCOM), where he led the unified combatant command comprised of all the armed services and served as the senior uniformed officer responsible for global air, land, and sea transportation, and patient movement for the Department of Defense. Gen. McDew served with distinction in the United States military for 36 years, with multiple command billets and assignments including Military Aide to the President, Strategic Plans and Policy for the Chairman of the Joint Chiefs, and as Commander, Air Mobility Command. Gen. McDew also serves on the board of directors of Abbott Laboratories, General Electric (GE), and USAA. He has environmental agency and regulatory experience as a former Department of Defense major command and combatant commander. Gen McDew earned his bachelor-of-science degree in civil engineering from the Virginia Military Institute and his master-of-science degree in aviation management from Embry-Riddle Aeronautical University. |
|
|
|
Major General Suzanne M.
“Zan” Vautrinot USAF (ret.) (Class III) 
Age: 63 Director Since: 2014 Committees: •Corporate Governance & Responsibility |
|
Major General Suzanne M. “Zan” Vautrinot, (USAF, Ret.) is president of Kilovolt Consulting, Inc., a cybersecurity strategy and technology consulting firm, and has served as president since October 2013. She has significant space systems experience. Before retiring in October 2013 after 31 years of service, Zan was a Major General in the United States Air Force and served as Commander, 24th Air Force, Air Forces Cyber and Air Force Network Operations, where she oversaw a multi-billion-dollar global cyber enterprise with 14,000 military personnel, civilians, and contractors and over 40 worldwide sites. She serves as a director on the boards of CSX Corp., Ecolab Inc., and Wells Fargo & Company, and she was inducted into the National Academy of Engineering in 2017. Zan earned a bachelor-of-science degree from the United States Air Force Academy, a master-of-science degree from the University of Southern California and is a graduate of the Air Command and Staff and Air War Colleges and was a National Security Fellow at Harvard University. |
|
|
|
Letitia A. Long (Class I) 
Age: 64 Director Since: 2020 Committees: •Corporate Governance & Responsibility |
|
Letitia A. Long currently serves as chairwoman of the board of directors of the Intelligence and National Security Alliance (INSA). Ms. Long previously served as Director of the National Geospatial-Intelligence Agency from 2010-2014 and as Deputy Director of the Defense Intelligence Agency, Deputy Undersecretary of Defense Intelligence (Planning, Policy & Resources), and Deputy Director of Naval Intelligence for the Department of Defense. Ms. Long serves on the board of directors of T-Mobile U.S., and COPT Defense Properties and is a member of the National Geospatial-Intelligence (NGA) Advisory Board. Ms. Long is member of the Virginia Tech Board of Visitors and provides mentoring and advisory work for the government on space and special reconnaissance programs and has remote earth sensing and geospatial intelligence experience. Ms. Long previously served on the board of directors of Raytheon Company, now part of Raytheon Technologies, from 2015 until 2020 and chaired the Public Policy and Corporate Responsibility Committee. Ms. Long was awarded NACD Directorship 100 in 2020 and was elected to the Virginia Tech Academy of Engineering Excellence. She received her bachelor-of-science degree in electrical engineering from Virginia Polytechnic Institute and State University and her master-of-science degree in engineering from The Catholic University of America. |
|
Harry T. McMahon (Class I) 
Age: 70 Director Since: 2018 Committees: •Compensation & Management Development |
|
Harry T. McMahon spent 32 years in investment banking and has broad experience providing strategic and financial solutions for corporations and institutions worldwide. This includes leading teams on mergers and acquisitions and corporate finance advisory projects, many of which involved industries adjacent to Parsons Corporation, such as infrastructure, engineering, aerospace and defense, enterprise technology, and federal services. He previously served as co-head of Global Corporate Finance at Merrill Lynch and then as Executive Vice-Chairman of Bank of America. He currently serves as a director of Direct Relief, a global provider of humanitarian aid, and as a trustee of Claremont McKenna College, where he previously served as chairman of the board. He earned a bachelor-of-arts degree and honorary doctorate from Claremont McKenna College and a master-of-business administration from the University of Chicago Booth School of Business. |
|
|
|
Carey A. Smith (Class I) 
Age: 60 Director Since: 2020 |
|
Carey A. Smith was elected the President and Chief Executive Officer of Parsons Corporation in July 2021 and Chair of the Board of Directors effective April 14, 2022. Ms. Smith joined Parsons in 2016 as President of our Federal Solutions business and has had progressive roles as the company’s Chief Operating Officer, and President and Chief Operating Officer. During her tenure, Ms. Smith has driven Parsons’ transformation into a balanced federal and infrastructure portfolio and moved the company up the solutions integration value chain. Prior to joining Parsons, Ms. Smith held a series of escalating executive leadership roles within the aerospace and defense industry at both Honeywell and Lockheed Martin, including serving as Honeywell’s President of the Defense and Space business unit. She serves on the board of directors of Edison International, the Professional Services Council non-profit, where she previously served as chair of the board of directors, and the Saudi-Arabia Parsons Ltd (SAPL). Ms. Smith’s recognitions include being a six-time recipient of the Executive Mosaic Wash100, four-time recipient of the WashingtonExec “Top Execs to Watch”,Virginia 500 Power List, top 5 COOs in Government Contracting, Ohio Northern University Alumni of the Year, and Marlington High School Alumni of the Year. In 2023, Ms. Smith was recognized as the GovCon Executive of the Year. Ms. Smith received an honorary doctorate degree from Ohio Northern University, a master’s degree in electrical engineering from Syracuse University and a bachelor-of-science degree in electrical engineering from Ohio Northern University. She has NACD Directorship (NACD.DC) and cyber certifications. |
CORPORATE GOVERNANCE AND GENERAL INFORMATION CONCERNING THE BOARD OF DIRECTORS AND ITS COMMITTEES
Our Board and Leadership Structure
Our Board currently consists of eleven Directors, nine of whom are independent. There are no family relationships among our executive officers and Directors. Each incumbent member of the Board attended or participated in 90% or more of the aggregate of (i) the total number of meetings of the Board (held during the period for which such person has been a Director) and (ii) the total number of meetings held by all Committees of the Board on which such person served (during the periods that such person served).
Our Board of Directors recognizes that one of its key responsibilities is to evaluate and determine its optimal leadership structure to provide effective oversight of management. Our bylaws and corporate governance guidelines provide our Board of Directors with flexibility to combine or separate the positions of Chair of the Board of Directors and Chief Executive Officer (CEO). Our Board of Directors currently believes that our existing leadership structure is effective, provides the appropriate balance of authority between independent and non-independent Directors, and achieves the optimal governance model for us and for our stockholders. The Chair/CEO has the best in depth knowledge of the company’s opportunities and challenges, develops agendas that ensure the Board’s time is focused on the most critical matters, and enhances our ability to communicate our strategy to our stockholders, customers and employees.
Ms. Smith serves as our Chair of the Board of Directors.
Our corporate governance guidelines provide that we have a lead independent Director. Our Lead Independent Director is Steven F. Leer. In that role, he has called meetings of the independent Directors and chaired such meetings, including all executive sessions of the Board of Directors, facilitated communications between our Chair and the independent Directors of the Board of Directors, and reviewed the quantity, quality and timeliness of information provided to the Board, among other duties described in our corporate governance guidelines.
Corporate Governance Guidelines
The Board has adopted Corporate Governance Guidelines. The Board and the Corporate Governance and Responsibility Committee are responsible for reviewing and amending these guidelines as they deem necessary and appropriate. The Corporate Governance and Responsibility Committee is responsible for overseeing the system of corporate governance of the Company and the corporation’s environment, social and governance initiatives. The Corporate Governance and Responsibility Committee has reviewed and approved an updated Skills Matrix for Board members (which is included in this proxy statement) and to reflect the Committee’s oversight of climate-related initiatives and documentation. The Corporate Governance Guidelines are available without charge on the Investor Relations portion of our website, www.parsons.com.
Codes of Conduct and Ethics
We have adopted written codes of conduct and ethics that apply to our Directors, officers and employees, including our principal executive officer, principal financial officer, principal accounting officer or controller, or persons performing similar functions, and to third parties with whom we conduct business, including agents, representatives, joint venture partners, consultants and subcontractors. We have posted current copies of these codes on our website, www.parsons.com. In addition, we will post on our website all disclosures that are required by law or NYSE listing standards concerning any amendments to, or waivers from, any provision of the codes.
Board Meetings and Attendance
Directors are expected to attend each Board meeting, each meeting of the Committees on which they serve, and the Annual Meeting of Stockholders. During fiscal year 2023, the Board held seven meetings and acted by written consent. Each of our Directors who served as a Director during fiscal 2023 attended 90% or more of the aggregate total number of meetings of the Board (during the time in which they served) and the Board Committees on which he or she served that were held during the time he or she was a director in fiscal 2023.
Risk Oversight
Although management is responsible for the day-to-day management of the risks our company faces, our Board of Directors and its Committees take an active role in overseeing the management of our risks and bear the ultimate responsibility for risk management. The Board of Directors regularly reviews information regarding our operational, financial, legal, data security and strategic risks. Specifically, senior risk management personnel attend quarterly meetings of the Board, provide presentations on operations including significant risks, and are available to address any questions or concerns raised by our Board of Directors.
In addition, our Board of Directors’ Committees assist the Board of Directors in fulfilling its oversight responsibilities in certain areas of risk. The Audit and Risk Committee coordinates the Board of Directors’ oversight of our internal control over financial reporting, disclosure controls and procedures, risk, related party transactions, code of conduct, data and information security. The Compensation and Management Development Committee assists the Board of Directors in fulfilling its oversight responsibilities with respect to the management of risks arising from our compensation policies and programs as well as succession planning as it relates to our Chief Executive Officer and executive leadership. The Corporate Governance and Responsibility Committee assists the Board of Directors in fulfilling its oversight responsibilities with respect to the management of risks associated with Board organization, membership and structure, succession planning for our Directors, and corporate ESG matters. When any of the Committees receives a report related to material risk, the chair of the relevant Committee will report on the discussion to the full Board of Directors.
Information and Security Risk
Our Chief Security and Risk Officer is responsible for the development, delivery and maintenance of enterprise information, security and risk management programs which safeguard Parsons’ business information, assets, and its supporting infrastructure against unauthorized use, disclosure, modification, damage or loss. Our Security Operations Centers provide continuous monitoring of information systems to prevent, detect, and respond to cyber events and to engage with our Chief Legal Officer to discuss such responses and any appropriate disclosure requirements. We also provide training to our global workforce on cyber security awareness, including online training courses, interactive discussions on information security, and a key role on the corporation’s critical response management committee. Our security control protocols map directly to multiple security compliance frameworks, including ISO 27001, Sarbanes-Oxley, DFARS (NIST 800-171), and stringent privacy regulations, such as the General Data Protection Regulation (GDPR) and the California Consumer Privacy Act (CCPA). A full description of the Corporation’s procedures for managing and disclosing cyber-security risks and incidents can be found in Section 1C of the Corporation’s 10-K filed with the Securities and Exchange Commission on February 14, 2024.
Annual Board Performance Assessment
The Board and each of the Audit and Risk, Compensation, and Corporate Governance and Responsibility Committees perform annual assessments of their operations and effectiveness and set goals for the future.
During 2023, the Board and the Committees performed an internal self-assessment. The Corporate Governance and Responsibility Committee reviewed and evaluated the skills, industry and public company experience, independence, and diversity of the Board and provided feedback for the Board to achieve our business, governance and sustainability objectives. The Chair of the Corporate Governance and Responsibility Committee and the Lead Independent Director led a discussion of achievements during 2023 and goals and objectives with the Board.
The Skills Matrix reviewed and approved by the Corporate Governance and Responsibility Committee, and the full Board of Directors, is referenced below.
|
|
|
|
|
|
|
|
|
|
|
|
|

|

|

|

|

|

|

|

|

|

|

|
Knowledge, Skills and Experience1 |
End Market Background |
Defense |

|
|
|
|
|
|
|
|
|
|
|
Intelligence |
|
|
|
|
|
|
|
|
|
|
|
Infrastructure |
|
|
|
|
|
|
|
|
|
|
|
Technical Skills and Expertise |
Financial |
|
|
|
|
|
|
|
|
|
|
|
Capital Markets |
|
|
|
|
|
|
|
|
|
|
|
ESG |
|
|
|
|
|
|
|
|
|
|
|
Regulatory/Govt. Contracting |
|
|
|
|
|
|
|
|
|
|
|
HR/Compensation |
|
|
|
|
|
|
|
|
|
|
|
Operations/Risk Management |
|
|
|
|
|
|
|
|
|
|
|
Strategic Planning |
|
|
|
|
|
|
|
|
|
|
|
Technology/Innovation |
|
|
|
|
|
|
|
|
|
|
|
Mergers and Acquisitions |
|
|
|
|
|
|
|
|
|
|
|
IT and Cyber |
|
|
|
|
|
|
|
|
|
|
|
Corporate Governance/Ethics |
|
|
|
|
|
|
|
|
|
|
|
Demographics |
Race/Ethnicity |
African American |
|
|
|
|
|
|
|
|
|
|
|
Asian/Pacific Islander |
|
|
|
|
|
|
|
|
|
|
|
White/Caucasian |
|
|
|
|
|
|
|
|
|
|
|
Hispanic/Latino |
|
|
|
|
|
|
|
|
|
|
|
Native American |
|
|
|
|
|
|
|
|
|
|
|
Gender |
Male |
|
|
|
|
|
|
|
|
|
|
|
Female |
|
|
|
|
|
|
|
|
|
|
|
Board Tenure |
Years |
4 |
11 |
2 |
18 |
4 |
2 |
4 |
6 |
11 |
10 |
4 |
1 All Board members have public company and Executive Experience.
Board Independence
Nine of our current eleven Directors are independent under our Corporate Governance Guidelines and applicable New York Stock Exchange (“NYSE”) listing standards. The Board has determined that Messrs. Holdsworth, Leer, McDew, McMahon, Mitchell, and Wajsgras, and Mmes. Long, Lord and Vautrinot are independent under the independence criteria for directors established by the NYSE. As a result, we currently have a majority of independent Directors and satisfy the applicable rule of the NYSE.
Selection of Nominees for Election to the Board
Both the Corporate Governance and Responsibility Committee and the Board of Directors seek the talents and backgrounds that would be most helpful to Parsons in selecting nominees to the Board. In particular, the Corporate Governance and Responsibility Committee, when recommending director candidates to the full Board of Directors for nomination, may consider whether a director candidate, if elected, assists in achieving a mix of Board members that represents a diversity of background and experience. In addition, our corporate governance guidelines provide that a director shall retire from our Board at the next annual meeting of stockholders after he or she has reached the age of 75.
Our Commitment to Board Diversity
The Board is committed to diversity and focuses on diversity in seeking new candidates to be considered for the Board. We currently have four female Directors (Ms. Long, Ms. Lord, Ms. Smith and Ms. Vautrinot) on the Board and one African American male (Mr. McDew).
Process for Stockholders to Recommend Director Nominees
Stockholders wishing to nominate a candidate for director at an annual meeting must (a) provide Timely Notice (as defined in Section 2.04(ii) of the Company’s bylaws) to the Secretary of the Corporation, (b) provide the information, agreements and questionnaires with respect to such stockholder and its candidate for nomination as required to be set forth in the Company’s Amended and Restated Bylaws, and (c) provide any updates or supplements to such notice at the times and in the forms required by the Bylaws.
Director Orientation and Continuing Education
Each new member of the Board is provided with orientation materials and is required to attend meetings with the Executive Leadership team. In these meetings, discussion points included finance, legal, talent management and corporate strategy. In 2023, the Board received presentations from internal and external sources to consider.
Communications with the Board
Any stockholder or other interested party may contact the Board, including any non-employee Director or the non-employee Directors as a group, or the Chair by writing to our corporate Secretary at 14291 Park Meadow Drive, Suite 100, Chantilly, VA 20151. In general, any stockholder communication delivered to our Corporate Secretary for forwarding to the Board, the Chair or a specified group of Board members will be forwarded in accordance with the stockholder’s instructions. However, our Corporate Secretary reserves the right not to forward to Board members any abusive, threatening or otherwise inappropriate materials.
Board Committees
Our Board had three standing Committees in 2023: an Audit and Risk Committee, a Compensation and Management Development Committee, and a Corporate Governance and Responsibility Committee. The charter of each Committee is available without charge on the Investor Relations portion of our website, www.parsons.com.
The following chart identifies the current members and chair of each standing Committee, as well as related information.
|
|
|
|
|
Audit and Risk Committee |
Compensation &
Management
Development
Committee |
Corporate
Governance &
Responsibility
Committee |
George L. Ball |
|
|
|
Mark K. Holdsworth |
|

|

|
Steven F. Leer |

|

|
|
Letitia A. Long |

|
|

|
Ellen M. Lord |
|

|

|
Gen. Darren W. McDew, USAF (ret) |
|

|

|
Harry T.
McMahon |

|

|
|
M. Christian Mitchell |

|
|

|
Carey A. Smith |
|
|
|
Major General Suzanne M. “Zan” Vautrinot, USAF (ret) |

|
|

|
David C. Wajsgras |

|

|
|
|
|
|
|

|
Committee Chair |

|
Committee Member |
The following is a brief description of our Committees.
Audit and Risk Committee
Our Audit and Risk Committee oversees our corporate accounting and financial reporting process. Among other matters, the Audit and Risk Committee:
•appoints our independent registered public accounting firm;
•evaluates the independent registered public accounting firm’s qualifications, independence and performance;
•determines the engagement of the independent registered public accounting firm;
•reviews and approves the scope of the annual audit and the audit fee;
•discusses with management and the independent registered public accounting firm the results of the annual audit and the review of our quarterly financial statements;
•approves the retention of the independent registered public accounting firm to perform any proposed permissible non-audit services;
•monitors the rotation of partners of the independent registered public accounting firm on our engagement team in accordance with requirements established by the SEC;
•reviews our financial statements and our management’s discussion and analysis of financial condition and results of operations to be included in our annual and quarterly reports to be filed with the SEC;
•reviews our risk management procedures and risk factors affecting Parsons;
•reviews our critical accounting policies and estimates;
•reviews information and security operations and risk exposure; and
•at least annually, reviews the Audit and Risk Committee charter and reviews and evaluates the performance of the Audit and Risk Committee and its members, including compliance by the Audit and Risk Committee with its charter.
The current members of our Audit and Risk Committee are Mr. Mitchell (chairperson), Mr. Leer, Ms. Long, Mr. McMahon, Ms. Vautrinot and Mr. Wajsgras. All members of the Audit and Risk Committee are independent under our Corporate Governance Guidelines and applicable New York Stock Exchange (“NYSE”) listing standards.
All members of our Audit and Risk Committee meet the requirements for financial literacy under the applicable rules and regulations of the SEC and the NYSE. Our Board of Directors has determined that M. Christian Mitchell, Steven F. Leer, and David C. Wajsgras are Audit and Risk Committee financial experts as defined under the applicable rules of the SEC and have the requisite financial sophistication as defined under the applicable rules and regulations of the NYSE. Under the rules of the SEC, members of the Audit and Risk Committee must also meet heightened independence standards. However, a minority of the members of the Audit and Risk Committee may be exempt from the heightened Audit and Risk Committee independence standards for one year from the date of effectiveness of the registration statement of which this prospectus forms a part. Our Board of Directors has also determined that each of the members are independent under the heightened Audit and Risk Committee independence standards of the SEC and the NYSE. The Audit and Risk Committee operates under a written charter that satisfies the applicable standards of the SEC and the NYSE.
The Audit and Risk Committee met eight times during fiscal year 2023. The Audit and Risk Committee is briefed at least quarterly on information security operations mitigation measures to address risks related to Parsons’ global employees, information, and assets.
Compensation and Management Development Committee
Our Compensation and Management Development Committee reviews and recommends policies relating to compensation and benefits of our officers and employees. Among other matters, the Compensation and Management Development Committee:
•reviews and approves corporate goals and objectives relevant to compensation of our chief executive officer and other executive officers;
•evaluates the performance of these officers in light of those goals and objectives, and approves the compensation of these officers based on such evaluations;
•approves the issuance of stock options and other awards under our long-term incentive plans, other than awards to non-employee members of our Board of Directors; and
•at least annually, reviews the Compensation and Management Development Committee charter and reviews and evaluates the performance of the Compensation and Management Development Committee and its members, including compliance by the Compensation and Management Development Committee with its charter.
The current members of our Compensation and Management Development Committee are Mr. Leer (chairperson), Mr. Holdsworth, Ms. Lord, Mr. McDew, Mr. McMahon, and Mr. Wajsgras. All members of the Compensation and Management Development Committee are independent under our Corporate Governance Guidelines and applicable New York Stock Exchange (“NYSE”) listing standards.
Our Board of Directors has determined that each of the members of our Compensation and Management Development Committee is independent under the applicable rules and regulations of the NYSE and is a “non-employee director” as defined in Rule 16b-3 promulgated under the Exchange Act. The Compensation and Management Development Committee operates under a written charter that satisfies the applicable standards of the SEC and the NYSE.
The Compensation and Management Development Committee met five times during fiscal year 2023 and also acted by written consent.
Corporate Governance and Responsibility Committee
The Corporate Governance and Responsibility Committee is responsible for making recommendations to our Board of Directors regarding candidates for directorships and the size and composition of our Board of Directors. All members of the Corporate Governance and Responsibility Committee are independent under our Corporate Governance Guidelines and applicable New York Stock Exchange (“NYSE”) listing standards.
The Corporate Governance and Responsibility Committee is responsible for overseeing our corporate governance policies and reporting, making recommendations to our Board of Directors concerning environmental, social and governance (ESG) matters. The Corporate Governance and Responsibility Committee will also, at least annually, review its Committee charter and review and evaluate the performance of the Corporate Governance and Responsibility Committee and its members, including compliance by the Committee with its charter.
The current members of our Corporate Governance and Responsibility Committee are Ms. Vautrinot (chairperson), Mr. Holdsworth, Ms. Long, Ms. Lord, Mr. McDew, and Mr. Mitchell. Our Board of Directors has determined that each of the members of our Corporate Governance and Responsibility Committee is an independent director under the applicable rules and regulations of the NYSE relating to Corporate Governance and Responsibility Committee independence. The Corporate Governance and Responsibility Committee operates under a written charter that satisfies the applicable standards of the SEC and the NYSE.
The Corporate Governance and Responsibility Committee met four times during fiscal year 2023.
Director Ownership Guidelines
On January 1, 2020, our Board adopted stock ownership guidelines which provide for equity ownership guidelines for all our non-employee Directors to further align their interests to those of our stockholders. Under the policy, each of our non-employee Directors has five years from the later of (i) January 1, 2020 or (ii) the date of commencement of his/her service on the Board to achieve equity ownership with a value equivalent to five times his/her annual cash retainer. In calculating a director’s ownership, common stock held by the non-employee director or an immediate family member, common stock owned indirectly if the individual has an economic interest in the shares or is a beneficial owner under Rule 13d-3 of the Exchange Act, unvested Restricted Stock Units (RSUs) issued under the Parsons’ Incentive Plan and units held in deferral accounts by the Directors under the Share Value Retirement Plan (“SVRP”) will be considered owned by the non-employee director. Value of ownership will be measured by reference to the trailing 60 trading day weighted average of the Parsons common stock, up to and including last day of the calendar year; compliance will be evaluated annually. In the event of a significant decline in stock price, causing non-employee Directors holdings to fall below guideline levels, non-employee Directors will not be required to purchase additional stock. Determination of the impact of share price fluctuation is subject to Compensation and Management Development Committee discretion. In 2021, the Corporate Governance and Responsibility Committee adopted a resolution requiring the implementation of a Rule 10b5-1 trading plan for any director and member of the executive leadership team (reporting to the CEO) prior to being able to sell any shares of Parsons’ stock.
For a description of the guidelines applicable to executive officers, see our CD&A section of this Proxy.
Anti-Hedging and Anti-Pledging Policies
Under our Insider Trading Compliance Policy, we prohibit our employees, including our executive officers, and Board members, from hedging the risk associated with ownership of shares of our common stock and other securities, as well as from pledging any of our securities as collateral for a loan.
COMPENSATION AND MANAGEMENT DEVELOPMENT COMMITTEE INTERLOCKS AND INSIDER PARTICIPATION
The current members of our Compensation and Management Development Committee are Messrs. Leer, Holdsworth, McDew, McMahon, and Wajsgras and Ms. Lord. No member of our Compensation and Management Development Committee who served on such committee during 2023 served as a member of the Board or Compensation and Management Development Committee of any other entity that has one or more executive officers serving as a member of our Board or Compensation and Management Development Committee.
SECURITY OWNERSHIP INFORMATION
Security Ownership of Directors and Executive Officers
The following table indicates information as of February 20, 2024 regarding the beneficial ownership of our common stock by each of our Directors, each of the named executive officers, and all of our Directors and executive officers as a group.
The percentages shown are based on 105,829,579 shares of common stock outstanding as of February 20, 2024.
The amounts and percentages owned are reported on the basis of the SEC’s rules governing the determination of beneficial ownership of securities. The SEC’s rules generally attribute beneficial ownership of securities to each person who possesses, either solely or shared with others, the voting power or investment power, which includes the power to dispose of those securities. The rules also treat as outstanding all shares of capital stock that a person would receive upon exercise of stock options or warrants held by that person that are immediately exercisable or exercisable within 60 days. These shares are deemed to be outstanding and to be beneficially owned by the person holding those options for the purpose of computing the number of shares beneficially owned and the percentage ownership of that person, but they are not treated as outstanding for the purpose of computing the percentage ownership of any other person. Under these rules, one or more persons may be a deemed beneficial owner of the same securities and a person may be deemed a beneficial owner of securities to which such person has no economic interest. Unless otherwise indicated, the persons or entities identified in this table have sole voting and investment power with respect to all shares shown as beneficially owned by them, subject to applicable community property laws as of February 20, 2024.
|
|
|
|
|
|
|
|
|
|
|
|
|
|
|
|
Shares Beneficially
Owned |
|
|
% of
Outstanding
Shares
Beneficially
Owned |
|
|
Shares |
|
|
% |
|
|
% |
Named Executive Officers and Directors: |
|
|
|
|
|
|
|
|
|
|
Carey A. Smith(1)(2) |
|
|
307,501 |
|
|
* |
|
|
* |
|
|
Matthew Ofilos(1) |
|
|
36,446 |
|
|
* |
|
|
* |
|
|
Michael R. Kolloway(1)(2) |
|
|
76,181 |
|
|
* |
|
|
* |
|
|
Susan M. Balaguer(1)(2) |
|
|
28,958 |
|
|
* |
|
|
* |
|
|
George L. Ball(1)(2)(3) |
|
|
332,490 |
|
|
|
— |
|
|
|
— |
|
|
Mark K. Holdsworth |
|
|
22,110 |
|
|
|
— |
|
|
|
— |
|
|
Steven F. Leer |
|
|
22,110 |
|
|
|
— |
|
|
|
— |
|
|
Letitia A. Long |
|
|
17,367 |
|
|
|
— |
|
|
|
— |
|
|
Ellen M. Lord |
|
|
6,789 |
|
|
|
— |
|
|
|
— |
|
|
Darren W. McDew, General USAF (ret) |
|
|
17,367 |
|
|
|
— |
|
|
|
— |
|
|
Harry T. McMahon |
|
|
27,110 |
|
|
|
— |
|
|
|
— |
|
|
M. Christian Mitchell |
|
|
22,110 |
|
|
|
— |
|
|
|
— |
|
|
Major General Suzanne M. “Zan” Vautrinot, USAF (ret) |
|
|
22,110 |
|
|
|
— |
|
|
|
— |
|
|
David C. Wajsgras |
|
|
28,528 |
|
|
|
— |
|
|
|
— |
|
|
All executive officers and directors as a group (16 persons)(4) |
|
|
967,176 |
|
|
* |
|
|
* |
|
|
5% Stockholders: |
|
|
|
|
|
|
|
|
|
|
Parsons Corporation Employee Stock Ownership Plan |
|
|
59,222,217 |
|
|
|
56.0 |
% |
|
|
56.0 |
% |
|
* less than 1%.
(1)Includes 4,724, 949, 5,793, and 949 shares of common stock beneficially owned by Ms. Smith, Mr. Ofilos, Mr. Kolloway, and Ms. Balaguer, respectively, through the ESOP, rounded to the nearest whole share. Each of Ms. Smith, Mr. Ofilos, Mr. Kolloway, and Ms. Balaguer shares voting and investment power with the ESOP with respect to such shares beneficially owned by him or her through the ESOP.
(2)Includes 82,934, 17,139, 8,306, and 15,741 PSUs (as defined below) held by Ms. Smith, Mr. Kolloway, Ms. Balaguer and Mr. Ball, respectively, which are scheduled to vest within 60 days of February 20, 2024.
(3)Includes 205,000 shares owned by Mr. Ball and held by the George L. and Coleen M. Ball, Trustees of the George L. and Coleen M. Ball Family Trust UA 01-18-2005 (the “Trust”) (Mr. Ball has shared voting, investment and dispositive power over the shares held by the Trust).
(4)Includes 12,414 shares of common stock beneficially owned by our executive officers and Directors through the ESOP, rounded to the nearest whole share.
DELINQUENT SECTION 16(A) REPORTS
Section 16(a) of the Exchange Act requires our directors, officers (as defined in Rule 16a-1 promulgated under the Exchange Act) and stockholders who beneficially own more than 10% of any class of our equity securities registered pursuant to Section 12 of the Exchange Act (collectively, the “Reporting Persons”) to file initial statements of beneficial ownership of securities and statements of changes in beneficial ownership of securities with respect to our equity securities with the SEC. Based solely on our review of the copies of such forms received by us and upon written representations of the Reporting Persons received by us, we believe that there has been compliance with all Section 16(a) filing requirements applicable to such Reporting Persons with respect to the fiscal years ended December 31, 2019, 2020, 2021, 2022 and 2023, and for the first wo months of 2024, except for Form 4 reflecting transactions for each of the following Section 16 officers to reflect shares of Restricted Stock Units withheld upon subsequent vesting. All of such RSUs were previously reported in full at the time such RSUs were granted, and, in all cases, the subsequent withholding was for the purpose of the payment of taxes upon the vesting of RSU shares: Carey A. Smtih (fourteen withholding events ); George L. Ball (nine withholding events); Matthew M. Ofilos (four withholding events); Michael R. Kolloway (eleven withholding events); and Susan M. Balaguer (four withholding events).
CERTAIN RELATIONSHIPS AND RELATED PARTY TRANSACTIONS
ESOP
Contributions of treasury stock to the ESOP are made annually in amounts determined by our Board of Directors and are held in trust for the sole benefit of the ESOP participants. Contributions of 915,113 shares, 1,188,129 shares and 1,631,477 shares of our common stock were made to the ESOP in fiscal 2023, 2022 and 2021, respectively.
We engaged the ESOP Trustee to serve as independent fiduciary on behalf of the ESOP and its participants and beneficiaries. We paid the ESOP Trustee a fee of $454,675 in 2023 for those services and reimbursed the ESOP Trustee for their legal counsel, financial advisor, and other out of pocket fees and expenses incurred in connection with our initial public offering.
Unconsolidated Joint Ventures
We often provide services to our unconsolidated joint ventures and our revenues include amounts related to recovering overhead costs for these services. Our revenues included $213.8 million in fiscal year 2023, $217.4 million in fiscal year 2022, and $204.7 million in fiscal year 2021 related to services we provided to our unconsolidated joint ventures. For the years ended December 31, 2023, December 31, 2022, and December 31, 2021, we incurred approximately $153.7 million, $157.6 million, and $155.5 million, respectively, of reimbursable costs.
Registration Rights
We entered into a registration rights agreement with the ESOP Trustee, providing the ESOP with certain demand registration rights related to shares held by the ESOP in the event the ESOP Trustee determines in good faith, in exercising its fiduciary duties under ERISA, that the ESOP is required to sell its shares, which we believe is only likely to occur if our business, financial condition or results of operations have materially and adversely deteriorated.
ESOP Trustee Letter Agreement
We entered into a letter agreement with the ESOP Trustee in connection with our initial public offering, in which we agree that our management will meet with the ESOP Trustee on a quarterly basis to discuss our business and the administration and operation of the ESOP and that our Board of Directors will meet with the ESOP Trustee on an annual basis to discuss our business and the administration and operation of the ESOP. The amount of contribution in fiscal year 2023, as determined by the Parsons Corporation Board of Directors was not less than 8% of the ESOP participants’ cash compensation for the applicable year.
Indemnification Agreements and Directors’ and Officers’ Liability Insurance
We have entered into indemnification agreements with each of our Directors and executive officers. These agreements, among other things, require us to indemnify each director and executive officer to the fullest extent permitted by Delaware law, including indemnification of expenses such as attorneys’ fees, judgments, penalties fines and settlement amounts incurred by the director or executive officer in any action or proceeding, including any action or proceeding by or in right of us, arising out of the person’s services as a director or executive officer. We also maintain Directors’ and officers’ liability insurance.
Policies and Procedures for Related Person Transactions
Our written related person transaction policy sets forth the policies and procedures for the review and approval or ratification of related person transactions. This policy covers, with certain exceptions set forth in Item 404 of Regulation S-K under the Securities Act, any transaction, arrangement or relationship, or any series of similar transactions, arrangements or relationships in which we were or are to be a participant, where the amount involved exceeds $120,000 and a related person had or will have a direct or indirect material interest, including, without limitation, purchases of goods or services by or from the related person or entities in which the related person has a material interest, indebtedness, guarantees of indebtedness and employment by us of a related person. In reviewing and approving any such transactions, our Audit and Risk Committee is tasked to consider all relevant facts and circumstances, including, but not limited to, whether the transaction is on terms comparable to those that could be obtained in an arm’s length transaction with an unrelated third party and the extent of the related person’s interest in the transaction. All of the transactions described in this section occurred prior to the adoption of this policy.
COMPENSATION DISCUSSION AND ANALYSIS
This Compensation Discussion and Analysis (“CD&A”), together with the compensation tables and related disclosures, discusses the principles underlying our executive compensation policies and decisions and the most important factors relevant to an analysis of these policies and decisions. In addition, we explain how and why our Board and the Compensation and Management Development Committee of our Board arrived at specific compensation policies and decisions involving our named executive offices (NEOs) during fiscal 2023.
Our NEOs for 2023 were:
•Carey A. Smith, Chair, President and Chief Executive Officer
•Matthew Ofilos, Chief Financial Officer
•Michael R. Kolloway, Chief Legal Officer and Secretary
•Susan M. Balaguer, Chief Human Resources Officer
Executive Summary
Company Performance and Highlights
|
|
|
How We Performed in Fiscal 2023 |
•Achieved record revenue of $5.4 billion. •Achieved net income of $161.1 million. •Achieved record adjusted EBITDA in 2023 of $464.7 million driven by strong performance in both of our business segments. Adjusted EBITDA margin was 8.5%. •Successful capital deployment in M&A continues with acquisitions of Sealing Technologies, IPKeys, and I.S. Engineers to enhance Parsons' capabilities in defensive cyber operations; integrated mission-solutions powered by artificial intelligence and machine learning; edge computing; edge access modernization; critical infrastructure protection and secure data management that protects national security; and transportation engineering. •Healthy balance sheet will continue to enable Parsons to invest in organic and M&A growth opportunities. •Trailing-twelve-month enterprise book-to-bill ratio was 1.1 and providing total backlog of $8.6 billion, representing two years of annual revenue. •Won 15 large contracts each in excess of $100 million in growing and enduring markets, including one of the largest contracts awarded in Parsons’ history. •Enhanced our executive leadership team with proven industry and growth leaders through hiring and promotions. •Achieved notable recognition as an employer of choice from military/veterans, diversity, and other groups and achieved several notable highlights as shown in the environmental, social, governance (ESG) and corporate citizen highlights throughout the document. |
|
|
Key 2023 Executive Compensation Decisions
|
|
|
2023 Compensation Design Principles |
•Pay Aligned with Performance. We designed a majority of our CEO’s and NEOs’ pay packages to be “at-risk” and aligned with stockholder interests. This “at-risk” pay will only reward executives for positive financial, strategic, and/or stock performance, which aligns the interests of our NEOs with those of stockholders. •Market Data Considered in Designing Competitive Compensation Program. Our Compensation and Management Development Committee reviewed Parsons’ long-term business and talent strategy alongside market compensation levels and program designs to develop a holistic frame of reference when designing the 2023 executive compensation program and when establishing individual pay decisions. •Consideration of Relevant Factors and Independent Compensation Consultant Input. Our Compensation and Management Development Committee considered various relevant qualitative factors, in addition to the advice of the Compensation and Management Development Committee’s independent compensation consultant, in designing and setting 2023 executive compensation. |
|
|
|
|
|
2023 Compensation Highlights |
•Annual Incentives Paid at 183% of Target for CEO and Other NEOs for Fiscal Year 2023. Annual incentive awards for our CEO and other NEOs are based on corporate financial goals and a strategic qualitative goal aligned with diversity. In February 2024, following the conclusion of the record-setting 2023 fiscal year, the Compensation and Management Development Committee determined that the achieved payout for our CEO and other NEOs, relative to the corporate financial goals and strategic goal for 2023 was 183% of target. •Long-Term Incentives Weighted Towards Performance-Based Awards. For 2023, long-term incentives were granted using a mix of time-based restricted stock units (“RSUs”) constituting 40% of total target value with a three-year ratable vesting schedule and performance stock units (“PSUs”) constituting 60% of total target value with a three-year cliff vest based 50% on cumulative adjusted EBITDA and 50% on cumulative revenue, with the final award payout dependent on achievement of the performance criteria during the three-year performance cycle. The PSUs also incorporate a relative total shareholder return (“rTSR”) performance modifier. The rTSR modifier, may adjust the weighted average for financial performance between 75% and 125% based on Parsons’ percentile ranking for total shareholder return within a custom peer benchmark group over the three-year performance cycle. •Vesting of 2021-2023 Long-Term Incentive Performance Awards at 136%. For the 2021-2023 performance cycle, in February 2024, the Compensation and Management Development Committee determined performance relative to the financial performance goals for these awards for the three-year performance cycle ending December 31, 2023. Company achievement across the two financial metrics, cumulative Contract Awards and cumulative adjusted EBITDA, resulted in a weighted average performance achievement of 116% of the target awards. The weighted average performance achievement was then modified by the rTSR multiplier achievement of 116.67%, for a total achievement of 136%. The 2021-2023 PSU awards will be paid in shares to the NEOs in March 2024. •Dodd-Frank Compliant Compensation Clawback Policy Adoption. In October 2023, the Committee adopted the Parsons Dodd-Frank Compliant Compensation Clawback Policy which provides for the recovery of certain incentive compensation in the event of an Accounting Restatement. This Policy is designed to comply with, and shall be interpreted to be consistent with, Section 10D of the Securities Exchange Act of 1934, as amended, Rule 10D-1 promulgated under the Exchange Act and Section 303A.14 of the New York Stock Exchange Listed Company Manual. |
|
|
|
|
|
Key Changes We Are Making to the Executive Compensation Program for 2024 |
•Focus on Diversity in Leadership in our CEO and Other NEOs Annual Bonus. For 2024, our NEOs’ annual bonus strategic goal will continue to represent our focus on diversity measured on gender diversity and racial/ethnic diversity in leadership. In prior years, this strategic goal has measured representation for the director and above employee population. For 2024, we expand such measurement to include all managers and above. These strategic diversity goals will continue to be weighted at 10% of the overall target opportunity. The mix of corporate financial goals will continue to be weighted at 90% of overall target opportunity. |
|
|
Say-on-Pay
In evaluating the Company's executive compensation program, the Compensation and Management Development Committee considers the results of the stockholder advisory vote on the "say-on-pay" proposal. At the Company's 2023 Annual Meeting, over 97% of the shares voted approved the proposal. The Compensation and Management Development Committee believes these results show significant support for our executive compensation philosophy and program. Taking into account the positive support received in 2023, the Compensation and Management Development Committee believes the Company provides a competitive, stockholder-friendly pay program that effectively retains and motivates our executives and determined to generally retain our existing approach to executive compensation for 2024.
Fiscal Year 2023 Total Target Compensation Pay
Key Executive Compensation Practices
Our executive compensation program includes the following executive compensation governance policies and practices:
|
|
|
|
|
Our Compensation Best Practices |
What We Do: |
|
What We Do Not Do: |
 Appropriate Pay Mix and Maximum Payouts. We provide an appropriate balance of short-term and long-term compensation, with payouts based on the Company’s achievement of certain financial metrics and Company strategic performance objectives, with maximum payout caps for annual cash incentives and long-term performance awards. Appropriate Pay Mix and Maximum Payouts. We provide an appropriate balance of short-term and long-term compensation, with payouts based on the Company’s achievement of certain financial metrics and Company strategic performance objectives, with maximum payout caps for annual cash incentives and long-term performance awards.
|
|
 No Hedging by Executives or Directors. Our Insider Trading Compliance Policy prohibits all employees, including our NEOs, and non-employee Directors, from hedging their Parsons common stock. No Hedging by Executives or Directors. Our Insider Trading Compliance Policy prohibits all employees, including our NEOs, and non-employee Directors, from hedging their Parsons common stock.
|
|
|
|
|
|
 Stock Ownership Guidelines. We maintain stock ownership guidelines applicable to both executive officers and non-employee Directors. Stock Ownership Guidelines. We maintain stock ownership guidelines applicable to both executive officers and non-employee Directors.
|
|
 No Pledging by Executives or Directors. Our Insider Trading Compliance Policy prohibits our employees, including our NEOs, and non-employee Directors from pledging Parsons common stock as collateral for a loan. No Pledging by Executives or Directors. Our Insider Trading Compliance Policy prohibits our employees, including our NEOs, and non-employee Directors from pledging Parsons common stock as collateral for a loan.
|
|
|
|
|
|
 Clawback Policy. We maintain an executive clawback policy and a Dodd-Frank Compliant Compensation Clawback policy that applies to our NEOs and provides for recovery of both cash and equity incentive compensation under specified circumstances. Clawback Policy. We maintain an executive clawback policy and a Dodd-Frank Compliant Compensation Clawback policy that applies to our NEOs and provides for recovery of both cash and equity incentive compensation under specified circumstances.
|
|
 No Employment Contracts. We do not have employment contracts with our NEOs. No Employment Contracts. We do not have employment contracts with our NEOs.
|
|
|
|
|
|
 Fully Independent Compensation and Management Development Committee. Our executive compensation program is administered by the Compensation and Management Development Committee, which consists solely of independent Directors. Fully Independent Compensation and Management Development Committee. Our executive compensation program is administered by the Compensation and Management Development Committee, which consists solely of independent Directors.
|
|
 No Repricing of Underwater Stock Options. Our equity plan adopted in connection with our initial public offering (“IPO”) prohibits the repricing of underwater stock options without stockholder consent. No Repricing of Underwater Stock Options. Our equity plan adopted in connection with our initial public offering (“IPO”) prohibits the repricing of underwater stock options without stockholder consent.
|
|
|
|
|
|
 Independent Compensation Consultant Reporting Directly to Compensation and Management Development Committee. The Compensation and Management Development Committee utilizes input from an independent compensation consultant. Independent Compensation Consultant Reporting Directly to Compensation and Management Development Committee. The Compensation and Management Development Committee utilizes input from an independent compensation consultant.
|
|
 No Tax-Gross Ups for Parachute Payments. We do not provide for tax-gross ups on golden parachute payments to our NEOs in connection with a change in control. No Tax-Gross Ups for Parachute Payments. We do not provide for tax-gross ups on golden parachute payments to our NEOs in connection with a change in control.
|
|
|
|
|
|
 Double trigger change of control accelerated vesting of equity. Double trigger change of control accelerated vesting of equity.
|
|
 No “single-trigger” accelerated vesting of equity awards in event of change of control. No “single-trigger” accelerated vesting of equity awards in event of change of control.
|
|
|
Compensation Philosophy
We believe in providing a competitive total compensation package to our NEOs through a combination of base salary, performance-based annual incentive awards, long-term incentive awards and broad-based welfare and health benefit plans. Our executive compensation program is designed to achieve the following objectives:
•attract, motivate and retain executive officers of outstanding ability and potential, whose knowledge, skills and performance are critical to our success;
•reward the achievement of short-term and long-term strategic goals; and
•ensure that executive compensation is meaningfully related to the creation of stockholder value.
Executive Compensation Setting Process
Role of the Compensation and Management Development Committee
Our Board has delegated to the Compensation and Management Development Committee the responsibility for overseeing, reviewing, and approving our compensation arrangements and benefit plans and policies, and certain responsibilities relating to talent management programs and policies. Our Compensation and Management Development Committee annually determines and approves ongoing compensation arrangements for our executive officers and recommends to the Board the compensation for non-employee Directors.
Role of Executive Officers
Our CEO, as a member of our Board, attends Board and portions of Compensation and Management Development Committee meetings and provides input to the Committee in determining our executive compensation philosophy, design, incentive target amounts, and incentive payouts (other than for herself). Our finance department works with our CHRO and CEO to gather financial and operational data that the CEO reviews in making her recommendations. From time to time our CFO and CLO attend meetings (or portions thereof) of the Board or the Compensation and Management Development Committee to present information and answer questions pertaining to our executive compensation structure. No executive officer, including our CEO, participates directly in the final deliberations and determinations regarding his or her own compensation. While the Compensation and Management Development Committee considers management’s recommendations in its deliberations, it exercises its own independent judgment in approving the final compensation of our NEOs.
Role of Compensation Consultant
Semler Brossy was retained by the Compensation and Management Development Committee to assist in developing our NEO compensation program for 2023. Semler Brossy provided analysis and perspectives on our compensation strategy and assisted the Compensation and Management Development Committee in modifying our compensation program for our NEOs to better achieve our objectives. As part of it's duties, Semler Brossy has performed the following projects for the Compensation and Management Development Committee in 2023:
•provided compensation data for similarly situated NEOs at our peer group companies;
•updated the Compensation and Management Development Committee on emerging trends and best practices in the area of executive compensation;
•assisted in the development of a 2024 compensation peer group composed of public companies in similar industries with revenues comparable to us; and
•assisted in the design of the December 2023 one-time equity award package to Ms. Smith.
Other than advising the Compensation and Management Development Committee as described above, Semler Brossy did not provide any services to Parsons in 2023. The Compensation and Management Development Committee has evaluated the independence of Semler Brossy pursuant to the requirements of the NYSE and the factors set forth in the SEC rules and determined that Semler Brossy are independent, and no conflict of interest has arisen as a result of the work performed by Semler Brossy during fiscal year 2023.
Assessing Compensation Competitiveness
The Compensation and Management Development Committee uses a combination of published and proprietary compensation survey data as reference sources in determining CEO and NEO compensation.
In connection with its engagement with Semler Brossy in 2022, the Compensation and Management Development Committee directed Semler Brossy to develop a compensation peer group to assist in developing a compensation program for all our NEOs for 2023. Semler Brossy screened potential comparator companies from the engineering and construction, aerospace and defense, environmental and facilities services and research and consulting services industries that Semler Brossy and the Compensation and Management Development Committee determined compete with us for talent. We also considered the revenue and market capitalization of these companies and determined that a compensation peer group consisting of companies with levels both above and below our own levels was appropriate. Our Compensation and Management Development Committee believed that including companies with higher revenue than ours was appropriate due to our historical and recent strong growth.
In July 2022, our Compensation and Management Development Committee reviewed and determined to remove Cubic Corporation from the 2023 peer group as a result of it's acquisition. No other changes were made at the time and the following companies were used as a reference source in its 2023 executive compensation deliberations:
|
|
Peer Group for Fiscal Year 2023 Executive Compensation Setting Purposes |
AECOM |
Maxar Technologies, Inc |
Booz Allen Hamilton Holding Corporation |
Mercury Systems |
CACI International Inc |
Science Applications International Corporation |
Jacobs Solutions Inc |
Stantec, Inc |
KBR, Inc |
Teledyne Technologies, Inc |
Kratos Defense & Security Solutions, Inc |
Tetra Tech, Inc |
Leidos Holdings, Inc |
WSP Global, Inc |
ManTech International Corporation |
|
Our Compensation and Management Development Committee also used published and proprietary compensation survey data provided by Aon Radford, Pearl Meyer, and Willis Towers Watson to analyze the compensation practices of other companies within and outside our industry as a reference source, in addition to other relevant factors, in determining our executives’ compensation. Our Compensation and Management Development Committee applies its independent judgment to make compensation decisions and does not formally benchmark our executive compensation against any particular group of companies or use a formula to set our NEOs compensation in relation to this data. Survey data for a revenue range comparable to our Company is utilized, rather than data for specific companies participating in the surveys. Our objective was to obtain data from a broad spectrum of comparable companies for compensation comparison purposes.
Following a review of the peer group by Semler Brossy in July 2023, the Compensation and Management Development Committee determined to remove ManTech International Corporation and Maxar Technologies, Inc as a result of their acquisitions, for 2024 executive compensation deliberations.
Use of Comparative Market Data and Qualitative Factors
Our Compensation and Management Development Committee reviews each component of executive compensation separately and also takes into consideration the value of each NEOs’ compensation package as a whole and its relative size in comparison to our other executive officers, with the goal to set all elements of compensation within a competitive range, using a balanced approach that does not use rigid percentiles to target pay levels, but instead makes its compensation decisions based on a variety of relevant factors.
While the Compensation and Management Development Committee believes that information regarding the compensation practices at other companies is useful in assessing the competitiveness, reasonableness and appropriateness of individual executive compensation elements and of our overall executive compensation packages, this information is only one of several factors that our Compensation and Management Development Committee considers. Other factors that are considered include:
•Recruitment and retention: The Compensation and Management Development Committee reviews existing NEO compensation and retention levels relative to the competitive labor market pressures and likely estimated replacement cost with respect to the scope, responsibilities and skills required of the particular position.
•Lack of directly comparable data for some of our key roles: Compensation data for some of our NEO roles may not be explicitly reported by companies in our compensation peer group or survey data, or there may not be direct matches for certain roles within our organization. This results in limited sample sizes and/or inconclusive data that can be misleading if targeting a specific percentile for market positioning.
•Market positioning may be distorted by the source of the data: Certain elements of compensation reported from one source can be consistently higher or lower than the data collected from another, given differences in methods and samples used by each source to collect market data. Given this variability and volatility within the market data, the Compensation and Management Development Committee has determined that targeting pay levels at specific percentiles of this data could result in outcomes that do not align with the internal value and strategic importance of various roles at Parsons.
•Relevant Qualitative Factors: A range of subjective and qualitative factors is considered, including:
•The role the NEO plays and the importance of such individual’s contributions to our ability to execute on our business strategy and to achieve our strategic objectives;
•Each executive officer’s tenure, skills and experience;
•The responsibilities and particular nature of the functions performed or managed by the NEO;
•Our CEO’s recommendations and her assessment of each executive officer’s performance (other than her own performance), and with respect to the CEO’s performance, assessment by the Board; and
•Internal pay equity across the executive management team.
We evaluate our pay philosophy and compensation programs as circumstances require. At a minimum, we review executive compensation annually. As part of this review process, we expect to apply our values and the objectives outlined above, while considering the compensation levels needed to ensure our executive compensation program remains competitive. We also review whether we are meeting our pay for performance, key employee retention and other executive compensation program objectives.
Fiscal Year 2023 Compensation Elements in Detail
Elements at a Glance
The compensation program for our NEOs consists of the following principal components:
|
|
|
|
|
|
Element |
|
Objective |
|
Summary of Key Features |
|
Base Salary |
|
Provides competitive fixed compensation levels to attract and retain highly qualified talent |
|
•Base salary increases are tied to market pay references, individual performance in the role, internal pay equity and growth of the Company •No specific formulas applied |
|
Short-Term Annual Incentive: Performance- Based Annual Cash Bonus |
|
Encourages focus on achievement of the Company’s annual financial plan and non-financial strategic qualitative objectives aligned with our focus on improving diversity |
|
•The annual incentive plan awards are at-risk, with earned values depending on the level of performance against financial performance goals and key strategic qualitative goals set at the beginning of the fiscal year •The 2023 annual incentives were determined based on the following financial performance metrics: revenue (25%), adjusted EBITDA (25%), awards (20%), cash flow (20%), and strategic qualitative goal aligned with diversity (10%) •Range of NEO annual incentive targets as a percent of base salary is 75% to 125% •Payment may range from 0% to 200% of target based on actual performance |
|
Long-Term Incentive: Performance- Based PSUs |
|
Rewards achievement of performance related to the Company’s long-term objectives and stockholder value creation |
|
•60% of total long-term incentive target value awarded as PSUs •Performance criteria are 50% based on cumulative adjusted EBITDA and 50% based on cumulative revenue, with the final payout subject to a modifier based on our rTSR performance within a custom peer benchmark •Payouts may range from 0% to 200% of target based on actual cumulative contract award and cumulative gross profit margin as sold performance achieved over the three-year performance cycle, with a maximum modified payout of 250% based on actual rTSR performance relative to a custom industry peer benchmark for the three-year performance cycle |
|
|
|
|
|
|
|
Element |
|
Objective |
|
Summary of Key Features |
|
|
|
|
|
•Three-year cliff vesting at end of performance cycle •The final award payout depends on achievement of the performance criteria and the rTSR modifier at the end of the three years |
|
Long-Term Incentive: Time-Based RSUs |
|
Rewards future performance and supports retention and succession planning |
|
•40% of total long-term incentive target value awarded takes the form of time-based RSUs •Provides the opportunity to earn a specified number of shares of Parsons common stock subject to the NEO’s continued employment for a specified period •Value of shares ultimately delivered to NEO tied to share price appreciation between grant and delivery date •Three-year ratable vesting period |
|
Base Salaries
The Compensation and Management Development Committee generally reviews, and adjusts as necessary, base salaries for each of our NEOs annually, or at the time of a promotion or substantial change in responsibilities. In general, base salary increases for seasoned incumbents are generally consistent with the merit pool funded for our broader organization. Annual increases that are higher or lower than this range may reflect the individual's competitive positioning to market, increases or decreases in responsibility or role, and/or other considerations deemed appropriate by the Compensation and Management Development Committee. In fiscal 2023, base salaries for the NEOs were increased as shown below to maintain competitiveness of our compensation program. In the case of Ms. Smith, the larger percentage of increase for fiscal 2023 reflects the Compensation and Management Development Committee's desire to bring Ms. Smith's compensation more in line with the competitive market following her promotion to CEO in 2021 and based on Ms. Smith's strong performance in the role.
|
|
|
|
|
|
|
|
|
|
|
|
|
|
|
|
Named Executive Officer |
2022 Salary
($) |
2023 Salary
($) |
Percentage
Increase |
Carey A. Smith |
|
|
900,000 |
|
|
|
|
1,000,000 |
|
|
|
|
11.1 |
% |
|
Matthew Ofilos |
|
|
525,000 |
|
|
|
|
543,375 |
|
|
|
|
3.5 |
% |
|
Michael R. Kolloway |
|
|
510,000 |
|
|
|
|
517,650 |
|
|
|
|
1.5 |
% |
|
Susan M. Balaguer |
|
|
427,500 |
|
|
|
|
448,875 |
|
|
|
|
5.0 |
% |
|
Annual Cash Incentives
We provide our NEOs with the opportunity to earn annual cash bonuses to encourage the achievement of corporate objectives and to reward those individuals who significantly impact our corporate results. The Compensation and Management Development Committee determines and approves our annual bonus decisions.
Under the fiscal 2023 Annual Incentive Plan for Management, or AIP, the annual incentive bonus of each NEO was entirely based on our performance against a mix of corporate financial goals (90% of overall target bonus opportunity) and a non-financial strategic goal (10% of overall target bonus opportunity) aligned with enhanced gender and racial/ethnic diversity.
The annual incentive bonus is equal to the product of (1) a dollar amount representing the target amount that the executive officer may be paid as an annual incentive bonus payment (or the “Target Incentive Bonus”), multiplied by (2) a percentage representing the overall achievement of the target levels and their weightings for each of the performance measures for the fiscal year (or the “Performance Goal Achievement”). The Target Incentive Bonus, the performance measures and related target levels and weighting, and the method for determining the Performance Goal Achievement for each executive officer were determined by our Compensation and Management Development Committee, as applicable, after taking into consideration the recommendations of our CEO (for NEOs other than the CEO) at the time the performance measures and related target levels and weightings were determined for the executive officer. No payout would be made for goals that failed to meet the performance threshold. The performance threshold for financial goals was 80% of target, as described below. Payouts were capped at 200% of target.
For purposes of the fiscal 2023 AIP, our Compensation and Management Development Committee selected revenue, adjusted EBITDA, awards, consolidated cash flow and a strategic qualitative goal aligned with enhanced gender and racial/ethnic diversity as the five corporate performance measures that best supported our annual operating plan, environmental, social and governance initiatives, and enhanced long-term value creation. The addition of the awards goal in fiscal 2023 further emphasizes our focus on long term growth.
|
|
|
Plan Metrics(1) |
Metric Type |
Weighting for NEOs |
Revenue |
Corporate |
25.0% |
Adjusted EBITDA |
Corporate |
25.0% |
Awards |
Corporate |
20.0% |
Cash Flow |
Corporate |
20.0% |
Diversity |
Corporate |
10.0% |
(1)For purposes of the fiscal 2023 AIP, Revenue represents GAAP revenue, less revenue from consolidated non-controlling interests (“NCI”). Adjusted EBITDA is earnings before interest, tax, depreciation, and amortization and the calculation is based on performance net operating income (“NOI”) plus depreciation expense. Awards represents GAAP awards booked into backlog and expected to be earned in the future during the period. Cash flow represents cash flow as reported in the Company’s GAAP financial statements as adjusted in the determination of NOI, as well as other non-P&L adjustments of a non-recurring, non-operating nature.
The final performance goal achievement under our AIP for the 2023 fiscal year for our NEOs was the sum of the performance achievement of each of the four corporate financial goals described above and the non-financial strategic qualitative goal aligned with enhanced gender and racial/ethnic diversity.
The level of achievement of each of the three corporate financial goals was determined as follows:
|
|
|
If the actual goal performance for the fiscal year was |
|
Then the Performance Goal
Achievement
for the fiscal year was |
Greater than 120% of the target performance goal measure |
|
200% |
Greater than 100% but less than 120% of the target performance goal measure |
|
100% - 200%* |
Equal to the target performance goal measure |
|
100% |
80% or greater but less than 100% of the target performance goal measure |
|
50% - 100%* |
Less than 80% of the target performance goal measure |
|
0% |
*Between these values determined on a straight-line basis |
For fiscal 2023, the target levels for the four corporate financial performance measures are set forth in the table below (in millions). Our Compensation and Management Development Committee believed that achieving the target levels for the four corporate financial performance measures would require a focused and consistent effort by our executive officers throughout fiscal 2023. As noted above, we achieved record levels of revenue and adjusted EBITDA in fiscal 2023, and accordingly, the financial metrics were earned at the maximum payout level.
|
|
|
|
|
|
|
|
|
|
|
|
|
|
Plan Metrics |
|
|
Metric Type |
|
Metric Target (M) |
|
Actual Results (M) |
|
Performance Goal
Achievement (%) |
Revenue |
|
|
Corporate |
|
|
$4,475.0 |
|
|
|
$5,442.7 |
|
|
200.0% |
Adjusted EBITDA |
|
|
Corporate |
|
|
$385.0 |
|
|
|
$464.7 |
|
|
200.0% |
Awards |
|
|
Corporate |
|
|
$4,800.0 |
|
|
|
$5,996.8 |
|
|
200.0% |
Cash Flow |
|
|
Corporate |
|
|
$300.0 |
|
|
|
$407.7 |
|
|
200.0% |
In early 2023, the Compensation and Management Development Committee established strategic qualitative goals aligned with enhanced gender and racial/ethnic diversity, which collectively represented 10% of our NEOs target annual incentive opportunity for 2023. Similar to the financial goals described above, each of the gender and racial/ethnic diversity goals had threshold, target, and maximum payout opportunities.
In February 2024, after its review and evaluation of progress towards achieving strategic goals aligned with enhanced gender and racial/ethnic diversity, the Compensation and Management Development Committee determined strategic goal achievement of 32.1% resulting in a weighted 3.2% achievement factor for this portion of the NEOs annual incentive opportunity.
The strategic goal performance measures are set forth in the table below.
|
|
|
|
|
|
Plan Metric |
Metric Type |
|
Metric Measurements |
|
Performance Achievement |
Strategic Core Value |
Diversity |
|
Improvement of overall representation of diverse (female and race/ethnic) employees assessed against 2023 performance |
|
Improvement in global female representation was achieved below the threshold goal established at the beginning of the year. Improvement in racial/ethnic diversity representation was achieved above the threshold goal, but below the target goal, established at the beginning of the year. Opportunity for sustained measured improvement in female and racial/ethnic diversity representation going forward, particularly as it relates to racial/ethnic diversity within leadership. |
In consideration of both the financial and strategic goal performance, the overall incentive payout for our NEOs was 183.2%.
The following table provides information regarding the annual management incentive bonus awards earned by the NEOs for fiscal 2023:
|
|
|
|
|
|
|
|
|
|
|
|
Named Executive
Officer |
|
Target Bonus
(% of
Base Salary) |
|
Target Bonus ($) |
|
Financial
Performance
Achievement
(weighted/avg) |
|
Bonus ($) |
|
Carey A. Smith |
|
125% |
|
|
$1,250,000 |
|
|
183.2% |
|
$2,290,200 |
|
Matthew Ofilos |
|
85% |
|
|
$461,869 |
|
|
183.2% |
|
$846,300 |
|
Michael R. Kolloway |
|
75% |
|
|
$388,238 |
|
|
183.2% |
|
$711,400 |
|
Susan M. Balaguer |
|
75% |
|
|
$336,656 |
|
|
183.2% |
|
$616,900 |
|
Long-Term Incentives
We use long-term incentive compensation to motivate and reward our executive officers for long-term corporate performance, thereby aligning the interests of our executive officers with those of our stockholders.
Long-Term Incentives Awarded in 2023. We awarded the following long-term incentive awards to our NEOs, each of which are described in greater detail below:
•Time-based restricted stock units, or RSUs, with three-year ratable vesting.
•Performance-based restricted stock units, or PSUs, with three-year cliff vesting.
Our CEO advises the Compensation and Management Development Committee with respect to which NEOs (other than the CEO) should receive long-term incentive awards, and provides information regarding each NEO’s duties, present and potential contributions to the Company and such other factors as the Compensation and Management Development Committee may deem relevant for determining participation in the plans and the size of a NEO’s awards.
Each RSU and PSU represents a contingent right to receive one share of our common stock. Vested shares will be delivered to the recipient following each vesting date. The RSUs and PSUs granted in 2023 to our NEOs were granted under our 2019 Incentive Award Plan.
In 2023, the targeted values of long-term incentive awards for our NEOs are set forth in the table below. Each NEO’s long-term incentive compensation target for 2023 was allocated 40% to RSUs and 60% to PSUs (at “target”).
|
|
|
|
|
|
|
|
|
|
|
Named Executive
Officer |
|
PSU Target
Award ($) |
|
PSU Target
Units (#) |
|
RSU Target
Award ($) |
|
RSU Units (#) |
|
2023 Total
Long-Term
Incentive
Target Award
($) |
Carey A. Smith (1) |
|
3,210,000 |
|
71,159 |
|
2,140,000 |
|
47,439 |
|
5,350,000 |
Matthew Ofilos |
|
669,000 |
|
14,830 |
|
446,000 |
|
9,886 |
|
1,115,000 |
Michael R. Kolloway |
|
582,000 |
|
12,901 |
|
388,000 |
|
8,601 |
|
970,000 |
Susan M. Balaguer |
|
270,000 |
|
5,985 |
|
180,000 |
|
3,990 |
|
450,000 |
(1)Ms. Smith received a one-time equity award. The one-time equity award package of RSUs and PSUs awarded December 2023 is not included, as described below.
The RSUs granted to the NEOs in 2023 vest in three equal installments on each of February 26, 2024, 2025 and 2026 (other than the CEO's one time performance grant which vests over four equal installments beginning December 18, 2023), subject to the NEO’s continued service with the Company through each such vesting date, except as provided in the 2019 Incentive Award Plan or the applicable award agreement.
In the case of a NEOs termination of service due to death or disability, a NEO will vest in a prorated portion of the RSUs scheduled to vest on the next annual vesting date, based on the portion of months that has elapsed since the previous annual vesting date (or if no annual vesting date has yet occurred, since the Grant Date) through the date of termination. In the event of Participant’s Termination of Service due to Retirement, Participant will immediately vest upon such Termination of Service in the total number of RSUs set forth in the Grant Notice.
All of our NEOs change in control requires a double trigger for accelerated vesting of equity. In the event of a Change in Control where a Qualifying Termination Event occurs, the NEOs RSUs shall accelerate, vest and be settled in full immediately prior to such Change in Control.
The PSUs granted in 2023 are earned upon the achievement of pre-established performance goals over a three-year performance cycle. Each year our Board approves the applicable performance criteria, including the level(s) of performance, upon which the PSUs payable will be determined in respect of a NEO’s PSU target award. The performance goals may be expressed in terms of overall Company financial results on an absolute or relative basis, such as, but not limited to, its results in relation to a budgeted target or industry benchmarks. The pre-established thresholds, targets, and maximums for these performance goals are not disclosed for competitive reasons. At the end of a performance cycle, the Compensation and Management Development Committee determines actual performance against the applicable performance goals and the resulting number of PSUs actually earned by a NEO. A NEO’s PSU target dollar value is converted into a number of PSUs on the date of grant based on the trailing 60-trading day weighted average up to and including the grant date.
The three-year performance cycle for the PSUs granted in 2023 commenced on January 1, 2023, and will end on December 31, 2025. These PSUs are referred to as the “2023-2025 PSUs.” The performance goals for the 2023-2025 PSUs were divided equally between cumulative adjusted EBITDA and cumulative revenue, which the Compensation and Management Development Committee believed to be important metrics for driving performance and promoting alignment of the interests of our executive officers and our stockholders. The targets set for the 2023-2025 PSU performance goals were determined based on the Company’s business plan and are designed to be challenging yet attainable, with the opportunity for a maximum payout of 200% of the target PSUs in connection with performance achievement of 115% of target, or greater, for cumulative Adjusted EBITDA, and 115% of target, or greater, for cumulative revenue. Target performance relative to the performance goals will result in 100% of the PSUs vesting. Parsons must achieve threshold performance (90% of target for cumulative adjusted EBITDA and 90% of target for cumulative revenue for at least one of these two financial metrics for any PSUs to vest.
The resulting number of PSUs after determining performance relative to the cumulative adjusted EBITDA and cumulative revenue that would be eligible to vest will then be multiplied by a multiplier (the "rTSR Multiplier") determined based on the Company's relative total shareholder return ("rTSR") percentile ranking within the custom “Peer Benchmark” (as defined below) for the 2023-2025 Performance Cycle as follows:
|
|
|
rTSR Performance for the 2023-2025 Performance Cycle |
|
rTSR Multiplier |
Company rTSR ranking of 75th percentile or above |
|
125% |
Company rTSR ranking of 50th percentile |
|
100% |
Company rTSR ranking of 25th percentile or below |
|
75% |
rTSR achievement between threshold and target and between target and maximum will be calculated as an interpolation between the potential payment results.
The "Peer Benchmark" includes AECOM, Booz Allen Hamilton Holding Corporation, CACI International Inc, Jacobs Solutions Inc, Leidos Holding, Inc, Science Applications International Corporation, Stantec Inc, Tetra Tech Inc, and WSP Global Inc. The Peer Benchmark represents peers we benchmark financial performance against and is generally in line with most analysts’ models, which the Compensation and Management Development Committee believed to be appropriate for purposes of computing rTSR.
The 60-trading day weighted average stock price preceding (and including) the first day and last day of the 2023-2025 performance cycle will be used to determine the Company's rTSR relative to the Peer Benchmark.
Following the completion of the three-year performance cycle, the Compensation and Management Development Committee will determine the achievement percentage relative to the performance goals and rTSR for the performance cycle and determine the final achievement percentage for the PSUs. Except as provided in the 2019 Incentive Award Plan or the applicable award agreement, a recipient must be employed on the date of payout in order to be eligible to vest in the PSUs.
In the event of a NEO’s termination of service due to retirement, defined as age 62 with 10 years of service, death or disability prior to the Payment Date, the NEO will remain eligible to vest in and receive a prorated portion of his or her PSUs for the portion of the three-year performance cycle that has elapsed prior to the date of the termination based on actual performance for the three-year cycle, with the PSUs vesting upon Compensation and Management Development Committee certification of performance following the performance cycle (or, if earlier, the date of a change in control).
All of our NEOs change in control requires a double trigger for accelerated vesting of equity. The PSUs shall continue to be eligible for accelerated vesting provided that in the event of the NEOs Termination of Service without "cause" (and other than as a result of NEOs retirement, death or disability) upon or within twelve (12) months following the Change in Control, provided such termination occurs prior to the Payment Date, the NEO will vest in the Target PSUs on the date of such termination. In the event of a Change in Control prior to the Payment Date, where the NEO has a Qualifying Termination Event, the Target PSUs shall accelerate, vest and be settled in full immediately prior to such Change in Control.
One-Time CEO Award
As discussed above, Parsons achieved record revenue and adjusted EBITDA levels in fiscal 2023 under the leadership of Ms. Smith. Ms. Smith was individually recognized with numerous leadership accolades, including being named “Executive of the Year” at the Greater Washington Government Contractor Awards, presented by the Northern Virginia Chamber of Commerce and the Professional Services Council. Furthermore, under Ms. Smith’s leadership, the company was also recognized for excellence in culture, execution, and ethical business practices, including being named one of the World’s Most Ethical Companies by Ethisphere for the 14th consecutive year and placing as one of Engineering News-Record’s top three companies in four categories: program management, construction management, professional services, and program/construction for fee. The company also was recognized as a leading employer for workplace excellence by the Los Angeles Business Journal, The Colorado Springs Gazette, Minority Engineer Magazine, STEM Workforce Diversity Magazine, the Human Rights Campaign Foundation, Forbes Magazine, Newsweek, the Washington Business Journal, and Woman Engineer Magazine.
After considering Ms. Smith’s performance as CEO, her unvested equity holdings, and the competitive market for CEO pay in our sector, the Compensation and Management Development Committee approved a one-time equity award package for Ms. Smith with a total target value of $10,000,000 in December 2023
A majority of the package was delivered in performance-based equity (60%) that cliff vests after a four-year performance period. The remaining portion of the award was delivered in time-based equity (40%) and vests in equal annual installments over four years. The four year vesting horizons in both the performance-based and time-based portion of the award are longer than the three year-horizon used in our annual equity program. The design of the one-time equity award package was driven by the Committee's objective to recognize and reward Ms. Smith's strong leadership and performance as our CEO, motivate Ms. Smith's future performance in a manner that is aligned with stockholder interests, and promote Ms. Smith’s ongoing retention.
The one-time PSU award shall vest based on relative TSR performance during the four-year period commencing December 18, 2023 and ending December 17, 2027 (the "2023-2027 Performance Cycle") and subject to Ms. Smith’s ongoing service through such period. The Company must achieve a threshold level of relative TSR performance for Ms. Smith to receive any payment with respect to the award. In recognition of the “above-and-beyond” nature of the award, and to further incentivize exceptional performance over the coming years, the Company must achieve at least the 65th percentile of relative performance for the target number of shares to be earned. The target PSUs set forth in the grant will be multiplied by a rTSR Multiplier determined based on the rTSR percentile ranking within the Peer Benchmark for the 2023-2027 Performance Cycle as follows:
|
|
|
rTSR Performance for the 2023-2027 Performance Cycle |
|
rTSR Multiplier |
Company rTSR ranking of 75th percentile or above |
|
150% |
Company rTSR ranking of 65th percentile |
|
100% |
Company rTSR ranking of 55th percentile |
|
50% |
Company rTSR ranking of 35th percentile or below |
|
0% |
rTSR achievement between the various thresholds noted in the table above will be linearly interpolated. The 60-trading day weighted average stock price preceding (and including) the first day and last day of the 2023-2027 performance cycle will be used to determine the total shareholder return for Parsons and the Peer Benchmark constituent companies.
In the event of Ms. Smith's Termination of Service due to death, disability, or Ms. Smith's Termination of Service due to involuntary Termination of Service by the Company for any reason other than performance or cause, Ms. Smith will vest in a prorated portion of the PSUs scheduled to vest on the vesting date, based on the portion of months that has elapsed since the grant date through the date of termination. In the event of Ms. Smith’s Termination of Service due to Retirement, Ms. Smith will forfeit upon such Termination of Service the total number of PSUs set forth in the Grant Notice unvested as of the Termination date.
Subject to Ms. Smith’s ongoing service, the RSU component of the one-time award will vest in four equal installments on each anniversary of grant. In the event of Ms. Smith’s Termination of Service due to death or disability, Ms. Smith will vest in a prorated portion of the RSUs scheduled to vest on the next annual vesting date, based on the portion of months that has elapsed since the previous annual vesting date (or if no annual vesting date has yet occurred, since the Grant Date) through the date of termination. In the event of Ms. Smith's Termination of Service due to involuntary Termination of Service by the Company for any reason other than performance or cause, Ms. Smith will immediately vest upon such Termination of Service in the total number of RSUs set forth in the Grant Notice. In the event of Ms. Smith's Termination of Service due to Retirement, Ms. Smith will forfeit upon such Termination of Service the total number of RSUs set forth in the Grant Notice unvested as of the Termination date.
Vesting of 2021-2023 Long-Term Incentive Awards
The 2021-2023 performance cycle performance goals were divided equally between cumulative contract award values and cumulative adjusted EBITDA Margin, which the Compensation and Management Development Committee believed to be important metrics for driving performance and promoting alignment of the interests of our executive officers and our stockholders. The targets set for 2021-2023 performance goals were determined based on the business plan, and were designed to be challenging yet attainable, with the opportunity for a maximum payout of 200% of the target PSUs in connection with performance achievement of 115% of target, or greater, for cumulative contract awards, and 115% of target, or greater, for adjusted EBITDA margin. Target performance relative to the performance goals was set to result in 100% of the PSUs vesting. Parsons had to achieve threshold performance (90% of target for cumulative contract awards and 90% of target for cumulative adjusted EBITDA margin) for at least one of these two financial metrics for any PSUs to vest. The resulting number of PSUs from the cumulative contract award and cumulative adjusted EBITDA achievement was then modified by a rTSR Multiplier determined based on the Company's "rTSR" percentile ranking within the Peer Benchmark (as described above) for the 2021-2023 performance cycle, with the opportunity for a maximum multiplier of 125% of the initial eligible PSUs in connection with the Company’s rTSR ranking of 75th percentile or above, a target multiplier of 100% in connection with a ranking of 50th percentile, and a multiplier of 75% in connection with a ranking of 25th percentile or below. Achievement between threshold and target and between target and maximum was calculated as an interpolation between potential payout results.
At least threshold performance was required for at least one of these two financial metrics for any amount to be paid under the PSUs. At threshold performance the NEO earned 50% of his or her PSU award, 100% at target performance and 200% upon achievement of the maximum goal. The threshold, target and maximum goals for the 2021-2023 cycle were:
|
|
|
Cumulative Contract Awards ($ billions) |
|
Potential Payout %* |
<$13.75 |
|
0 |
$13.75 |
|
50% |
$14.52 |
|
75% |
$15.30 |
|
100% |
$15.86 |
|
125% |
$16.43 |
|
150% |
$17.00 |
|
175% |
≥$17.57 |
|
200% |
*Between these values determined on a straight-line basis |
Results between threshold and target and target and maximum are determined by straight line interpolation.
|
|
|
Adjusted EBITDA Margin |
|
Potential Payout %* |
<8.5% |
|
0 |
8.5% |
|
50% |
9.0% |
|
75% |
9.4% |
|
100% |
9.8% |
|
125% |
10.1% |
|
150% |
10.5% |
|
175% |
>10.8% |
|
200% |
*Between these values determined on a straight-line basis |
For the 2021-2023 performance cycle, in February 2024, the Compensation and Management Development Committee determined that our cumulative contract awards was $17.1 billion and our cumulative adjusted EBITDA margin was 8.5%, resulting in a weighted average performance achievement for the total initial eligible PSU achievement at 116.6%. The 2021-2023 rTSR percentile rank was determined to be 66.7% resulting in rTSR multiplier of 116.7%, for a resulting total payout of 136.04%. The 2021-2023 PSU awards will be paid in shares to the NEOs in February 2024. For information about the 2021-2023 PSU awards held by each of our NEOs, see the “Outstanding Long-Term Incentive Awards at Fiscal Year-End Table” below.
Other Compensation Elements
We also provide our employees, including our NEOs, with a variety of employee benefit plans, including our ESOP, a 401(k) plan with matching contributions, non-qualified deferred compensation plans and welfare benefits, such as health, life and disability, which we use to attract and retain our employees.
We also offer financial planning and executive physical reimbursements to our NEOs to the extent our Board believes that these limited perquisites are appropriate to assist an individual NEO in the performance of his or her duties, to make our NEOs more efficient and effective, and for recruitment, motivation or retention purposes.
All future practices with respect to perquisites or other personal benefits will continue to be subject to periodic review and approval by the Compensation and Management Development Committee.
Post-Employment Compensation
The initial terms and conditions of employment for each of our NEOs are set forth in written offer letters. Each of our NEOs are employed on an at-will basis.
For a summary of the material terms and conditions of our post-employment compensation arrangements, see “—Potential Payments upon Termination or Change in Control” below.
Compensation Clawback Policy
Our Compensation Clawback Policy that applies to our NEOs. Pursuant to this policy, the Compensation and Management Development Committee has the authority to seek:
•Compensation paid, payable or awarded under the Company’s short- and long-term incentive compensation programs, including any discretionary bonuses, equity-based incentive awards (whether or not vested).
•Shares or phantom units acquired upon vesting or lapse of restriction of any awards; shares or phantom units acquired upon exercise of options or appreciation rights; dividend equivalents paid on equity incentive awards.
In the event of:
•If the Company suffers, or could reasonably be expected to suffer, material financial damage as a result of any conduct by the NEO constituting fraud, material theft of Company assets, bribery, corruption, or other illegal acts, gross negligence, or willful misconduct involving the Company or its subsidiaries (“Detrimental Conduct’’).
•A material restatement of the Company’s financial or operational results, as a result of the NEO’s Detrimental Conduct, but not including restatements caused by changes in accounting rules, reclassifications or similar retrospective changes that are not the result of Detrimental Conduct (a “Restatement”).
The Compensation and Management Development Committee may recover under this policy the incentive compensation paid, awarded or acquired by the NEO within the three years preceding the date on which the Compensation and Management Development Committee determines circumstances triggering the right to clawback such compensation has occurred. Additionally, in the event of a restatement, the amount that may be recovered under this policy will be limited to the excess of the amount of any incentive compensation actually paid, vested or awarded, and the amount of any such incentive compensation that would have been paid, vested or awarded had the financial or operational results been properly reported.
Any clawback under this policy may, in the discretion of the Compensation and Management Development Committee, be accomplished through (1) the reduction, forfeiture or cancellation of awards whether or not vested or deferred, (2) requiring the repayment to the Company of any gain realized or payment received upon the exercise or payment of the award valued as of the date of exercise or payment, (3) adjusting future incentive compensation opportunities, or (4) such other manner as the Compensation and Management Development Committee, in its discretion, determines to be appropriate.
The Company’s right of clawback under this Policy is in addition to any other remedy available to it, including, but not limited to, termination of employment, the initiation of civil or criminal proceedings, and any right to repayment under the Sarbanes-Oxley Act of 2002, and any other applicable law.
Additionally, in October 2023, the Company adopted Parsons Dodd-Frank Compliant Compensation Clawback Policy as required by the final Dodd-Frank rules and exchange listing standards. Our policy requires recoupment of incentive compensation erroneously paid to our executive officers if amounts were based on material noncompliance with any financial reporting requirement that causes an accounting restatement, without regard to any fault or misconduct.
Executive Ownership Guidelines
The Board believes that it is important to link the interests of our NEOs to those of our stockholders. The stock ownership guidelines require our executives to accumulate and hold a minimum number of shares of Parsons common stock within five years of the later of (1) the effective date of the policy or (2) the date of appointment/promotion of the executive officer. The specific Parsons stock ownership requirements for our executive officers are as follows:
|
|
|
|
|
CEO |
|
5x Annual Base Salary |
|
|
Other Executive Officers |
|
3x Annual Base Salary |
For our CEO and other executive officers, shares of our common stock that count towards satisfaction of these guidelines include (1) common stock directly owned by the executive or immediate family member (2) common stock owned indirectly if the individual has an economic interest in the shares (beneficial ownership as defined in Rule 13d-3 and reported in the proxy) (3) shares held through the ESOP, (4) unvested restricted stock or RSUs, excluding shares or units remaining subject to achievement of performance goals, and (5) shares held through the 401(k) plan, at such time in the future this option is available.
Value of ownership is measured by reference to the trailing 60 trading day weighted average of the Parsons common stock, up to and including last day of the calendar year; compliance is evaluated annually.
As of December 31, 2023, each of our continuing NEOs is in compliance with their ownership guideline, either by meeting their executive ownership requirement, or by having made sufficient progress toward their ownership requirement based on time in role.
Anti-Hedging and Anti-Pledging Policies
Under our Insider Trading Compliance Policy, we prohibit our employees, including our NEOs, and Board members, from hedging the risk associated with ownership of shares of Parsons common stock and other securities, as well as from pledging any Parsons securities as collateral for a loan.
Compensation-Related Risk
Our Compensation and Management Development Committee is responsible for the oversight of our risk profile, including compensation-related risks. Our Compensation and Management Development Committee monitors our compensation policies and practices as applied to our employees to ensure that these policies and practices do not encourage excessive and unnecessary risk-taking, and that the level of risk that they do encourage is not reasonably likely to have a material adverse effect on us. The compensation policies and practices in place that mitigate unnecessary risk include:
•An appropriate compensation mix that is designed to balance fixed and variable pay and emphasize both short-term and long-term performance.
•A substantial portion of incentive compensation for top level executives is associated with our long-term performance. This discourages short-term risk taking.
•Multi-year vesting provisions (3-year cliff for performance awards and 3 year ratable for time-based awards) for all equity awards granted under our long-term incentive plans, other than the one time award to Ms. Smith in December 2023 which has a 4-year cliff for the performance award and 4 year ratable for the time-based award.
•Financial performance measures used for incentive plans covering colleagues at all levels of the Company include a balanced mix of financial metrics that are in-line with operating and strategic plans.
•Certain, but not all, of the short- and long-term incentive metrics overlap; where applicable, different measurement periods are used (i.e., 1- and 3-years), which provides a balance and reduces the opportunity to take undue risks to meet a single goal.
•A significant portion of annual and long-term incentive payments are based on Company and business profitability, ensuring a correlation between pay and performance.
•Financial targets are appropriately set, and if not achieved, result in a reduction of compensation. Assuming at least threshold performance is achieved, our incentive plans generally result in some payouts at levels below target, rather than an “all-or-nothing” approach.
•Executive and broad-based incentive plans cap the maximum award payable to any individual.
•The Compensation and Management Development Committee considers information from peer group companies to provide a reference for compensation design, thereby avoiding unusually high pay opportunities relative to the Company’s peers.
•Incentive payments are subject to clawback in the event of certain conduct and/or the result of a material restatement of our financial results, under the Parsons Clawback Policy and the Parsons Dodd-Frank Compliant Compensation Clawback Policy.
Impact of Tax and Accounting
As part of its role, the Compensation and Management Development Committee reviews and considers the deductibility of our executive compensation under Section 162(m) of the Internal Revenue Code. Section 162(m) generally limits the tax deduction for compensation in excess of one million dollars paid to certain executive officers. The Compensation and Management Development Committee does not necessarily limit executive compensation to the amount deductible under that provision.
In its review and establishment of compensation programs and awards for our NEOs, the Compensation and Management Development Committee considers the anticipated deductibility or non-deductibility of the compensation as only one factor in assessing whether a particular compensatory arrangement is appropriate, particularly in light of the goals of maintaining a competitive executive compensation system generally (i.e., paying for performance and maximizing stockholder return).
The Compensation and Management Development Committee reserves the right to use their judgment to authorize compensation payments that do not qualify for the compensation deduction if, in light of all applicable circumstances, they believe that such payments are appropriate and in the Company’s best interests and that of our stockholders.
In designing and implementing our compensation programs the Compensation and Management Development Committee also takes into account the accounting impact of such payments. However, it ultimately determines pay based on the most effective means to implement our long-term strategy.
COMPENSATION AND MANAGEMENT DEVELOPMENT COMMITTEE REPORT ON EXECUTIVE
COMPENSATION
The Compensation and Management Development Committee has reviewed and discussed the CD&A included in this proxy statement with members of management, and based on such review and discussions, the Compensation and Management Development Committee recommended to the Board that the CD&A be included in this proxy statement.
|
|
|
THE COMPENSATION AND MANAGEMENT DEVELOPMENT COMMITTEE |
|
Mark K. Holdsworth Steven F. Leer (Chair) Ellen M. Lord |
|
Gen. Darren W. McDew, USAF (ret.) |
|
Harry T. McMahon |
|
David C. Wajsgras |
COMPENSATION TABLES
Summary Compensation Table
The following table presents summary information regarding the total compensation awarded to, earned by, or paid to each of our NEOs for services rendered in all capacities for fiscal 2023.
|
|
|
|
|
|
|
|
|
|
|
|
|
|
|
|
|
|
|
|
|
|
|
|
|
|
SUMMARY COMPENSATION TABLE |
Name and Principal
Position |
Year |
Salary
($) |
Stock
Awards
($)(1) |
Non-Equity
Incentive Plan
Compensation
($)(2) |
Change in
Pension Value
and
Nonqualified
Deferred
Compensation
Earnings
($)(3) |
All Other
Compensation
($)(4) |
Total
($) |
Carey A. Smith |
2023 |
|
976,923 |
|
|
|
15,215,909 |
|
|
|
2,290,200 |
|
|
|
18,822 |
|
|
|
95,041 |
|
|
$ |
18,596,895 |
|
|
Chair, President & |
2022 |
|
899,999 |
|
|
|
4,730,700 |
|
|
|
1,237,200 |
|
|
|
8,192 |
|
|
|
97,714 |
|
|
$ |
6,973,806 |
|
|
Chief Executive Officer |
2021 |
|
798,557 |
|
|
|
3,895,113 |
|
|
|
569,100 |
|
|
|
4,238 |
|
|
|
81,110 |
|
|
$ |
5,348,118 |
|
|
Matthew Ofilos |
2023 |
|
535,601 |
|
|
|
1,151,618 |
|
|
|
846,300 |
|
|
|
832 |
|
|
|
53,068 |
|
|
$ |
2,587,420 |
|
|
Chief Financial Officer |
2022 |
|
432,692 |
|
|
|
1,671,553 |
|
|
|
397,100 |
|
|
|
— |
|
|
|
44,047 |
|
|
$ |
2,545,391 |
|
|
|
|
|
|
|
|
|
|
|
|
|
|
|
|
|
|
|
|
|
|
Michael R. Kolloway |
2023 |
|
514,413 |
|
|
|
1,001,864 |
|
|
|
711,400 |
|
|
|
8,330 |
|
|
|
78,503 |
|
|
$ |
2,314,509 |
|
|
Chief Legal Officer & |
2022 |
|
505,769 |
|
|
|
901,036 |
|
|
|
420,700 |
|
|
|
3,851 |
|
|
|
78,827 |
|
|
$ |
1,910,184 |
|
|
Secretary |
2021 |
|
489,423 |
|
|
|
765,313 |
|
|
|
201,700 |
|
|
|
2,090 |
|
|
|
77,136 |
|
|
$ |
1,535,662 |
|
|
Susan M. Balaguer |
2023 |
|
439,832 |
|
|
|
464,775 |
|
|
|
616,900 |
|
|
|
764 |
|
|
|
57,547 |
|
|
$ |
1,579,817 |
|
|
Chief Human Resources Officer |
2022 |
|
422,212 |
|
|
|
981,197 |
|
|
|
352,600 |
|
|
|
— |
|
|
|
46,887 |
|
|
$ |
1,802,895 |
|
|
|
|
|
|
|
|
|
|
|
|
|
|
|
|
|
|
|
|
|
|
(1)This column represents the aggregate grant date fair value, calculated in accordance with FASB ASC Topic 718, of RSUs and PSUs granted. Amounts do not correspond to the actual value that will be realized by the NEOs. The grant date fair value as calculated under FASB ASC Topic 718 of the RSUs is determined by multiplying our share price on the date of grant by the number of shares subject to the award. With respect to the PSUs, the grant date fair value is based on the estimated probable outcome of the performance objectives applicable to such awards on the grant date, which was determined to be 100% of target levels in 2023, 100% of target levels in 2022 and 100% of target levels in 2021. The grant date fair value of PSUs granted in 2023 assuming achievement at maximum levels (200% of target levels and 125% rTSR multiplier) is as follows: $1,755,501 for Mr. Ofilos, $1,527,156 for Mr. Kolloway, and $708,474 for Ms. Balaguer. The grant date fair value of the PSUs granted in 2023 assuming achievement at maximum levels (200% of target levels and 125% rTSR multiplier, and 150% rTSR Multiplier) for Ms. Smith is as follows: $8,423,447 for the February grant and $8,300,229 for the December grant. The grant date fair value of the PSUs granted in 2022 assuming achievement at maximum levels (200% of target levels and 125% rTSR multiplier) is as follows: $7,301,891 for Ms. Smith, $1,390,796 for Mr. Kolloway, and $742,270 for Ms. Balaguer. The grant date fair value of the PSUs granted in 2022 assuming achievement at maximum levels (200% of target levels and 125% rTSR multiplier) for Mr. Ofilos is as follows: $225,977 for the March grant and $1,522,176 for the August grant. The grant date fair value of the PSUs granted in 2021 assuming achievement at maximum levels (200% of target levels and 125% rTSR multiplier) is as follows: $1,171,263 for Mr. Kolloway. The grant date fair value of the PSUs granted in 2021 assuming achievement at maximum levels (200% of target levels and 125% rTSR multiplier) for Ms. Smith is as follows: $2,394,020 for the March grant and $3,496,353 for the July grant. For additional information on the valuation assumptions used in the calculation of these amounts, refer to note 6 to the financial statements included in the Company’s Annual Report on Form 10-K for the fiscal year ended December 31, 2023, as filed with the SEC.
(2)Non-equity incentive plan awards consist of annual incentive awards payable under the Company’s AIP. For more information about the Company’s AIP, please see “Compensation Discussion and Analysis — Annual Cash Incentives” above.
(3)Represents earnings under the Company’s non-qualified deferred compensation plans for the applicable fiscal year.
(4)The table below describes the elements included in All Other Compensation:
|
|
|
|
|
|
|
|
|
|
|
|
|
|
|
|
|
|
|
|
|
|
|
|
|
|
|
|
|
|
|
|
|
ALL OTHER COMPENSATION TABLE |
|
|
|
|
Employer Contributions Under
Defined Contribution Plans |
|
|
|
|
|
|
|
|
|
|
|
|
|
|
Name |
Life
Insurance
($) |
|
|
Employer
2023 ERP
Contribution
($) |
Employer
2023 ESOP
Contribution
($) |
Employer
401(k)
Match
($) |
Executive
Physical
($) |
Financial
Planning
($) |
|
|
Charitable
Matching
Contribution
($) |
Total
($) |
Carey A.
Smith |
|
1,520 |
|
|
|
51,754 |
|
|
|
26,400 |
|
|
|
6,600 |
|
|
|
3,767 |
|
|
|
— |
|
|
|
5,000 |
|
|
|
95,041 |
|
|
Matthew
Ofilos |
|
1,120 |
|
|
|
16,448 |
|
|
|
26,400 |
|
|
|
6,600 |
|
|
|
— |
|
|
|
— |
|
|
|
2,500 |
|
|
|
53,068 |
|
|
Michael R.
Kolloway |
|
25,750 |
|
|
|
14,753 |
|
|
|
26,400 |
|
|
|
6,600 |
|
|
|
— |
|
|
|
— |
|
|
|
5,000 |
|
|
|
78,503 |
|
|
Susan M.
Balaguer |
|
2,010 |
|
|
|
8,787 |
|
|
|
26,400 |
|
|
|
6,600 |
|
|
|
3,750 |
|
|
|
5,000 |
|
|
|
5,000 |
|
|
|
57,547 |
|
|
Grants of Plan-Based Awards Table
The following table presents, for each of the NEOs, information concerning each award granted during fiscal 2023. This information supplements the information about these awards set forth in “—Summary Compensation Table.”
|
|
|
|
|
|
|
|
|
|
|
|
|
|
|
|
|
|
|
|
|
|
|
|
|
|
|
|
|
|
|
|
|
|
|
|
|
GRANTS OF PLAN-BASED AWARDS TABLE |
|
|
|
|
Estimated Payouts Under Non-
Equity Incentive Plan Awards(1) |
|
Estimated Future Payouts Under
Equity Incentive Plan Awards(2) |
|
|
|
|
|
|
|
|
Named
Executive
Officer |
|
Grant
Date |
Threshold
($) |
Target
($) |
Maximum
($) |
|
Threshold
(#) |
Target
(#) |
Maximum
(#) |
All Other
Stock
Awards:
Number of
Shares of
Stock or
Units
(#)(3) |
Grant
Date
Fair
Market
Value of
Stock
Awards
($)(4) |
Carey A. |
AIP |
1/16/2023 |
|
|
625,000 |
|
|
|
1,250,000 |
|
|
|
2,500,000 |
|
|
|
|
|
|
|
|
|
|
|
|
|
|
|
|
|
|
Smith |
PSU |
2/27/2023 |
|
|
|
|
|
|
|
|
|
|
|
|
35,580 |
|
|
|
71,159 |
|
|
|
177,898 |
|
|
|
|
|
|
3,369,379 |
|
|
|
RSU |
2/27/2023 |
|
|
|
|
|
|
|
|
|
|
|
|
|
|
|
|
|
|
|
|
|
47,439 |
|
|
|
2,156,577 |
|
|
|
PSU(3) |
12/18/2023 |
|
|
|
|
|
|
|
|
|
|
|
|
50,159 |
|
|
|
100,317 |
|
|
|
150,476 |
|
|
|
|
|
|
5,533,486 |
|
|
|
RSU |
12/18/2023 |
|
|
|
|
|
|
|
|
|
|
|
|
|
|
|
|
|
|
|
|
|
66,878 |
|
|
|
4,156,468 |
|
|
Matthew |
AIP |
1/16/2023 |
|
|
230,934 |
|
|
|
461,869 |
|
|
|
923,738 |
|
|
|
|
|
|
|
|
|
|
|
|
|
|
|
|
|
|
Ofilos |
PSU |
2/27/2023 |
|
|
|
|
|
|
|
|
|
|
|
|
7,415 |
|
|
|
14,830 |
|
|
|
37,075 |
|
|
|
|
|
|
702,201 |
|
|
|
RSU |
2/27/2023 |
|
|
|
|
|
|
|
|
|
|
|
|
|
|
|
|
|
|
|
|
|
9,886 |
|
|
|
449,418 |
|
|
Michael R. |
AIP |
1/16/2023 |
|
|
194,119 |
|
|
|
388,238 |
|
|
|
776,475 |
|
|
|
|
|
|
|
|
|
|
|
|
|
|
|
|
|
|
Kolloway |
PSU |
2/27/2023 |
|
|
|
|
|
|
|
|
|
|
|
|
6,451 |
|
|
|
12,901 |
|
|
|
32,253 |
|
|
|
|
|
|
610,862 |
|
|
|
RSU |
2/27/2023 |
|
|
|
|
|
|
|
|
|
|
|
|
|
|
|
|
|
|
|
|
|
8,601 |
|
|
|
391,001 |
|
|
Susan M. |
AIP |
1/16/2023 |
|
|
168,328 |
|
|
|
336,656 |
|
|
|
673,313 |
|
|
|
|
|
|
|
|
|
|
|
|
|
|
|
|
|
|
Balaguer |
PSU |
2/27/2023 |
|
|
|
|
|
|
|
|
|
|
|
|
2,993 |
|
|
|
5,985 |
|
|
|
14,963 |
|
|
|
|
|
|
283,390 |
|
|
|
RSU |
2/27/2023 |
|
|
|
|
|
|
|
|
|
|
|
|
|
|
|
|
|
|
|
|
|
3,990 |
|
|
|
181,385 |
|
|
(1)Non-equity incentive plan awards consist of annual incentive awards payable under the Company’s AIP. For more information about the Company’s AIP, please see “Compensation Discussion and Analysis — Annual Cash Incentives” above.
(2)Represents the number of units subject to the 2023-2025 PSU awards. The 2023-2025 PSUs are eligible to vest based on the achievement of performance goals over the three-year performance cycle ending December 31, 2025; 50% is based on achievement of cumulative adjusted EBITDA and 50% is based on achievement of cumulative revenue through December 31, 2025 and continued employment through the date of payout, which will be no later than March, 2026. Payouts may range from 0% to 200% of target based on actual cumulative adjusted EBITDA and cumulative revenue performance achieved over the three-year performance cycle, with a maximum modified payout of 250% based on actual rTSR performance relative to a custom industry peer benchmark for the three-year performance cycle. For more information about the accelerated vesting of these PSUs, see “Compensation Discussion and Analysis — Long-Term Incentives” above.
(3)Represents the number of units subject to the 2023-2027 PSU award. The 2023-2027 PSUs are eligible to vest based on rTSR achievement through December 17, 2027, and continued employment through the date of payout, which will be no later than March, 2028. Payout may range from 0% to 150% of target based on actual rTSR performance relative to a custom industry peer benchmark for the four-year performance cycle. For more information about the accelerated vesting of these PSUs, see “Compensation Discussion and Analysis — Long-Term Incentives” above.
(4)The RSUs granted on February 27, 2023 vest in three equal installments on February 26, 2024, 2025 and 2026, subject to the NEO’s continued service with the Company through each such date. The RSUs granted to Ms. Smith on December 18, 2023 vest in four equal installments on December 17, 2024, 2025, 2026 and 2027, subject to Ms. Smith's continued
service with the Company through each such date. For more information about the accelerated vesting of these RSUs, see “Compensation Discussion and Analysis — Long-Term Incentives” above.
(5)The grant date fair value of stock awards amounts was calculated in accordance with FASB ASC Topic 718. The grant date fair value as calculated under FASB ASC Topic 718 of the RSUs is determined by multiplying our share price on the date of grant by the number of shares subject to the award. With respect to the PSUs, the grant date fair value is based on the estimated probable outcome of the performance objectives applicable to such awards on the grant date, which was determined to be 100% of target levels. For additional information on the valuation assumptions used in the calculation of these amounts, refer to note 6 to the financial statements included in the Company’s Annual Report on Form 10-K for the fiscal year ended December 31, 2023, as filed with the SEC.
Outstanding Long-Term Incentive Awards at Fiscal Year-End Table
The following table summarizes the number of shares of common stock underlying our RSU and PSU awards granted in 2023, 2022 and 2021, for each NEO as of December 31, 2023.
|
|
|
|
|
|
|
|
|
|
|
|
|
|
|
|
|
|
|
|
|
|
|
|
OUTSTANDING LONG-TERM INCENTIVE AWARDS AT FISCAL YEAR-END TABLE |
Named
Executive
Officer |
|
|
|
Number of
RSUs
That Have
Not Vested
(#) |
|
Market Value
of RSUs
That Have
Not Vested
($)(1) |
|
Number of
Unearned
PSUs
That Have
Not Vested
(#) |
Market Value
of Unearned
PSUs
That Have
Not Vested
($)(1) |
Carey A. |
|
2023 RSU(2) |
|
|
66,878 |
|
|
|
|
4,193,919 |
|
|
|
|
|
|
|
|
|
|
|
Smith |
|
2023 PSU(4) |
|
|
|
|
|
|
|
|
|
|
100,317 |
|
|
|
|
|
6,290,879 |
|
|
|
|
2023 RSU(2) |
|
|
47,439 |
|
|
|
|
2,974,900 |
|
|
|
|
|
|
|
|
|
|
|
|
|
2023 PSU(3) |
|
|
|
|
|
|
|
|
|
|
71,159 |
|
|
|
|
|
4,462,381 |
|
|
|
|
2022 RSU(5) |
|
|
34,654 |
|
|
|
|
2,173,152 |
|
|
|
|
|
|
|
|
|
|
|
|
|
2022 PSU(7) |
|
|
|
|
|
|
|
|
|
|
77,970 |
|
|
|
|
|
4,889,499 |
|
|
|
|
2021 RSU(8) |
|
|
7,825 |
|
|
|
|
490,706 |
|
|
|
|
|
|
|
|
|
|
|
|
|
2021 PSU(9) |
|
|
|
|
|
|
|
|
|
|
35,210 |
|
|
|
|
|
2,208,019 |
|
|
|
|
2021 RSU(8) |
|
|
5,724 |
|
|
|
|
358,952 |
|
|
|
|
|
|
|
|
|
|
|
|
|
2021 PSU(9) |
|
|
|
|
|
|
|
|
|
|
25,756 |
|
|
|
|
|
1,615,159 |
|
|
Matthew |
|
2023 RSU(2) |
|
|
9,886 |
|
|
|
|
619,951 |
|
|
|
|
|
|
|
|
|
|
|
Ofilos |
|
2023 PSU(3) |
|
|
|
|
|
|
|
|
|
|
14,830 |
|
|
|
|
|
929,989 |
|
|
|
|
2022 RSU(5) |
|
|
5,462 |
|
|
|
|
342,522 |
|
|
|
|
|
|
|
|
|
|
|
|
|
2022 RSU(6) |
|
|
12,800 |
|
|
|
|
802,688 |
|
|
|
|
|
|
|
|
|
|
|
|
|
2022 PSU(7) |
|
|
|
|
|
|
|
|
|
|
12,288 |
|
|
|
|
|
770,580 |
|
|
|
|
2022 RSU(5) |
|
|
1,072 |
|
|
|
|
67,225 |
|
|
|
|
|
|
|
|
|
|
|
|
|
2022 PSU(7) |
|
|
|
|
|
|
|
|
|
|
2,413 |
|
|
|
|
|
151,319 |
|
|
Michael R. |
|
2023 RSU(2) |
|
|
8,601 |
|
|
|
|
539,369 |
|
|
|
|
|
|
|
|
|
|
|
Kolloway |
|
2023 PSU(3) |
|
|
|
|
|
|
|
|
|
|
12,901 |
|
|
|
|
|
809,022 |
|
|
|
|
2022 RSU(5) |
|
|
6,600 |
|
|
|
|
413,886 |
|
|
|
|
|
|
|
|
|
|
|
|
|
2022 PSU(7) |
|
|
|
|
|
|
|
|
|
|
14,851 |
|
|
|
|
|
931,306 |
|
|
|
|
2021 RSU(8) |
|
|
2,801 |
|
|
|
|
175,651 |
|
|
|
|
|
|
|
|
|
|
|
|
|
2021 PSU(9) |
|
|
|
|
|
|
|
|
|
|
12,601 |
|
|
|
|
|
790,209 |
|
|
Susan M. |
|
2023 RSU(2) |
|
|
3,990 |
|
|
|
|
250,213 |
|
|
|
|
|
|
|
|
|
|
|
Balaguer |
|
2023 PSU(3) |
|
|
|
|
|
|
|
|
|
|
5,985 |
|
|
|
|
|
375,319 |
|
|
|
|
2022 RSU(6) |
|
|
10,829 |
|
|
|
|
679,087 |
|
|
|
|
|
|
|
|
|
|
|
|
|
2022 RSU(5) |
|
|
3,523 |
|
|
|
|
220,927 |
|
|
|
|
|
|
|
|
|
|
|
|
|
2022 PSU(7) |
|
|
|
|
|
|
|
|
|
|
7,926 |
|
|
|
|
|
497,039 |
|
|
|
|
2021 RSU(8) |
|
|
1,357 |
|
|
|
|
85,097 |
|
|
|
|
|
|
|
|
|
|
|
|
|
2021 PSU(9) |
|
|
|
|
|
|
|
|
|
|
6,107 |
|
|
|
|
|
382,970 |
|
|
(1)The market value of the long-term incentive awards was determined by multiplying the number of units, subject to the award by the closing price per share of our common stock of $62.71 on December 29, 2023, the last trading day of fiscal year 2023.
(2)The RSUs vest in three equal installments on each of February 26, 2024, 2025 and 2026, subject to the NEO’s continued service with the Company through each such date. The 66,878 RSUs granted to Ms. Smith on December 18, 2023 vest
in four equal installments on each of December 17, 2024, 2025, 2026 and 2027, subject to her continued service with the Company through the vesting date. For more information about the accelerated vesting of these RSUs, see “Compensation Discussion and Analysis — Long-Term Incentives” above.
(3)Represents the number of units subject to the 2023-2025 PSU awards at target levels. The 2023-2025 PSUs are eligible to vest based on the achievement of performance goals over the three-year performance cycle ending December 31, 2025; 50% is based on achievement of cumulative adjusted EBITDA value and 50% is based on achievement of cumulative revenue through December 31, 2025, and continued employment through the date of payout, which will be no later than March 2026. Payouts may range from 0% to 200% of target based on actual cumulative adjusted EBITDA and cumulative revenue achieved over the three-year performance cycle, with a maximum modified payout of 250% based on actual rTSR performance relative to a custom industry peer benchmark for the three-year performance cycle. For more information about the accelerated vesting of these PSUs, see “Compensation Discussion and Analysis — Long-Term Incentives” above.
(4)Represents the number of units subject to the 2023-2027 PSU award at target levels. The 2023-2027 PSUs are eligible to vest based on rTSR achievement through December 17, 2027, and continued employment through the date of payout, which will be no later than March, 2028. Payout may range from 0% to 150% of target based on actual rTSR performance relative to a custom industry peer benchmark for the four-year performance cycle. For more information about the accelerated vesting of these PSUs, see “Compensation Discussion and Analysis — Long-Term Incentives” above.
(5)The RSUs vest in three equal installments on each of March 1, 2023, 2024 and 2025, subject to the NEO’s continued service with the Company through each such date. The RSUs granted to Mr. Ofilos in connection with his appointment to Chief Financial Officer on August 1, 2022 vest in three equal installments on each of July 31, 2023, 2024 and 2025, subject to his continued service with the Company through the vesting date. For more information about the accelerated vesting of these RSUs, see “Compensation Discussion and Analysis — Long-Term Incentives” above.
(6)The RSUs vest three years from the date of grant. Mr. Ofilos RSUs granted on August 1, 2022 vest on July 31, 2025. Ms. Balaguer's RSUs granted on December 19, 2022 vest on December 18, 2025. Subject to continued service with the Company through the vesting date. For more information about the accelerated vesting of these RSUs, see “Compensation Discussion and Analysis — Long-Term Incentives” above.
(7)Represents the number of units subject to the 2022-2024 PSU awards at target levels. The 2022-2024 PSUs are eligible to vest based on the achievement of performance goals over the three-year performance cycle ending December 31, 2024; 50% is based on achievement of cumulative contract award value and 50% is based on achievement of gross profit margin as sold through December 31, 2024, and continued employment through the date of payout, which will be no later than March 2025. Payouts may range from 0% to 200% of target based on actual cumulative contract award and gross profit margin as sold performance achieved over the three-year performance cycle, with a maximum modified payout of 250% based on actual rTSR performance relative to a custom industry peer benchmark for the three-year performance cycle. For more information about the accelerated vesting of these PSUs, see “Compensation Discussion and Analysis — Long-Term Incentives” above.
(8)The remaining RSUs vest on February 28, 2024. Ms. Smith's remaining RSUs granted on July 1, 2021 vest on June 30, 2024 and Ms. Balaguer's remaining RSUs granted on July 16, 2021 vest on July 15, 2024. Subject to the NEO’s continued service with the Company through each such date. For more information about the accelerated vesting of these RSUs, see “Compensation Discussion and Analysis — Long-Term Incentives” above.
(9)Represents the number of units, subject to the 2021-2023 PSU awards based on the actual performance payout of 136.04%. The performance goals for the 2021-2023 PSU awards were achieved at such level on December 31, 2023, but the awards remained subject to forfeiture subject to continued employment through the payment date of the award, which will be no later than March 2024.
Long-Term Incentive Awards that Vested in 2023
The following sets forth the number of RSUs and PSUs that vested in 2023.
|
|
|
|
|
|
|
|
|
|
|
|
|
|
|
|
|
|
|
|
|
|
LONG-TERM INCENTIVE AWARDS VESTED TABLE |
|
PSU Awards |
|
RSU Awards |
|
Named Executive
Officer |
Number of PSUs
Acquired on
Vesting (#) (1) |
Value Realized
on Vesting ($) |
|
Number of RSU
Awards Vested
(#)(2) |
Value Realized
on Vesting
($)(3) |
|
Carey A. Smith |
|
|
20,602 |
|
|
|
|
936,567 |
|
|
|
|
|
35,758 |
|
|
|
1,633,773 |
|
|
|
Matthew Ofilos |
|
|
— |
|
|
|
|
— |
|
|
|
|
|
9,685 |
|
|
|
521,967 |
|
|
|
Michael R. Kolloway |
|
|
8,955 |
|
|
|
|
407,094 |
|
|
|
|
|
8,224 |
|
|
|
370,639 |
|
|
|
Susan M. Balaguer |
|
|
— |
|
|
|
|
— |
|
|
|
|
|
3,118 |
|
|
|
143,450 |
|
|
|
(1)Represents 2020-2022 PSU awards that were earned based on performance over the 2020-2022 performance cycle but that vested based on continued employment through the date of payout in March 2023.
(2)Represents RSUs granted in 2020 that vested on March 4, 2023, RSUs granted in 2021 that vested on February 28, 2023, and RSUs granted in 2022 that vested on March 1, 2023 and were settled in shares of our common stock.
(3)Value realized on vesting calculated by multiplying the number of RSUs that vested by the closing price per share of our common stock on the date of vesting.
Nonqualified Defined Contribution and Other Nonqualified Deferred Compensation
Parsons Executive Restoration Plan (“ERP”): The ERP provides a vehicle to restore qualified plan benefits that are reduced because of limitations on compensation imposed under the Code under the ESOP and the 401(k) plan. The amount credited to a NEO under the ERP is equal to a percentage of the NEO’s eligible compensation under the ESOP based on the total percentage of compensation that we contribute to the ESOP. NEOs vest in their ERP accounts in accordance with the same vesting schedule as the ESOP. Vested ERP account balances are paid in cash in a lump sum upon a NEO’s termination of employment, or, if so elected by the NEO, upon a change in control or substantial financial hardship.
The ERP will earn an annual rate of interest on the ERP funds equal to the average of prime rates made available to preferred borrowers by Bank of America, N.T. & S.A., Los Angeles Branch (or any successor thereto) determined as of the first working day of each calendar month prior to the complete distribution of an ERP account.
|
|
|
|
|
|
|
|
|
|
|
|
|
|
|
|
|
|
|
|
|
NONQUALIFIED DEFERRED COMPENSATION TABLE |
Named Executive Officer |
Registrant
Contributions
in Last FY
($)(1) |
Aggregate
Earnings
in Last FY
($) |
Aggregate
Withdrawals/
Distributions
($) |
Aggregate
Balance
at Last
FYE
($) |
Carey A. Smith |
|
|
|
|
|
|
|
|
|
|
|
|
|
|
|
|
Executive Restoration Plan |
|
|
51,754 |
|
|
|
|
18,822 |
|
|
|
|
— |
|
|
|
|
301,544 |
|
|
Matthew Ofilos |
|
|
|
|
|
|
|
|
|
|
|
|
|
|
|
|
Executive Restoration Plan |
|
|
16,448 |
|
|
|
|
832 |
|
|
|
|
— |
|
|
|
|
27,496 |
|
|
Michael R. Kolloway |
|
|
|
|
|
|
|
|
|
|
|
|
|
|
|
|
Executive Restoration Plan |
|
|
14,753 |
|
|
|
|
8,330 |
|
|
|
|
— |
|
|
|
|
125,294 |
|
|
Susan M. Balaguer |
|
|
|
|
|
|
|
|
|
|
|
|
|
|
|
|
Executive Restoration Plan |
|
|
8,787 |
|
|
|
|
764 |
|
|
|
|
— |
|
|
|
|
18,928 |
|
|
(1)Employer contributions are reported as “All Other Compensation” for 2023 in the Summary Compensation Table above.
2023 CEO Pay Ratio
We are providing the following information regarding the relationship of the annual total compensation of our median employee to the annual total compensation of our CEO (in each case, the annual total compensation was calculated in accordance with SEC rules applicable to the Summary Compensation Table above). The pay ratio included in this information is a reasonable estimate calculated in a manner consistent with Item 402(u) of Regulation S-K.
For 2023:
•Our median employee’s annual total compensation was $105,042.
•Our CEO’s annual total compensation, as reported in the Summary Compensation Table, was $18,596,895.
•Based on this information, the ratio of the annual total compensation of our CEO to the annual total compensation of our median employee is 177 to 1.
Pay Ratio Methodology
SEC rules allow us to select a methodology for identifying our median employee in a manner that is most appropriate based on our size, organizational structure and compensation plans, policies and procedures, and allow us to identify our median employee once every three years unless there has been a change in our employee population or employee compensation arrangements that we reasonably believe would result in significant change in our pay ratio disclosure.
We selected December 31, 2023 as the date on which to determine our median employee. As of that date, we had 18,313 employees, with 10,636 employees based in the United States and 7,677 employees located outside of the United States. The pay ratio disclosure rules provide an exemption for companies to exclude non-U.S. employees from the median employee calculation if non-U.S. employees in a particular jurisdiction account for five percent (5%) or less of the Company’s total number of employees. We applied this de minimis exemption when identifying the median employee by excluding employees in 5 countries: 4 employees in Denmark, 20 employees in France, 9 employees in Germany, 2 in Hong Kong, and 15 employees in the United Kingdom.
After taking into account the de minimis exemption, 10,636 employees based in the United States and 7,627 employees located outside of the United States were considered for purposes of identifying the median employee.
For purposes of identifying the median employee from our employee population base, we considered base salary for 2023, including overtime, as compiled from our payroll records. We selected base salary as this information is readily available in each country. In addition, we measured compensation for purposes of determining the median employee using the year-to-date period ended December 31, 2023 and annualized for all regular employees who were employed on December 31, 2023 but did not work for us for all of 2023. Compensation paid in foreign currencies was converted to U.S. dollars based on exchange rates in effect on December 30, 2023.
Ms. Smith’s 2023 annual total compensation calculated herein of $18,596,895 includes her annual base salary, annual incentive plan payout, long term incentive awards, one-time equity award package, and all other compensation as reported in the ‘All Other Compensation’ table in this proxy statement.
Potential Payments upon Termination or Change in Control
Payments and benefits that would be provided to each NEO in addition to those received by all employees (such as payout of 401(k) balances and paid time off) as a result of certain termination events are set forth in the table below. The amounts shown assume a qualifying termination of employment effective as of the last day of our fiscal year ended December 31, 2023.
Corporate Vice President Severance Plan
Each NEO currently employed by the Company is an eligible employee under Parsons Corporate Vice President Severance Plan (the "Severance Plan"). The Severance Plan provides that, upon the termination of employment of an eligible employee by the Company other than for Performance (as defined in the Severance Plan) or due to death or disability (other than a termination in connection with a change in control of the Company), in addition to the payment of accrued obligations, the eligible employee will receive the following compensation and benefits: (i) a lump sum payment equal to four and a half (4.5) times the eligible employee's base monthly salary (for a regular full-time eligible employee, shall be determined by using the employee’s full, regular base salary rate on his or her termination date, and for a regular part-time eligible employee, shall be determined by using the employee’s average monthly regular base salary rate over the 12-month period immediately preceding his or her termination date); and (ii) the Company shall pay , on behalf of the eligible employee, four (4) months of COBRA premiums for medical, dental and vision care coverage. The receipt of the foregoing severance payments and benefits will be subject to the eligible employee's execution of a separation and release agreement that contains customary restrictive covenants, including obligations with respect to non-compete, non-solicitation and confidentiality.
Change in Control Agreements
The NEOs are eligible to receive certain severance payments and benefits in connection with various circumstances in connection with a change in control of the Company. The potential severance payments and benefits payable to the NEOs in the event of termination of employment in place as of fiscal year end are described below and were determined pursuant to the terms of their individual change in control and severance agreements, as applicable.
The CIC Agreements provide severance protections to the NEOs in the event of a resignation by the executive for “Good Reason” or a termination by Parsons without “Cause” (as each such term is defined below) within eighteen months following a change in control or if any successor company fails to assume the CIC Agreement or repudiates or breaches any provision of the CIC Agreement within such eighteen month period (any such event, a “Qualifying Event”).
Under the CIC Agreements, if a Qualifying Event occurs, the executive is eligible to receive the following severance payments and benefits, subject to his or her written notice to the Company of such Qualifying Event, his or her execution of an effective release of claims in favor of the Company and continued compliance with his or her restrictive covenants. Such payments are payable in a lump sum no later than two and a half months following the Qualifying Event, subject to any delays imposed by Section 409A of the Code:
•a pro rata portion (based on number of days that elapsed in the calendar year before the Qualifying Event occurred) of the greater of (1) the executive’s target annual bonus for the year of the Qualifying Event or (2) the executive’s annual bonus that would have been paid
(as determined by the Board of Directors in its discretion) assuming the year ended on the date of the Qualifying Event and based on actual performance through that date;
•an amount equal to the highest rate of the executive’s annualized base salary in effect at any time up to and including the Qualifying Event multiplied by two, or for the Executive Chairman by three;
•an amount equal to the greater of (1) the executive’s target annual bonus for the year of the Qualifying Event or (2) the average of the annual bonuses actually paid to the executive for the two years preceding the year of the Qualifying Event, multiplied by two, or for the Executive Chairman multiplied by three; and
•a non-discounted cash lump sum amount equal to the sum of the following: (1) the Company’s estimate of the costs for the executive’s medical insurance coverage at the level and a cost to the executive comparable to that provided to the executive immediately prior to the Qualifying Event for a period of two years, or three years for the Executive Chairman, following such Qualifying Event (which, in the Company’s discretion, may be based on the applicable COBRA rates); (2) the Company’s estimate of the costs for the continuation of that level of the executive’s life insurance coverage that is in effect immediately prior to the Qualifying Event, for a period of two years, or three years for the Executive Chairman, following such Qualifying Event, or, if shorter, the period ending on the last day of the level premium rate guarantee period established by the applicable insurer for such coverage; and (3) the Company’s estimate of the cost for the continuation of the executive’s executive supplemental disability coverage under the Company’s supplemental disability insurance plan in effect immediately prior to the Qualifying Event for a period of two years, or three years for the Executive Chairman, following such Qualifying Event (or the date the executive attains age 65, if earlier), but the cash payment in this clause (3) will only be paid if the terms of the applicable insurance policy under such disability insurance plan provide that the coverage may be continued following the Qualifying Event and such costs to be estimated using the extent of the coverage allowed under the terms such policy at a cost to the Company that is no greater than the cost borne by the Company immediately prior to the Qualifying Event.
For purposes of the CIC Agreements, a “change in control” has the same definition as is given to such term in our 2019 Incentive Award Plan.
For purposes of the CIC Agreements, (1) “Cause” means the executive’s (a) commission of fraud or embezzlement in connection with Parsons; (b) conviction of, or pleading guilty or nolo contendere to, a felony involving fraud, dishonesty or moral turpitude; or (c) willful and continued failure to substantially perform material duties which is not remedied in a reasonable period of time after written demand for substantial performances is delivered by the Board; or d) material violation of the Company’s Code of Conduct and (2) “Good Reason” means, without the Executive’s express written consent, the occurrence of any one or more of the following, unless the action or failure giving rise to such occurrence is withdrawn, reversed or cured by the Company within thirty (30) days of the date of such event’s occurrence: (a) material reduction in the nature or status of the Executive’s authorities, duties, and/or responsibilities (when such authorities, duties, and/or responsibilities are viewed in the aggregate) from their level in effect on the day immediately prior to the start of the Protected Period; (b) a reduction by the Company of the Executive’s Base Salary as in effect on the day immediately prior to the start of the Protected Period; (c) material reduction by the Company of the Executive’s aggregate welfare benefits and/or the value of the incentive programs provided under the Company’s management incentive and/or
other short and/or long-term incentive programs, as such benefits and opportunities exist on the day immediately prior to the start of the Protected Period.; (d) relocation of the Executive’s principal office by the Company more than fifty (50) miles from the location of the Executive’s principal office immediately prior to the start of the Protected Period; (e) any purported termination of the executive without satisfying the notice requirements in the CIC Agreement; and (f) Parsons’ failure to obtain agreement from any successor entity to assume and perform its obligations under the CIC Agreement.
The CIC Agreements provide that in the event that any payments would subject the NEO to the excise taxes applicable under Section 4999 of the Code by reason of being a parachute payment under Section 280G of the Code, then if it would cause a better net-after tax result, the amount of such payments will be reduced so that no excise tax would apply.
Additionally, our long-term incentive awards are eligible for accelerated vesting under certain circumstances. For a discussion of the accelerated vested terms of these awards, please see “Compensation Discussion and Analysis – Long-Term Incentive Awards” above.
Potential Payments upon Termination or Change in Control Table
The following table sets forth the estimated payments that would be received by the NEOs in four different scenarios – (1) a termination of employment without cause or following a resignation for good reason (involuntary termination) apart from a change in control, (2) a NEO’s retirement, (3) a NEO’s death or disability, and (4) an involuntary termination in connection with a change in control in the circumstances contemplated by the CIC Agreements described above. The table below reflects amounts payable to the NEOs assuming their employment was terminated on December 31, 2023 and, if applicable, a change in control of our Company also occurred on that date, and therefore includes only long-term incentive awards outstanding on that date. For purposes of estimating the value of accelerated long-term incentive awards to be received in the event of a termination of employment or change in control, we have assumed a price per share of our common stock of $62.71, which represents the closing market price of our common stock as reported on the NYSE on December 29, 2023. Each of the NEOs are participants in the deferred compensation plans described above under “—Nonqualified Defined Contribution and Other Nonqualified Deferred Compensation” and the ESOP. For more information about payments payable to the NEOs under these deferred compensation plans or the ESOP upon a termination of employment or a change in control, please see “—Nonqualified Defined
Contribution and Other Nonqualified Deferred Compensation” above and “—Employee Stock Ownership Plan” below.
|
|
|
|
|
|
|
|
|
|
|
|
|
|
|
|
|
|
|
|
|
Name |
Involuntary
Termination
without a
Change in
Control
($) |
Retirement
($)(1) |
Death or
Disability
($)(2) |
Involuntary
Termination in
Connection
with
Change in
Control ($) |
Carey A. Smith |
|
|
|
|
|
|
|
|
|
|
|
|
|
|
|
|
AIP Payout (3) |
|
|
2,290,200 |
|
|
|
|
2,290,200 |
|
|
|
|
2,290,200 |
|
|
|
|
2,290,200 |
|
|
Cash Severance (4) |
|
|
375,000 |
|
|
|
|
— |
|
|
|
|
— |
|
|
|
|
4,500,000 |
|
|
Benefits (5) |
|
|
9,954 |
|
|
|
|
— |
|
|
|
|
— |
|
|
|
|
59,723 |
|
|
Long-Term Incentive Award Acceleration |
|
|
— |
|
|
|
|
14,568,014 |
|
|
|
|
11,065,003 |
|
|
|
|
29,657,566 |
|
|
Matthew Ofilos |
|
|
|
|
|
|
|
|
|
|
|
|
|
|
|
|
AIP Payout (3) |
|
|
846,300 |
|
|
|
|
846,300 |
|
|
|
|
846,300 |
|
|
|
|
846,300 |
|
|
Cash Severance (4) |
|
|
203,766 |
|
|
|
|
— |
|
|
|
|
— |
|
|
|
|
2,010,488 |
|
|
Benefits (5) |
|
|
3,122 |
|
|
|
|
— |
|
|
|
|
— |
|
|
|
|
18,732 |
|
|
Long-Term Incentive Award Acceleration |
|
|
802,688 |
|
|
|
|
1,954,294 |
|
|
|
|
1,575,178 |
|
|
|
|
3,684,275 |
|
|
Michael R. Kolloway |
|
|
|
|
|
|
|
|
|
|
|
|
|
|
|
|
AIP Payout (3) |
|
|
711,400 |
|
|
|
|
711,400 |
|
|
|
|
711,400 |
|
|
|
|
711,400 |
|
|
Cash Severance (4) |
|
|
194,119 |
|
|
|
|
— |
|
|
|
|
— |
|
|
|
|
1,811,775 |
|
|
Benefits (5) |
|
|
15,495 |
|
|
|
|
— |
|
|
|
|
— |
|
|
|
|
92,967 |
|
|
Long-Term Incentive Award Acceleration |
|
|
— |
|
|
|
|
2,809,659 |
|
|
|
|
2,149,406 |
|
|
|
|
3,659,442 |
|
|
Susan M. Balaguer |
|
|
|
|
|
|
|
|
|
|
|
|
|
|
|
|
AIP Payout (3) |
|
|
616,900 |
|
|
|
|
616,900 |
|
|
|
|
616,900 |
|
|
|
|
616,900 |
|
|
Cash Severance (4) |
|
|
168,328 |
|
|
|
|
— |
|
|
|
|
— |
|
|
|
|
1,571,063 |
|
|
Benefits (5) |
|
|
670 |
|
|
|
|
— |
|
|
|
|
— |
|
|
|
|
4,020 |
|
|
Long-Term Incentive Award Acceleration |
|
|
— |
|
|
|
|
2,074,760 |
|
|
|
|
1,288,741 |
|
|
|
|
2,490,653 |
|
|
(1)Upon a NEO’s retirement, each NEO will remain eligible to vest in a prorated portion of all outstanding PSU awards for uncompleted performance cycles based on actual performance for the performance cycle. We have also assumed performance at “target” levels for the relevant performance cycle for outstanding PSU awards for purposes of calculating the amount set forth in this column. For purposes of this column, the value of the PSU awards that relate to the three-year performance cycle that ended on December 31, 2023 are reflected at “target” levels.
(2)Upon a NEO’s death or disability, each NEO will vest in (a) vest in a prorated portion of all outstanding RSU awards scheduled to vest on the next occurring annual vesting date based on the portion of the twelve-month period preceding such annual vesting date that has elapsed through the date of termination, and (b) remain eligible to vest in a prorated portion of all outstanding PSU awards for uncompleted performance cycles based on actual performance for the performance cycle. We have also assumed performance at “target” levels for the relevant performance cycle for outstanding PSU awards for purposes of calculating the amount set forth in this column. For purposes of this column, the value of the PSU awards that relate to the three-year performance cycle that ended on December 31, 2023 are reflected at “target” levels.
(3)Under our AIP, in the event an NEO’s employment is terminated other than for poor performance or misconduct, or as result of his or her retirement, death or disability, and other than as a result of a change in control, on December 31, he or she will be eligible to receive his or her annual incentive bonus for the applicable year, payable when annual bonuses are paid to employees generally. Amounts for Mr. Harrington and Mr. Ball their prorated bonuses payable under our AIP as of December 31, 2023, but we have reflected the amounts that would have been paid upon retirement for all NEOs on December 31, 2023 had they been so eligible. Upon involuntary termination in connection with a change in control, the NEO’s annual bonus for 2023 (the full amount of which has been included in respect of the pro-rated target bonus component given the termination is assumed to have occurred on December 31, 2023 for purposes of this table) would be payable.
(4)Represents the sum of (a) the NEO’s base salary plus the NEO’s target annual bonus for 2023 multiplied by (i) two for the NEOs. Each NEO’s target annual bonus for 2023 was used for purposes of the severance calculations related to his or her bonus amounts for purposes of this table. These amounts are payable in a lump sum.
(5)Represents the amount payable to the NEO under the CIC Agreements in respect of continued medical, life and supplemental disability coverage for (a) two years for the NEOs. This amount is payable in a lump sum and subject to the conditions set forth in the CIC Agreements, as described above.
Employee Stock Ownership Plan
Our employees participate in the ESOP, which is a defined contribution stock bonus retirement plan designed to enable eligible employees to obtain an ownership interest in Parsons. The ESOP is funded by contributions made by us which are held in a trust established as part of the ESOP. The contributions are invested in our common stock. Contributions and any earnings or dividends thereon, to the extent such amounts remain in the ESOP, accumulate on a tax deferred basis.
We may make discretionary contributions to the ESOP each year in an amount to be determined by our Board and may be made in cash or in shares of our common stock. We made contributions of 915,113 shares in fiscal 2023, 1,188,129 shares in fiscal 2022, and 1,631,477 shares in fiscal 2021 of our common stock, net of forfeitures. In fiscal 2023, 2022, and 2021, we made annual contributions to the ESOP in shares of our common stock in the amount of 8% of the participants’ covered cash compensation for the applicable year (net of shares forfeited by participants in the applicable year). The annual contributions to the ESOP are allocated to participants’ accounts each year to participants who were eligible employees during the year, and the allocations are made on a basis proportional to compensation. Covered compensation for an eligible employee under the ESOP generally includes base pay, overtime pay, assignment premiums included in base pay and most pre-tax deductions. Bonuses, relocation expenses and most other reimbursements are generally excluded from covered compensation. Prior to 2020, participants vested in their ESOP accounts over a period of six years. Effective January 1, 2020, the vesting schedule was amended to provide for three-year ratable vesting of ESOP accounts for actively employed participants.
The value of vested account balances, subject to eligibility, vesting and distribution rules, are distributed to participants, generally only after their retirement from Parsons after attaining age 65 (or 62 if fully vested). Distributions will generally be in a series of installment payments over a number of years. Based on ESOP participants’ account balances and installment options, we expect distributions in the aggregate will generally be made ratably over three years. The number of installments is based on participant account balances at the time of distribution. In December 2020, the Board of Directors approved an amendment to the Employee Stock Ownership Plan to provide greater diversification rights to participants. The amendment provides that, with respect to all diversifications elected or processed after January 1, 2021, the definition of a qualified participant shall mean a participant who has attained the age of 50 and who has completed at least 3 years of participation in the Plan and other criteria. Each qualified participant shall generally be permitted to direct the Plan as to the diversification of 50% of the value of the eligible portion of the participant’s ESOP account. In January 2021, the Board of Directors approved an amendment to the ESOP effective March 1, 2021 whereby distributions to participants in the ESOP were modified as follows: (1) the threshold amount of an ESOP participant’s balance to be eligible for a single lump sum distribution was increased from less than $20,000 to less than $500,000; (2) the threshold balance for a participant to be eligible to receive payment in two installments was increased from less than $40,000 to less than $750,000; and (3) the threshold balance for participants to receive payment in three or five annual installments was increased to $750,000 or more. In April 2022, the board of directors approved an amendment providing for lump sum distributions to participants and removing the annual installments. Annual diversification elections and five-year vest termination distributions are not impacted by this amendment and will still occur annually over installments as outlined in the Plan.
The changes were made to facilitate greater flexibility for eligible participants to receive their balances expeditiously and to accelerate the increase in publicly traded float for our common stock. Participants who have already commenced receiving distributions from the ESOP will have the option of opting out of the new thresholds and maintaining their previously elected distributions. Participants distributions prior to termination of employment or reaching retirement age (65 or 62 if fully vested) are generally not permitted, unless the participant dies. Distributions to beneficiaries of deceased participants, and participants who receive conflict of interest distributions following termination of employment, are also paid in a lump sum.
With respect to cash dividends, if the Board declares and pays a cash dividend on shares of our common stock held in the ESOP and allocated to participant accounts, then, at the election of each participant, this dividend may either be paid currently to the participant either directly by us or through the ESOP or reinvested in our common stock and held in such participant’s account in the ESOP. Any such cash dividends to be paid currently to participants will be paid in cash. Dividends on shares of unallocated stock will not be distributed to the participant currently but will either be applied to pay off any ESOP loans or held in the ESOP. The ESOP currently does not have any ESOP loans.
As of January 2, 2022, participants who have attained age 50 and who have completed at least 3 years of participation in the ESOP are permitted to diversify a portion of their respective ESOP accounts over a period of 11 years. For each of the 11 plan years that a participant is allowed to diversify his or her accounts, the participant is permitted to diversify up to 50% of the value (as of the last day of the preceding plan year) of their vested diversification eligible ESOP account. This diversification election applies only to shares acquired by the ESOP after 1987, or the Diversification Eligible Shares. Shares acquired by the ESOP prior to 1987 are not eligible for this diversification election. In January 2021, the Board approved an amendment to the ESOP which, for diversifications processed after January 1, 2021, will permit qualified participants to generally be permitted to direct the ESOP as to diversification of 50% of the value of the vested portion of the Participant’s ESOP account. The definition of such a qualified Participant shall mean a Participant who has attained the age of 50 and who has completed at least 3 years of participation in the ESOP and other criteria.
ESOP distributions will be made in the form of shares of our common stock (other than distributions in respect of fractional shares, which will be made in cash) and will be available for sale into the public market, subject to compliance with applicable federal securities laws.
Pay Versus Performance Table
The following table sets forth additional compensation information of our Chief Executive Officer (CEO) and our other NEOs along with our total shareholder return, the total shareholder return of the peer group identified below, our net income, and revenue, our company selected measure, for our fiscal years ending in 2020, 2021, 2022 and 2023:
|
|
|
|
|
|
|
|
|
|
|
|
|
|
|
|
|
|
|
|
|
|
|
|
|
|
|
|
|
|
|
|
|
|
|
|
|
|
|
|
|
|
|
|
|
|
|
|
|
|
|
|
|
|
Value of Initial Fixed $100 Investment Based On: |
|
(in thousands) |
Year
(1) |
Summary
Compensation
Table Total for
CEO#1 |
Compensation
Actually Paid
to CEO#1
(2)(3) |
Summary
Compensation
Table Total
for CEO#2 |
Compensation
Actually Paid
to CEO#2
(2)(3) |
Average
Summary
Compensation
Table Total for
Other NEOs |
Average
Compensation
Actually Paid
to Other NEOs
(2)(3) |
Total
Shareholder
Return (8) |
Peer Group
Total
Shareholder
Return (8) |
Net
income |
Revenue |
2023 |
|
|
18,596,895 |
|
|
25,548,246 (4) |
|
|
|
|
|
|
|
2,160,582 |
|
|
3,296,957 (4) |
|
|
151.91 |
|
|
|
165.65 |
|
|
|
|
161,149 |
|
|
|
5,442,749 |
|
|
2022 |
|
|
6,973,806 |
|
|
10,626,325 (5) |
|
|
|
|
|
|
|
1,945,846 |
|
|
3,331,189 (5) |
|
|
112.04 |
|
|
|
142.59 |
|
|
|
|
96,664 |
|
|
|
4,195,272 |
|
|
2021 |
|
|
5,348,118 |
|
|
4,077,659 (6) |
|
|
7,119,599 |
|
|
3,822,001 (6) |
|
|
1,498,734 |
|
|
864,158 (6) |
|
|
81.52 |
|
|
|
139.03 |
|
|
|
|
64,072 |
|
|
|
3,660,771 |
|
|
2020 |
|
|
|
|
|
|
|
8,231,959 |
|
|
2,601,283 (7) |
|
|
2,507,932 |
|
|
1,676,265 (7) |
|
|
88.20 |
|
|
|
115.30 |
|
|
|
|
98,541 |
|
|
|
3,918,946 |
|
|
(1)NEOs included in the above compensation columns reflect the following:
|
|
|
|
Year |
CEO#1 |
CEO#2 |
Other NEOs |
2023 |
Carey A. Smith |
|
Susan M. Balaguer, Michael R. Kolloway and Matthew Ofilos |
2022 |
Carey A. Smith |
|
Susan M. Balaguer, George L. Ball, Charles L. Harrington, Michael R. Kolloway and Matthew Ofilos |
2021 |
Carey A. Smith |
Charles L. Harrington |
George L. Ball, Debra A. Fiori and Michael R. Kolloway |
2020 |
|
Charles L. Harrington |
George L. Ball, Debra A. Fiori, Michael R. Kolloway and Carey A. Smith |
(2)Fair value or change in fair value, as applicable, of equity awards in the Compensation "Actually Paid" columns was determined by reference to (1) for RSU awards (excluding Total Shareholder Return “TSR” awards and other performance-based awards), closing price on applicable year-end date(s) or, in the case of vesting dates, the actual vesting price, (2) for performance-based RSU awards (excluding TSR Awards), the same valuation methodology as RSU awards above except year-end values are multiplied times the probability of achievement as of each such date (3) for TSR-based awards, the fair value calculated by a Monte Carlo simulation model as of the applicable valuation date(s).
(3)For the portion of “Actually Paid” compensation that is based on year-end stock prices, the following prices were used: December 31, 2023 $62.71 (35.6 % increase from prior year), December 31, 2022 $46.25 (37.4% increase from prior year), December 31, 2021 $33.65 (7.58% reduction from prior year), December 31, 2020 $36.41 (11.8% reduction from prior year).
(4)2023 Compensation "Actually Paid" to CEO#1 of $25,548,246 and the average Compensation "Actually Paid" to other NEOs reflects the following adjustments from total compensation reported in the Summary Compensation Table:
|
|
|
|
|
|
CEO#1 |
Average
Other NEOs |
Total Reported in 2023 Summary Compensation Table (SCT) |
18,596,895 |
|
2,160,582 |
|
Less, value of Stock Awards reported in SCT |
(15,215,909) |
|
(872,752) |
|
Plus, Year-End value of Awards Granted in Fiscal Year that are Unvested and Outstanding |
17,670,848 |
|
1,255,989 |
|
Plus, Change in Fair Value of Prior Year awards that are Outstanding and Unvested |
4,516,447 |
|
731,953 |
|
Plus, FMV of Awards Granted this Year and that Vested this Year |
— |
|
— |
|
Plus, Change in Fair Value (from prior year-end) of Prior Year awards that Vested this year |
(20,035) |
|
21,186 |
|
Less Prior Year Fair Value of Prior Year awards that Failed to vest this year |
— |
|
— |
|
Total Adjustments |
6,951,351 |
|
1,136,375 |
|
Compensation "Actually Paid" for Fiscal Year 2023 |
25,548,246 |
|
3,296,957 |
|
(5)2022 Compensation “Actually Paid” to CEO#1 of $10,067,617 was updated to $10,626,325 and the average Compensation “Actually Paid” to other NEOs of $3,272,287 was updated to $3,331,189 due to a correction of "Change in Fair Value of Prior Year awards that are Outstanding and Unvested". Below reflects the corrections and adjustments from total compensation reported in the Summary Compensation Table:
|
|
|
|
|
|
CEO#1 |
Average
Other NEOs |
Total Reported in 2022 Summary Compensation Table (SCT) |
6,973,806 |
|
1,945,846 |
|
Less, value of Stock Awards reported in SCT |
(4,730,700) |
|
(990,085) |
|
Plus, Year-End value of Awards Granted in Fiscal Year that are Unvested and Outstanding |
6,577,029 |
|
1,239,181 |
|
Plus, Change in Fair Value of Prior Year awards that are Outstanding and Unvested |
1,736,210 |
|
570,784 |
|
Plus, FMV of Awards Granted this Year and that Vested this Year |
— |
|
326,744 |
|
Plus, Change in Fair Value (from prior year-end) of Prior Year awards that Vested this year |
69,980 |
|
238,720 |
|
Less Prior Year Fair Value of Prior Year awards that Failed to vest this year |
— |
|
— |
|
Total Adjustments |
3,652,519 |
|
1,385,343 |
|
Compensation "Actually Paid" for Fiscal Year 2022 |
10,626,325 |
|
3,331,189 |
|
(6)2021 Compensation “Actually Paid” to CEO#1 of $3,971,476 was updated to $4,077,659, CEO#2 of $3,692,318 was updated to $3,822,001 and the average Compensation “Actually Paid” to other NEOs of $851,546 to $864,158 due to a correction of "Change in Fair Value of Prior Year awards that are Outstanding and Unvested". Below reflects the corrections and adjustments from total compensation reported in the Summary Compensation Table:
|
|
|
|
|
|
|
|
CEO#1 |
CEO#2 |
Average
Other NEOs |
Total Reported in 2021 Summary Compensation Table (SCT) |
5,348,118 |
|
7,119,599 |
|
1,498,734 |
|
Less, value of Stock Awards reported in SCT |
(3,895,113) |
|
(5,382,006) |
|
(829,496) |
|
Plus, Year-End value of Awards Granted in Fiscal Year that are Unvested and Outstanding |
3,339,277 |
|
4,853,848 |
|
748,094 |
|
Plus, Change in Fair Value of Prior Year awards that are Outstanding and Unvested |
(618,697) |
|
(2,264,902) |
|
(215,544) |
|
Plus, FMV of Awards Granted this Year and that Vested this Year |
— |
|
— |
|
— |
|
Plus, Change in Fair Value (from prior year-end) of Prior Year awards that Vested this year |
(95,926) |
|
(504,539) |
|
(337,629) |
|
Less Prior Year Fair Value of Prior Year awards that Failed to vest this year |
— |
|
— |
|
— |
|
Total Adjustments |
(1,270,459) |
|
(3,297,598) |
|
(634,576) |
|
Compensation "Actually Paid" for Fiscal Year 2021 |
4,077,659 |
|
3,822,001 |
|
864,158 |
|
(7)2020 Compensation “Actually Paid” to CEO#2 of $2,601,283 and the average Compensation “Actually Paid” to other NEOs reflects the following adjustments from total compensation reported in the Summary Compensation Table:
|
|
|
|
|
|
|
|
CEO#2 |
Average
Other NEOs |
Total Reported in 2020 Summary Compensation Table (SCT) |
|
8,231,959 |
|
2,507,932 |
|
Less, value of Stock Awards reported in SCT |
|
(4,974,490) |
|
(1,221,932) |
|
Plus, Year-End value of Awards Granted in Fiscal Year that are Unvested and Outstanding |
|
4,626,904 |
|
1,104,283 |
|
Plus, Change in Fair Value of Prior Year awards that are Outstanding and Unvested |
|
(4,069,659) |
|
(569,652) |
|
Plus, FMV of Awards Granted this Year and that Vested this Year |
|
— |
|
— |
|
Plus, Change in Fair Value (from prior year-end) of Prior Year awards that Vested this year |
|
(1,213,431) |
|
(144,365) |
|
Less Prior Year Fair Value of Prior Year awards that Failed to vest this year |
|
— |
|
— |
|
Total Adjustments |
|
(5,630,676) |
|
(831,667) |
|
Compensation "Actually Paid" for Fiscal Year 2020 |
|
2,601,283 |
|
1,676,265 |
|
(8)Company and peer group TSR reflects the Company’s Compensation Peer Group as approved in each year and reflected in the Compensation Discussion & Analysis of each of our 2021, 2022, 2023, and 2024 Annual Proxy Statements, respectively. The TSR for each year reflects what the cumulative value of $100 would be, including reinvestment of dividends, if such amount were invested into the peer group for that applicable year on December 31, 2019.
The only changes to the peer group in 2023 relative to 2022 was the removal of Maxar Technologies Inc and ManTech International Corporation as a result of their acquisitions. In 2022, the only change to the peer group relative to 2021 was the removal of Cubic Corporation as a result of its acquisition. 3-year TSR for the peer group approved in 2021, assuming a $100 initial investment on 12/31/2019, would have been $141.75. Changes to the peer group made in 2021 relative to the 2020 peer group were the removals of FLIR Systems and Perspecta as a result of their acquisitions and the addition of Maxar in light of its business relevance and size. 2-year TSR for the peer group approved in 2020, assuming a $100 initial investment on 12/31/2019, would have been $135.62.
Performance Measures
The following performance measures reflect the Company’s most important performance measures in effect for 2023, as further described and defined in the Compensation Discussion and Analysis under How We Performed in Fiscal 2023, Annual Cash Incentives and Long-Term Incentives.
Revenue: Revenue as reported in financial statements, which excludes equity in earnings from unconsolidated joint ventures and bad debt expense.
|
Adjusted EBITDA: Earnings attributable to Parsons Corporation, adjusted to include earnings attributable to noncontrolling interests and to exclude interest expense (net of interest income), provision for income taxes, depreciation and amortization and certain other items that are not considered in the evaluation of ongoing operating performance. These other items include earnings attributable to noncontrolling interests, asset impairment charges, income and expense recognized on litigation matters, expenses incurred in connection with acquisitions and other non-recurring transaction costs and expenses related to restructuring. |
Awards: Awards booked into backlog generally represent the amount of revenue, excluding equity in earnings, expected to be earned in the future from funded and unfunded contract awards received during the period. Contract awards include both new and re-compete contracts and task orders. |
Cash Flow: Represents cash flow from operating activities as presented in the financial statements. |
Diversity: Global Gender and US Race/Ethnic representation. |
Relationship Between Compensation “Actually Paid” and Performance Measures
The table below reflects the relationship between the Compensation "Actually Paid" for each individual serving as CEO and the average of other NEOs and the performance measures shown in the pay versus performance table from 2020 to 2023:
We believe the Compensation “Actually Paid” in each of the years reported above and over the four-year cumulative period are reflective of the Compensation Committee’s emphasis on “pay-for-performance” as the Compensation “Actually Paid” fluctuated year-over-year and in relation to Summary Compensation Table pay, primarily as a result of our stock performance and our varying levels of achievement against pre-established performance goals under our Annual Program and our LTI Program, including our Revenue.
Relationship Between Compensation “Actually Paid” to our CEO and the Average of the Compensation “Actually Paid” to the Other NEOs and the Company’s Cumulative TSR.
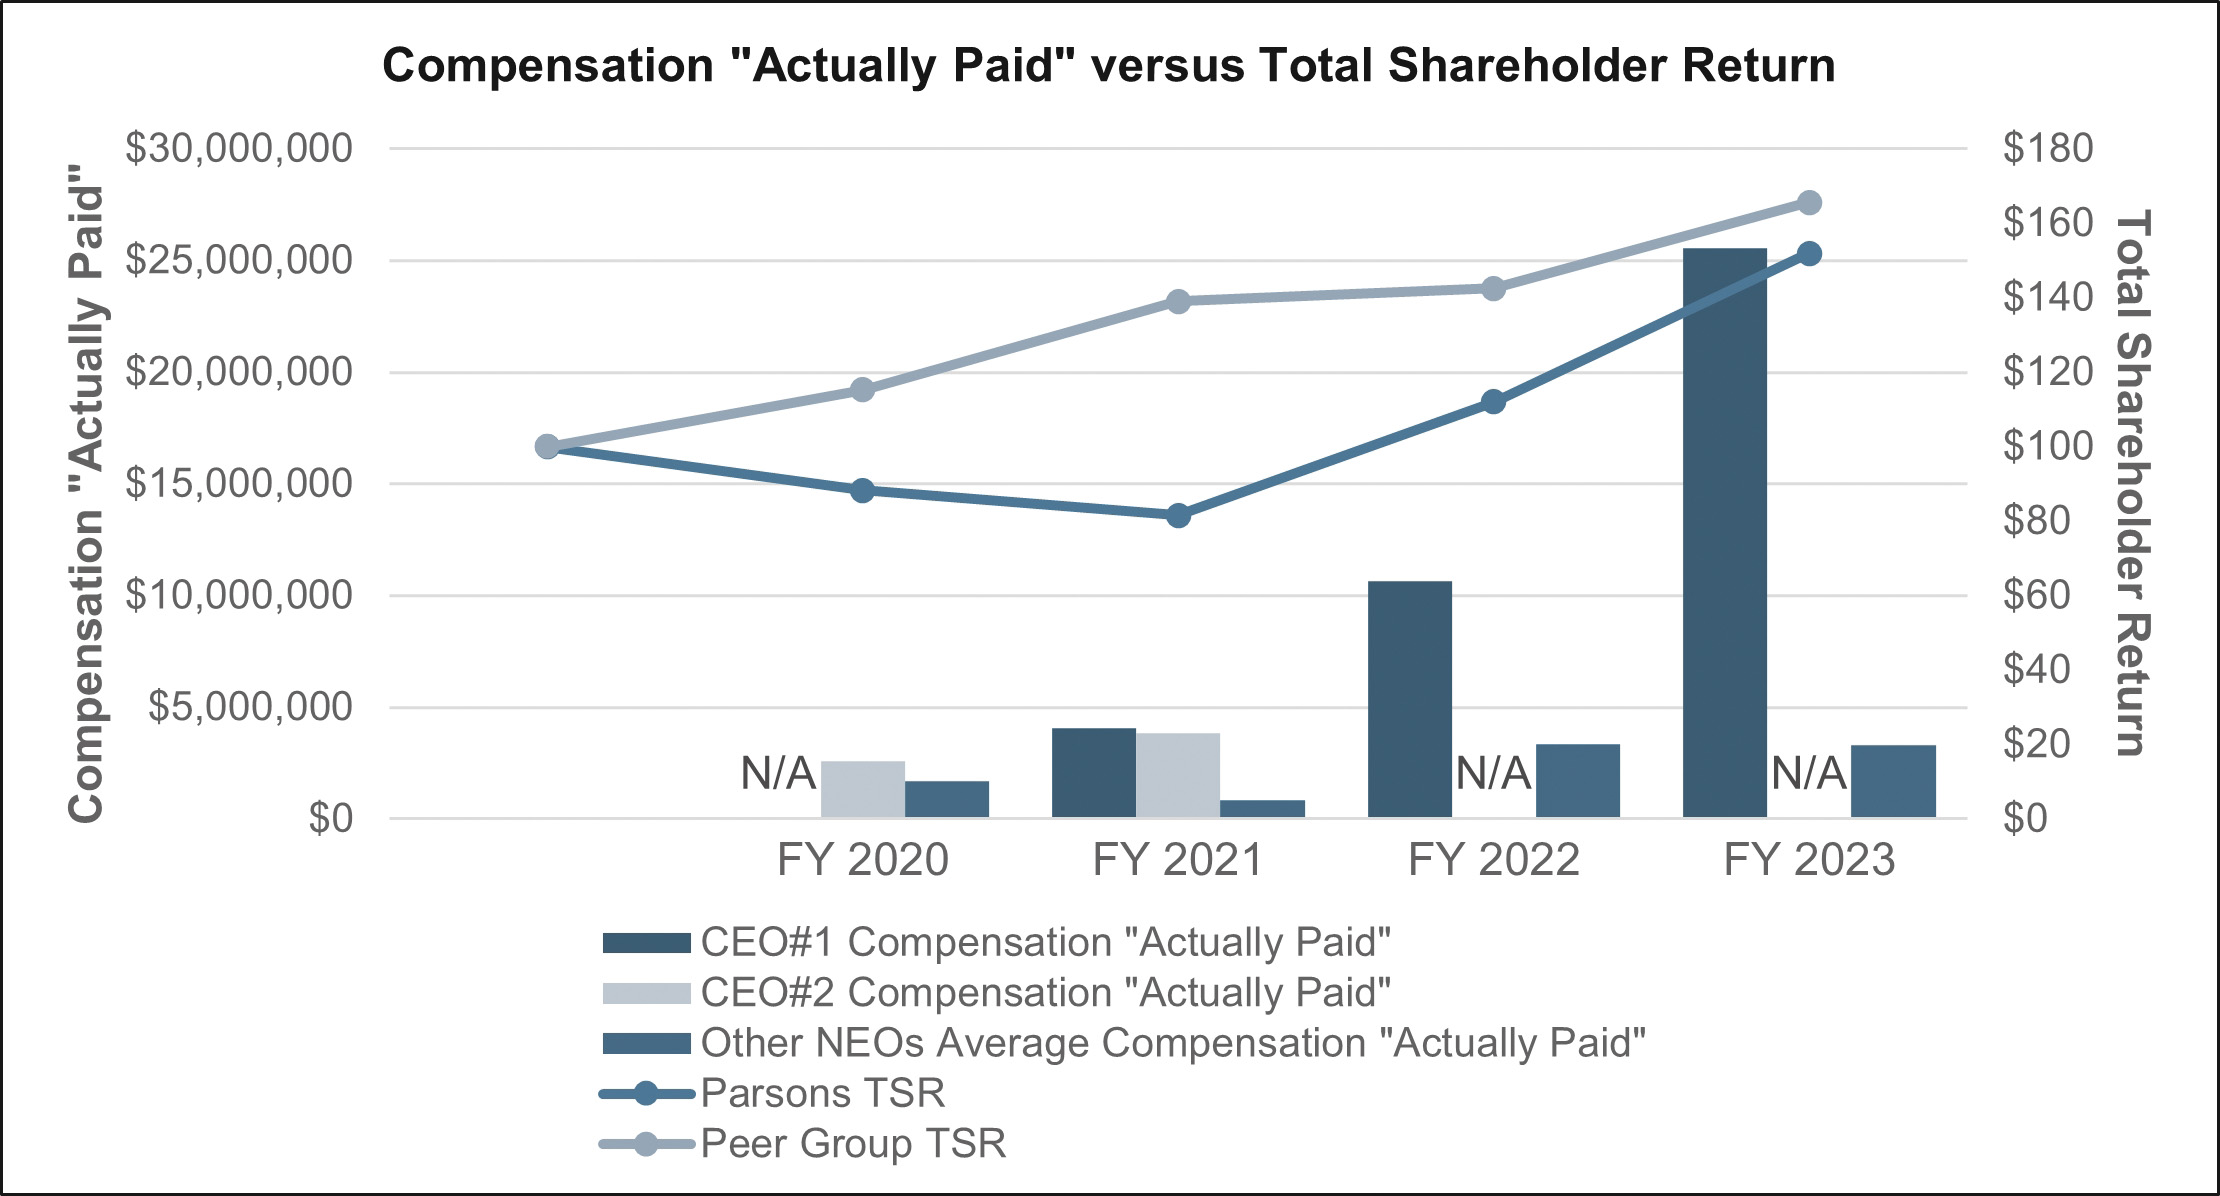
For 2020 and 2021, the Compensation “Actually Paid” to CEO #2 (Mr. Harrington) was 68% and 46% lower than Summary Compensation Table pay, while our TSR in each year was -12% and -8%. The average of the Compensation “Actually Paid” to the Other NEOs in 2020 and 2021 was 33% and 42% lower than the average Summary Compensation Table value. For 2022 and 2023, the Compensation “Actually Paid” to CEO #1 (Ms. Smith) increased by 52% and 37% relative to Summary Compensation Table pay, while our TSR in each year was +37% and +36%. Average Compensation “Actually Paid” to our NEOs was 71% and 53% higher than the average Summary Compensation Table value in 2022 and 2023.
Relationship Between Compensation “Actually Paid” to our CEO and the Average of the Compensation “Actually Paid” to the Other NEOs and the Company’s Net Income. For 2020 and 2021, the Compensation “Actually Paid” to CEO #2 (Mr. Harrington) was 68% and 46% lower than Summary Compensation Table pay, while our net income growth in each year was -18% and -35%. The average of the Compensation “Actually Paid” to the Other NEOs in 2020 and 2021 was 33% and 42% lower than the average Summary Compensation Table value. For 2022 and 2023, our Compensation “Actually Paid” to CEO #1 (Ms. Smith) increased by 52% and 37% relative to Summary Compensation Table pay, alongside an increase in net income of 51% and 67%. Average Compensation “Actually Paid” to our NEOs was 71% and 53% higher than the average Summary Compensation Table value in 2022 and 2023.
Relationship Between Compensation “Actually Paid” to our CEO and the Average of the Compensation “Actually Paid” to the Other NEOs and the Company’s Revenue. For 2020 and 2021, the Compensation “Actually Paid” to CEO #2 (Mr. Harrington) was 68% and 46% lower than Summary Compensation Table pay, while our revenue growth in each year was -1% and -7%. The average of the Compensation “Actually Paid” to the Other NEOs in 2020 and 2021 was 33% and 42% lower than the average Summary Compensation Table value. For 2022 and 2023, our Compensation “Actually Paid” to CEO #1 (Ms. Smith) increased by 52% and 37% relative to Summary Compensation Table pay, alongside an increase in revenue of 15% and 30%. Average Compensation “Actually Paid” to our NEOs was 71% and 53% higher than the average Summary Compensation Table value in 2022 and 2023.
As a result, our Compensation “Actually Paid”, measured relative to Summary Compensation Table figures, has been directionally aligned with our performance over the timeframe that the table covers.
DIRECTOR COMPENSATION
Our Directors who are also our employees will not receive any additional compensation for their service on our Board, but we believe that attracting and retaining qualified non-employee Directors is critical to our future growth and governance.
The Compensation and Management Development Committee reviews non-employee Director compensation biennially. In July 2022, the Compensation and Management Development Committee reviewed non-employee Director pay practices of our peer group. For information on our peer group, see Assessing Compensation Competitiveness in the Compensation Discussion and Analysis. No changes were made following the July 2022 review for 2023.
Cash Compensation. Effective for 2023, our non-employee Directors were eligible to receive the following cash compensation:
|
|
|
|
|
Component |
|
Annual Amount |
|
Annual Board Retainer |
|
$ |
100,000 |
|
Annual Lead Independent Director Additional Retainer |
|
$ |
35,000 |
|
Audit and Risk Committee Chair Additional Retainer |
|
$ |
20,000 |
|
Audit and Risk Committee Member Additional Retainer |
|
$ |
11,500 |
|
Compensation and Management Development Committee Chair Additional Retainer |
|
$ |
18,000 |
|
Compensation and Management Development Committee Member Additional Retainer |
|
$ |
8,000 |
|
Corporate Governance and Responsibility Committee Chair Additional Retainer |
|
$ |
15,000 |
|
Corporate Governance and Responsibility Committee Member Additional Retainer |
|
$ |
8,000 |
|
Non-employee Directors are able to elect to receive all or a portion of their cash retainers in the form of fully vested shares of our common stock, which shares are issued on the first day of each calendar quarter, in advance (and, in the case of a newly elected or appointed non-employee Director, on the first day of his or her service for the then-current quarter). The number of shares to be issued is equal to (1) the cash retainer to be paid in the form of shares, divided by (2) the 60 trading day weighted average of our common stock, up to and including the last day of the preceding calendar quarter, rounded up to the nearest whole share. These shares are issued under our 2019 Incentive Award Plan.
Our non-employee Directors are eligible to defer the cash compensation paid to them by us (and any shares issued in satisfaction of cash retainers as described above) under the Fee Deferral Plan for Outside Directors of the Parsons Corporation (the “Fee Deferral Plan”). The Fee Deferral Plan allows a non-employee Director to defer his or her annual retainer (and any shares issued in satisfaction of cash retainers as described above) until his or her termination of service or, if earlier, death. Deferred fees (or shares) will generally be payable in a lump sum or in five or ten installments. In the event of a change in control of the Company, all balances will be paid in a lump sum upon the change in control or as soon as practicable thereafter. Any shares deferred pursuant to such a deferral election will be issued in the form of a deferred fee award consisting of a number of restricted stock units under the Incentive Plan determined in accordance with the formula above and reflecting the non-employee Director’s deferral election.
Long-Term Incentive Compensation. The non-employee Directors are granted time-based RSUs under the 2019 Incentive Award Plan. On the date of each annual stockholders’ meeting, each non-employee Director will be granted such number of RSUs as is equal to (1) $170,000, divided by (2) the 60-trading day weighted average of our common stock, up to and including the last day preceding the grant date, rounded up to the nearest whole share.
In October 2022, the Board amended the Non-Employee Director Compensation Policy to include eligibility of a pro-rated initial time-based RSU grant for non-employee Directors who join the Board at a time other than at the annual stockholder’s meeting. In such case, the new non-employee Director will be granted a number of initial restricted stock units equal to the amount of (1) the annual target dollar amount, multiplied by (2) a fraction with i) a numerator equal to the number of whole calendar months between the date of the non-employee Director’s initial election or appointment to the Board and the date of the next annual stockholder’s meeting, and ii) a denominator equal to 12, divided by (3) the 60 Trading Day Weighted Average Stock Price for the Determination Period up to and including the last day preceding the date of grant, rounded up to the nearest whole share. The restricted stock unit award will vest on the same date as the vesting schedule of the immediately preceding annual awards granted to the other continuing non-employee Directors, provided that the non-employee Director is then serving as a member of the Board of Directors. Company executives transitioning to a non-employee Director role are ineligible for the prorated initial grant.
Except as described above for a prorated initial grant, RSUs will vest on the first anniversary of the date of grant. The RSUs will also vest upon a change in control (as defined in the 2019 Incentive Award Plan), or a non-employee Director’s death or disability. In the case of retirement from the Board, for RSUs granted from and after April 21, 2020, the non-employee Director’s RSUs will accelerate and vest in a prorated portion of the RSUs scheduled to vest on the next annual vesting date, based on the portion of days that has elapsed since the grant date. The non-employee Directors are also eligible to make deferral elections with respect to such RSUs, with the deferral alternatives under the Fee Deferral Plan.
Non-Employee Director Ownership Guidelines
The Board believes that it is important to link the interests of non-employee Directors to those of our stockholders. The stock ownership guidelines require our non-employee Directors to accumulate and hold a minimum number of shares of Parsons common stock within five years of the later of (1) the effective date of the policy or (2) the date of appointment to the Board. The specific Parsons stock ownership guidelines for our non-employee Directors is 5X their annual retainer.
For our non-employee Directors, shares of our common stock that count towards satisfaction of this guideline include (1) common stock directly owned by the non-employee Director or immediate family member (2) common stock owned indirectly if the individual has an economic interest in the shares (beneficial ownership as defined in Rule 13d-3 and reported in the proxy) (3) unvested restricted stock or RSUs, and (4) vested units held in deferral accounts under the SVRP, which was a plan under which non-employee Directors received grants (similar to phantom equity) prior to IPO.
Value of ownership will be measured by reference to the trailing 60 trading day weighted average of the Parsons common stock, up to and including last day of the calendar year; compliance will be evaluated annually.
Our non-employee Directors are currently in compliance, either by meeting their non-employee Director ownership requirement, or by having made sufficient progress toward their ownership requirement based on time in role.
The following table contains information concerning the compensation of our non-employee Directors in fiscal 2023.
|
|
|
|
|
|
|
|
|
|
|
|
|
|
|
|
|
|
|
|
|
DIRECTOR COMPENSATION TABLE |
|
Name |
|
Fees Earned
or Paid in
Cash ($) |
|
|
Stock
Awards
($)(1) |
|
|
Change in
Pension
Value and
Nonqualified
Deferred
Compensation
Earnings ($) |
|
|
All Other
Compensation
($)(2) |
|
|
Total ($) |
|
George L. Ball(4) |
|
|
100,000 |
|
|
|
181,559 |
|
|
|
— |
|
|
|
5,000 |
|
|
|
286,559 |
|
Mark K. Holdsworth |
|
|
116,000 |
|
|
|
178,988 |
|
|
|
— |
|
|
|
5,000 |
|
|
|
299,988 |
|
Steven F. Leer |
|
|
164,500 |
|
|
|
178,988 |
|
|
|
— |
|
|
|
5,000 |
|
|
|
348,488 |
|
Letitia A. Long |
|
|
119,500 |
|
|
|
178,988 |
|
|
|
— |
|
|
|
5,000 |
|
|
|
303,488 |
|
Ellen Lord |
|
|
116,000 |
|
|
|
178,988 |
|
|
|
— |
|
|
|
5,000 |
|
|
|
299,988 |
|
General Darren W. McDew, USAF (ret) |
|
|
116,000 |
|
|
|
178,988 |
|
|
|
— |
|
|
|
5,000 |
|
|
|
299,988 |
|
Harry T. McMahon |
|
|
119,500 |
|
|
|
178,988 |
|
|
|
— |
|
|
|
— |
|
|
|
298,488 |
|
M. Christian Mitchell |
|
|
128,000 |
|
|
|
178,988 |
|
|
|
— |
|
|
|
5,000 |
|
|
|
311,988 |
|
Major General Suzanne M. Vautrinot, USAF (ret) |
|
|
126,500 |
|
|
|
178,988 |
|
|
|
— |
|
|
|
5,000 |
|
|
|
310,488 |
|
David C. Wajsgras(3)(4) |
|
|
119,500 |
|
|
|
182,080 |
|
|
|
700 |
|
|
|
— |
|
|
|
302,280 |
|
(1)For 2023, this column represents the aggregate grant date fair value, calculated in accordance with FASB ASC Topic 718, of stock awards granted to the non-employee Directors. Amounts do not correspond to the actual value that will be realized by the non-employee Directors. The non-employee Directors grant date fair value as calculated under FASB ASC Topic 718 of the stock awards is determined by multiplying our share price on the date of grant by the number of shares subject to the award. For additional information on the valuation assumptions used in the calculation of these amounts, refer to note 6 to the financial statements included in the Company’s Annual Report on Form 10-K for the fiscal year ended December 31, 2023, as filed with the SEC. The table below forth the aggregate number of unvested RSUs held by each non-employee Director as of December 31, 2023.
(2)This column represents Company matching contributions to charitable organizations.
(3)Mr. Wajsgras deferred fees earned in fiscal year 2023.
(4)Mr. Wajsgras chose to receive $119,500 of target value fees earned in fiscal year 2023 in the form of fully vested shares of our common stock and received 2,530 shares. The amount of the target value non-employee Director fees that Mr. Wajsgras elected to receive in the form of shares is reflected in the “Fees Earned or Paid in Cash” column, and the fair market value that was greater than the target value earned was $3,092 and is reflected in the “Awards” column. Mr. Ball chose to receive $100,000 of target value fees earned in fiscal year 2023 in the form of fully vested shares of our common stock and received 2,177 shares. The amount of the non-employee Director fees that Mr. Ball elected to receive in the form of shares is reflected in the “Fees Earned or Paid in Cash” column, and the fair market value that was greater than the target value earned was $2,571 and is reflected in the “Awards” column.
|
|
|
|
|
Name |
|
Unvested
RSUs |
|
George L. Ball |
|
|
3,855 |
|
Mark K. Holdsworth |
|
|
3,855 |
|
Steven F. Leer |
|
|
3,855 |
|
Letitia Long |
|
|
3,855 |
|
Ellen Lord |
|
|
3,855 |
|
General Darren W. McDew, USAF (ret) |
|
|
3,855 |
|
Harry T. McMahon |
|
|
3,855 |
|
M. Christian Mitchell |
|
|
3,855 |
|
Major General Suzanne M. Vautrinot, USAF (ret) |
|
|
3,855 |
|
David C. Wajsgras |
|
|
3,855 |
|
EQUITY COMPENSATION PLAN INFORMATION
The following table provides information as of December 31, 2023 regarding compensation plans under which our equity securities are authorized for issuance.
|
|
|
|
|
|
|
|
|
|
|
|
|
|
Plan Category |
|
Number of Securities
to be Issued upon
Exercise of
Outstanding Options,
Warrants and Rights
(a) |
|
Weighted-Average
Exercise Price of
Outstanding Options,
Warrants and Rights
(b) |
|
Number of Securities
Remaining Available for
Future Issuance under
Equity Compensation
Plans (Excluding Securities
Reflected in Column (a))
(c) |
Equity compensation
plans approved by
security holders(1) |
|
|
— |
|
|
|
|
— |
|
|
|
1,463,790 (2) |
|
Equity compensation
plans not approved
by security holders |
|
2,093,336 (3) |
|
|
|
|
— |
|
|
|
8,238,003 (4) |
|
(1)Consists of the 2020 Employee Stock Purchase Plan.
(2)Amount represents 1,463,790 shares remaining available for future issuance under the 2020 Employee Stock Purchase Plan (of which 52,364 shares were purchased pursuant to the offering period that ended on December 31, 2023).
(3)Amount represents 2,093,336 shares of common stock subject to outstanding RSU and PSU awards under the 2019 Incentive Plan (with PSU awards reflected at “target” levels).
(4)Amount represents 8,238,003 shares remaining available for future issuance under the 2019 Incentive Plan. The number of shares of our common stock initially reserved for issuance under awards granted pursuant to the 2019 Incentive Plan is equal to 11,700,000 shares. In no event will more than 11,700,000 shares be issued pursuant to awards under the 2019 Incentive Plan.
AUDIT AND RISK COMMITTEE REPORT
The Audit and Risk Committee is composed of five Directors identified below, each of whom is an independent Director as defined by the applicable SEC directors rules and the NYSE listing standards. Mr. Mitchell, the Chair of the Audit and Risk Committee, Mr. Leer and Mr. Wajsgras have been designated by the Board as “audit committee financial experts” under applicable SEC rules. The following is the report of the Audit and Risk Committee with respect to the Company’s audited financial statements as of and for the year ended December 31, 2023 and the notes thereto.
The Audit and Risk Committee is responsible for assisting the Board in fulfilling its oversight responsibilities relating to, among other things, the Company’s accounting, auditing, and financial reporting processes, internal controls, compliance with legal and regulatory requirements and its code of ethics and risk management, as discussed more fully in the Audit and Risk Committee charter, a copy of which is available on our website, www.parsons.com. In accordance with its charter, the Audit and Risk Committee appoints the Company’s independent registered public accounting firm, PwC, subject to stockholder ratification, and conducts an annual review of its performance. In addition, the Audit and Risk Committee pre-approves all audit and permissible non-audit services provided by PwC, and the fees for those services. The Audit and Risk Committee also oversees the Company’s internal audit function, including its annual audit plan, budget, and staffing. As part of its oversight role, the Audit and Risk Committee meets throughout the year, separately and together, with each of management, the Company’s internal auditors, and PwC.
Management has the primary responsibility for the Company’s financial statements and accounting and reporting processes, including the systems of internal accounting control. PwC is responsible for performing an independent audit of the consolidated financial statements in accordance with the standards of the Public Company Accounting Oversight Board (“PCAOB”) and rendering opinions on whether the financial statements are in conformity with accounting principles generally accepted in the United States and the effectiveness of the Company’s internal control over financial reporting.
The Audit and Risk Committee has reviewed and discussed with management of the Company and PwC, the audited consolidated financial statements of the Company for the year ended December 31, 2023 (the “Audited Financial Statements”), and their assessment of the effectiveness of internal control over financial reporting. The Audit and Risk Committee also reviewed any significant audit findings identified by PwC, and those identified by the Company’s internal auditors as well as management’s responses thereto. In addition, the Audit and Risk Committee discussed with PwC the matters required to be discussed under PCAOB Auditing Standard No. 1301, Communications with Audit Committees.
The Audit and Risk Committee has also: (i) considered whether non-audit services provided by PwC are compatible with its independence; (ii) received the written disclosures and the letter from PwC required by the applicable requirements of the PCAOB regarding PwC’s communications with the Audit and Risk Committee concerning independence; and (iii) discussed with PwC its independence.
Based on the reviews and discussions described above, the Audit and Risk Committee recommended to the Board that the Audited Financial Statements be included in our Annual Report on Form 10-K for the year ended December 31, 2023 for filing with the SEC.
|
|
|
THE AUDIT AND RISK COMMITTEE |
|
M. Christian Mitchell (Chair) |
|
Steven F. Leer Letitia A. Long Harry T. McMahon Suzanne M. Vautrinot David C. Wajsgras |
PRE-APPROVAL OF SERVICES BY INDEPENDENT REGISTERED ACCOUNTING FIRM
The Audit and Risk Committee pre-approves all audit, audit-related, tax, and other services performed by our independent auditors. The Audit and Risk Committee pre-approves specific categories of services up to pre-established fee thresholds. Unless the type of service had previously been pre-approved, the Audit and Risk Committee must approve that specific service before the independent auditors may perform it. In addition, separate approval is required if the amount of fees for any pre-approved category of service exceeds the fee thresholds established by the Audit and Risk Committee. The Audit and Risk Committee has delegated to the chair of the Committee pre-approval authority with respect to permitted services, provided that the chair must report any pre-approval decisions to the Audit and Risk Committee at its next scheduled meeting. All fees described below were pre-approved by the Audit and Risk Committee.
INDEPENDENT REGISTERED PUBLIC ACCOUNTING FIRM FEES
Audit Fees
The following table presents the Company’s fees for services performed by its principal accounting firm, PwC, during fiscal years 2023 and 2022.
|
|
|
|
|
|
|
|
|
(Amounts in thousands) |
|
2023 |
|
|
2022 |
|
Audit fees (1) |
|
$ |
5,086 |
|
|
$ |
5,289 |
|
Audit-related fees |
|
|
— |
|
|
|
— |
|
Tax fees (2) |
|
|
— |
|
|
|
10 |
|
All other fees (3) |
|
|
23 |
|
|
|
22 |
|
Total |
|
$ |
5,109 |
|
|
$ |
5,321 |
|
(1)Audit fees principally include those for services related to the audit and quarterly reviews of the Company’s consolidated financial statements, consultation on accounting matters and services that are normally provided by PwC in connection with statutory and regulatory filings or other engagements.
(2)Tax fees principally include domestic and foreign tax compliance and advisory services.
(3)Associated with annual license fees for software used by management in performing technical research and ensuring completeness of financial statement disclosures.
PROPOSAL 2: RATIFICATION OF APPOINTMENT OF ACCOUNTANTS
The Audit and Risk Committee has appointed PwC as the independent auditors to perform an integrated audit of the Company for the year ending December 31, 2024. PwC served as our independent auditors for the year ended December 31, 2023. Stockholder approval of the appointment is not required.
The Board believes that obtaining stockholder ratification of the appointment is a sound corporate governance practice. If the stockholders do not vote on an advisory basis in favor of PwC, the Audit and Risk Committee will reconsider whether to hire the firm and may retain PwC or hire another firm without resubmitting the matter for stockholders to approve. The Audit and Risk Committee retains the discretion at any time to appoint a different independent auditor.
Representatives of PwC are expected to be present at the annual meeting, available to respond to appropriate questions, and will have the opportunity to make a statement if they desire.
|
|
The Board of Directors recommends a vote FOR ratification of the appointment of PricewaterhouseCoopers LLP as the independent registered public accounting firm for the Company for fiscal year 2024. |
PROPOSAL 3: ADVISORY VOTE ON COMPANY’S EXECUTIVE COMPENSATION
As required by Section 14A of the Exchange Act, the Company is providing stockholders with a non-binding advisory vote on the compensation of our named executive officers, as disclosed in the CD&A, the accompanying compensation tables, and the related narrative disclosure in this proxy statement. Although this vote is advisory, the Board and the Compensation and Management Development Committee value the opinions of our stockholders and will review and consider the voting results when making future compensation decisions for our named executive officers.
As described in detail under the CD&A, our compensation programs are designed to attract, motivate, and retain executives of outstanding ability to meet and exceed the demands of our clients, focus management on optimizing stockholder value and fostering an ownership culture, create appropriate rewards for outstanding performance and penalties for underperformance, and provide competitive rewards that foster collaboration by rewarding executives for their contribution to our overall performance and financial success while determining and allocating incentives based on our performance as a whole in recognition of the spirit and culture of collaboration that has defined us throughout our history. Accordingly, the Board submits the following resolution for a stockholder vote at the 2024 Annual Meeting:
RESOLVED, that the stockholders approve, on an advisory basis, the compensation of the Company’s named executive officers as disclosed in the CD&A, the accompanying compensation tables, and the related narrative disclosure in the Company’s proxy statement for the 2024 Annual Meeting.
|
The Board of Directors recommends a vote FOR the approval, on an advisory basis, of the compensation of our named executive officers as disclosed in the Compensation Discussion & Analysis of this proxy statement. |
OTHER BUSINESS
The Board is not aware of any other matters to be presented at the annual meeting. If any other matter proper for action at the meeting should be presented, the holders of the accompanying proxy will vote the shares represented by the proxy on such matter in accordance with their best judgment. If any matter not proper for action at the meeting should be presented, the holders of the proxy will vote against consideration of the matter or the proposed action.
|
|
|
By order of the Board of Directors |
|
Carey A. Smith, Chair |
|
|
Chantilly, Virginia March 3, 2024 |
|
IMPORTANT INFORMATION ABOUT ANNUAL MEETING AND PROXY PROCEDURES
The Board is soliciting proxies to be used at the Annual Meeting of Stockholders to be held on April 16, 2024, beginning at 9:00 a.m. (EDT). The meeting will be held virtually at virtualshareholdermeeting.com/PSN2024.
Why am I receiving these proxy materials?
You have received these proxy materials because our Board is soliciting your proxy to vote your shares at the annual meeting. As a stockholder, you are invited to attend the annual meeting and are requested to vote on the items of business described in this proxy statement. This proxy statement includes information that we are required to provide to you under SEC rules and describes issues on which we would like you to vote at our Annual Meeting of Stockholders. It also gives you information on these issues so that you can make an informed decision. The proxy materials include our proxy statement for the annual meeting, our annual report to stockholders, which includes our Annual Report on Form 10-K for the year ended December 31, 2023 and the proxy card, or a voting instruction card, for the annual meeting.
Our Board has made this proxy statement and proxy card available to you on the Internet because you own shares of Class A common stock of the Company.
If you submit a proxy by using the Internet, by calling or by signing and returning the proxy card, you will appoint Carey A. Smith and Michael R. Kolloway (with full power of substitution) as your representatives at the annual meeting. They will vote your shares at the annual meeting as you have instructed them or, if an issue that is not on the proxy card comes up for vote, in accordance with his or her best judgment. By submitting a proxy, you can ensure your shares will be voted whether or not you attend the annual meeting. Even if you plan to attend the virtual annual meeting, we encourage you to submit a proxy in advance by using the Internet, by calling or by signing and returning your proxy card. If you vote by Internet or by calling, you do not need to return your proxy card.
Why did I receive a one-page notice in the mail regarding the Internet availability of proxy materials instead of a full set of proxy materials?
Pursuant to the “Notice and Access” rules adopted by the SEC, we have elected to provide access to our proxy materials over the Internet at www.proxyvote.com. Accordingly, we are sending a Notice of Internet Availability of Proxy Materials to our stockholders. All stockholders will have the ability to access the proxy materials on the website referred to in the Notice of Internet Availability of Proxy Materials or request to receive an electronic copy or printed set of the proxy materials. Instructions on how to access the proxy materials over the Internet or to request an electronic copy or printed copy may be found in the Notice of Internet Availability of Proxy Materials. In addition, stockholders may request to receive proxy materials in printed form by mail or electronically by email on an ongoing basis if you submit your request in writing at proxyvote.com, or by email to sendmaterial@proxyvote.com, or by phone at 1-800-579-1639. We encourage stockholders to take advantage of the availability of the proxy materials on the Internet to help reduce the impact to the environment.
How do I attend the virtual annual stockholders’ meeting?
Information for attending the virtual annual meeting are provided in the Notice Regarding the Availability of Proxy Materials sent to all stockholders of record as of February 20, 2024.
Who is entitled to vote at the annual meeting?
Holders of the Company’s common stock are entitled to vote at the annual meeting. The Board has established the record date for the annual meeting as February 20, 2024. Only holders of record of the Company’s common stock on the record date are entitled to receive notice of the meeting and to vote at the meeting.
How many shares must be present to hold the annual meeting?
In order for us to lawfully conduct business at the annual meeting, the holders of stock representing a majority of the voting power of all shares issued and outstanding and entitled to vote at the meeting must be present in person or represented by proxy. This is referred to as a quorum.
How many shares may I vote?
On February 20, 2024, 105,829.579 shares of our common stock were outstanding. Each share of Class A common stock is entitled to one vote, and stockholders do not have the right to cumulate their votes for the election of Directors.
What am I voting on and what are the Board’s recommendations?
|
|
|
|
Proposal |
Description |
Board’s Voting
Recommendation |
Page
Reference |
|
|
|
|
No. 1 |
Election of four director nominees |
FOR each nominee |
7 |
|
|
|
|
|
|
|
|
No. 2 |
Ratification of appointment of PricewaterhouseCoopers LLP (“PwC”) as the Company’s independent registered accounting firm for fiscal year 2024 |
FOR |
72 |
|
|
|
|
|
|
|
|
No. 3 |
A non-binding advisory vote on the compensation program for the Company’s named executive officers, as disclosed in the Compensation Discussion and Analysis (“CD&A”) of the proxy statement |
FOR |
73 |
|
|
|
|
|
|
|
|
What is the difference between holding shares as a stockholder of record and as a beneficial owner?
If your shares are registered directly in your name with the Company’s registrar and transfer agent, Computershare, you are considered a “stockholder of record” with respect to those shares. In this case, we mailed the proxy materials and our annual report to you directly.
If your shares are held in a brokerage account or bank, you are considered the “beneficial owner” of those shares, which are held in “street name.” In this case, the proxy materials and our annual report were forwarded to you by your broker or bank. As the beneficial owner, you have the right to direct your broker or bank how to vote your shares by following the voting instructions included in the mailing.
What is the procedure for voting?
If you are a stockholder of record of common stock, you can vote your shares at the annual meeting by attending the virtual meeting and completing a ballot pursuant to the instructions contained in the Notice provided to all stockholders of records as of February 20, 2024. The information is contained in the sections entitled “How to Access the Proxy Materials” and “How to Vote”. You can also give a proxy to be voted at the annual meeting in one of three ways: (1) over the telephone by calling a toll-free number provided on the enclosed proxy card, (2) electronically via the Internet as described in the enclosed proxy card, or (3) date, sign, and complete the proxy card and return it in the enclosed envelope, which requires no postage stamp if mailed in the United States.
Can I change my proxy?
You may revoke your proxy before it is voted at the annual meeting by delivering a signed revocation letter to the Secretary of the Company at 14291 Park Meadow Drive, Suite 100, Chantilly, Virginia 20151, or by submitting a new proxy, dated later than your first proxy, in one of the ways described in the answer to the previous question. If you are attending in person and have previously mailed your proxy card, you may revoke your proxy and vote in person at the meeting.
Can other matters be decided at the annual meeting?
The Board is not aware of any other matters to be presented at the annual meeting. If any other matter proper for action at the meeting should be presented, the holders of the accompanying proxy will vote the shares represented by the proxy on such matter in accordance with their best judgment. If any matter not proper for action at the meeting should be presented, the holders of the proxy will vote against consideration of the matter or the proposed action.
What if I am a stockholder of record and do not provide voting instructions when returning a proxy?
Stockholders should specify their choice for each matter on the proxy card. Proxies that are signed and returned but do not contain voting instructions will be voted:
•FOR the election of all director nominees as set forth in this proxy statement;
•FOR the ratification of the appointment of PwC as the Company’s independent registered accounting firm for fiscal 2024;
•FOR the approval, on a non-binding, advisory basis, of the compensation of our named executive officers;
What if I am a beneficial owner and do not give voting instructions to my broker?
If your shares are held by a broker in “street name,” your brokerage firm may vote your shares on certain “routine” matters if you do not provide voting instructions. The ratification of an independent registered public accounting firm is an example of a routine matter. If you do not provide voting instructions, your brokerage firm may either vote your shares on routine matters or leave your shares unvoted. When a brokerage firm votes its customers’ shares on a routine matter without receiving voting instructions, these shares are counted both for establishing a quorum to conduct business at the meeting and in determining the number of shares voted for or against the routine matter. A brokerage firm cannot vote your shares on non-routine matters, such as the election of Directors, and advisory vote on executive compensation. If your brokerage firm has not received voting instructions on a non-routine matter, these shares will be considered “broker non-votes” to the extent that the brokerage firm submits a proxy.
How are abstentions and broker non-votes counted?
Abstentions will be treated as present for purposes of determining a quorum but will not be included in vote totals. Abstentions will have the effect of a vote “against” each of the proposals, other than for the election of Directors whereby abstentions will not affect the outcome.
Broker non-votes are counted for purposes of establishing a quorum. Broker non-votes will have no effect on the outcome of the non-routine proposals. For the routine proposal, the ratification of an independent registered public accounting firm, discretionary voting by a broker is permitted.
Who will count the votes?
A representative from Broadridge Financial Services will tabulate the votes and act as the inspector of election for the annual meeting.
Who will bear the costs of soliciting votes for the annual meeting?
We will bear all costs of soliciting proxies. Pursuant to rules adopted by the SEC, we have elected to deliver a notice of Internet availability of proxy materials to stockholders and provide Internet access to those proxy materials. Stockholders may obtain paper copies of the proxy materials free of charge by following the instructions provided in the notice of Internet availability of proxy materials.
When will the Company announce the voting results?
The preliminary voting results will be announced at the annual meeting. The Company will report the final results on our website and in a Current Report on Form 8-K filed with the SEC.
Can I receive a copy of the Annual Report?
The annual report of the Company on Form 10-K for the year ended December 31, 2023 is being furnished concurrently with this proxy statement to persons who were stockholders of record as of February 20, 2024, the record date for the annual meeting.
What is “householding” and how does it affect me?
In some cases, stockholders holding their shares in a brokerage or bank account who share the same surname and address and have not given contrary instructions are receiving only one copy of our
annual report on Form 10-K and this proxy statement. This reduces the volume of duplicate information received at your household and helps to reduce costs. If you would like to have additional copies of these documents mailed to you, if you want to receive separate copies of the proxy statement, annual report to stockholders, or Notice of Internet Availability of Proxy Materials in the future, or if you are receiving multiple copies and would like to receive only one copy per household, you should contact Broadridge Householding Department, by writing Broadridge Householding Department at 51 Mercedes Way, Edgewood, NY 11717 or calling their toll free number, (866) 540-7095.
How do I submit a proposal for action at the annual of meeting of stockholders in 2025?
Under applicable SEC rules and regulations, the Company will review for inclusion in next year’s proxy statement stockholder proposals received by December 17, 2024. Proposals should be sent to the Secretary of the Company at 14291 Park Meadow Drive, Suite 100, Chantilly, Virginia 20151.
Pursuant to our amended and restated bylaws, stockholder proposals not included in next year’s proxy statement may be brought before the 2025 Annual Meeting of Stockholders by a stockholder of the Company who is entitled to vote at the meeting, who has given a written notice to the Secretary of the Company at 14291 Park Meadow Drive, suite 100, Chantilly, Virginia 20151 containing certain information specified in the amended and restated bylaws and who was a stockholder of record at the time such notice was given.
Such notice must be delivered to or mailed and received at the address in the preceding paragraph no earlier than December 17, 2024 and no later than January 16, 2025, except that if the date of the 2024 Annual Meeting of Stockholders is more than thirty days before or more than sixty days after the one-year anniversary of the 2024 Annual Meeting, such notice must be delivered at the address no later than the close of business on the later of (i) the ninetieth day prior to the new date of such annual meeting and (ii) the tenth day following the day on which a public announcement of the new date of such annual meeting is first made.
In addition to satisfying the foregoing requirements under the company’s bylaws, to comply with universal proxy rules (once they become effective), stockholders who intend to solicit proxies in support of director nominees other than the Company’s nominees must provide notice that sets forth the information required by Rule 14a-19 under the Exchange Act no later than February 15, 2025.
APPENDIX A
RECONCILIATION OF NON-GAAP METRICS
A reconciliation of net income (loss) attributable to Parsons Corporation to adjusted EBITDA is set forth below (in thousands).
|
|
|
|
|
|
|
|
|
|
|
|
|
|
|
December 31,
2023 |
|
|
December 31,
2022 |
|
|
December 31,
2021 |
|
Net income attributable to Parsons Corporation |
|
$ |
161,149 |
|
|
$ |
96,664 |
|
|
$ |
64,072 |
|
Interest expense, net |
|
|
29,306 |
|
|
|
22,219 |
|
|
|
17,301 |
|
Income tax expense (benefit) |
|
|
56,138 |
|
|
|
39,657 |
|
|
|
23,636 |
|
Depreciation and amortization |
|
|
119,973 |
|
|
|
120,501 |
|
|
|
144,209 |
|
Net income attributable to noncontrolling interests |
|
|
46,766 |
|
|
|
29,901 |
|
|
|
24,880 |
|
Equity-based compensation |
|
|
36,151 |
|
|
|
24,354 |
|
|
|
19,601 |
|
Transaction-related costs (a) |
|
|
12,013 |
|
|
|
16,270 |
|
|
|
11,965 |
|
Restructuring (b) |
|
|
1,244 |
|
|
|
213 |
|
|
|
736 |
|
Other (c) |
|
|
1,933 |
|
|
|
3,003 |
|
|
|
3,320 |
|
Adjusted EBITDA |
|
$ |
464,673 |
|
|
$ |
352,782 |
|
|
$ |
309,720 |
|
(a)Reflects costs incurred in connection with acquisitions, and other non-recurring transaction costs, primarily fees paid for professional services and employee retention.
(b)Reflects costs associated with and related to our corporate restructuring initiatives.
(c)Includes a combination of gain/loss related to sale of fixed assets, software implementation costs, and other individually insignificant items that are non-recurring in nature.
Adjusted EBITDA is a supplemental measure of our operating performance included in the Annual Report on Form 10-K because it is used by management and our Board of Directors to assess our financial performance both on a segment and on a consolidated basis. We discuss adjusted EBITDA because our management uses this measure for business planning purposes, including to manage the business against internal projected results of operations and to measure the performance of the business generally. Adjusted EBITDA is frequently used by analysts, investors and other interested parties to evaluate companies in our industry.
Adjusted EBITDA is not a U.S. GAAP measure of our financial performance or liquidity and should not be considered as an alternative to net income as a measure of financial performance or cash flows from operations as measures of liquidity, or any other performance measure derived in accordance with U.S. GAAP. We define adjusted EBITDA as net income attributable to Parsons Corporation, adjusted to include net income attributable to noncontrolling interests and to exclude interest expense (net of interest income), provision for income taxes, depreciation and amortization and certain other items that we do not consider in our evaluation of ongoing operating performance. These other items include, among other things, impairment of goodwill, intangible and other assets, interest and other expenses recognized on litigation matters, expenses incurred in connection with acquisitions and other non-recurring transaction costs, equity-based compensation, and expenses related to our corporate restructuring initiatives. Adjusted EBITDA should not be construed as an inference that our future results will be unaffected by unusual or non-recurring items. Additionally, adjusted EBITDA is not intended to be a measure of free cash flow for management’s discretionary use, as it does not reflect tax payments, debt service requirements, capital expenditures and certain other cash costs that may recur in the future, including, among other things, cash requirements for working capital needs and cash costs to replace assets being depreciated and amortized. Management compensates for these limitations by relying on our U.S. GAAP results in addition to using adjusted EBITDA supplementally. Our measure
of adjusted EBITDA is not necessarily comparable to similarly titled captions of other companies due to different methods of calculation.
The following table shows adjusted EBITDA attributable to Parsons Corporation for each of our reportable segments and adjusted EBITDA attributable to noncontrolling interests:
|
|
|
|
|
|
|
|
|
|
|
|
|
|
|
Fiscal Year Ended |
|
(U.S. dollars in thousands) |
|
December 31,
2023 |
|
|
December 31,
2022 |
|
|
December 31,
2021 |
|
Federal Solutions adjusted EBITDA attributable to Parsons Corporation |
|
$ |
289,250 |
|
|
$ |
199,004 |
|
|
$ |
162,733 |
|
Critical Infrastructure adjusted EBITDA attributable to Parsons Corporation |
|
|
127,785 |
|
|
|
123,385 |
|
|
|
121,700 |
|
Adjusted EBITDA attributable to noncontrolling interests |
|
|
47,638 |
|
|
|
30,393 |
|
|
|
25,287 |
|
Total adjusted EBITDA |
|
$ |
464,673 |
|
|
$ |
352,782 |
|
|
$ |
309,720 |
|
See “Management’s Discussion and Analysis of Financial Condition and Results of Operations—Segment Results,” and “Note 20—Segments Information” in the notes to our consolidated financial statements included in the Company’s Annual Report on Form 10-K filed with the U.S. Securities and Exchange Commission on February 14, 2024 for a further discussion regarding our segment adjusted EBITDA attributable to Parsons Corporation.
Your Vote Counts! PARSONS CORPORATION 2024 Annual Meeting Vote by April 15, 2024 11:59 PM ET. For shares held in ESOP, vote by April 11, 2024 11:59 PM ET. PARSONS PARSONS CORPORATION 14291 PARK MEADOW DRIVE, SUITE 100 CHANTILLY, VA 20151 V28203-P02672 You invested in PARSONS CORPORATION and it’s time to vote! You have the right to vote on proposals being presented at the Annual Meeting. This is an important notice regarding the availability of proxy material for the shareholder meeting to be held on April 16, 2024. Get informed before you vote View the Notice and Proxy Statement and Form 10-K Wrap online OR you can receive a free paper or email copy of the material(s) by requesting prior to April 2, 2024. If you would like to request a copy of the material(s) for this and/or future shareholder meetings, you may (1) visit www.ProxyVote.com, (2) call 1-800-579-1639 or (3) send an email to sendmaterial@proxyvote.com. If sending an email, please include your control number (indicated below) in the subject line. Unless requested, you will not otherwise receive a paper or email copy. For complete information and to vote, visit www.ProxyVote.com Control # Smartphone users Point your camera here and vote without entering a control number Vote Virtually at the Meeting* April 16, 2024 9:00 a.m., Eastern Time Virtually at: www.virtualshareholdermeeting.com/PSN2024 *Please check the meeting materials for any special requirements for meeting attendance V1.1
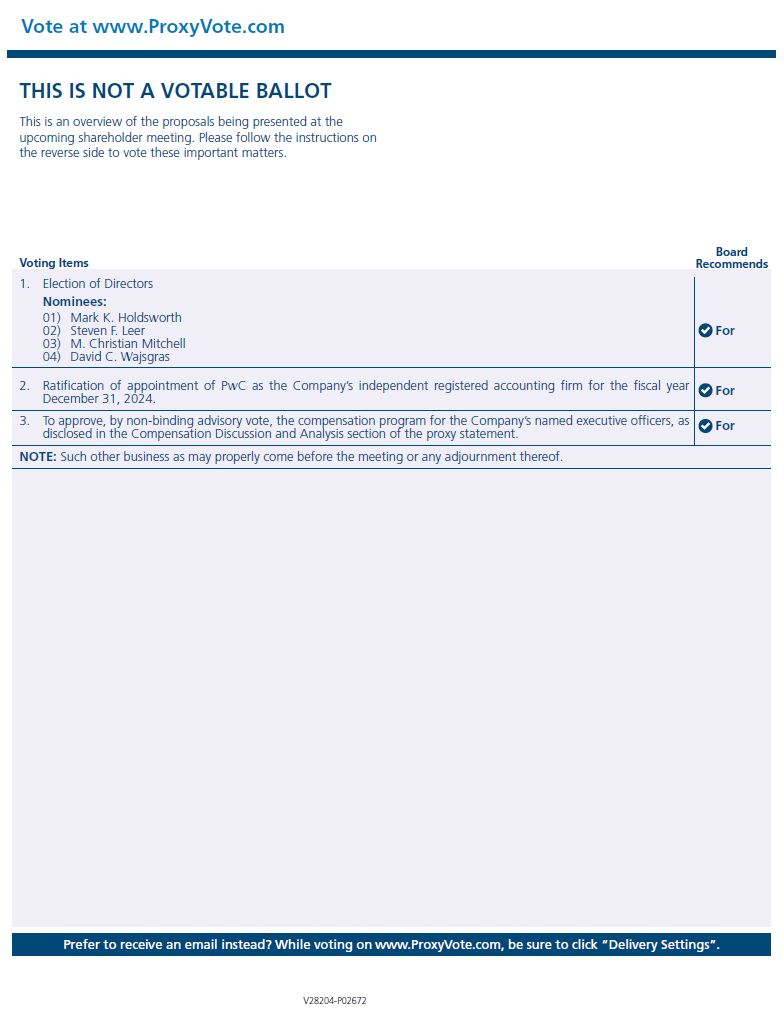
v3.24.0.1
| X |
- DefinitionBoolean flag that is true when the XBRL content amends previously-filed or accepted submission.
| Name: |
dei_AmendmentFlag |
| Namespace Prefix: |
dei_ |
| Data Type: |
xbrli:booleanItemType |
| Balance Type: |
na |
| Period Type: |
duration |
|
| X |
- DefinitionThe type of document being provided (such as 10-K, 10-Q, 485BPOS, etc). The document type is limited to the same value as the supporting SEC submission type, or the word 'Other'.
| Name: |
dei_DocumentType |
| Namespace Prefix: |
dei_ |
| Data Type: |
dei:submissionTypeItemType |
| Balance Type: |
na |
| Period Type: |
duration |
|
| X |
- DefinitionA unique 10-digit SEC-issued value to identify entities that have filed disclosures with the SEC. It is commonly abbreviated as CIK. Reference 1: http://www.xbrl.org/2003/role/presentationRef
-Publisher SEC
-Name Exchange Act
-Number 240
-Section 12
-Subsection b-2
| Name: |
dei_EntityCentralIndexKey |
| Namespace Prefix: |
dei_ |
| Data Type: |
dei:centralIndexKeyItemType |
| Balance Type: |
na |
| Period Type: |
duration |
|
| X |
- DefinitionThe exact name of the entity filing the report as specified in its charter, which is required by forms filed with the SEC. Reference 1: http://www.xbrl.org/2003/role/presentationRef
-Publisher SEC
-Name Exchange Act
-Number 240
-Section 12
-Subsection b-2
| Name: |
dei_EntityRegistrantName |
| Namespace Prefix: |
dei_ |
| Data Type: |
xbrli:normalizedStringItemType |
| Balance Type: |
na |
| Period Type: |
duration |
|
v3.24.0.1
Pay vs Performance Disclosure
|
12 Months Ended |
|
Dec. 31, 2023
USD ($)
$ / shares
|
Dec. 31, 2022
USD ($)
$ / shares
|
Dec. 31, 2021
USD ($)
$ / shares
|
Dec. 31, 2020
USD ($)
$ / shares
|
| Pay vs Performance Disclosure |
|
|
|
|
| Pay vs Performance Disclosure, Table |
Pay Versus Performance Table The following table sets forth additional compensation information of our Chief Executive Officer (CEO) and our other NEOs along with our total shareholder return, the total shareholder return of the peer group identified below, our net income, and revenue, our company selected measure, for our fiscal years ending in 2020, 2021, 2022 and 2023:
|
|
|
|
|
|
|
|
|
|
|
|
|
|
|
|
|
|
|
|
|
|
|
|
|
|
|
|
|
|
|
|
|
|
|
|
|
|
|
|
|
|
|
|
|
|
|
|
|
|
|
|
|
|
Value of Initial Fixed $100 Investment Based On: |
|
(in thousands) |
Year
(1) |
Summary
Compensation
Table Total for
CEO#1 |
Compensation
Actually Paid
to CEO#1
(2)(3) |
Summary
Compensation
Table Total
for CEO#2 |
Compensation
Actually Paid
to CEO#2
(2)(3) |
Average
Summary
Compensation
Table Total for
Other NEOs |
Average
Compensation
Actually Paid
to Other NEOs
(2)(3) |
Total
Shareholder
Return (8) |
Peer Group
Total
Shareholder
Return (8) |
Net
income |
Revenue |
2023 |
|
|
18,596,895 |
|
|
25,548,246 (4) |
|
|
|
|
|
|
|
2,160,582 |
|
|
3,296,957 (4) |
|
|
151.91 |
|
|
|
165.65 |
|
|
|
|
161,149 |
|
|
|
5,442,749 |
|
|
2022 |
|
|
6,973,806 |
|
|
10,626,325 (5) |
|
|
|
|
|
|
|
1,945,846 |
|
|
3,331,189 (5) |
|
|
112.04 |
|
|
|
142.59 |
|
|
|
|
96,664 |
|
|
|
4,195,272 |
|
|
2021 |
|
|
5,348,118 |
|
|
4,077,659 (6) |
|
|
7,119,599 |
|
|
3,822,001 (6) |
|
|
1,498,734 |
|
|
864,158 (6) |
|
|
81.52 |
|
|
|
139.03 |
|
|
|
|
64,072 |
|
|
|
3,660,771 |
|
|
2020 |
|
|
|
|
|
|
|
8,231,959 |
|
|
2,601,283 (7) |
|
|
2,507,932 |
|
|
1,676,265 (7) |
|
|
88.20 |
|
|
|
115.30 |
|
|
|
|
98,541 |
|
|
|
3,918,946 |
|
|
(1)NEOs included in the above compensation columns reflect the following:
|
|
|
|
Year |
CEO#1 |
CEO#2 |
Other NEOs |
2023 |
Carey A. Smith |
|
Susan M. Balaguer, Michael R. Kolloway and Matthew Ofilos |
2022 |
Carey A. Smith |
|
Susan M. Balaguer, George L. Ball, Charles L. Harrington, Michael R. Kolloway and Matthew Ofilos |
2021 |
Carey A. Smith |
Charles L. Harrington |
George L. Ball, Debra A. Fiori and Michael R. Kolloway |
2020 |
|
Charles L. Harrington |
George L. Ball, Debra A. Fiori, Michael R. Kolloway and Carey A. Smith |
(2)Fair value or change in fair value, as applicable, of equity awards in the Compensation "Actually Paid" columns was determined by reference to (1) for RSU awards (excluding Total Shareholder Return “TSR” awards and other performance-based awards), closing price on applicable year-end date(s) or, in the case of vesting dates, the actual vesting price, (2) for performance-based RSU awards (excluding TSR Awards), the same valuation methodology as RSU awards above except year-end values are multiplied times the probability of achievement as of each such date (3) for TSR-based awards, the fair value calculated by a Monte Carlo simulation model as of the applicable valuation date(s). (3)For the portion of “Actually Paid” compensation that is based on year-end stock prices, the following prices were used: December 31, 2023 $62.71 (35.6 % increase from prior year), December 31, 2022 $46.25 (37.4% increase from prior year), December 31, 2021 $33.65 (7.58% reduction from prior year), December 31, 2020 $36.41 (11.8% reduction from prior year). (4)2023 Compensation "Actually Paid" to CEO#1 of $25,548,246 and the average Compensation "Actually Paid" to other NEOs reflects the following adjustments from total compensation reported in the Summary Compensation Table:
|
|
|
|
|
|
CEO#1 |
Average
Other NEOs |
Total Reported in 2023 Summary Compensation Table (SCT) |
18,596,895 |
|
2,160,582 |
|
Less, value of Stock Awards reported in SCT |
(15,215,909) |
|
(872,752) |
|
Plus, Year-End value of Awards Granted in Fiscal Year that are Unvested and Outstanding |
17,670,848 |
|
1,255,989 |
|
Plus, Change in Fair Value of Prior Year awards that are Outstanding and Unvested |
4,516,447 |
|
731,953 |
|
Plus, FMV of Awards Granted this Year and that Vested this Year |
— |
|
— |
|
Plus, Change in Fair Value (from prior year-end) of Prior Year awards that Vested this year |
(20,035) |
|
21,186 |
|
Less Prior Year Fair Value of Prior Year awards that Failed to vest this year |
— |
|
— |
|
Total Adjustments |
6,951,351 |
|
1,136,375 |
|
Compensation "Actually Paid" for Fiscal Year 2023 |
25,548,246 |
|
3,296,957 |
|
(5)2022 Compensation “Actually Paid” to CEO#1 of $10,067,617 was updated to $10,626,325 and the average Compensation “Actually Paid” to other NEOs of $3,272,287 was updated to $3,331,189 due to a correction of "Change in Fair Value of Prior Year awards that are Outstanding and Unvested". Below reflects the corrections and adjustments from total compensation reported in the Summary Compensation Table:
|
|
|
|
|
|
CEO#1 |
Average
Other NEOs |
Total Reported in 2022 Summary Compensation Table (SCT) |
6,973,806 |
|
1,945,846 |
|
Less, value of Stock Awards reported in SCT |
(4,730,700) |
|
(990,085) |
|
Plus, Year-End value of Awards Granted in Fiscal Year that are Unvested and Outstanding |
6,577,029 |
|
1,239,181 |
|
Plus, Change in Fair Value of Prior Year awards that are Outstanding and Unvested |
1,736,210 |
|
570,784 |
|
Plus, FMV of Awards Granted this Year and that Vested this Year |
— |
|
326,744 |
|
Plus, Change in Fair Value (from prior year-end) of Prior Year awards that Vested this year |
69,980 |
|
238,720 |
|
Less Prior Year Fair Value of Prior Year awards that Failed to vest this year |
— |
|
— |
|
Total Adjustments |
3,652,519 |
|
1,385,343 |
|
Compensation "Actually Paid" for Fiscal Year 2022 |
10,626,325 |
|
3,331,189 |
|
(6)2021 Compensation “Actually Paid” to CEO#1 of $3,971,476 was updated to $4,077,659, CEO#2 of $3,692,318 was updated to $3,822,001 and the average Compensation “Actually Paid” to other NEOs of $851,546 to $864,158 due to a correction of "Change in Fair Value of Prior Year awards that are Outstanding and Unvested". Below reflects the corrections and adjustments from total compensation reported in the Summary Compensation Table:
|
|
|
|
|
|
|
|
CEO#1 |
CEO#2 |
Average
Other NEOs |
Total Reported in 2021 Summary Compensation Table (SCT) |
5,348,118 |
|
7,119,599 |
|
1,498,734 |
|
Less, value of Stock Awards reported in SCT |
(3,895,113) |
|
(5,382,006) |
|
(829,496) |
|
Plus, Year-End value of Awards Granted in Fiscal Year that are Unvested and Outstanding |
3,339,277 |
|
4,853,848 |
|
748,094 |
|
Plus, Change in Fair Value of Prior Year awards that are Outstanding and Unvested |
(618,697) |
|
(2,264,902) |
|
(215,544) |
|
Plus, FMV of Awards Granted this Year and that Vested this Year |
— |
|
— |
|
— |
|
Plus, Change in Fair Value (from prior year-end) of Prior Year awards that Vested this year |
(95,926) |
|
(504,539) |
|
(337,629) |
|
Less Prior Year Fair Value of Prior Year awards that Failed to vest this year |
— |
|
— |
|
— |
|
Total Adjustments |
(1,270,459) |
|
(3,297,598) |
|
(634,576) |
|
Compensation "Actually Paid" for Fiscal Year 2021 |
4,077,659 |
|
3,822,001 |
|
864,158 |
|
(7)2020 Compensation “Actually Paid” to CEO#2 of $2,601,283 and the average Compensation “Actually Paid” to other NEOs reflects the following adjustments from total compensation reported in the Summary Compensation Table:
|
|
|
|
|
|
|
|
CEO#2 |
Average
Other NEOs |
Total Reported in 2020 Summary Compensation Table (SCT) |
|
8,231,959 |
|
2,507,932 |
|
Less, value of Stock Awards reported in SCT |
|
(4,974,490) |
|
(1,221,932) |
|
Plus, Year-End value of Awards Granted in Fiscal Year that are Unvested and Outstanding |
|
4,626,904 |
|
1,104,283 |
|
Plus, Change in Fair Value of Prior Year awards that are Outstanding and Unvested |
|
(4,069,659) |
|
(569,652) |
|
Plus, FMV of Awards Granted this Year and that Vested this Year |
|
— |
|
— |
|
Plus, Change in Fair Value (from prior year-end) of Prior Year awards that Vested this year |
|
(1,213,431) |
|
(144,365) |
|
Less Prior Year Fair Value of Prior Year awards that Failed to vest this year |
|
— |
|
— |
|
Total Adjustments |
|
(5,630,676) |
|
(831,667) |
|
Compensation "Actually Paid" for Fiscal Year 2020 |
|
2,601,283 |
|
1,676,265 |
|
(8)Company and peer group TSR reflects the Company’s Compensation Peer Group as approved in each year and reflected in the Compensation Discussion & Analysis of each of our 2021, 2022, 2023, and 2024 Annual Proxy Statements, respectively. The TSR for each year reflects what the cumulative value of $100 would be, including reinvestment of dividends, if such amount were invested into the peer group for that applicable year on December 31, 2019. The only changes to the peer group in 2023 relative to 2022 was the removal of Maxar Technologies Inc and ManTech International Corporation as a result of their acquisitions. In 2022, the only change to the peer group relative to 2021 was the removal of Cubic Corporation as a result of its acquisition. 3-year TSR for the peer group approved in 2021, assuming a $100 initial investment on 12/31/2019, would have been $141.75. Changes to the peer group made in 2021 relative to the 2020 peer group were the removals of FLIR Systems and Perspecta as a result of their acquisitions and the addition of Maxar in light of its business relevance and size. 2-year TSR for the peer group approved in 2020, assuming a $100 initial investment on 12/31/2019, would have been $135.62. |
|
|
|
| Company Selected Measure Name |
Revenue
|
|
|
|
| Named Executive Officers, Footnote |
(1)NEOs included in the above compensation columns reflect the following:
|
|
|
|
Year |
CEO#1 |
CEO#2 |
Other NEOs |
2023 |
Carey A. Smith |
|
Susan M. Balaguer, Michael R. Kolloway and Matthew Ofilos |
2022 |
Carey A. Smith |
|
Susan M. Balaguer, George L. Ball, Charles L. Harrington, Michael R. Kolloway and Matthew Ofilos |
2021 |
Carey A. Smith |
Charles L. Harrington |
George L. Ball, Debra A. Fiori and Michael R. Kolloway |
2020 |
|
Charles L. Harrington |
George L. Ball, Debra A. Fiori, Michael R. Kolloway and Carey A. Smith |
|
|
|
|
| Peer Group Issuers, Footnote |
(8)Company and peer group TSR reflects the Company’s Compensation Peer Group as approved in each year and reflected in the Compensation Discussion & Analysis of each of our 2021, 2022, 2023, and 2024 Annual Proxy Statements, respectively. The TSR for each year reflects what the cumulative value of $100 would be, including reinvestment of dividends, if such amount were invested into the peer group for that applicable year on December 31, 2019. The only changes to the peer group in 2023 relative to 2022 was the removal of Maxar Technologies Inc and ManTech International Corporation as a result of their acquisitions. In 2022, the only change to the peer group relative to 2021 was the removal of Cubic Corporation as a result of its acquisition. 3-year TSR for the peer group approved in 2021, assuming a $100 initial investment on 12/31/2019, would have been $141.75. Changes to the peer group made in 2021 relative to the 2020 peer group were the removals of FLIR Systems and Perspecta as a result of their acquisitions and the addition of Maxar in light of its business relevance and size. 2-year TSR for the peer group approved in 2020, assuming a $100 initial investment on 12/31/2019, would have been $135.62.
|
|
|
|
| Adjustment To PEO Compensation, Footnote |
(4)2023 Compensation "Actually Paid" to CEO#1 of $25,548,246 and the average Compensation "Actually Paid" to other NEOs reflects the following adjustments from total compensation reported in the Summary Compensation Table:
|
|
|
|
|
|
CEO#1 |
Average
Other NEOs |
Total Reported in 2023 Summary Compensation Table (SCT) |
18,596,895 |
|
2,160,582 |
|
Less, value of Stock Awards reported in SCT |
(15,215,909) |
|
(872,752) |
|
Plus, Year-End value of Awards Granted in Fiscal Year that are Unvested and Outstanding |
17,670,848 |
|
1,255,989 |
|
Plus, Change in Fair Value of Prior Year awards that are Outstanding and Unvested |
4,516,447 |
|
731,953 |
|
Plus, FMV of Awards Granted this Year and that Vested this Year |
— |
|
— |
|
Plus, Change in Fair Value (from prior year-end) of Prior Year awards that Vested this year |
(20,035) |
|
21,186 |
|
Less Prior Year Fair Value of Prior Year awards that Failed to vest this year |
— |
|
— |
|
Total Adjustments |
6,951,351 |
|
1,136,375 |
|
Compensation "Actually Paid" for Fiscal Year 2023 |
25,548,246 |
|
3,296,957 |
|
(5)2022 Compensation “Actually Paid” to CEO#1 of $10,067,617 was updated to $10,626,325 and the average Compensation “Actually Paid” to other NEOs of $3,272,287 was updated to $3,331,189 due to a correction of "Change in Fair Value of Prior Year awards that are Outstanding and Unvested". Below reflects the corrections and adjustments from total compensation reported in the Summary Compensation Table:
|
|
|
|
|
|
CEO#1 |
Average
Other NEOs |
Total Reported in 2022 Summary Compensation Table (SCT) |
6,973,806 |
|
1,945,846 |
|
Less, value of Stock Awards reported in SCT |
(4,730,700) |
|
(990,085) |
|
Plus, Year-End value of Awards Granted in Fiscal Year that are Unvested and Outstanding |
6,577,029 |
|
1,239,181 |
|
Plus, Change in Fair Value of Prior Year awards that are Outstanding and Unvested |
1,736,210 |
|
570,784 |
|
Plus, FMV of Awards Granted this Year and that Vested this Year |
— |
|
326,744 |
|
Plus, Change in Fair Value (from prior year-end) of Prior Year awards that Vested this year |
69,980 |
|
238,720 |
|
Less Prior Year Fair Value of Prior Year awards that Failed to vest this year |
— |
|
— |
|
Total Adjustments |
3,652,519 |
|
1,385,343 |
|
Compensation "Actually Paid" for Fiscal Year 2022 |
10,626,325 |
|
3,331,189 |
|
(6)2021 Compensation “Actually Paid” to CEO#1 of $3,971,476 was updated to $4,077,659, CEO#2 of $3,692,318 was updated to $3,822,001 and the average Compensation “Actually Paid” to other NEOs of $851,546 to $864,158 due to a correction of "Change in Fair Value of Prior Year awards that are Outstanding and Unvested". Below reflects the corrections and adjustments from total compensation reported in the Summary Compensation Table:
|
|
|
|
|
|
|
|
CEO#1 |
CEO#2 |
Average
Other NEOs |
Total Reported in 2021 Summary Compensation Table (SCT) |
5,348,118 |
|
7,119,599 |
|
1,498,734 |
|
Less, value of Stock Awards reported in SCT |
(3,895,113) |
|
(5,382,006) |
|
(829,496) |
|
Plus, Year-End value of Awards Granted in Fiscal Year that are Unvested and Outstanding |
3,339,277 |
|
4,853,848 |
|
748,094 |
|
Plus, Change in Fair Value of Prior Year awards that are Outstanding and Unvested |
(618,697) |
|
(2,264,902) |
|
(215,544) |
|
Plus, FMV of Awards Granted this Year and that Vested this Year |
— |
|
— |
|
— |
|
Plus, Change in Fair Value (from prior year-end) of Prior Year awards that Vested this year |
(95,926) |
|
(504,539) |
|
(337,629) |
|
Less Prior Year Fair Value of Prior Year awards that Failed to vest this year |
— |
|
— |
|
— |
|
Total Adjustments |
(1,270,459) |
|
(3,297,598) |
|
(634,576) |
|
Compensation "Actually Paid" for Fiscal Year 2021 |
4,077,659 |
|
3,822,001 |
|
864,158 |
|
(7)2020 Compensation “Actually Paid” to CEO#2 of $2,601,283 and the average Compensation “Actually Paid” to other NEOs reflects the following adjustments from total compensation reported in the Summary Compensation Table:
|
|
|
|
|
|
|
|
CEO#2 |
Average
Other NEOs |
Total Reported in 2020 Summary Compensation Table (SCT) |
|
8,231,959 |
|
2,507,932 |
|
Less, value of Stock Awards reported in SCT |
|
(4,974,490) |
|
(1,221,932) |
|
Plus, Year-End value of Awards Granted in Fiscal Year that are Unvested and Outstanding |
|
4,626,904 |
|
1,104,283 |
|
Plus, Change in Fair Value of Prior Year awards that are Outstanding and Unvested |
|
(4,069,659) |
|
(569,652) |
|
Plus, FMV of Awards Granted this Year and that Vested this Year |
|
— |
|
— |
|
Plus, Change in Fair Value (from prior year-end) of Prior Year awards that Vested this year |
|
(1,213,431) |
|
(144,365) |
|
Less Prior Year Fair Value of Prior Year awards that Failed to vest this year |
|
— |
|
— |
|
Total Adjustments |
|
(5,630,676) |
|
(831,667) |
|
Compensation "Actually Paid" for Fiscal Year 2020 |
|
2,601,283 |
|
1,676,265 |
|
|
|
|
|
| Non-PEO NEO Average Total Compensation Amount |
$ 2,160,582
|
$ 1,945,846
|
$ 1,498,734
|
$ 2,507,932
|
| Non-PEO NEO Average Compensation Actually Paid Amount |
$ 3,296,957
|
3,331,189
|
864,158
|
1,676,265
|
| Adjustment to Non-PEO NEO Compensation Footnote |
(4)2023 Compensation "Actually Paid" to CEO#1 of $25,548,246 and the average Compensation "Actually Paid" to other NEOs reflects the following adjustments from total compensation reported in the Summary Compensation Table:
|
|
|
|
|
|
CEO#1 |
Average
Other NEOs |
Total Reported in 2023 Summary Compensation Table (SCT) |
18,596,895 |
|
2,160,582 |
|
Less, value of Stock Awards reported in SCT |
(15,215,909) |
|
(872,752) |
|
Plus, Year-End value of Awards Granted in Fiscal Year that are Unvested and Outstanding |
17,670,848 |
|
1,255,989 |
|
Plus, Change in Fair Value of Prior Year awards that are Outstanding and Unvested |
4,516,447 |
|
731,953 |
|
Plus, FMV of Awards Granted this Year and that Vested this Year |
— |
|
— |
|
Plus, Change in Fair Value (from prior year-end) of Prior Year awards that Vested this year |
(20,035) |
|
21,186 |
|
Less Prior Year Fair Value of Prior Year awards that Failed to vest this year |
— |
|
— |
|
Total Adjustments |
6,951,351 |
|
1,136,375 |
|
Compensation "Actually Paid" for Fiscal Year 2023 |
25,548,246 |
|
3,296,957 |
|
(5)2022 Compensation “Actually Paid” to CEO#1 of $10,067,617 was updated to $10,626,325 and the average Compensation “Actually Paid” to other NEOs of $3,272,287 was updated to $3,331,189 due to a correction of "Change in Fair Value of Prior Year awards that are Outstanding and Unvested". Below reflects the corrections and adjustments from total compensation reported in the Summary Compensation Table:
|
|
|
|
|
|
CEO#1 |
Average
Other NEOs |
Total Reported in 2022 Summary Compensation Table (SCT) |
6,973,806 |
|
1,945,846 |
|
Less, value of Stock Awards reported in SCT |
(4,730,700) |
|
(990,085) |
|
Plus, Year-End value of Awards Granted in Fiscal Year that are Unvested and Outstanding |
6,577,029 |
|
1,239,181 |
|
Plus, Change in Fair Value of Prior Year awards that are Outstanding and Unvested |
1,736,210 |
|
570,784 |
|
Plus, FMV of Awards Granted this Year and that Vested this Year |
— |
|
326,744 |
|
Plus, Change in Fair Value (from prior year-end) of Prior Year awards that Vested this year |
69,980 |
|
238,720 |
|
Less Prior Year Fair Value of Prior Year awards that Failed to vest this year |
— |
|
— |
|
Total Adjustments |
3,652,519 |
|
1,385,343 |
|
Compensation "Actually Paid" for Fiscal Year 2022 |
10,626,325 |
|
3,331,189 |
|
(6)2021 Compensation “Actually Paid” to CEO#1 of $3,971,476 was updated to $4,077,659, CEO#2 of $3,692,318 was updated to $3,822,001 and the average Compensation “Actually Paid” to other NEOs of $851,546 to $864,158 due to a correction of "Change in Fair Value of Prior Year awards that are Outstanding and Unvested". Below reflects the corrections and adjustments from total compensation reported in the Summary Compensation Table:
|
|
|
|
|
|
|
|
CEO#1 |
CEO#2 |
Average
Other NEOs |
Total Reported in 2021 Summary Compensation Table (SCT) |
5,348,118 |
|
7,119,599 |
|
1,498,734 |
|
Less, value of Stock Awards reported in SCT |
(3,895,113) |
|
(5,382,006) |
|
(829,496) |
|
Plus, Year-End value of Awards Granted in Fiscal Year that are Unvested and Outstanding |
3,339,277 |
|
4,853,848 |
|
748,094 |
|
Plus, Change in Fair Value of Prior Year awards that are Outstanding and Unvested |
(618,697) |
|
(2,264,902) |
|
(215,544) |
|
Plus, FMV of Awards Granted this Year and that Vested this Year |
— |
|
— |
|
— |
|
Plus, Change in Fair Value (from prior year-end) of Prior Year awards that Vested this year |
(95,926) |
|
(504,539) |
|
(337,629) |
|
Less Prior Year Fair Value of Prior Year awards that Failed to vest this year |
— |
|
— |
|
— |
|
Total Adjustments |
(1,270,459) |
|
(3,297,598) |
|
(634,576) |
|
Compensation "Actually Paid" for Fiscal Year 2021 |
4,077,659 |
|
3,822,001 |
|
864,158 |
|
(7)2020 Compensation “Actually Paid” to CEO#2 of $2,601,283 and the average Compensation “Actually Paid” to other NEOs reflects the following adjustments from total compensation reported in the Summary Compensation Table:
|
|
|
|
|
|
|
|
CEO#2 |
Average
Other NEOs |
Total Reported in 2020 Summary Compensation Table (SCT) |
|
8,231,959 |
|
2,507,932 |
|
Less, value of Stock Awards reported in SCT |
|
(4,974,490) |
|
(1,221,932) |
|
Plus, Year-End value of Awards Granted in Fiscal Year that are Unvested and Outstanding |
|
4,626,904 |
|
1,104,283 |
|
Plus, Change in Fair Value of Prior Year awards that are Outstanding and Unvested |
|
(4,069,659) |
|
(569,652) |
|
Plus, FMV of Awards Granted this Year and that Vested this Year |
|
— |
|
— |
|
Plus, Change in Fair Value (from prior year-end) of Prior Year awards that Vested this year |
|
(1,213,431) |
|
(144,365) |
|
Less Prior Year Fair Value of Prior Year awards that Failed to vest this year |
|
— |
|
— |
|
Total Adjustments |
|
(5,630,676) |
|
(831,667) |
|
Compensation "Actually Paid" for Fiscal Year 2020 |
|
2,601,283 |
|
1,676,265 |
|
|
|
|
|
| Compensation Actually Paid vs. Total Shareholder Return |
Relationship Between Compensation “Actually Paid” to our CEO and the Average of the Compensation “Actually Paid” to the Other NEOs and the Company’s Cumulative TSR. For 2020 and 2021, the Compensation “Actually Paid” to CEO #2 (Mr. Harrington) was 68% and 46% lower than Summary Compensation Table pay, while our TSR in each year was -12% and -8%. The average of the Compensation “Actually Paid” to the Other NEOs in 2020 and 2021 was 33% and 42% lower than the average Summary Compensation Table value. For 2022 and 2023, the Compensation “Actually Paid” to CEO #1 (Ms. Smith) increased by 52% and 37% relative to Summary Compensation Table pay, while our TSR in each year was +37% and +36%. Average Compensation “Actually Paid” to our NEOs was 71% and 53% higher than the average Summary Compensation Table value in 2022 and 2023.
|
|
|
|
| Compensation Actually Paid vs. Net Income |
Relationship Between Compensation “Actually Paid” to our CEO and the Average of the Compensation “Actually Paid” to the Other NEOs and the Company’s Net Income. For 2020 and 2021, the Compensation “Actually Paid” to CEO #2 (Mr. Harrington) was 68% and 46% lower than Summary Compensation Table pay, while our net income growth in each year was -18% and -35%. The average of the Compensation “Actually Paid” to the Other NEOs in 2020 and 2021 was 33% and 42% lower than the average Summary Compensation Table value. For 2022 and 2023, our Compensation “Actually Paid” to CEO #1 (Ms. Smith) increased by 52% and 37% relative to Summary Compensation Table pay, alongside an increase in net income of 51% and 67%. Average Compensation “Actually Paid” to our NEOs was 71% and 53% higher than the average Summary Compensation Table value in 2022 and 2023.
|
|
|
|
| Compensation Actually Paid vs. Company Selected Measure |
Relationship Between Compensation “Actually Paid” to our CEO and the Average of the Compensation “Actually Paid” to the Other NEOs and the Company’s Revenue. For 2020 and 2021, the Compensation “Actually Paid” to CEO #2 (Mr. Harrington) was 68% and 46% lower than Summary Compensation Table pay, while our revenue growth in each year was -1% and -7%. The average of the Compensation “Actually Paid” to the Other NEOs in 2020 and 2021 was 33% and 42% lower than the average Summary Compensation Table value. For 2022 and 2023, our Compensation “Actually Paid” to CEO #1 (Ms. Smith) increased by 52% and 37% relative to Summary Compensation Table pay, alongside an increase in revenue of 15% and 30%. Average Compensation “Actually Paid” to our NEOs was 71% and 53% higher than the average Summary Compensation Table value in 2022 and 2023.
|
|
|
|
| Tabular List, Table |
Performance Measures The following performance measures reflect the Company’s most important performance measures in effect for 2023, as further described and defined in the Compensation Discussion and Analysis under How We Performed in Fiscal 2023, Annual Cash Incentives and Long-Term Incentives. Revenue: Revenue as reported in financial statements, which excludes equity in earnings from unconsolidated joint ventures and bad debt expense.
|
Adjusted EBITDA: Earnings attributable to Parsons Corporation, adjusted to include earnings attributable to noncontrolling interests and to exclude interest expense (net of interest income), provision for income taxes, depreciation and amortization and certain other items that are not considered in the evaluation of ongoing operating performance. These other items include earnings attributable to noncontrolling interests, asset impairment charges, income and expense recognized on litigation matters, expenses incurred in connection with acquisitions and other non-recurring transaction costs and expenses related to restructuring. |
Awards: Awards booked into backlog generally represent the amount of revenue, excluding equity in earnings, expected to be earned in the future from funded and unfunded contract awards received during the period. Contract awards include both new and re-compete contracts and task orders. |
Cash Flow: Represents cash flow from operating activities as presented in the financial statements. |
Diversity: Global Gender and US Race/Ethnic representation. |
|
|
|
|
| Total Shareholder Return Amount |
$ 151.91
|
112.04
|
81.52
|
88.2
|
| Peer Group Total Shareholder Return Amount |
165.65
|
142.59
|
139.03
|
115.3
|
| Net Income (Loss) |
$ 161,149,000
|
$ 96,664,000
|
$ 64,072,000
|
$ 98,541,000
|
| Company Selected Measure Amount |
5,442,749,000
|
4,195,272,000
|
3,660,771,000
|
3,918,946,000
|
| Stock Price | $ / shares |
$ 62.71
|
$ 46.25
|
$ 33.65
|
$ 36.41
|
| Change In Share Price Percentage |
35.60%
|
37.40%
|
(7.58%)
|
(11.80%)
|
| Total Shareholder Return Percentage |
36.00%
|
37.00%
|
(8.00%)
|
(12.00%)
|
| Net Income Growth Rate |
67.00%
|
51.00%
|
(35.00%)
|
(18.00%)
|
| Nonpeo Neo Average Compensation Actually Paid Net Income |
53.00%
|
71.00%
|
42.00%
|
33.00%
|
| Revenue Growth Rate |
30.00%
|
15.00%
|
(7.00%)
|
(1.00%)
|
| Nonpeo Neo Average Compensation Actually Paid Revenue |
53.00%
|
71.00%
|
42.00%
|
33.00%
|
| Estimated Peer Group Shareholder Return Base On Three Year Criteria |
$ 141.75
|
|
|
|
| Estimated Peer Group Total Shareholder Return Base On Two Year Criteria |
|
$ 135.62
|
|
|
| Measure:: 1 |
|
|
|
|
| Pay vs Performance Disclosure |
|
|
|
|
| Name |
Revenue
|
|
|
|
| Measure:: 2 |
|
|
|
|
| Pay vs Performance Disclosure |
|
|
|
|
| Name |
Adjusted EBITDA
|
|
|
|
| Measure:: 3 |
|
|
|
|
| Pay vs Performance Disclosure |
|
|
|
|
| Name |
Awards
|
|
|
|
| Measure:: 4 |
|
|
|
|
| Pay vs Performance Disclosure |
|
|
|
|
| Name |
Cash Flow
|
|
|
|
| Measure:: 5 |
|
|
|
|
| Pay vs Performance Disclosure |
|
|
|
|
| Name |
Diversity
|
|
|
|
| Carey A Smith [Member] |
|
|
|
|
| Pay vs Performance Disclosure |
|
|
|
|
| PEO Total Compensation Amount |
$ 18,596,895
|
6,973,806
|
$ 5,348,118
|
|
| PEO Actually Paid Compensation Amount |
$ 25,548,246
|
$ 10,626,325
|
$ 4,077,659
|
|
| PEO Name |
Carey A. Smith
|
Carey A. Smith
|
Carey A. Smith
|
|
| Peo Compensation Actually Paid |
37.00%
|
52.00%
|
|
|
| Peo Actually Paid Compensation |
53.00%
|
71.00%
|
|
|
| Peo Compensation Actually Paid Net Income |
37.00%
|
52.00%
|
|
|
| PeoCompensation Actually Paid Revenue |
37.00%
|
52.00%
|
|
|
| Charles L Harrington [Member] |
|
|
|
|
| Pay vs Performance Disclosure |
|
|
|
|
| PEO Total Compensation Amount |
|
|
$ 7,119,599
|
$ 8,231,959
|
| PEO Actually Paid Compensation Amount |
|
|
$ 3,822,001
|
$ 2,601,283
|
| PEO Name |
|
|
Charles L. Harrington
|
Charles L. Harrington
|
| Peo Compensation Actually Paid |
|
|
46.00%
|
68.00%
|
| Peo Actually Paid Compensation |
|
|
42.00%
|
33.00%
|
| Peo Compensation Actually Paid Net Income |
|
|
46.00%
|
68.00%
|
| PeoCompensation Actually Paid Revenue |
|
|
46.00%
|
68.00%
|
| PEO | Carey A Smith [Member] | Value Of Stock Awards Reported In Sct [Member] |
|
|
|
|
| Pay vs Performance Disclosure |
|
|
|
|
| Adjustment to Compensation, Amount |
$ (15,215,909)
|
$ (4,730,700)
|
$ (3,895,113)
|
|
| PEO | Carey A Smith [Member] | Year End Value Of Awards Granted In Fiscal Year That Are Unvested And Outstanding [Member] |
|
|
|
|
| Pay vs Performance Disclosure |
|
|
|
|
| Adjustment to Compensation, Amount |
17,670,848
|
6,577,029
|
3,339,277
|
|
| PEO | Carey A Smith [Member] | Change In Fair Value Of Prior Year Awards That Are Outstanding And Unvested [Member] |
|
|
|
|
| Pay vs Performance Disclosure |
|
|
|
|
| Adjustment to Compensation, Amount |
4,516,447
|
1,736,210
|
(618,697)
|
|
| PEO | Carey A Smith [Member] | Change In Fair Value From Prior Year End Of Prior Year Awards [Member] |
|
|
|
|
| Pay vs Performance Disclosure |
|
|
|
|
| Adjustment to Compensation, Amount |
(20,035)
|
69,980
|
(95,926)
|
|
| PEO | Carey A Smith [Member] | Total Adjustments [Member] |
|
|
|
|
| Pay vs Performance Disclosure |
|
|
|
|
| Adjustment to Compensation, Amount |
6,951,351
|
3,652,519
|
(1,270,459)
|
|
| PEO | Carey A Smith [Member] | Before Correction of Change in Fair Value of Prior Year Awards, Outstanding and Unvested [Member] |
|
|
|
|
| Pay vs Performance Disclosure |
|
|
|
|
| Adjustment to Compensation, Amount |
|
10,067,617
|
3,971,476
|
|
| PEO | Charles L Harrington [Member] | Value Of Stock Awards Reported In Sct [Member] |
|
|
|
|
| Pay vs Performance Disclosure |
|
|
|
|
| Adjustment to Compensation, Amount |
|
|
(5,382,006)
|
$ (4,974,490)
|
| PEO | Charles L Harrington [Member] | Year End Value Of Awards Granted In Fiscal Year That Are Unvested And Outstanding [Member] |
|
|
|
|
| Pay vs Performance Disclosure |
|
|
|
|
| Adjustment to Compensation, Amount |
|
|
4,853,848
|
4,626,904
|
| PEO | Charles L Harrington [Member] | Change In Fair Value Of Prior Year Awards That Are Outstanding And Unvested [Member] |
|
|
|
|
| Pay vs Performance Disclosure |
|
|
|
|
| Adjustment to Compensation, Amount |
|
|
(2,264,902)
|
(4,069,659)
|
| PEO | Charles L Harrington [Member] | Change In Fair Value From Prior Year End Of Prior Year Awards [Member] |
|
|
|
|
| Pay vs Performance Disclosure |
|
|
|
|
| Adjustment to Compensation, Amount |
|
|
(504,539)
|
(1,213,431)
|
| PEO | Charles L Harrington [Member] | Total Adjustments [Member] |
|
|
|
|
| Pay vs Performance Disclosure |
|
|
|
|
| Adjustment to Compensation, Amount |
|
|
(3,297,598)
|
(5,630,676)
|
| PEO | Charles L Harrington [Member] | Before Correction of Change in Fair Value of Prior Year Awards, Outstanding and Unvested [Member] |
|
|
|
|
| Pay vs Performance Disclosure |
|
|
|
|
| Adjustment to Compensation, Amount |
|
|
3,692,318
|
|
| Non-PEO NEO | Value Of Stock Awards Reported In Sct [Member] |
|
|
|
|
| Pay vs Performance Disclosure |
|
|
|
|
| Adjustment to Compensation, Amount |
(872,752)
|
(990,085)
|
(829,496)
|
(1,221,932)
|
| Non-PEO NEO | Year End Value Of Awards Granted In Fiscal Year That Are Unvested And Outstanding [Member] |
|
|
|
|
| Pay vs Performance Disclosure |
|
|
|
|
| Adjustment to Compensation, Amount |
1,255,989
|
1,239,181
|
748,094
|
1,104,283
|
| Non-PEO NEO | Change In Fair Value Of Prior Year Awards That Are Outstanding And Unvested [Member] |
|
|
|
|
| Pay vs Performance Disclosure |
|
|
|
|
| Adjustment to Compensation, Amount |
731,953
|
570,784
|
(215,544)
|
(569,652)
|
| Non-PEO NEO | Fmv Of Awards Granted This Year And That Vested This Year [Member] |
|
|
|
|
| Pay vs Performance Disclosure |
|
|
|
|
| Adjustment to Compensation, Amount |
|
326,744
|
|
|
| Non-PEO NEO | Change In Fair Value From Prior Year End Of Prior Year Awards [Member] |
|
|
|
|
| Pay vs Performance Disclosure |
|
|
|
|
| Adjustment to Compensation, Amount |
21,186
|
238,720
|
(337,629)
|
(144,365)
|
| Non-PEO NEO | Total Adjustments [Member] |
|
|
|
|
| Pay vs Performance Disclosure |
|
|
|
|
| Adjustment to Compensation, Amount |
$ 1,136,375
|
1,385,343
|
(634,576)
|
$ (831,667)
|
| Non-PEO NEO | Before Correction of Change in Fair Value of Prior Year Awards, Outstanding and Unvested [Member] |
|
|
|
|
| Pay vs Performance Disclosure |
|
|
|
|
| Adjustment to Compensation, Amount |
|
$ 3,272,287
|
$ 851,546
|
|
| X |
- ReferencesReference 1: http://www.xbrl.org/2003/role/presentationRef
-Publisher SEC
-Name Regulation S-K
-Number 229
-Section 402
-Subsection v
-Paragraph 3
| Name: |
ecd_AdjToCompAmt |
| Namespace Prefix: |
ecd_ |
| Data Type: |
xbrli:monetaryItemType |
| Balance Type: |
na |
| Period Type: |
duration |
|
| X |
- ReferencesReference 1: http://www.xbrl.org/2003/role/presentationRef
-Publisher SEC
-Name Regulation S-K
-Number 229
-Section 402
-Subsection v
-Paragraph 3
| Name: |
ecd_AdjToNonPeoNeoCompFnTextBlock |
| Namespace Prefix: |
ecd_ |
| Data Type: |
dtr-types:textBlockItemType |
| Balance Type: |
na |
| Period Type: |
duration |
|
| X |
- ReferencesReference 1: http://www.xbrl.org/2003/role/presentationRef
-Publisher SEC
-Name Regulation S-K
-Number 229
-Section 402
-Subsection v
-Paragraph 3
| Name: |
ecd_AdjToPeoCompFnTextBlock |
| Namespace Prefix: |
ecd_ |
| Data Type: |
dtr-types:textBlockItemType |
| Balance Type: |
na |
| Period Type: |
duration |
|
| X |
- ReferencesReference 1: http://www.xbrl.org/2003/role/presentationRef
-Publisher SEC
-Name Regulation S-K
-Number 229
-Section 402
-Subsection v
-Paragraph 2
-Subparagraph vi
| Name: |
ecd_CoSelectedMeasureAmt |
| Namespace Prefix: |
ecd_ |
| Data Type: |
xbrli:decimalItemType |
| Balance Type: |
na |
| Period Type: |
duration |
|
| X |
- ReferencesReference 1: http://www.xbrl.org/2003/role/presentationRef
-Publisher SEC
-Name Regulation S-K
-Number 229
-Section 402
-Subsection v
-Paragraph 2
-Subparagraph vi
| Name: |
ecd_CoSelectedMeasureName |
| Namespace Prefix: |
ecd_ |
| Data Type: |
xbrli:normalizedStringItemType |
| Balance Type: |
na |
| Period Type: |
duration |
|
| X |
- ReferencesReference 1: http://www.xbrl.org/2003/role/presentationRef
-Publisher SEC
-Name Regulation S-K
-Number 229
-Section 402
-Subsection v
-Paragraph 5
-Subparagraph iii
| Name: |
ecd_CompActuallyPaidVsCoSelectedMeasureTextBlock |
| Namespace Prefix: |
ecd_ |
| Data Type: |
dtr-types:textBlockItemType |
| Balance Type: |
na |
| Period Type: |
duration |
|
| X |
- ReferencesReference 1: http://www.xbrl.org/2003/role/presentationRef
-Publisher SEC
-Name Regulation S-K
-Number 229
-Section 402
-Subsection v
-Paragraph 5
-Subparagraph ii
| Name: |
ecd_CompActuallyPaidVsNetIncomeTextBlock |
| Namespace Prefix: |
ecd_ |
| Data Type: |
dtr-types:textBlockItemType |
| Balance Type: |
na |
| Period Type: |
duration |
|
| X |
- ReferencesReference 1: http://www.xbrl.org/2003/role/presentationRef
-Publisher SEC
-Name Regulation S-K
-Number 229
-Section 402
-Subsection v
-Paragraph 5
-Subparagraph i
| Name: |
ecd_CompActuallyPaidVsTotalShareholderRtnTextBlock |
| Namespace Prefix: |
ecd_ |
| Data Type: |
dtr-types:textBlockItemType |
| Balance Type: |
na |
| Period Type: |
duration |
|
| X |
- ReferencesReference 1: http://www.xbrl.org/2003/role/presentationRef
-Publisher SEC
-Name Regulation S-K
-Number 229
-Section 402
-Subsection v
-Paragraph 2
-Subparagraph vi
| Name: |
ecd_MeasureName |
| Namespace Prefix: |
ecd_ |
| Data Type: |
xbrli:normalizedStringItemType |
| Balance Type: |
na |
| Period Type: |
duration |
|
| X |
- ReferencesReference 1: http://www.xbrl.org/2003/role/presentationRef
-Publisher SEC
-Name Regulation S-K
-Number 229
-Section 402
-Subsection v
-Paragraph 3
| Name: |
ecd_NamedExecutiveOfficersFnTextBlock |
| Namespace Prefix: |
ecd_ |
| Data Type: |
dtr-types:textBlockItemType |
| Balance Type: |
na |
| Period Type: |
duration |
|
| X |
- ReferencesReference 1: http://www.xbrl.org/2003/role/presentationRef
-Publisher SEC
-Name Regulation S-K
-Number 229
-Section 402
-Subsection v
-Paragraph 2
-Subparagraph iii
| Name: |
ecd_NonPeoNeoAvgCompActuallyPaidAmt |
| Namespace Prefix: |
ecd_ |
| Data Type: |
xbrli:monetaryItemType |
| Balance Type: |
na |
| Period Type: |
duration |
|
| X |
- ReferencesReference 1: http://www.xbrl.org/2003/role/presentationRef
-Publisher SEC
-Name Regulation S-K
-Number 229
-Section 402
-Subsection v
-Paragraph 2
-Subparagraph ii
| Name: |
ecd_NonPeoNeoAvgTotalCompAmt |
| Namespace Prefix: |
ecd_ |
| Data Type: |
xbrli:monetaryItemType |
| Balance Type: |
na |
| Period Type: |
duration |
|
| X |
- ReferencesReference 1: http://www.xbrl.org/2003/role/presentationRef
-Publisher SEC
-Name Regulation S-K
-Number 229
-Section 402
-Subsection v
-Paragraph 2
-Subparagraph iv
| Name: |
ecd_PeerGroupIssuersFnTextBlock |
| Namespace Prefix: |
ecd_ |
| Data Type: |
dtr-types:textBlockItemType |
| Balance Type: |
na |
| Period Type: |
duration |
|
| X |
- ReferencesReference 1: http://www.xbrl.org/2003/role/presentationRef
-Publisher SEC
-Name Regulation S-K
-Number 229
-Section 402
-Subsection v
-Paragraph 2
-Subparagraph iv
| Name: |
ecd_PeerGroupTotalShareholderRtnAmt |
| Namespace Prefix: |
ecd_ |
| Data Type: |
xbrli:monetaryItemType |
| Balance Type: |
na |
| Period Type: |
duration |
|
| X |
- ReferencesReference 1: http://www.xbrl.org/2003/role/presentationRef
-Publisher SEC
-Name Regulation S-K
-Number 229
-Section 402
-Subsection v
-Paragraph 2
-Subparagraph iii
| Name: |
ecd_PeoActuallyPaidCompAmt |
| Namespace Prefix: |
ecd_ |
| Data Type: |
xbrli:monetaryItemType |
| Balance Type: |
na |
| Period Type: |
duration |
|
| X |
- ReferencesReference 1: http://www.xbrl.org/2003/role/presentationRef
-Publisher SEC
-Name Regulation S-K
-Number 229
-Section 402
-Subsection v
-Paragraph 3
| Name: |
ecd_PeoName |
| Namespace Prefix: |
ecd_ |
| Data Type: |
xbrli:normalizedStringItemType |
| Balance Type: |
na |
| Period Type: |
duration |
|
| X |
- ReferencesReference 1: http://www.xbrl.org/2003/role/presentationRef
-Publisher SEC
-Name Regulation S-K
-Number 229
-Section 402
-Subsection v
-Paragraph 2
-Subparagraph ii
| Name: |
ecd_PeoTotalCompAmt |
| Namespace Prefix: |
ecd_ |
| Data Type: |
xbrli:monetaryItemType |
| Balance Type: |
na |
| Period Type: |
duration |
|
| X |
- ReferencesReference 1: http://www.xbrl.org/2003/role/presentationRef
-Publisher SEC
-Name Regulation S-K
-Number 229
-Section 402
-Subsection v
-Paragraph 1
| Name: |
ecd_PvpTable |
| Namespace Prefix: |
ecd_ |
| Data Type: |
xbrli:stringItemType |
| Balance Type: |
na |
| Period Type: |
duration |
|
| X |
- ReferencesReference 1: http://www.xbrl.org/2003/role/presentationRef
-Publisher SEC
-Name Regulation S-K
-Number 229
-Section 402
-Subsection v
-Paragraph 1
| Name: |
ecd_PvpTableTextBlock |
| Namespace Prefix: |
ecd_ |
| Data Type: |
dtr-types:textBlockItemType |
| Balance Type: |
na |
| Period Type: |
duration |
|
| X |
- ReferencesReference 1: http://www.xbrl.org/2003/role/presentationRef
-Publisher SEC
-Name Regulation S-K
-Number 229
-Section 402
-Subsection v
-Paragraph 6
| Name: |
ecd_TabularListTableTextBlock |
| Namespace Prefix: |
ecd_ |
| Data Type: |
dtr-types:textBlockItemType |
| Balance Type: |
na |
| Period Type: |
duration |
|
| X |
- ReferencesReference 1: http://www.xbrl.org/2003/role/presentationRef
-Publisher SEC
-Name Regulation S-K
-Number 229
-Section 402
-Subsection v
-Paragraph 2
-Subparagraph iv
| Name: |
ecd_TotalShareholderRtnAmt |
| Namespace Prefix: |
ecd_ |
| Data Type: |
xbrli:monetaryItemType |
| Balance Type: |
na |
| Period Type: |
duration |
|
| X |
- DefinitionChange in share price percentage.
| Name: |
psn_ChangeInSharePricePercentage |
| Namespace Prefix: |
psn_ |
| Data Type: |
dtr-types:percentItemType |
| Balance Type: |
na |
| Period Type: |
duration |
|
| X |
- DefinitionEstimated Peer Group Shareholder Return Base On Three Year Criteria
| Name: |
psn_EstimatedPeerGroupShareholderReturnBaseOnThreeYearCriteria |
| Namespace Prefix: |
psn_ |
| Data Type: |
xbrli:monetaryItemType |
| Balance Type: |
credit |
| Period Type: |
duration |
|
| X |
- DefinitionEstimated Peer Group Total Shareholder Return Base On Two Year Criteria.
| Name: |
psn_EstimatedPeerGroupTotalShareholderReturnBaseOnTwoYearCriteria |
| Namespace Prefix: |
psn_ |
| Data Type: |
xbrli:monetaryItemType |
| Balance Type: |
debit |
| Period Type: |
duration |
|
| X |
- DefinitionNonpeo neo average compensation actually paid net income.
| Name: |
psn_NonpeoNeoAverageCompensationActuallyPaidNetIncome |
| Namespace Prefix: |
psn_ |
| Data Type: |
dtr-types:percentItemType |
| Balance Type: |
na |
| Period Type: |
duration |
|
| X |
- DefinitionNonpeo neo average compensation actually paid revenue.
| Name: |
psn_NonpeoNeoAverageCompensationActuallyPaidRevenue |
| Namespace Prefix: |
psn_ |
| Data Type: |
dtr-types:percentItemType |
| Balance Type: |
na |
| Period Type: |
duration |
|
| X |
- DefinitionPeo actually paid compensation.
| Name: |
psn_PeoActuallyPaidCompensation |
| Namespace Prefix: |
psn_ |
| Data Type: |
dtr-types:percentItemType |
| Balance Type: |
na |
| Period Type: |
duration |
|
| X |
- DefinitionPeo compensation actually paid.
| Name: |
psn_PeoCompensationActuallyPaid |
| Namespace Prefix: |
psn_ |
| Data Type: |
dtr-types:percentItemType |
| Balance Type: |
na |
| Period Type: |
duration |
|
| X |
- DefinitionPeo compensation actually paid net income.
| Name: |
psn_PeoCompensationActuallyPaidNetIncome |
| Namespace Prefix: |
psn_ |
| Data Type: |
dtr-types:percentItemType |
| Balance Type: |
na |
| Period Type: |
duration |
|
| X |
- DefinitionPeo compensation actually paid revenue.
| Name: |
psn_PeocompensationActuallyPaidRevenue |
| Namespace Prefix: |
psn_ |
| Data Type: |
dtr-types:percentItemType |
| Balance Type: |
na |
| Period Type: |
duration |
|
| X |
- DefinitionTotal shareholder return percentage.
| Name: |
psn_TotalShareholderReturnPercentage |
| Namespace Prefix: |
psn_ |
| Data Type: |
dtr-types:percentItemType |
| Balance Type: |
na |
| Period Type: |
duration |
|
| X |
- DefinitionThe portion of profit or loss for the period, net of income taxes, which is attributable to the parent. Reference 1: http://www.xbrl.org/2003/role/disclosureRef
-Topic 235
-SubTopic 10
-Name Accounting Standards Codification
-Section S99
-Paragraph 1
-Subparagraph (SX 210.4-08(g)(1)(ii))
-Publisher FASB
-URI https://asc.fasb.org//1943274/2147480678/235-10-S99-1
Reference 2: http://www.xbrl.org/2003/role/disclosureRef
-Topic 323
-SubTopic 10
-Name Accounting Standards Codification
-Section 50
-Paragraph 3
-Subparagraph (c)
-Publisher FASB
-URI https://asc.fasb.org//1943274/2147481687/323-10-50-3
Reference 3: http://www.xbrl.org/2003/role/disclosureRef
-Topic 825
-SubTopic 10
-Name Accounting Standards Codification
-Section 50
-Paragraph 28
-Subparagraph (f)
-Publisher FASB
-URI https://asc.fasb.org//1943274/2147482907/825-10-50-28
Reference 4: http://www.xbrl.org/2003/role/disclosureRef
-Topic 220
-SubTopic 10
-Name Accounting Standards Codification
-Section 50
-Paragraph 6
-Publisher FASB
-URI https://asc.fasb.org//1943274/2147482765/220-10-50-6
Reference 5: http://www.xbrl.org/2003/role/disclosureRef
-Topic 250
-SubTopic 10
-Name Accounting Standards Codification
-Section 50
-Paragraph 3
-Publisher FASB
-URI https://asc.fasb.org//1943274/2147483443/250-10-50-3
Reference 6: http://www.xbrl.org/2003/role/disclosureRef
-Topic 250
-SubTopic 10
-Name Accounting Standards Codification
-Section 50
-Paragraph 1
-Subparagraph (b)(2)
-Publisher FASB
-URI https://asc.fasb.org//1943274/2147483443/250-10-50-1
Reference 7: http://www.xbrl.org/2003/role/disclosureRef
-Topic 815
-SubTopic 40
-Name Accounting Standards Codification
-Section 65
-Paragraph 1
-Subparagraph (f)
-Publisher FASB
-URI https://asc.fasb.org//1943274/2147480175/815-40-65-1
Reference 8: http://www.xbrl.org/2003/role/disclosureRef
-Topic 250
-SubTopic 10
-Name Accounting Standards Codification
-Section 50
-Paragraph 8
-Publisher FASB
-URI https://asc.fasb.org//1943274/2147483443/250-10-50-8
Reference 9: http://www.xbrl.org/2003/role/disclosureRef
-Topic 250
-SubTopic 10
-Name Accounting Standards Codification
-Section 50
-Paragraph 9
-Publisher FASB
-URI https://asc.fasb.org//1943274/2147483443/250-10-50-9
Reference 10: http://www.xbrl.org/2003/role/disclosureRef
-Topic 250
-SubTopic 10
-Name Accounting Standards Codification
-Section 50
-Paragraph 11
-Subparagraph (a)
-Publisher FASB
-URI https://asc.fasb.org//1943274/2147483443/250-10-50-11
Reference 11: http://www.xbrl.org/2003/role/disclosureRef
-Topic 250
-SubTopic 10
-Name Accounting Standards Codification
-Section 50
-Paragraph 11
-Subparagraph (b)
-Publisher FASB
-URI https://asc.fasb.org//1943274/2147483443/250-10-50-11
Reference 12: http://www.xbrl.org/2003/role/disclosureRef
-Topic 250
-SubTopic 10
-Name Accounting Standards Codification
-Section 50
-Paragraph 4
-Publisher FASB
-URI https://asc.fasb.org//1943274/2147483443/250-10-50-4
Reference 13: http://www.xbrl.org/2003/role/exampleRef
-Topic 946
-SubTopic 830
-Name Accounting Standards Codification
-Section 55
-Paragraph 10
-Publisher FASB
-URI https://asc.fasb.org//1943274/2147480167/946-830-55-10
Reference 14: http://www.xbrl.org/2003/role/disclosureRef
-Topic 946
-SubTopic 220
-Name Accounting Standards Codification
-Section 45
-Paragraph 7
-Publisher FASB
-URI https://asc.fasb.org//1943274/2147483581/946-220-45-7
Reference 15: http://www.xbrl.org/2003/role/disclosureRef
-Topic 944
-SubTopic 220
-Name Accounting Standards Codification
-Section S99
-Paragraph 1
-Subparagraph (SX 210.7-04(18))
-Publisher FASB
-URI https://asc.fasb.org//1943274/2147483586/944-220-S99-1
Reference 16: http://www.xbrl.org/2003/role/disclosureRef
-Topic 280
-SubTopic 10
-Name Accounting Standards Codification
-Section 50
-Paragraph 22
-Publisher FASB
-URI https://asc.fasb.org//1943274/2147482810/280-10-50-22
Reference 17: http://www.xbrl.org/2003/role/disclosureRef
-Topic 946
-SubTopic 220
-Name Accounting Standards Codification
-Section S99
-Paragraph 1
-Subparagraph (SX 210.6-07(9))
-Publisher FASB
-URI https://asc.fasb.org//1943274/2147483575/946-220-S99-1
Reference 18: http://www.xbrl.org/2003/role/disclosureRef
-Topic 946
-SubTopic 220
-Name Accounting Standards Codification
-Section S99
-Paragraph 3
-Subparagraph (SX 210.6-09(1)(d))
-Publisher FASB
-URI https://asc.fasb.org//1943274/2147483575/946-220-S99-3
Reference 19: http://www.xbrl.org/2003/role/disclosureRef
-Topic 470
-SubTopic 10
-Name Accounting Standards Codification
-Section S99
-Paragraph 1A
-Subparagraph (SX 210.13-01(a)(4)(i))
-Publisher FASB
-URI https://asc.fasb.org//1943274/2147480097/470-10-S99-1A
Reference 20: http://www.xbrl.org/2009/role/commonPracticeRef
-Topic 470
-SubTopic 10
-Name Accounting Standards Codification
-Section S99
-Paragraph 1A
-Subparagraph (SX 210.13-01(a)(4)(ii))
-Publisher FASB
-URI https://asc.fasb.org//1943274/2147480097/470-10-S99-1A
Reference 21: http://www.xbrl.org/2003/role/disclosureRef
-Topic 470
-SubTopic 10
-Name Accounting Standards Codification
-Section S99
-Paragraph 1A
-Subparagraph (SX 210.13-01(a)(4)(iii)(A))
-Publisher FASB
-URI https://asc.fasb.org//1943274/2147480097/470-10-S99-1A
Reference 22: http://www.xbrl.org/2003/role/disclosureRef
-Topic 470
-SubTopic 10
-Name Accounting Standards Codification
-Section S99
-Paragraph 1A
-Subparagraph (SX 210.13-01(a)(4)(iv))
-Publisher FASB
-URI https://asc.fasb.org//1943274/2147480097/470-10-S99-1A
Reference 23: http://www.xbrl.org/2003/role/disclosureRef
-Topic 470
-SubTopic 10
-Name Accounting Standards Codification
-Section S99
-Paragraph 1A
-Subparagraph (SX 210.13-01(a)(5))
-Publisher FASB
-URI https://asc.fasb.org//1943274/2147480097/470-10-S99-1A
Reference 24: http://www.xbrl.org/2003/role/disclosureRef
-Topic 470
-SubTopic 10
-Name Accounting Standards Codification
-Section S99
-Paragraph 1B
-Subparagraph (SX 210.13-02(a)(4)(i))
-Publisher FASB
-URI https://asc.fasb.org//1943274/2147480097/470-10-S99-1B
Reference 25: http://www.xbrl.org/2003/role/disclosureRef
-Topic 470
-SubTopic 10
-Name Accounting Standards Codification
-Section S99
-Paragraph 1B
-Subparagraph (SX 210.13-02(a)(4)(iii)(A))
-Publisher FASB
-URI https://asc.fasb.org//1943274/2147480097/470-10-S99-1B
Reference 26: http://www.xbrl.org/2003/role/disclosureRef
-Topic 470
-SubTopic 10
-Name Accounting Standards Codification
-Section S99
-Paragraph 1B
-Subparagraph (SX 210.13-02(a)(4)(iii)(B))
-Publisher FASB
-URI https://asc.fasb.org//1943274/2147480097/470-10-S99-1B
Reference 27: http://www.xbrl.org/2003/role/disclosureRef
-Topic 470
-SubTopic 10
-Name Accounting Standards Codification
-Section S99
-Paragraph 1B
-Subparagraph (SX 210.13-02(a)(4)(iv))
-Publisher FASB
-URI https://asc.fasb.org//1943274/2147480097/470-10-S99-1B
Reference 28: http://www.xbrl.org/2003/role/disclosureRef
-Topic 470
-SubTopic 10
-Name Accounting Standards Codification
-Section S99
-Paragraph 1B
-Subparagraph (SX 210.13-02(a)(5))
-Publisher FASB
-URI https://asc.fasb.org//1943274/2147480097/470-10-S99-1B
Reference 29: http://www.xbrl.org/2003/role/disclosureRef
-Topic 280
-SubTopic 10
-Name Accounting Standards Codification
-Section 50
-Paragraph 30
-Subparagraph (b)
-Publisher FASB
-URI https://asc.fasb.org//1943274/2147482810/280-10-50-30
Reference 30: http://www.xbrl.org/2003/role/disclosureRef
-Topic 280
-SubTopic 10
-Name Accounting Standards Codification
-Section 50
-Paragraph 32
-Subparagraph (f)
-Publisher FASB
-URI https://asc.fasb.org//1943274/2147482810/280-10-50-32
Reference 31: http://www.xbrl.org/2003/role/disclosureRef
-Topic 260
-SubTopic 10
-Name Accounting Standards Codification
-Section 45
-Paragraph 60B
-Subparagraph (a)
-Publisher FASB
-URI https://asc.fasb.org//1943274/2147482689/260-10-45-60B
Reference 32: http://www.xbrl.org/2003/role/exampleRef
-Topic 280
-SubTopic 10
-Name Accounting Standards Codification
-Section 50
-Paragraph 31
-Publisher FASB
-URI https://asc.fasb.org//1943274/2147482810/280-10-50-31
Reference 33: http://www.xbrl.org/2003/role/disclosureRef
-Topic 280
-SubTopic 10
-Name Accounting Standards Codification
-Section 50
-Paragraph 32
-Subparagraph (c)
-Publisher FASB
-URI https://asc.fasb.org//1943274/2147482810/280-10-50-32
Reference 34: http://www.xbrl.org/2003/role/disclosureRef
-Topic 205
-SubTopic 20
-Name Accounting Standards Codification
-Section 50
-Paragraph 7
-Publisher FASB
-URI https://asc.fasb.org//1943274/2147483499/205-20-50-7
Reference 35: http://fasb.org/us-gaap/role/ref/legacyRef
-Topic 230
-SubTopic 10
-Name Accounting Standards Codification
-Section 45
-Paragraph 28
-Publisher FASB
-URI https://asc.fasb.org//1943274/2147482740/230-10-45-28
Reference 36: http://www.xbrl.org/2003/role/disclosureRef
-Topic 220
-SubTopic 10
-Name Accounting Standards Codification
-Section 45
-Paragraph 1A
-Subparagraph (a)
-Publisher FASB
-URI https://asc.fasb.org//1943274/2147482790/220-10-45-1A
Reference 37: http://www.xbrl.org/2003/role/disclosureRef
-Topic 220
-SubTopic 10
-Name Accounting Standards Codification
-Section 45
-Paragraph 1B
-Subparagraph (a)
-Publisher FASB
-URI https://asc.fasb.org//1943274/2147482790/220-10-45-1B
Reference 38: http://fasb.org/us-gaap/role/ref/legacyRef
-Topic 220
-SubTopic 10
-Name Accounting Standards Codification
-Section S99
-Paragraph 2
-Subparagraph (SX 210.5-03(20))
-Publisher FASB
-URI https://asc.fasb.org//1943274/2147483621/220-10-S99-2
Reference 39: http://fasb.org/us-gaap/role/ref/legacyRef
-Topic 942
-SubTopic 220
-Name Accounting Standards Codification
-Section S99
-Paragraph 1
-Subparagraph (SX 210.9-04(22))
-Publisher FASB
-URI https://asc.fasb.org//1943274/2147483589/942-220-S99-1
| Name: |
us-gaap_NetIncomeLoss |
| Namespace Prefix: |
us-gaap_ |
| Data Type: |
xbrli:monetaryItemType |
| Balance Type: |
credit |
| Period Type: |
duration |
|
| X |
- Details
| Name: |
ecd_MeasureAxis=1 |
| Namespace Prefix: |
|
| Data Type: |
na |
| Balance Type: |
|
| Period Type: |
|
|
| X |
- Details
| Name: |
ecd_MeasureAxis=2 |
| Namespace Prefix: |
|
| Data Type: |
na |
| Balance Type: |
|
| Period Type: |
|
|
| X |
- Details
| Name: |
ecd_MeasureAxis=3 |
| Namespace Prefix: |
|
| Data Type: |
na |
| Balance Type: |
|
| Period Type: |
|
|
| X |
- Details
| Name: |
ecd_MeasureAxis=4 |
| Namespace Prefix: |
|
| Data Type: |
na |
| Balance Type: |
|
| Period Type: |
|
|
| X |
- Details
| Name: |
ecd_MeasureAxis=5 |
| Namespace Prefix: |
|
| Data Type: |
na |
| Balance Type: |
|
| Period Type: |
|
|
| X |
- Details
| Name: |
ecd_IndividualAxis=psn_CareyASmithMember |
| Namespace Prefix: |
|
| Data Type: |
na |
| Balance Type: |
|
| Period Type: |
|
|
| X |
- Details
| Name: |
ecd_IndividualAxis=psn_CharlesLHarringtonMember |
| Namespace Prefix: |
|
| Data Type: |
na |
| Balance Type: |
|
| Period Type: |
|
|
| X |
- Details
| Name: |
ecd_ExecutiveCategoryAxis=ecd_PeoMember |
| Namespace Prefix: |
|
| Data Type: |
na |
| Balance Type: |
|
| Period Type: |
|
|
| X |
- Details
| Name: |
ecd_AdjToCompAxis=psn_ValueOfStockAwardsReportedInSctMember |
| Namespace Prefix: |
|
| Data Type: |
na |
| Balance Type: |
|
| Period Type: |
|
|
| X |
- Details
| Name: |
ecd_AdjToCompAxis=psn_YearEndValueOfAwardsGrantedInFiscalYearThatAreUnvestedAndOutstandingMember |
| Namespace Prefix: |
|
| Data Type: |
na |
| Balance Type: |
|
| Period Type: |
|
|
| X |
- Details
| Name: |
ecd_AdjToCompAxis=psn_ChangeInFairValueOfPriorYearAwardsThatAreOutstandingAndUnvestedMember |
| Namespace Prefix: |
|
| Data Type: |
na |
| Balance Type: |
|
| Period Type: |
|
|
| X |
- Details
| Name: |
ecd_AdjToCompAxis=psn_ChangeInFairValueFromPriorYearEndOfPriorYearAwardsMember |
| Namespace Prefix: |
|
| Data Type: |
na |
| Balance Type: |
|
| Period Type: |
|
|
| X |
- Details
| Name: |
ecd_AdjToCompAxis=psn_TotalAdjustmentsMember |
| Namespace Prefix: |
|
| Data Type: |
na |
| Balance Type: |
|
| Period Type: |
|
|
| X |
- Details
| Name: |
ecd_AdjToCompAxis=psn_BeforeCorrectionOfChangeInFairValueOfPriorYearAwardsOutstandingAndUnvestedMember |
| Namespace Prefix: |
|
| Data Type: |
na |
| Balance Type: |
|
| Period Type: |
|
|
| X |
- Details
| Name: |
ecd_ExecutiveCategoryAxis=ecd_NonPeoNeoMember |
| Namespace Prefix: |
|
| Data Type: |
na |
| Balance Type: |
|
| Period Type: |
|
|
| X |
- Details
| Name: |
ecd_AdjToCompAxis=psn_FmvOfAwardsGrantedThisYearAndThatVestedThisYearMember |
| Namespace Prefix: |
|
| Data Type: |
na |
| Balance Type: |
|
| Period Type: |
|
|
Parsons (NYSE:PSN)
Historical Stock Chart
From Apr 2024 to May 2024

Parsons (NYSE:PSN)
Historical Stock Chart
From May 2023 to May 2024
