NATIONAL FUEL GAS CO false 0000070145 0000070145 2024-02-07 2024-02-07
UNITED STATES
SECURITIES AND EXCHANGE COMMISSION
Washington, D.C. 20549
FORM 8-K
CURRENT REPORT
Pursuant to Section 13 or 15(d)
of the Securities Exchange Act of 1934
Date of Report (Date of earliest event reported): February 7, 2024
NATIONAL FUEL GAS COMPANY
(Exact name of registrant as specified in its charter)
|
|
|
|
|
| New Jersey |
|
1-3880 |
|
13-1086010 |
(State or other jurisdiction
of incorporation) |
|
(Commission
File Number) |
|
(IRS Employer
Identification No.) |
|
|
|
| 6363 Main Street, Williamsville, New York |
|
14221 |
| (Address of principal executive offices) |
|
(Zip Code) |
Registrant’s telephone number, including area code: (716) 857-7000
Former name or former address, if changed since last report: Not Applicable
Check the appropriate box below if the Form 8-K filing is intended to simultaneously satisfy the filing obligation of the registrant under any of the following provisions (see General Instruction A.2. below):
| ☐ |
Written communications pursuant to Rule 425 under the Securities Act (17 CFR 230.425) |
| ☐ |
Soliciting material pursuant to Rule 14a-12 under the Exchange Act (17 CFR 240.14a-12) |
| ☐ |
Pre-commencement communications pursuant to Rule 14d-2(b) under the Exchange Act (17 CFR 240.14d-2(b)) |
| ☐ |
Pre-commencement communications pursuant to Rule 13e-4(c) under the Exchange Act (17 CFR 240.13e-4(c)) |
Securities registered pursuant to Section 12(b) of the Act:
|
|
|
|
|
| Title of each class |
|
Trading
Symbol |
|
Name of Each Exchange
on Which Registered |
| Common Stock, par value $1.00 per share |
|
NFG |
|
New York Stock Exchange |
Indicate by check mark whether the registrant is an emerging growth company as defined in Rule 405 of the Securities Act of 1933 (§230.405 of this chapter) or Rule 12b-2 of the Securities Exchange Act of 1934 (§240.12b-2 of this chapter).
Emerging growth company ☐
If an emerging growth company, indicate by check mark if the registrant has elected not to use the extended transition period for complying with any new or revised financial accounting standards provided pursuant to Section 13(a) of the Exchange Act. ☐
| Item 7.01 |
Regulation FD Disclosure. |
On February 7, 2024, National Fuel Gas Company (the “Company”) updated its Investor Presentation. A copy of the presentation is furnished as part of this Current Report as Exhibit 99.
Neither the furnishing of the presentation as an exhibit to this Current Report nor the inclusion in such presentation of any reference to the Company’s internet address shall, under any circumstances, be deemed to incorporate the information available at such internet address into this Current Report. The information available at the Company’s internet address is not part of this Current Report or any other report filed or furnished by the Company with the Securities and Exchange Commission.
In addition to financial measures calculated in accordance with generally accepted accounting principles (“GAAP”), the press release furnished as part of this Current Report as Exhibit 99 contains certain non-GAAP financial measures. The Company believes that such non-GAAP financial measures are useful to investors because they provide an alternative method for assessing the Company’s operating results in a manner that is focused on the performance of the Company’s ongoing operations, for measuring the Company’s cash flow and liquidity, and for comparing the Company’s financial performance to other companies. The Company’s management uses these non-GAAP financial measures for the same purpose, and for planning and forecasting purposes. The presentation of non-GAAP financial measures is not meant to be a substitute for financial measures prepared in accordance with GAAP.
Certain statements contained herein or in the press release furnished as part of this Current Report, including statements regarding estimated future earnings and statements that are identified by the use of the words “anticipates,” “estimates,” “expects,” “forecasts,” “intends,” “plans,” “predicts,” “projects,” “believes,” “seeks,” “will” and “may” and similar expressions, are “forward-looking statements” as defined by the Private Securities Litigation Reform Act of 1995. There can be no assurance that the Company’s projections will in fact be achieved nor do these projections reflect any acquisitions or divestitures that may occur in the future. While the Company’s expectations, beliefs and projections are expressed in good faith and are believed to have a reasonable basis, actual results may differ materially from those projected in forward-looking statements. Furthermore, each forward-looking statement speaks only as of the date on which it is made. In addition to other factors, the following are important factors that could cause actual results to differ materially from those discussed in the forward-looking statements: changes in laws, regulations or judicial interpretations to which the Company is subject, including those involving derivatives, taxes, safety, employment, climate change, other environmental matters, real property, and exploration and production activities such as hydraulic fracturing; governmental/regulatory actions, initiatives and proceedings, including those involving rate cases (which address, among other things, target rates of return, rate design, retained natural gas and system modernization), environmental/safety requirements, affiliate relationships, industry structure, and franchise renewal; the Company’s ability to estimate accurately the time and resources necessary to meet emissions targets; governmental/regulatory actions and/or market pressures to reduce or eliminate reliance on natural gas; changes in economic conditions, including inflationary pressures, supply chain issues, liquidity challenges, and global,
national or regional recessions, and their effect on the demand for, and customers’ ability to pay for, the Company’s products and services; changes in the price of natural gas; impairments under the SEC’s full cost ceiling test for natural gas reserves; the creditworthiness or performance of the Company’s key suppliers, customers and counterparties; financial and economic conditions, including the availability of credit, and occurrences affecting the Company’s ability to obtain financing on acceptable terms for working capital, capital expenditures and other investments, including any downgrades in the Company’s credit ratings and changes in interest rates and other capital market conditions; increased costs or delays or changes in plans with respect to Company projects or related projects of other companies, as well as difficulties or delays in obtaining necessary governmental approvals, permits or orders or in obtaining the cooperation of interconnecting facility operators; changes in price differentials between similar quantities of natural gas sold at different geographic locations, and the effect of such changes on commodity production, revenues and demand for pipeline transportation capacity to or from such locations; the impact of information technology disruptions, cybersecurity or data security breaches; factors affecting the Company’s ability to successfully identify, drill for and produce economically viable natural gas reserves, including among others geology, lease availability and costs, title disputes, weather conditions, water availability and disposal or recycling opportunities of used water, shortages, delays or unavailability of equipment and services required in drilling operations, insufficient gathering, processing and transportation capacity, the need to obtain governmental approvals and permits, and compliance with environmental laws and regulations; the Company’s ability to complete strategic transactions; increasing health care costs and the resulting effect on health insurance premiums and on the obligation to provide other post-retirement benefits; other changes in price differentials between similar quantities of natural gas having different quality, heating value, hydrocarbon mix or delivery date; the cost and effects of legal and administrative claims against the Company or activist shareholder campaigns to effect changes at the Company; negotiations with the collective bargaining units representing the Company’s workforce, including potential work stoppages during negotiations; uncertainty of natural gas reserve estimates; significant differences between the Company’s projected and actual production levels for natural gas; changes in demographic patterns and weather conditions (including those related to climate change); changes in the availability, price or accounting treatment of derivative financial instruments; changes in laws, actuarial assumptions, the interest rate environment and the return on plan/trust assets related to the Company’s pension and other post-retirement benefits, which can affect future funding obligations and costs and plan liabilities; economic disruptions or uninsured losses resulting from major accidents, fires, severe weather, natural disasters, terrorist activities or acts of war, as well as economic and operational disruptions due to third-party outages; significant differences between the Company’s projected and actual capital expenditures and operating expenses; or increasing costs of insurance, changes in coverage and the ability to obtain insurance. The Company disclaims any obligation to update any forward-looking statements to reflect events or circumstances after the date hereof.
| Item 9.01 |
Financial Statements and Exhibits. |
(d) Exhibits
SIGNATURES
Pursuant to the requirements of the Securities Exchange Act of 1934, the registrant has duly caused this report to be signed on its behalf by the undersigned hereunto duly authorized.
|
|
|
| NATIONAL FUEL GAS COMPANY |
|
|
| By: |
|
/s/ Michael W. Reville |
|
|
Michael W. Reville |
|
|
General Counsel and Secretary |
Dated: February 7, 2024

Exhibit 99 Investor Presentation Q1 Fiscal 2024 Update February 7,
2024

National Fuel is committed to the safe and environmentally conscious
development, transportation, storage, and distribution of natural gas resources. For additional information, please review our Corporate Responsibility Report. 2

NFG: A Diversified, Integrated Natural Gas Company Developing our large,
high-quality acreage Upstream position in Marcellus & Utica shales Exploration & Production ~1.2 Million ~1.1 Bcf/day 51% of NFG (2) Net acres in Net total production (1) EBITDA Appalachia Expanding and modernizing pipeline Midstream
infrastructure to provide outlets for Gathering Appalachian natural gas production Pipeline & Storage 4.5 MMDth $2.7 Billion 37% of NFG 38% of NFG Daily interstate Investments (1) (1) EBITDA EBITDA pipeline capacity since 2010 under contract
Providing safe, reliable and affordable Downstream service to customers in WNY and NW Pa. Utility % of NFG $897 Million 754,000 12% of NFG (1) 20EBITDA (1) Investments in safety Utility EBITDA customers since 2010 Note: This presentation includes
forward-looking statements. Please review the safe harbor for forward looking statements at the end of this presentation. (1) Twelve months ended December 31, 2023. A reconciliation of Adjusted EBITDA to Net Income as presented on the Consolidated
Statement of Income and Earnings Reinvested in the Business is included at the end of this presentation. 3 (2) Average net production for the three months ended December 31, 2023.

Why National Fuel? Diversified Assets Provide Stability and Long-Term
Growth Opportunities Integrated Model Enhances Shareholder Value 1 Consolidated Business Expected to Generate Significant Free Cash Flow 2 Long-Term Strategy Delivers Growth and Enhances Capital Efficiency 3 Long History of Returning Capital to
Shareholders 4 Focused on Corporate Responsibility and Emissions Reductions 5 4

1 Integrated Model Creates Scale and Drives Synergies Geographic &
Operational Integration Benefits of National Fuel’s Upstream Drives Synergies: Integrated Structure: Exploration & ü Ability to adjust to changing commodity Production Upstream Midstream price environments ü Co-development of
Marcellus and Utica ü More efficient capital investment ü Just-in-time gathering facilities ü Higher returns on investment Midstream ü Enhanced capital efficiency Gathering ü Operational scale Pipeline & Storage ü
Lower cost of capital Midstream Downstream ü Lower operating costs ü Gathering, Pipeline & Storage, and Utility Downstream ü More competitive pipeline infrastructure businesses share common resources, Utility reducing operating
expense projects ü Strong balance sheetü Utility business is a large Pipeline & Storage customer ü Growing, stable dividend Financial Efficiencies: ü Investment grade credit ratingü Shared borrowing capacityü Lower
cost structure 5

Consolidated Business Expected to Generate Significant Free Cash Flow 2
Sustainable Free Cash Flow Generation Expected Over the Long-Term ü Regulated businesses focused on long-term modernization programs that are expected to lead to mid-single digit rate base growth § Capital program expected to generally
live within cash flows in the ~$185 near-term ü Exploration & Production (E&P) and Gathering – consolidated ~$150 development program dually-focused on maximizing returns and ~$130 free cash flow § Maintenance-to-low growth
program beyond fiscal 2024, is expected to drive growing free cash flow through a $50 - $150 MM per year decrease in capital (from fiscal 2023) ü Mitigation of E&P business commodity risk through consistent hedging and marketing program,
while maintaining upside ü Improvement of investment grade credit profile through $2.40 $2.75 $3.25 $3.25 consistent free cash flow generation FY2024 FY2025 @ NYMEX Price ($/MMBtu – Remainder of FY) (1) The Company defines free cash flow
as net cash provided by operating activities, less net cash used in investing activities, adjusted for acquisitions and divestitures. See non-GAAP financial measures information 6 at the end of this presentation. Assumes current hedges. Assumes no
pricing-related curtailments. (1) Projected Free Cash Flow ($ Millions)

Long-Term Strategy Delivers Growth and Enhances Capital Efficiency 3
Delivering Stable Growth Enhancing Capital Efficiency Pipeline & Storage/ Exploration & Production/ Utility Gathering Regulated Non-Regulated üSignificant modernization üMore than a decade of core investments can deliver mid-single
inventory in the Eastern digit rate base growth Development Area (EDA) ü Pipeline expansion opportunities, üIncreasing share of integrated such as the Tioga Pathway project, development program directed drive additional growth prospects
towards prolific EDA acreage ü Highly-interconnected pipeline üSignificant firm transport and sales network provides flexibility to portfolio to premium markets respond to changing supply/ demand dynamics 7

4 Over Half Century of Dividend Growth 4.3% $1.98 53 Years 121 Years (1)
yield per share Consecutive Dividend Increases Consecutive Payments $1.5 Billion 4.2% Dividend payments Over Last 10 Years 2023 Dividend Increase $0.19 per share Annual Rate at Fiscal Year End 8 th (1) As of February 5 , 2024.
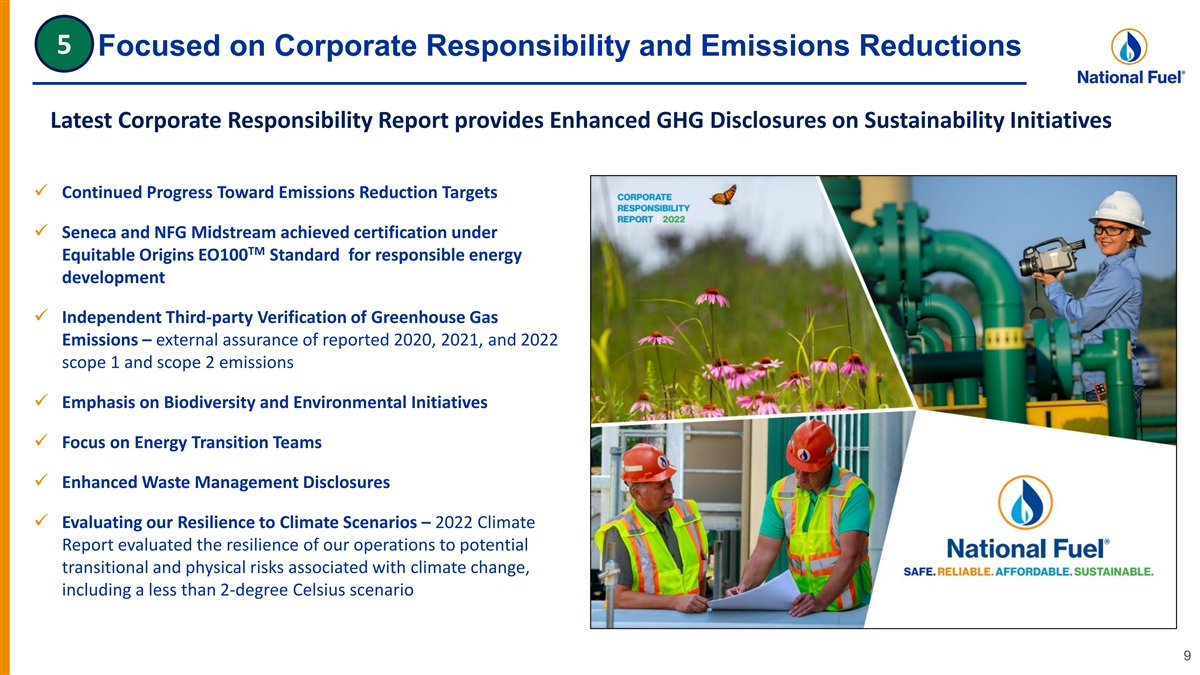
5 Focused on Corporate Responsibility and Emissions Reductions Latest
Corporate Responsibility Report provides Enhanced GHG Disclosures on Sustainability Initiatives ü Continued Progress Toward Emissions Reduction Targets ü Seneca and NFG Midstream achieved certification under TM Equitable Origins EO100
Standard for responsible energy development ü Independent Third-party Verification of Greenhouse Gas Emissions – external assurance of reported 2020, 2021, and 2022 scope 1 and scope 2 emissions ü Emphasis on Biodiversity and
Environmental Initiatives ü Focus on Energy Transition Teams ü Enhanced Waste Management Disclosures ü Evaluating our Resilience to Climate Scenarios – 2022 Climate Report evaluated the resilience of our operations to potential
transitional and physical risks associated with climate change, including a less than 2-degree Celsius scenario 9

Emissions Reduction Targets and Initiatives Significant Methane
Intensity and Greenhouse Progress Gas Emissions Reduction Targets Across the Ongoing Sustainability Initiatives (2) Since 2020 (1) Energy Value Chain ü Responsible Gas Certifications Exploration & 40% Reduction in Methane Intensity by 2030
27.4% Productionü Pneumatic Device Replacement ü Equipment upgrades at Existing Facilities Gathering 30% Reduction in Methane Intensity by 2030 ü Use of Best-in-Class Emissions Controls for 14.3% New Facilities ü Equipment
upgrades at Existing Facilities 18.2% 50% Reduction in Methane Intensity by 2030 Pipeline & Storage ü Use of Best-in-Class Emissions Controls for New Facilities ü Investment in System Modernization vü Advancing RNG in Service
Territory 30% Reduction in Methane Intensity by 2030 Utility 8.3% ü Hydrogen Blending Demonstration Projects (3) +1% ü ONE Future v 25% Reduction in GHG Emissions by 2030 54% production growth NFG ü EPA Methane Challenge 8% throughput
growth (1) All emissions reduction targets based on 2020 baseline. (2) Measured using Calendar 2022 emissions data, as reported in Company’s 2022 Corporate Responsibility Report. 10 (3) Total GHG emissions largely flat vs. 2020 despite
significant production and throughput growth. Total methane emissions decreased by ~7%.

Utility Targeting Substantial Emissions Reductions Significant
Reductions in Utility GHG Emissions to Date, GHG Reduction Targets, Continuing Focus on Lowering Driven by System Modernization Efforts Carbon Footprint (1) (1) Utility GHG Emissions Reduction Targets Utility Mains & Services Emissions (Based on
1990 EPA Subpart W Emissions) (Thousand Metric Tons, CO e) 2 800 2030 2050 700 600 500 75% 90% 400 300 ü Targets Exceed Those Included in New York 200 (2) State Climate Act (CLCPA) 100 ü Reductions Primarily Driven by Ongoing 0
Modernization of Mains and Services 1990 1995 2000 2005 2010 2015 2020 (1) Baseline emissions & emissions reduction targets are calculated pursuant to the reporting methodology under the EPA GHG Reporting Program (current Subpart W, and using
AR5), primarily Distribution pipeline mains & services. 11 (2) New York Climate Leadership and Community Protection Act, enacted in 2019.

First Quarter Fiscal 2024 Financial Highlights 12

First Quarter Fiscal 2024 Results and Drivers (1) Adjusted Operating
Results ($/share) Q1 FY2023 Q1 FY2024 Major Drivers $1.84 $3.02 Natural Gas Prices $1.46 $2.51 $1.48 Exploration & Production Exploration & $0.99 Production 94.0 $0.60 Natural Gas Production 84.0 (11% increase) 74.0 100.8 Gathering
Throughput 90.6 64.0 Gathering Gathering (15% increase) 54.0 $0.27 $0.31 44.0 Pipeline & Pipeline & Storage Storage $0.26 $0.32 Utility Utility Impact of Pennsylvania Rate $0.29 $0.26 $26.6 Increase Corporate/Other: $0.00 Corporate/Other:
$0.00 $23.8 MM Q1 FY23 Q1 FY24 MM (1) A Reconciliation of Adjusted Operating Results to Earnings Per Share is provided at the end of this presentation 13 (2) Realized price after hedging. Net Gas Production Natural Gas Pricing Utility Earnings (2)
(Bcf) ($/Mcfe)

Fiscal 2024 Earnings Guidance Previous FY2024 Earnings Guidance Updated
FY2024 Earnings Guidance (1) (1) $5.40 to $5.90/share $4.90 to $5.20/share Key Guidance Drivers § 395-410 Bcfe (up 8% vs. FY23) Net Production (2) Realized natural gas prices (after-hedge)§ ~$2.43-$2.49/Mcf (vs. $2.55/Mcf in FY23)
Exploration & G&A Expense § $0.17-$0.19/Mcf (vs. $0.18/Mcf in FY23) Production DD&A Expense § $0.69-$0.74/Mcf (vs. $0.65/Mcf in FY23) LOE Expense § $0.69-$0.70/Mcf (vs. $0.68/Mcf in FY23) Gathering Revenues §
$245-$260 million (up 10% vs. FY23) Gathering Gathering O&M Expense § ~$0.09/Mcf of throughput Pipeline & Storage Revenues § $380-$420 million (Supply Rate Increase) Pipeline & Pipeline & Storage O&M Expense § ~5%
increase Pipeline & Storage Storage Pipeline & Storage Depreciation Expense § ~5% increase § ~15% increase (Q1 warmer than normal) Utility ‾ Pennsylvania rate increase / Weather normalization clause (PA) Utility Utility
Operating Income ‾ System Modernization / Improvement Tracker (NY) ‾ O&M ~5% increase Tax Rate Effective Tax Rate § ~25 – 25.5% (1) Excludes items impacting comparability. See Comparable GAAP Financial Measure Slides &
Reconciliations at the end of this presentation. 14 (2) Assumes NYMEX pricing of $2.40/MMBtu and in-basin spot pricing of $1.70/MMBtu for fiscal 2024, and reflects the impact of existing financial hedges, firm sales and firm transportation
contracts. Regulated Non-Regulated

Exploration & Production & Gathering Overview Seneca Resources
Company, LLC National Fuel Gas Midstream Company, LLC 15

E&P and Gathering Focus on Capital Efficiency (1) Net Production
(Bcfe) Capital Expenditures ($ MM) $525- 395- $588 $566 372.5 352.5 575 410 2022 2023 2024E 2022 2023 2024E Near-Term Strategy ü Continue to moderate activity level to target maintenance-to-low production growth beyond fiscal 2024 § Focus
majority of the development program in the EDA to maximize returns and capital efficiency ü EDA Tioga: development focused primarily on Utica (modest Marcellus activity) ü EDA Lycoming: activity maintains production level that fully
utilizes valuable Atlantic Sunrise capacity ü WDA: limited development focused on Utica Shale 16 (1) A reconciliation to Capital Expenditures as presented on the Consolidated Statement of Cash Flows is included at the end of this presentation.
FY23 reflects the netting of $150 million related to acquisition of upstream assets and acreage in 2H FY23.

PV-10 Breakeven @ 20:1 WTI: HH ($/Mcf) E&P and Gathering EDA
Transition Driving Improved Economics ü Transition to full EDA development, with increasing capital efficiency, enhanced productivity and higher returns, provides differentiated investment opportunity to high-grade development program ü
>10 years of prolific EDA inventory at expected development pace …Delivering Top-Tier Returns Increasing Productivity… $3.50 600 $3.00 500 400 $2.50 300 $2.00 200 $1.50 100 0 $1.00 FY22 FY23 FY24 FY25 % of EDA TILs: ~30% ~50% ~60%
~80% NFG vs Peers (2) (2) NFG Enverus 2022 Actuals (1) FY22 is based on actual data. FY23 to FY25 data is projected until 12 months after the last pad has been online. (2) Source: FY22 data is based on Enverus Intelligence Research for NFG and
peers. Peers include Apex Energy, AR, Arsenal, Ascent Resources, CHK, CNX, CTRA, Encino Energy, EQT, GPOR, Greylock Energy, HG Energy, NNE, Olympus Energy, PennEnergy, REP, RRC, Snyder Brothers, 17 SWN, Tug Hill. FY23 to FY25 NFG data is based on
estimates. (1) 12- Mo. Cumulative Gas, MMCF/1,000
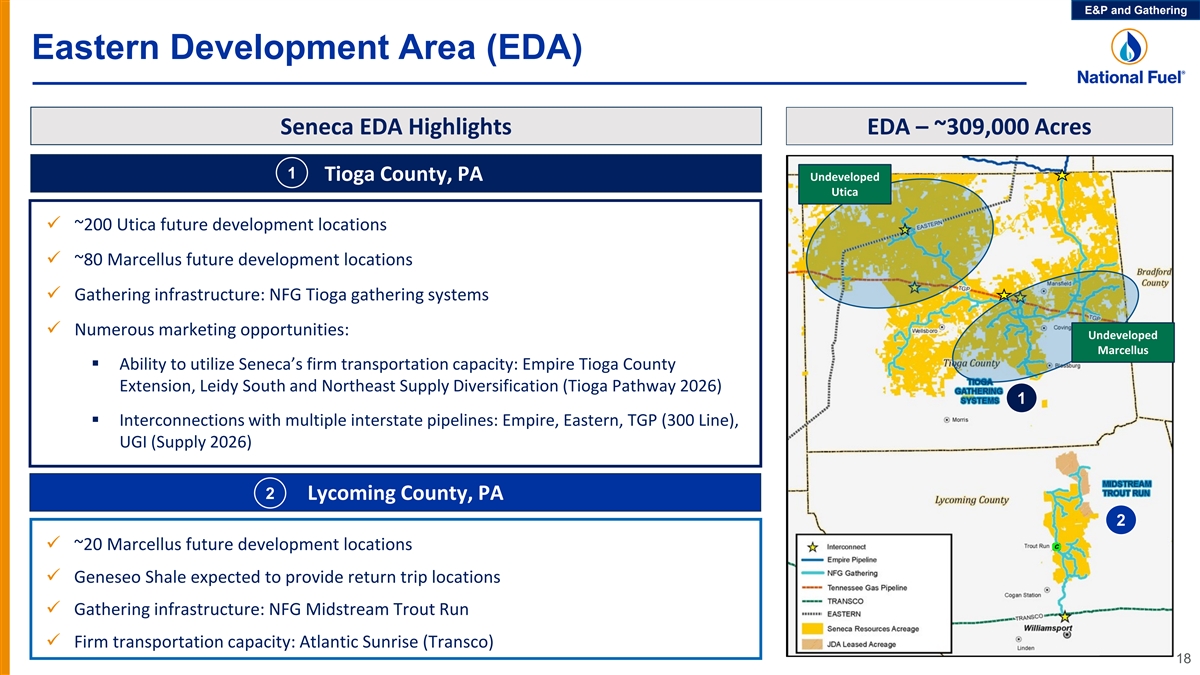
E&P and Gathering Eastern Development Area (EDA) Seneca EDA
Highlights EDA – ~309,000 Acres 1 Tioga County, PA Undeveloped Utica ü ~200 Utica future development locations ü ~80 Marcellus future development locations ü Gathering infrastructure: NFG Tioga gathering systems ü Numerous
marketing opportunities: Undeveloped Marcellus § Ability to utilize Seneca’s firm transportation capacity: Empire Tioga County Extension, Leidy South and Northeast Supply Diversification (Tioga Pathway 2026) 1 § Interconnections with
multiple interstate pipelines: Empire, Eastern, TGP (300 Line), UGI (Supply 2026) 2 Lycoming County, PA 2 ü ~20 Marcellus future development locations ü Geneseo Shale expected to provide return trip locations ü Gathering
infrastructure: NFG Midstream Trout Run ü Firm transportation capacity: Atlantic Sunrise (Transco) 18

E&P and Gathering Integrated Development – EDA Gathering
Current Systems In-Service Gathering Systems Map 1 Tioga Gathering Systems (1) ü Total Investment (to date): ~$436 million ü Capacity: up to 970,000 Dth per day ü Current Production Sources: Seneca Resources & Third Party ü
Interconnects: Empire, Eastern, and TGP 300 ü Future Build-Out § Expected increased investment in gathering pipeline and compression required to support Seneca’s transition to primarily EDA development program 1 2 Trout Run Gathering
System ü Total Investment (to date): ~$284 million ü Capacity: 466,000 to 585,000 Dth per day 2 ü Current Production Sources: Seneca Resources & Third-Party ü Interconnects: Transco (Leidy Line) ü Expected to generate
third-party revenues of $10 – $15 million for fiscal 2024 (supported by minimum volume commitments) 19 (1) Includes Company’s acquisition of midstream gathering assets in July 2020, in the amount of ~$223 million.

E&P and Gathering Western Development Area (WDA) (1) Marcellus Core
Acreage vs. Utica Trend WDA Highlights ü Large well inventory: § Marcellus Shale: 600+ well locations remaining / 200,000 acres § Utica Shale: 500+ potential locations across Utica trend (2) / evaluating extent of prospective acreage
ü Highly contiguous fee acreage (no royalty) enhances economics and provides development flexibility ü Beechwood area results provide long-term development optionality Beechwood Area ü Large gathering system with multiple
interconnects provides access to firm transportation portfolio that reaches premium markets Boone Mountain Utica Test Well Past Marcellus delineation tests Utica Trend (currently evaluating) ? Marcellus Core Acreage (1) The Utica Shale lies
approximately 5,000 feet beneath Seneca’s WDA Marcellus acreage. 20 (2) Appraisal program currently in progress. Prior Marcellus delineation tests helped define the prospective limits of the Marcellus core acreage; planned testing in the Utica
is expected to do the same.

E&P and Gathering Integrated Development – WDA Gathering
System Gathering System Build-Out Tailored to Accommodate Seneca’s WDA Development Clermont Gathering System Map Current System In-Service § Total Investment (to date): ~$397 million § Capacity: up to 750 MMcf per day § Current
Production Source: Seneca Resources § Interconnects: TGP 300 and NFG Supply Future Build-Out § Minimal gathering pipeline and compression investment required to support Seneca’s near-term development program 21

E&P and Gathering Production Supported by Long-Term Contracts Natural
Gas Marketing Firm Contract / Transport Volumes (gross MDth/day) 1200 (1) Firm Sales Contracts 1000 Will continue to layer-in firm sales deals to reduce in-basin spot exposure Leidy South (Transco & NFG - Supply) Transco Zone 6 Non-NY 800
330,000 Dth/d *Capacity can be utilized by all three producing areas (WDA, EDA-Tioga, and EDA-Lycoming) 600 Tioga County Extension (NFG - Empire) Canada-Dawn & NY Markets 200,000 Dth/d 400 Atlantic Sunrise (Transco) Mid-Atlantic & Southeast
U.S. 189,405 Dth/d (EDA-Lycoming) 200 Niagara Expansion (TGP & NFG - Supply) Canada-Dawn & TGP 200 170,000 Dth/d (WDA) Northeast Supply Diversification (TGP) 50,000 Dth/d (Canada-Dawn) (EDA-Tioga) 0 Jan-24 Apr-24 Jul-24 Oct-24 Jan-25 Apr-25
Jul-25 Oct-25 22 (1) Represents approximate base firm sales contracts not tied to firm transportation capacity. Base firm sales are either fixed priced or priced at an index (e.g., NYMEX ) +/- a fixed basis and do not carry any transportation costs.
Gross Firm Volumes (MDth/d)

E&P and Gathering Near-term Firm Sales Provide Market & Price
Certainty Net Contracted Firm Sales (Dth per day) (1) Contracted Index Price Differentials ($ per Dth) NYMEX Dawn Other Capped Fixed Price (2) 38,300 $0.64 1,058,900 1,018,200 1,001,900 993,800 305,400 238,000 208,700 200,300 $2.47 $2.41 $2.44 $2.42
(3) (3) (3) (3) (3) 67,200 67,300 66,900 (3) 66,000 (2) (2) (2) 64,200 ($1.11) (2) 64,200 ($1.11) 55,600 ($0.70) 58,400 ($0.83) 46,300 ($0.82) 58,400 ($0.83) 21,900 ($0.81) 627,300 603,600 611,400 603,400 ($0.62) ($0.65) ($0.66) ($0.66) Q2 FY24 Q3
FY24 Q4 FY24 FY24 Avg Gross Firm Sales Volumes (Dth per day) 1,185,500 1,168,400 1,229,600 1,158,400 (1) Values shown represent the weighted average fixed price or weighted average differential relative to NYMEX (netback price), and are net of any
associated transportation costs. Transportation costs include minor variable components such as the Canadian exchange rate and fuel components. With respect to “Other”, the weighted average differential relative to NYMEX (netback price)
includes net contracted firm sales at various indices, which are subject to fluctuations in the market, such as seasonal demand swings, and is calculated using forward basis at various associated locations as specified by the underlying contract.
(2) “Other” volumes are primarily TGP 200 and Transco Zone 6 Non-NY markets, with the balance to other Transco markets. 23 (3) Refer to NYMEX Capped Firm Sales Additional Detail on appendix slide 47.

E&P and Gathering Fiscal 2024 Net Production Profile 271 Bcf of
Appalachian Production Protected by Firm Sales (1) § 172 Bcf locked-in realizing ~$2.69/Mcf , net of transportation (2) § 45 Bcf of no-cost collars with $3.39/Mcf floor (3) § 54 Bcf of additional firm sales 395-410 Bcfe ~31 Bcfe ~54
Bcfe Spot production assumed to be sold at ~45 Bcfe ~$1.70 ~172 Bcfe 372 318 ~101 Bcfe YTD FY24 Actuals Price Certainty Floor Protection Unhedged Firm Sales Spot Sales Total Seneca (1) Average realized price reflects uplift from financial hedges
less fixed differentials under firm sales contracts and any firm transportation costs. (2) Average weighted floor price (average weighted ceiling price of $4.20/Mcf). (3) Includes ~36 Bcf of firm sales with fixed index differentials, as well as
production with associated firm transport volumes, but not backed by a matching financial hedge. Also includes ~18 Bcf of firm sales with caps tied to NYMEX prices. 24 See NYMEX Capped Firm Sales Additional Detail on appendix slide 48. Net
Production (Bcfe)

E&P and Gathering Competitive, Low-Cost Profile Operations
Increased Scale and Highly-Contiguous Operations Drive Low Cash Unit Costs Seneca Cash OpEx ($/Mcfe) Operating $1.32 results excluding $1.22 California operations $0.14 $1.14 $1.13 $0.12 $0.12 $0.13 $0.97 $0.30 ~$0.95 $0.93 $0.26 (1) ü Fees
Paid to NFG’s $0.21 $0.11 $0.07 $0.20 $0.07 Gathering Segment (1) $0.18 $0.18 $0.18 (2) Comprise >98% of $0.32 $0.28 $0.25 $0.24 (2) $0.12 Expected Gathering & $0.10 $0.11 (3) Transport LOE (2) (2) $0.58 $0.58 $0.57 $0.57 $0.57 $0.56
$0.56 FY 2019 FY 2020 FY 2021 FY 2022E FY 2022 FY 2023 FY2024E LOE (Gathering & Transport) LOE (Other) G&A Taxes & Other (1) G&A estimate represents the midpoint of the G&A guidance ranges for fiscal 2024. 25 (2) The total of the
two LOE components represents the midpoint of the LOE guidance ranges for fiscal 2024. FY20 Seneca LOE was $0.84/Mcfe (vs. total shown of $0.85) due to rounding.

E&P and Gathering Sustainability Initiatives Responsible Gas
Certifications, Methane Detection & Biodiversity TM Equitable Origin – EO100 Standard for Responsible Methane Detection Energy Development Certifications ü For the past decade, standard pad design has included fixed gas detection
systems installed near production equipment to shut-in the pad if methane is detected ü Regular Audio-Visual-Olfactory inspections of all assets ü Quarterly Leak Detection and Repair (LDAR) surveys of all assets ü 100% of natural gas
production certified and ü Quarterly Aerial Facility-Scale Monitoring surveys of all assets ü 100% of gathering system re-verified in December 2023 assets certified in 2023 ü Piloting continuous emissions monitoring equipment ü
Achieved peer-leading “A” certification grade MiQ Biodiversity (100% of Appalachian Assets – Re-Certified August 2023) ü Surface Footprint Neutral Program focuses on restoring, enhancing, or Certification focuses on three
emissions protecting biodiversity by returning management criteria: one acre of land to the environment ü Methane Intensity for every acre disturbed ü Company Practices to Manage Methane Emissionsü Voluntary initiatives focused on
pollinator and tree plantings, ü Emissions Monitoring Technology Deployment Achieved “A” certification grade - streambank stabilization, and the highest certification level enhancing aquatic wildlife available 26

Pipeline & Storage Overview National Fuel Gas Supply Corporation
Empire Pipeline, Inc. 27
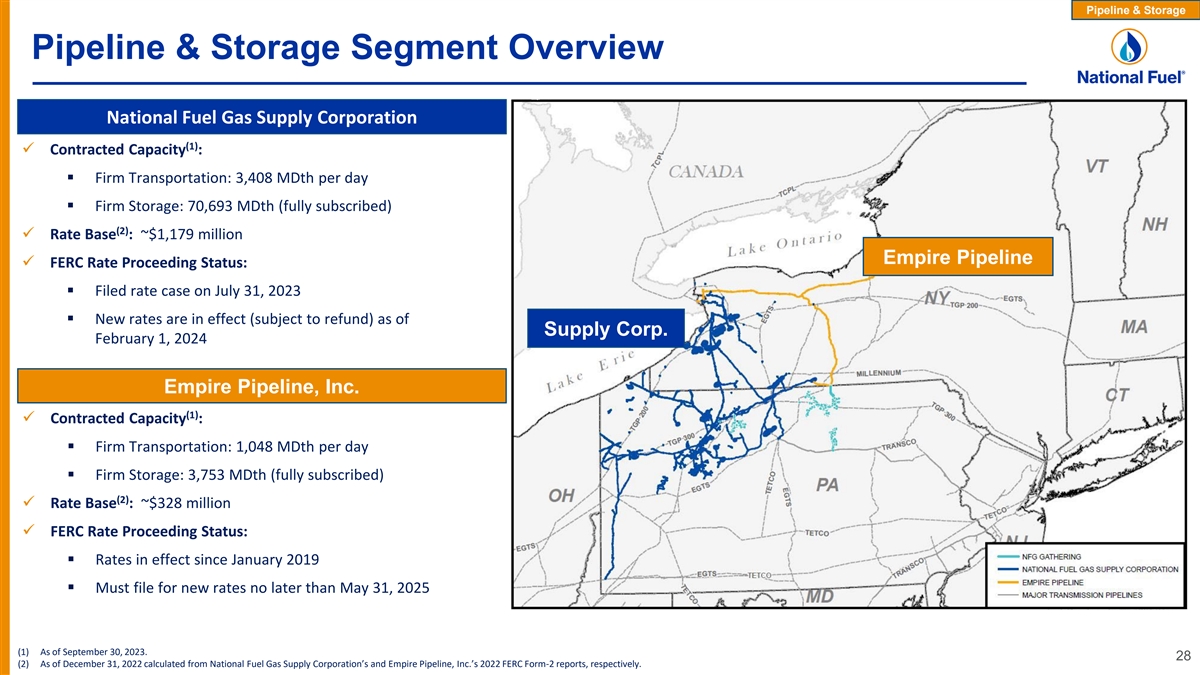
Pipeline & Storage Pipeline & Storage Segment Overview National
Fuel Gas Supply Corporation (1) ü Contracted Capacity : § Firm Transportation: 3,408 MDth per day § Firm Storage: 70,693 MDth (fully subscribed) (2) ü Rate Base : ~$1,179 million Empire Pipeline ü FERC Rate Proceeding
Status: § Filed rate case on July 31, 2023 § New rates are in effect (subject to refund) as of Supply Corp. February 1, 2024 Empire Pipeline, Inc. (1) ü Contracted Capacity : § Firm Transportation: 1,048 MDth per day § Firm
Storage: 3,753 MDth (fully subscribed) (2) ü Rate Base : ~$328 million ü FERC Rate Proceeding Status: § Rates in effect since January 2019 § Must file for new rates no later than May 31, 2025 (1) As of September 30, 2023. 28 (2)
As of December 31, 2022 calculated from National Fuel Gas Supply Corporation’s and Empire Pipeline, Inc.’s 2022 FERC Form-2 reports, respectively.

Pipeline & Storage Tioga Pathway Project – Organic Growth
Project provides long-term revenue growth for Supply, while providing an additional outlet for Seneca’s EDA development ü Capacity: 190,000 Dth/day ü Estimated annual revenue: ~$15 million (underpinned by 15-year agreement with
Seneca) ü Estimated capital cost: ~$90 million § A portion of the capital to be allocated to modernization facilities ü Facilities (all in Pennsylvania) include: § Approximately 20 miles of new pipeline § Approximately 4
miles of replacement/modernization of 20” pipeline ü Target in-service date: late calendar year 2026 ü Regulatory process: § FERC 7(c) Application (expected late summer 2024) 29
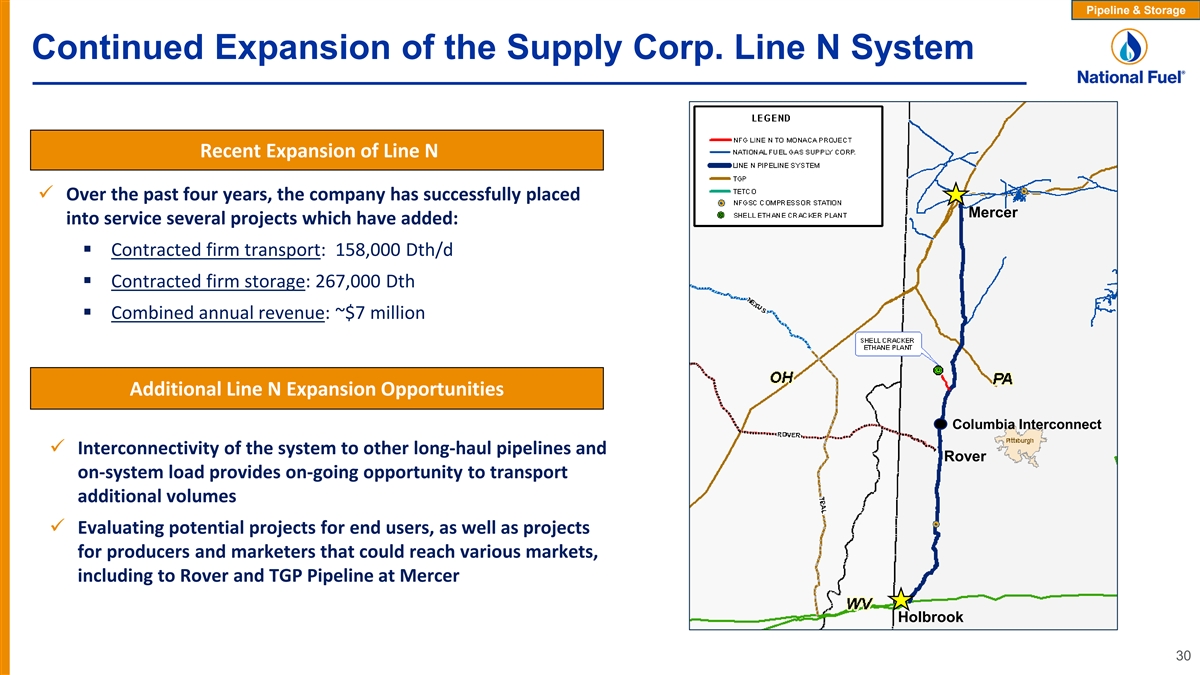
Pipeline & Storage Continued Expansion of the Supply Corp. Line N
System Recent Expansion of Line N ü Over the past four years, the company has successfully placed Mercer into service several projects which have added: § Contracted firm transport: 158,000 Dth/d § Contracted firm storage: 267,000 Dth
§ Combined annual revenue: ~$7 million Additional Line N Expansion Opportunities Columbia Interconnect ü Interconnectivity of the system to other long-haul pipelines and Rover on-system load provides on-going opportunity to transport
additional volumes ü Evaluating potential projects for end users, as well as projects for producers and marketers that could reach various markets, including to Rover and TGP Pipeline at Mercer Holbrook 30

Pipeline & Storage Northern Access Project Delivery points: ü
350,000 Dth/d to Chippawa (TCPL interconnect) ü 140,000 Dth/d to East Aurora (TGP 200 line) Regulatory/legal status: To Dawn ü Feb. 2017 – FERC 7(c) certificate issued ü Aug. 2018 – FERC issued Order finding that NY DEC
waived water quality certification (WQC) ü Apr. 2019 – FERC denied rehearing of WQC waiver order (upholding waiver finding) ü Mar. 2021 – U.S. Second Circuit Court of Appeals dismissed appeal of FERC waiver orders ü Jun.
2022 – FERC granted extension of certificate until December 31, 2024 31

Pipeline & Storage Pipeline & Storage Customer Mix (1) Customer
Transportation by Shipper Type Affiliated Customer Mix (Contracted Capacity) Affiliated Non-Affiliated End User 22% 8% Outside Producer 52% Pipeline 28% 16% 79% Marketer 78% 12% LDC 48% 36% 21% LDCs Producers Firm Storage Firm Transport 32 (1)
Contracted as of 9/30/2023.

Utility Overview National Fuel Gas Distribution Corporation
33
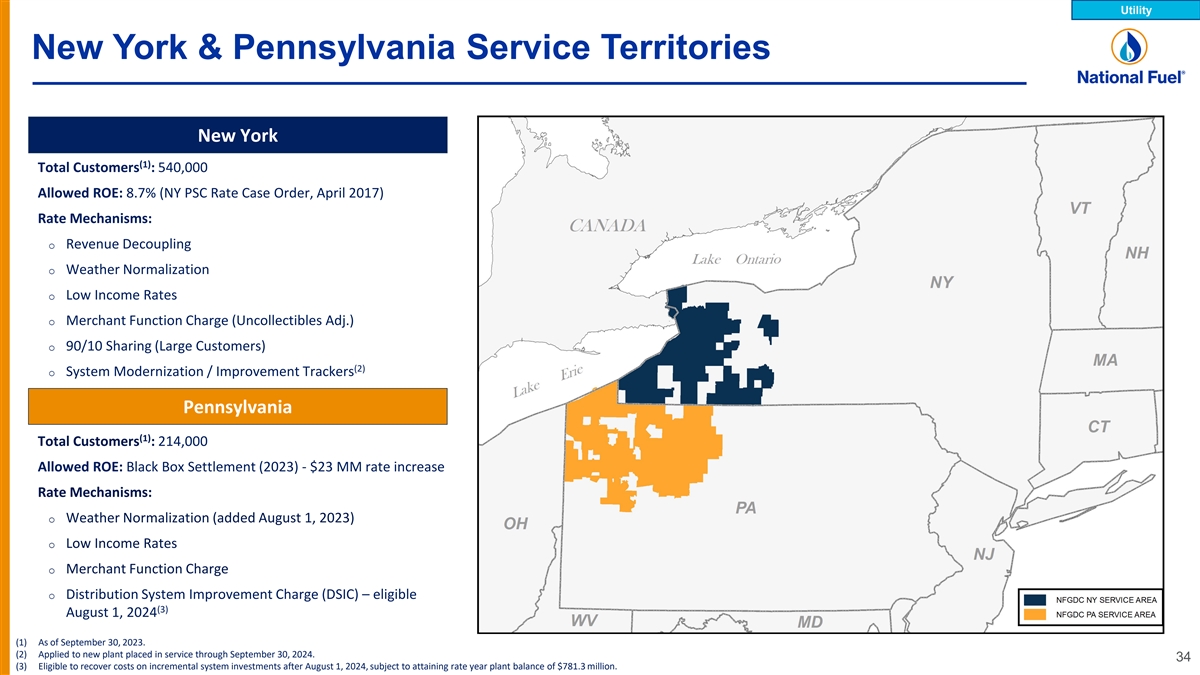
Utility New York & Pennsylvania Service Territories New York (1)
Total Customers : 540,000 Allowed ROE: 8.7% (NY PSC Rate Case Order, April 2017) Rate Mechanisms: o Revenue Decoupling o Weather Normalization o Low Income Rates o Merchant Function Charge (Uncollectibles Adj.) o 90/10 Sharing (Large Customers) (2)
o System Modernization / Improvement Trackers Pennsylvania (1) Total Customers : 214,000 Allowed ROE: Black Box Settlement (2023) - $23 MM rate increase Rate Mechanisms: o Weather Normalization (added August 1, 2023) o Low Income Rates o Merchant
Function Charge o Distribution System Improvement Charge (DSIC) – eligible (3) August 1, 2024 (1) As of September 30, 2023. (2) Applied to new plant placed in service through September 30, 2024. 34 (3) Eligible to recover costs on incremental
system investments after August 1, 2024, subject to attaining rate year plant balance of $781.3 million.

Utility New York Rate Case On October 31, 2023, National Fuel Gas
Distribution Corporation filed a request with the New York Public Service Commission (NY PSC) to amend its tariff and increase its base rates. National Fuel’s base rates have not changed since the last base rate case was litigated in 2017. (1)
ü Base Rate Increase = $88.6 million ($72.4 million net margin revenues) § 30.8% increase in base delivery revenues (24.8% net margin revenues) Proposed Base Revenue Increase § 13.0% increase in operating revenues ü New rates
expected to be effective October 1, 2024 ü Proposed Capital Structure and Returns: § Capital Structure = 48% debt / 52% equity § Return on Equity = 9.8% ü Increasing rate base and depreciation expense associated with higher plant
in-service § Total Rate Base in Rate Year = ~$1.0 billion Key Drivers § Maintain pipeline replacement target at 110 miles per year ü O&M expense inflation (e.g., labor and benefits) ü Implement elements of Long-term Plan
filed with NY PSC in July 2023 (e.g. Hybrid Heating, Demand Response, RNG and RSNG pilots) ü Seeking approval for uncollectible expense tracker 35 (1) The Company filed updated testimony and exhibits on January 12, 2024 revising the requested
base rate increase from $88.8 million to $88.6 million. Refer to NY PSC case docket 23-G-0627 for further details.

Utility Customer Affordability New York Pennsylvania #1 #3 (2) (1) Out
of 6 Gas Utilities Out of 9 Gas Utilities New York Large Gas Utilities Monthly Bill Pennsylvania Large Gas Utilities Monthly Bill Residential Heating (based on 100 MCF annually) Residential Heating (based on 15 MCF monthly) $200 $350 $180 $300 $160
$140 $250 $120 $200 $100 $150 $80 $60 $100 $40 $50 $20 $0 $0 NFGDC Peer 1 Peer 2 Peer 3 Peer 4 Peer 5 Peer 1 Peer 2 NFGDC Peer 3 Peer 4 Peer 5 Peer 6 Peer 7 Peer 8 PA NY (1) Based on 2022 average monthly residential bill data posted on company
websites required by the NYPSC. 36 (2) Based on analysis of 2023 PAPUC Annual Rate Comparison Report, which includes data for average monthly residential bills for 2022.
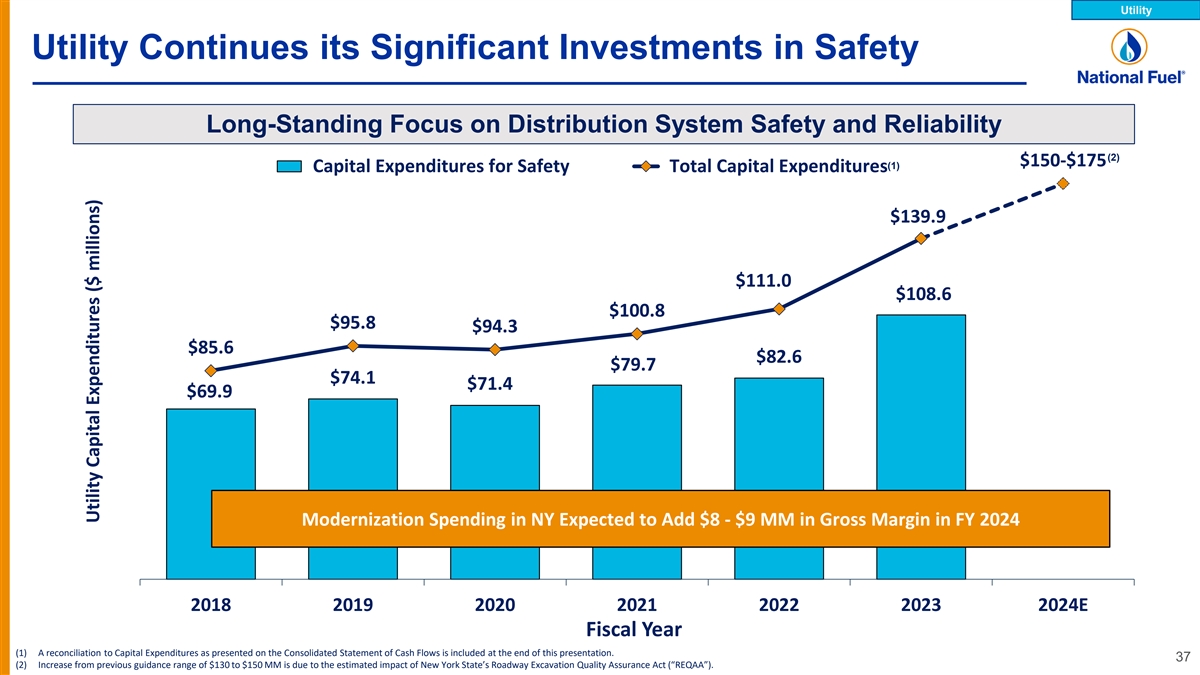
Utility Utility Continues its Significant Investments in Safety
Long-Standing Focus on Distribution System Safety and Reliability (2) $150-$175 (1) Capital Expenditures for Safety Total Capital Expenditures $139.9 $111.0 $108.6 $100.8 $95.8 $94.3 $85.6 $82.6 $79.7 $74.1 $71.4 $69.9 Modernization Spending in NY
Expected to Add $8 - $9 MM in Gross Margin in FY 2024 2018 2019 2020 2021 2022 2023 2024E Fiscal Year (1) A reconciliation to Capital Expenditures as presented on the Consolidated Statement of Cash Flows is included at the end of this presentation.
37 (2) Increase from previous guidance range of $130 to $150 MM is due to the estimated impact of New York State’s Roadway Excavation Quality Assurance Act (“REQAA”). Utility Capital Expenditures ($ millions)

Utility Long-Standing Pipeline Replacement & Modernization (1) (2)
Utility Mains by Material Miles of Utility Main Pipeline Replaced Wrought Iron 161 158 156 154 154 Coated Bare 49 NY 45 43 40 41 9,817 miles Plastic 114 Wrought Iron 113 113 113 112 Coated Bare PA 4,832 miles Plastic 2019 2020 2021 2022 2023 Fiscal
Year (1) All values are reported on a calendar year basis, as of December 31, 2023, as required by the DOT. 38 (2) All values are reported on a fiscal year basis, as required by the NYPSC and PAPUC.

Utility Promoting Renewable Natural Gas and Hydrogen July 2021 Through
Fiscal 2020 Ongoing Advance RNG, Hydrogen, and Accepted first RNG deliveries into Awarded three RNG grants for other CLCPA related NY system from anaerobic $1.2 million through the Utility’s digester project (receipts opportunities in the
Utility Area Development Program estimated to be ~50 MMcf/year) Long-Term Plan Substantial RNG Potential in New York Continuing to Work with Regulators and Third Parties to (1) RNG Potential in New York State (Bcf/Year) Advance Zero and Low Carbon
Opportunities Limited Achievable Optimistic Maximum ü Distribution Corporation received approval from NY and PA utility Adoption Deployment Growth Potential commissions to accept RNG into its distribution system Landfill 14 19 25 51 ü Low
Carbon Resources Initiative (LCRI) expected to provide opportunities for Animal Manure 6 9 12 20 NFG to leverage technology acceleration within its regional footprint Food Waste 2 3 4 6 ü Final Scoping Plan adopted by New York Climate Action
Council includes consideration of alternative fuels and technologies in future gas system Wastewater 2 2 3 7 planning Other 23 56 102 188 All Sources 47 90 147 272 39 (1) NYSERDA– Potential of Renewable Natural Gas in New York State (April
2022).

Consolidated Financial Overview Upstream I Midstream I Downstream
40

Diversified, Balanced Earnings and Cash Flows (1) (2) Adjusted Operating
Results ($ per share) Adjusted EBITDA ($ millions) $1,226 $1,165 $5.88 $1,137 $5.17 $4.90 - $5.20 $656 $612 $581 $3.21 E&P $2.52 $177 Gathering $186 $192 $1.01 $1.08 Pipeline & $241 $237 $232 $1.11 $1.09 Storage Utility $0.59 $163 $145 $147
$0.52 FY 2022 FY 2023 FY 2024 Guidance FY 2022 FY 2023 TTM 12/31/23 (1) Excludes items impacting comparability. See Comparable GAAP Financial Measure Slides & Reconciliations at the end of this presentation. 41 (2) Consolidated Adjusted EBITDA
includes Corporate & All Other. A reconciliation of Adjusted EBITDA to Net Income, by segment, as presented on the Consolidated Statement of Income and Earnings Reinvested in the Business is included at the end of this presentation.

Disciplined, Flexible Capital Allocation (1) Capital Expenditures by
Segment ($ millions) (2) (3) Exploration & Production Gathering Pipeline & Storage Utility $974 $885-$1,000 $829 $781 $770 $719 $588 $525-575 $381 $566 $492 $384 $35 $90-110 $103 $74 $50 $56 $252 $120-140 $142 $167 $143 $96 $150-175 $140
$111 $101 $96 $94 2019 2020 2021 2022 2023 2024E Fiscal Year (1) Total Capital Expenditures include Corporate and All Other. A reconciliation to Capital Expenditures as presented on the Consolidated Statement of Cash Flows is included at the end of
this presentation. (2) FY20 reflects the netting of $286 million related to the acquisition of Appalachian upstream assets in July 2020. FY23 reflects the netting of $150 million related to the acquisition of Appalachian upstream assets. 42 (3) FY20
reflects the netting of $224 million related to the acquisition of Appalachian gathering assets in July 2020.

Maintaining Strong Balance Sheet & Liquidity (1) Net Debt / Adjusted
EBITDA Capitalization 3.08 x 2.72 x 2.61 x 2.27 x 2.27 x 2.22 x Total Debt Equity 46% 54% 2019 2020 2021 2022 2023 TTM $5.9 Billion Total Capitalization 12/31/23 Fiscal Year (2) as of December 31, 2023 Debt Maturity Profile by Fiscal Year ($MM)
Liquidity $ 1,000 MM Committed Credit Facilities $600 $600 (300 MM) $500 $500 $500 Short-term Debt Outstanding 700 MM Available Short-term Credit Facilities $400 $300 42 MM Cash Balance at 12/31/23 $200 $ 742 MM Total Liquidity at 12/31/23 $0 (1)
Net Debt is net of cash and temporary cash investments. Reconciliations of Net Debt and Adjusted EBITDA to Net Income are included at the end of this presentation. 43 (2) Total capitalization as presented here includes $300 MM of notes payable to
banks and commercial paper, in addition to $5.6 B of Total Capitalization as presented on the balance sheet as of December 31, 2023.

Appendix 44

Appendix Safe Harbor For Forward Looking Statements This presentation
may contain “forward-looking statements” as defined by the Private Securities Litigation Reform Act of 1995, including statements regarding future prospects, plans, objectives, goals, projections, estimates of gas quantities, strategies,
future events or performance and underlying assumptions, capital structure, anticipated capital expenditures, completion of construction projects, projections for pension and other post-retirement benefit obligations, impacts of the adoption of new
accounting rules, and possible outcomes of litigation or regulatory proceedings, as well as statements that are identified by the use of the words “anticipates,” “estimates,” “expects,” “forecasts,”
“intends,” “plans,” “predicts,” “projects,” “believes,” “seeks,” “will,” “may,” and similar expressions. Forward-looking statements involve risks and
uncertainties which could cause actual results or outcomes to differ materially from those expressed in the forward-looking statements. The Company’s expectations, beliefs and projections are expressed in good faith and are believed by the
Company to have a reasonable basis, but there can be no assurance that management’s expectations, beliefs or projections will result or be achieved or accomplished. In addition to other factors, the following are important factors that could
cause actual results to differ materially from those discussed in the forward-looking statements: changes in laws, regulations or judicial interpretations to which the Company is subject, including those involving derivatives, taxes, safety,
employment, climate change, other environmental matters, real property, and exploration and production activities such as hydraulic fracturing; governmental/regulatory actions, initiatives and proceedings, including those involving rate cases (which
address, among other things, target rates of return, rate design, retained natural gas and system modernization), environmental/safety requirements, affiliate relationships, industry structure, and franchise renewal; the Company’s ability to
estimate accurately the time and resources necessary to meet emissions targets; governmental/regulatory actions and/or market pressures to reduce or eliminate reliance on natural gas; changes in economic conditions, including inflationary pressures,
supply chain issues, liquidity challenges, and global, national or regional recessions, and their effect on the demand for, and customers’ ability to pay for, the Company’s products and services; changes in the price of natural gas;
impairments under the SEC’s full cost ceiling test for natural gas reserves; the creditworthiness or performance of the Company’s key suppliers, customers and counterparties; financial and economic conditions, including the availability
of credit, and occurrences affecting the Company’s ability to obtain financing on acceptable terms for working capital, capital expenditures and other investments, including any downgrades in the Company’s credit ratings and changes in
interest rates and other capital market conditions; increased costs or delays or changes in plans with respect to Company projects or related projects of other companies, as well as difficulties or delays in obtaining necessary governmental
approvals, permits or orders or in obtaining the cooperation of interconnecting facility operators; changes in price differentials between similar quantities of natural gas sold at different geographic locations, and the effect of such changes on
commodity production, revenues and demand for pipeline transportation capacity to or from such locations; the impact of information technology disruptions, cybersecurity or data security breaches; factors affecting the Company’s ability to
successfully identify, drill for and produce economically viable natural gas reserves, including among others geology, lease availability and costs, title disputes, weather conditions, water availability and disposal or recycling opportunities of
used water, shortages, delays or unavailability of equipment and services required in drilling operations, insufficient gathering, processing and transportation capacity, the need to obtain governmental approvals and permits, and compliance with
environmental laws and regulations; the Company’s ability to complete strategic transactions; increasing health care costs and the resulting effect on health insurance premiums and on the obligation to provide other post-retirement benefits;
other changes in price differentials between similar quantities of natural gas having different quality, heating value, hydrocarbon mix or delivery date; the cost and effects of legal and administrative claims against the Company or activist
shareholder campaigns to effect changes at the Company; negotiations with the collective bargaining units representing the Company's workforce, including potential work stoppages during negotiations; uncertainty of natural gas reserve estimates;
significant differences between the Company’s projected and actual production levels for natural gas; changes in demographic patterns and weather conditions (including those related to climate change); changes in the availability, price or
accounting treatment of derivative financial instruments; changes in laws, actuarial assumptions, the interest rate environment and the return on plan/trust assets related to the Company’s pension and other post-retirement benefits, which can
affect future funding obligations and costs and plan liabilities; economic disruptions or uninsured losses resulting from major accidents, fires, severe weather, natural disasters, terrorist activities or acts of war, as well as economic and
operational disruptions due to third-party outages; significant differences between the Company’s projected and actual capital expenditures and operating expenses; or increasing costs of insurance, changes in coverage and the ability to obtain
insurance. Forward-looking statements include estimates of gas quantities. Proved gas reserves are those quantities of gas which, by analysis of geoscience and engineering data, can be estimated with reasonable certainty to be economically
producible under existing economic conditions, operating methods and government regulations. Other estimates of gas quantities, including estimates of probable reserves, possible reserves, and resource potential, are by their nature more speculative
than estimates of proved reserves. Accordingly, estimates other than proved reserves are subject to substantially greater risk of being actually realized. Investors are urged to consider closely the disclosure in our Form 10-K available at
www.nationalfuel.com. You can also obtain this form on the SEC’s website at www.sec.gov. For a discussion of the risks set forth above and other factors that could cause actual results to differ materially from results referred to in the
forward-looking statements, see “Risk Factors” in the Company’s Form 10-K for the fiscal year ended September 30, 2023 and the Form 10-Q for the quarter ended December 31, 2023. The Company disclaims any obligation to update any
forward-looking statements to reflect events or circumstances after the date thereof or to reflect the occurrence of unanticipated events. 45

Appendix Hedge Positions and Prices Natural Gas Volumes in thousand
MMBtu; Prices in $/MMBtu Fiscal 2024 Q2 Q3 Q4 Avg. Avg. Avg. Volume Price Volume Price Volume Price NYMEX Swaps 34,770 $3.39 38,670 $3.35 38,670 $3.35 No Cost Collars 17,100 $3.42 / $4.56 14,400 $3.22 / $3.79 14,400 $3.22 / $3.79 (1) Fixed Price
Physical 28,113 $2.47 18,993 $2.41 18,431 $2.42 Total 79,983 72,063 71,501 Natural Gas Volumes in thousand MMBtu; Prices in $/MMBtu Fiscal 2025 Fiscal 2026 Fiscal 2027 Avg. Avg. Avg. Volume Price Volume Price Volume Price NYMEX Swaps 94,960 $3.50
38,020 $3.98 21,750 $4.16 No Cost Collars 43,960 $3.49 42,720 $3.53 / $4.76 3,560 $3.53/ $4.76 (1) Fixed Price Physical 76,426 $2.47 69,398 $2.41 49,183 $2.42 Total 215,346 150,138 74,493 46 (1) Fixed price physical sales exclude joint development
partner’s share of fixed price contract WDA volumes as specified under the joint development agreement.

Appendix NYMEX Capped Firm Sales Additional Detail (1) Values shown
represent the weighted average differential relative to NYMEX (netback price) and are net of any associated transportation costs. Transportation costs include minor variable components such as the Canadian exchange rate and fuel components.
47

Appendix Firm Transportation Commitments Volume Delivery Demand Charges
Production Source Gas Marketing Strategy (Dth/d) Market ($/Dth) Northeast Supply Canada Firm Sales Contracts rd EDA – Tioga 50,000 $0.46 (3 party) Diversification (Dawn) Dawn/NYMEX Tennessee Gas Pipeline NFG pipelines - $0.24 158,000 Canada
(Dawn) rd 3 party - $0.40 Niagara Expansion Firm Sales Contracts WDA – CRV TGP & NFG - Supply Dawn/NYMEX TGP 200 (PA) $0.18 (NFG pipelines) 12,000 Atlantic Sunrise Mid-Atlantic/ Firm Sales Contracts rd EDA - Lycoming 189,405 $0.73 (3
party) WMB - Transco Southeast NYMEX/Market Indices TGP 200 (NY) 158,000 NFG pipelines - $0.23 Tioga County Extension Firm Sales Contracts EDA – Tioga NFG pipelines - $0.23 NFG – Empire TGP 200 (NY)/NYMEX/Dawn Canada (Dawn) 42,000 rd 3
party - $0.15 rd Eastern EDA – Tioga 100,000 In-Basin $0.19 (3 Party) Capacity release WDA – CRV Transco Zone Firm Sales Contracts Leidy South / FM100 rd 330,000 $0.66 (3 Party) WMB – Transco; NFG - Supply EDA - Lycoming 6 NNY
Transco Zone 6 NNY/NYMEX 48 Currently In-Service

Appendix Comparable GAAP Financial Measure Slides & Reconciliations
This presentation contains certain non-GAAP financial measures. For pages that contain non-GAAP financial measures, pages containing the most directly comparable GAAP financial measures and reconciliations are provided in the slides that follow. The
Company believes that its non-GAAP financial measures are useful to investors because they provide an alternative method for assessing the Company’s ongoing operating results and for comparing the Company’s financial performance to other
companies. The Company’s management uses these non-GAAP financial measures for the same purpose, and for planning and forecasting purposes. The presentation of non-GAAP financial measures is not meant to be a substitute for financial measures
prepared in accordance with GAAP. Management defines Adjusted Operating Results as reported GAAP earnings before items impacting comparability. Management defines Adjusted EBITDA as reported GAAP earnings before the following items: interest
expense, income taxes, depreciation, depletion and amortization, other income and deductions, impairments, and other items reflected in operating income that impact comparability. Management defines Free Cash Flow as Net Cash Provided by Operating
Activities, less Net Cash Used in Investing Activities, adjusted for acquisitions and divestitures. The Company is unable to provide a reconciliation of projected Free Cash Flow as described in this presentation to its respective comparable
financial measure calculated in accordance with GAAP without unreasonable efforts. This is due to our inability to reliably predict the comparable GAAP projected metrics, including operating income and total production costs, given the unknown
effect, timing, and potential significance of certain income statement items. 49
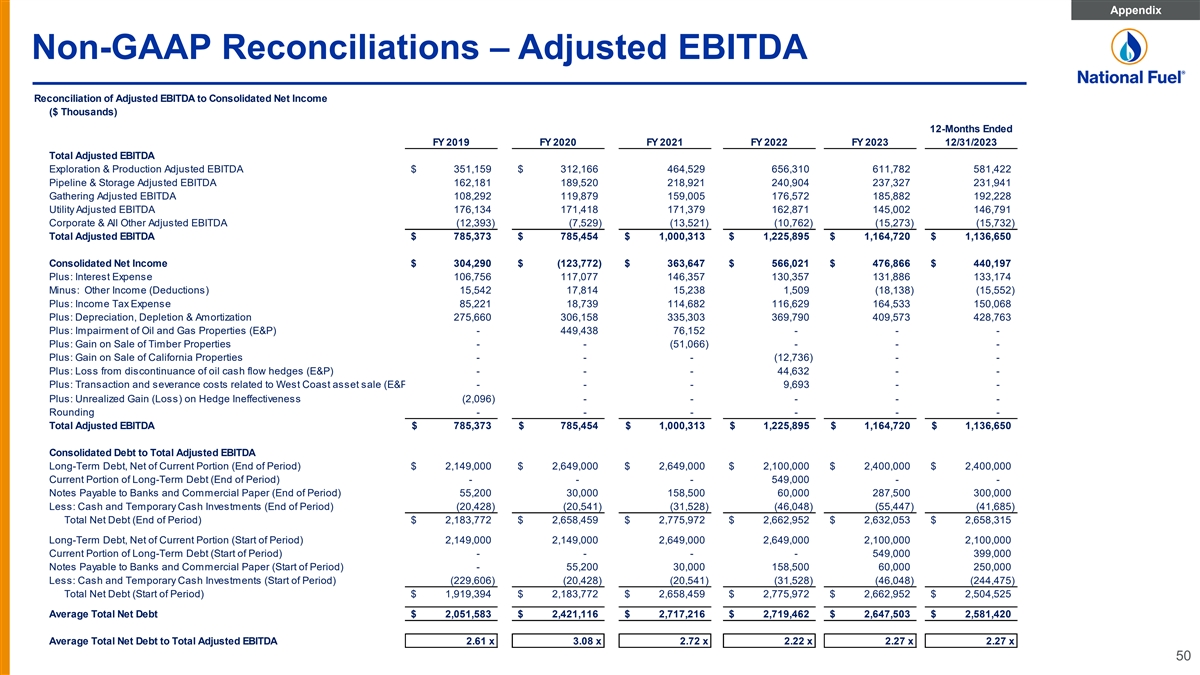
Appendix Non-GAAP Reconciliations – Adjusted EBITDA
Reconciliation of Adjusted EBITDA to Consolidated Net Income ($ Thousands) 12-Months Ended FY 2019 FY 2020 FY 2021 FY 2022 FY 2023 12/31/2023 Total Adjusted EBITDA Exploration & Production Adjusted EBITDA $ 351,159 $ 312,166 464, 529 656, 310
611,782 581,422 Pipeline & Storage Adjusted EBITDA 162,181 189,520 218, 921 240,904 237, 327 231,941 Gathering Adjusted EBITDA 108,292 119, 879 159,005 176, 572 185,882 192, 228 Utility Adjusted EBITDA 176, 134 171,418 171,379 162, 871 145, 002
146,791 Corporate & All Other Adjusted EBITDA ( 12,393) (7,529) (13,521) ( 10,762) ( 15,273) (15,732) Total Adjusted EBITDA $ 785,373 $ 785,454 $ 1,000,313 $ 1,225,895 $ 1,164,720 $ 1,136,650 Consolidated Net Income $ 304,290 $ (123,772) $
363,647 $ 566,021 $ 476,866 $ 440,197 Plus: Interest Expense 106,756 117,077 146, 357 130,357 131, 886 133, 174 Minus: Other Income (Deductions) 15,542 17,814 15,238 1,509 ( 18,138) (15,552) Plus: Income Tax Expense 85,221 18,739 114,682 116,629
164, 533 150, 068 Plus: Depreciation, Depletion & Amortization 275, 660 306, 158 335, 303 369, 790 409,573 428,763 Plus: Impairment of Oil and Gas Properties (E&P) - 449, 438 76,152 - - - Plus: Gain on Sale of Timber Properties - - ( 51,066)
- - - Plus: Gain on Sale of California Properties - - - ( 12,736) - - Plus: Loss from discontinuance of oil cash flow hedges (E&P) - - - 44,632 - - Plus: Transaction and severance costs related to West Coast asset sale (E&P - - - 9,693 - -
Plus: Unrealized Gain (Loss) on Hedge Ineffectiveness (2,096) - - - - - Rounding - - - - - - Total Adjusted EBITDA $ 785,373 $ 785,454 $ 1,000,313 $ 1,225,895 $ 1, 164,720 $ 1,136,650 Consolidated Debt to Total Adjusted EBITDA Long-Term Debt, Net of
Current Portion (End of Period) $ 2,149,000 $ 2,649,000 $ 2,649,000 $ 2,100,000 $ 2,400,000 $ 2,400,000 Current Portion of Long-Term Debt (End of Period) - - - 549,000 - - Notes Payable to Banks and Commercial Paper (End of Period) 55,200 30,000
158,500 60,000 287,500 300,000 Less: Cash and Temporary Cash Investments (End of Period) (20,428) ( 20,541) (31,528) (46,048) (55,447) (41,685) Total Net Debt (End of Period) $ 2,183,772 $ 2,658,459 $ 2,775,972 $ 2,662,952 $ 2,632,053 $ 2,658,315
Long-Term Debt, Net of Current Portion (Start of Period) 2,149,000 2,149,000 2,649,000 2,649,000 2,100,000 2,100,000 Current Portion of Long-Term Debt (Start of Period) - - - - 549, 000 399, 000 Notes Payable to Banks and Commercial Paper (Start of
Period) - 55,200 30,000 158, 500 60,000 250, 000 Less: Cash and Temporary Cash Investments (Start of Period) (229,606) ( 20,428) (20,541) (31,528) (46,048) (244,475) Total Net Debt (Start of Period) $ 1,919,394 $ 2,183,772 $ 2,658,459 $ 2,775,972 $
2,662,952 $ 2,504,525 Average Total Net Debt $ 2,051,583 $ 2,421,116 $ 2,717,216 $ 2,719,462 $ 2,647,503 $ 2,581,420 Average Total Net Debt to Total Adjusted EBITDA 2.61 x 3.08 x 2.72 x 2.22 x 2.27 x 2.27 x 50

Appendix Non-GAAP Reconciliations – Adjusted EBITDA, by Segment
Reconciliation of Adjusted EBITDA to Net Income, by Segment ($ Thousands) 12-Months FY 2018 FY 2019 FY 2020 FY 2021 FY 2022 FY 2023 Ended 12/31/23 Exploration and Production Segment Reported GAAP Earnings $ 180,632 $ 111,807 $ (326,904) $ 101,916 $
306,064 $ 232,275 $ 193,566 Depreciation, Depletion and Amortization 124,274 154,784 172,124 182,492 208,148 241,142 257,549 Other (Income) Deductions (307) (1,091) 882 937 3,210 (3,748) (657) Interest Expense 54,288 54,777 58,098 69,662 53,401
54,317 56,351 Income Taxes (41,962) 32,978 (41,472) 33,370 43,898 87,796 74,613 Mark-to-Market Adjustment due to Hedge Ineffectiveness 782 (2,096) - - - - - Impairment of Oil and Gas Properties - - 449,438 76,152 - - - Gain on Sale of West Coast
assets - - - - (12,736) - 0 Loss from discontinuance of crude oil cash flow hedges - - - - 44,632 - 0 Transaction and severance costs related to West Coast asset sale - - - - 9,693 - 0 Adjusted EBITDA $ 317,707 $ 351,159 $ 312,166 $ 464,529 $
656,310 $ 611,782 $ 581,422 Pipeline and Storage Segment Reported GAAP Earnings $ 97,246 $ 74,011 $ 78,860 $ 92,542 $ 102,557 $ 100,501 $ 95,080 Depreciation, Depletion and Amortization 43,463 44,947 53,951 62,431 67,701 70,827 71,626 Other (Income)
Deductions (5,926) (9,157) (4,635) (5,840) (6,889) (11,989) (11,983) Interest Expense 31,383 29,142 32,731 40,976 42,492 43,499 44,272 Income Taxes 17,806 23,238 28,613 28,812 35,043 34,489 32,946 Adjusted EBITDA $ 183,972 $ 162,181 $ 189,520 $
218,921 $ 240,904 $ 237,327 $ 231,941 Gathering Segment Reported GAAP Earnings $ 83,519 $ 58,413 $ 68,631 $ 80,274 $ 101,111 $ 99,724 $ 103,811 Depreciation, Depletion and Amortization 17,313 20,038 22,440 32,350 33,998 35,725 36,474 Other (Income)
Deductions (778) (460) (260) 12 26 (684) (559) Interest Expense 9,560 9,406 10,877 17,493 16,488 14,989 14,676 Income Taxes (17,677) 20,895 18,191 28,876 24,949 36,128 37,826 Adjusted EBITDA $ 91,937 $ 108,292 $ 119,879 $ 159,005 $ 176,572 $ 185,882
$ 192,228 Utility Segment Reported GAAP Earnings $ 51,217 $ 60,871 $ 57,366 $ 54,335 $ 68,948 $ 48,395 $ 51,129 Depreciation, Depletion and Amortization 53,253 53,832 55,248 57,457 59,760 61,450 62,613 Other (Income) Deductions 29,073 24,021 23,380
23,785 (7,117) (6,343) (7,292) Interest Expense 26,753 23,443 22,150 21,795 24,115 34,233 34,647 Income Taxes 15,258 13,967 13,274 14,007 17,165 7,267 5,694 Adjusted EBITDA $ 175,554 $ 176,134 $ 171,418 $ 171,379 $ 162,871 $ 145,002 $ 146,791
Corporate and All Other Reported GAAP Earnings $ (21,093) $ (812) $ (1,725) $ 34,580 $ (12,659) $ (4,029) $ (3,389) Depreciation, Depletion and Amortization 2,658 2,059 2,395 573 183 429 501 Gain on Sale of Timber Properties - - - (51,066) - - -
Other (Income) Deductions (888) 2,229 (1,553) (3,656) 12,279 4,626 4,939 Interest Expense (7,462) (10,012) (6,779) (3,569) (6,139) (15,152) (16,772) Income Taxes 19,081 (5,857) 133 9,617 (4,426) (1,147) (1,011) Adjusted EBITDA $ (7,704) $ (12,393) $
(7,529) $ (13,521) $ (10,762) $ (15,273) $ (15,732) 51

Appendix Non-GAAP Reconciliations – Adjusted Operating Results
Three Months Ended December 31, (in thousands except per share amounts) 2023 2022 Reported GAAP Earnings $ 133,020 $ 169,689 Items impacting comparability: Unrealized (gain) loss on derivative asset (E&P) 4,198 — Tax impact of unrealized
(gain) loss on derivative asset (1,151) — Unrealized (gain) loss on other investments (Corporate / All Other) (1,049) (209) Tax impact of unrealized (gain) loss on other investments 220 44 Adjusted Operating Results $ 135,238 $ 169,524
Reported GAAP Earnings Per Share $ 1.44 $ 1.84 Items impacting comparability: Unrealized (gain) loss on derivative asset, net of tax (E&P) 0.03 — Unrealized (gain) loss on other investments, net of tax (Corporate / All Other) (0.01)
— Adjusted Operating Results Per Share $ 1.46 $ 1.84 52

Appendix Reconciliation – Capital Expenditures Reconciliation of
Segment Capital Expenditures to Consolidated Capital Expenditures ($ Thousands) FY 2024 FY 2019 FY 2020 FY 2021 FY 2022 FY 2023 Guidance Capital Expenditures Exploration & Production Capital Expenditures $ 491,889 $ 670,455 $ 381, 408 $ 565,791
$ 737,725 $525,000 - $575,000 Pipeline & Storage Capital Expenditures $ 143,003 $ 166,652 $ 252,316 $ 95,806 $ 141,877 $120,000 - $140,000 Gathering Segment Capital Expenditures $ 49,650 $ 297,806 $ 34, 669 $ 55, 546 $ 103,295 $90,000 - $110,000
Utility Capital Expenditures $ 95,847 $ 94, 273 $ 100, 845 $ 111,033 $ 139,922 $150,000 - $175,000 Corporate & All Other Capital Expenditures $ 855 $ 561 $ 450 $ 1,212 $ 754 Eliminations $ (1,130) $ 223 Total Capital Expenditures from Continuing
Operations $ 781, 246 $ 1,228,617 $ 769,911 $ 829,388 $ 1,123,573 $885,000 - $1,000,000 Plus (Minus) Acquisition of Upstream Assets and Midstream Gathering Assets $ (506,258) $ (124,758) Plus (Minus) Accrued Capital Expenditures $ ( 43,198)
Exploration & Production FY 2022 Accrued Capital Expenditures $ (82,943) $ 82,943 Exploration & Production FY 2021 Accrued Capital Expenditures $ (47,887) $ 47,887 (1) Exploration & Production FY 2020 Accrued Capital Expenditures $
(45,788) $ 42,983 Exploration & Production FY 2019 Accrued Capital Expenditures $ (38,063) $ 38,063 Exploration & Production FY 2018 Accrued Capital Expenditures $ (36,465) $ (31,813) Pipeline & Storage FY 2022 Accrued Capital
Expenditures $ (15,188) $ 15,188 Pipeline & Storage FY 2021 Accrued Capital Expenditures $ (39,436) $ 39,436 Pipeline & Storage FY 2020 Accrued Capital Expenditures $ ( 17,264) $ 17,264 Pipeline & Storage FY 2019 Accrued Capital
Expenditures $ (23,771) $ 23,771 Pipeline & Storage FY 2018 Accrued Capital Expenditures $ (25,077) $ (20,587) Gathering FY 2022 Accrued Capital Expenditures $ ( 10,724) $ 10,724 Gathering FY 2021 Accrued Capital Expenditures $ (4,743) $ 4,743
Gathering FY 2020 Accrued Capital Expenditures $ ( 13,524) $ 13,524 Gathering FY 2019 Accrued Capital Expenditures $ (6,595) $ 6,595 Gathering FY 2018 Accrued Capital Expenditures $ (3,925) $ ( 13,610) Utility FY 2022 Accrued Capital Expenditures $
( 11,407) $ 11,407 Utility FY 2021 Accrued Capital Expenditures $ ( 10,634) $ 10,634 Utility FY 2020 Accrued Capital Expenditures $ (10,751) $ 10,751 Utility FY 2019 Accrued Capital Expenditures $ ( 12,692) $ 12,692 Utility FY 2018 Accrued Capital
Expenditures $ (6,748) Total Accrued Capital Expenditures $ (153,337) $ (6,206) $ (18,177) $ ( 17,562) $ 11,053 Total Capital Expenditures per Statement of Cash Flows $ 627,909 $ 716,153 $ 751, 734 $ 811,826 $ 1, 009,868 $885,000 - $1,000,000 (1)
Amount is $2,805 lower than the accrued capital expenditures reported in the prior year, representing certain liabilities assumed in connection with the 2020 acquisition of assets from Shell, capitalized as part of the asset acquisition cost, and
subsequently paid by the Company. As the liabilities were owed and paid to third parties, they are not classified as capital expenditures in 2021. 53

Appendix Reconciliation – E&P Operating Expenses
Reconciliation of Exploration & Production Segment Operating Expenses by Division ($000s unless noted otherwise) Twelve Months Ended Twelve Months Ended September 30, 2023 September 30, 2022 (2) (2) (2) (2) Appalachia West Coast Total E&P
Appalachia West Coast Total E&P Appalachia West Coast Total E&P Appalachia West Coast Total E&P $/ Mcfe $ / Boe $ / Mcfe $/ Mcfe $ / Boe $ / Mcfe Operating Expenses: (1) Gathering & Transportation Expense $210,880 $0 $210,880 $0.57
$0.00 $0.57 $199,405 $0 $199,405 $0.58 $0.00 $0.57 Other Lease Operating Expense $42,676 $0 $42,676 $0.11 $0.00 $0.11 $32,604 $51,905 $84,509 $0.10 $28.99 $0.24 Lease Operating and Transportation Expense $253,555 $0 $253,555 $0.68 $0.00 $0.68
$232,009 $51,905 $283,914 $0.68 $28.99 $0.81 General & Administrative Expense $66,074 $0.18 $79,061 $0.22 All Other Operating and Maintenance Expense $9,327 $0.03 $20,140 $0.06 Property, Franchise and Other Taxes $17,717 $0.05 $25,364 $0.07
Total Taxes & Other $27,044 $0.07 $45,504 $0.13 Depreciation, Depletion & Amortization $241,142 $0.65 $208,148 $0.59 Production: Gas Production (MMcf) 3 72,271 372,271 341,699 1,211 3 42,911 Oil Production (MBbl) 3 0 30 16 1,588 1 ,604 Total
Production (Mmcfe) 3 72,451 - 372,451 341,796 10,741 3 52,536 Total Production (Mboe) 6 2,075 - 62,075 56,966 1,790 5 8,756 (1) Gathering and Transportation expense is net of any payments received from JDA partner for the partner's share of
gathering cost. (2) Seneca West Coast division includes Seneca corporate and eliminations. 54
v3.24.0.1
| X |
- DefinitionBoolean flag that is true when the XBRL content amends previously-filed or accepted submission.
| Name: |
dei_AmendmentFlag |
| Namespace Prefix: |
dei_ |
| Data Type: |
xbrli:booleanItemType |
| Balance Type: |
na |
| Period Type: |
duration |
|
| X |
- DefinitionFor the EDGAR submission types of Form 8-K: the date of the report, the date of the earliest event reported; for the EDGAR submission types of Form N-1A: the filing date; for all other submission types: the end of the reporting or transition period. The format of the date is YYYY-MM-DD.
| Name: |
dei_DocumentPeriodEndDate |
| Namespace Prefix: |
dei_ |
| Data Type: |
xbrli:dateItemType |
| Balance Type: |
na |
| Period Type: |
duration |
|
| X |
- DefinitionThe type of document being provided (such as 10-K, 10-Q, 485BPOS, etc). The document type is limited to the same value as the supporting SEC submission type, or the word 'Other'.
| Name: |
dei_DocumentType |
| Namespace Prefix: |
dei_ |
| Data Type: |
dei:submissionTypeItemType |
| Balance Type: |
na |
| Period Type: |
duration |
|
| X |
- DefinitionAddress Line 1 such as Attn, Building Name, Street Name
| Name: |
dei_EntityAddressAddressLine1 |
| Namespace Prefix: |
dei_ |
| Data Type: |
xbrli:normalizedStringItemType |
| Balance Type: |
na |
| Period Type: |
duration |
|
| X |
- Definition
+ References
+ Details
| Name: |
dei_EntityAddressCityOrTown |
| Namespace Prefix: |
dei_ |
| Data Type: |
xbrli:normalizedStringItemType |
| Balance Type: |
na |
| Period Type: |
duration |
|
| X |
- DefinitionCode for the postal or zip code
| Name: |
dei_EntityAddressPostalZipCode |
| Namespace Prefix: |
dei_ |
| Data Type: |
xbrli:normalizedStringItemType |
| Balance Type: |
na |
| Period Type: |
duration |
|
| X |
- DefinitionName of the state or province.
| Name: |
dei_EntityAddressStateOrProvince |
| Namespace Prefix: |
dei_ |
| Data Type: |
dei:stateOrProvinceItemType |
| Balance Type: |
na |
| Period Type: |
duration |
|
| X |
- DefinitionA unique 10-digit SEC-issued value to identify entities that have filed disclosures with the SEC. It is commonly abbreviated as CIK. Reference 1: http://www.xbrl.org/2003/role/presentationRef
-Publisher SEC
-Name Exchange Act
-Number 240
-Section 12
-Subsection b-2
| Name: |
dei_EntityCentralIndexKey |
| Namespace Prefix: |
dei_ |
| Data Type: |
dei:centralIndexKeyItemType |
| Balance Type: |
na |
| Period Type: |
duration |
|
| X |
- DefinitionIndicate if registrant meets the emerging growth company criteria. Reference 1: http://www.xbrl.org/2003/role/presentationRef
-Publisher SEC
-Name Exchange Act
-Number 240
-Section 12
-Subsection b-2
| Name: |
dei_EntityEmergingGrowthCompany |
| Namespace Prefix: |
dei_ |
| Data Type: |
xbrli:booleanItemType |
| Balance Type: |
na |
| Period Type: |
duration |
|
| X |
- DefinitionCommission file number. The field allows up to 17 characters. The prefix may contain 1-3 digits, the sequence number may contain 1-8 digits, the optional suffix may contain 1-4 characters, and the fields are separated with a hyphen.
| Name: |
dei_EntityFileNumber |
| Namespace Prefix: |
dei_ |
| Data Type: |
dei:fileNumberItemType |
| Balance Type: |
na |
| Period Type: |
duration |
|
| X |
- DefinitionTwo-character EDGAR code representing the state or country of incorporation.
| Name: |
dei_EntityIncorporationStateCountryCode |
| Namespace Prefix: |
dei_ |
| Data Type: |
dei:edgarStateCountryItemType |
| Balance Type: |
na |
| Period Type: |
duration |
|
| X |
- DefinitionThe exact name of the entity filing the report as specified in its charter, which is required by forms filed with the SEC. Reference 1: http://www.xbrl.org/2003/role/presentationRef
-Publisher SEC
-Name Exchange Act
-Number 240
-Section 12
-Subsection b-2
| Name: |
dei_EntityRegistrantName |
| Namespace Prefix: |
dei_ |
| Data Type: |
xbrli:normalizedStringItemType |
| Balance Type: |
na |
| Period Type: |
duration |
|
| X |
- DefinitionThe Tax Identification Number (TIN), also known as an Employer Identification Number (EIN), is a unique 9-digit value assigned by the IRS. Reference 1: http://www.xbrl.org/2003/role/presentationRef
-Publisher SEC
-Name Exchange Act
-Number 240
-Section 12
-Subsection b-2
| Name: |
dei_EntityTaxIdentificationNumber |
| Namespace Prefix: |
dei_ |
| Data Type: |
dei:employerIdItemType |
| Balance Type: |
na |
| Period Type: |
duration |
|
| X |
- DefinitionLocal phone number for entity.
| Name: |
dei_LocalPhoneNumber |
| Namespace Prefix: |
dei_ |
| Data Type: |
xbrli:normalizedStringItemType |
| Balance Type: |
na |
| Period Type: |
duration |
|
| X |
- DefinitionBoolean flag that is true when the Form 8-K filing is intended to satisfy the filing obligation of the registrant as pre-commencement communications pursuant to Rule 13e-4(c) under the Exchange Act. Reference 1: http://www.xbrl.org/2003/role/presentationRef
-Publisher SEC
-Name Exchange Act
-Number 240
-Section 13e
-Subsection 4c
| Name: |
dei_PreCommencementIssuerTenderOffer |
| Namespace Prefix: |
dei_ |
| Data Type: |
xbrli:booleanItemType |
| Balance Type: |
na |
| Period Type: |
duration |
|
| X |
- DefinitionBoolean flag that is true when the Form 8-K filing is intended to satisfy the filing obligation of the registrant as pre-commencement communications pursuant to Rule 14d-2(b) under the Exchange Act. Reference 1: http://www.xbrl.org/2003/role/presentationRef
-Publisher SEC
-Name Exchange Act
-Number 240
-Section 14d
-Subsection 2b
| Name: |
dei_PreCommencementTenderOffer |
| Namespace Prefix: |
dei_ |
| Data Type: |
xbrli:booleanItemType |
| Balance Type: |
na |
| Period Type: |
duration |
|
| X |
- DefinitionTitle of a 12(b) registered security. Reference 1: http://www.xbrl.org/2003/role/presentationRef
-Publisher SEC
-Name Exchange Act
-Number 240
-Section 12
-Subsection b
| Name: |
dei_Security12bTitle |
| Namespace Prefix: |
dei_ |
| Data Type: |
dei:securityTitleItemType |
| Balance Type: |
na |
| Period Type: |
duration |
|
| X |
- DefinitionName of the Exchange on which a security is registered. Reference 1: http://www.xbrl.org/2003/role/presentationRef
-Publisher SEC
-Name Exchange Act
-Number 240
-Section 12
-Subsection d1-1
| Name: |
dei_SecurityExchangeName |
| Namespace Prefix: |
dei_ |
| Data Type: |
dei:edgarExchangeCodeItemType |
| Balance Type: |
na |
| Period Type: |
duration |
|
| X |
- DefinitionBoolean flag that is true when the Form 8-K filing is intended to satisfy the filing obligation of the registrant as soliciting material pursuant to Rule 14a-12 under the Exchange Act. Reference 1: http://www.xbrl.org/2003/role/presentationRef
-Publisher SEC
-Name Exchange Act
-Section 14a
-Number 240
-Subsection 12
| Name: |
dei_SolicitingMaterial |
| Namespace Prefix: |
dei_ |
| Data Type: |
xbrli:booleanItemType |
| Balance Type: |
na |
| Period Type: |
duration |
|
| X |
- DefinitionTrading symbol of an instrument as listed on an exchange.
| Name: |
dei_TradingSymbol |
| Namespace Prefix: |
dei_ |
| Data Type: |
dei:tradingSymbolItemType |
| Balance Type: |
na |
| Period Type: |
duration |
|
| X |
- DefinitionBoolean flag that is true when the Form 8-K filing is intended to satisfy the filing obligation of the registrant as written communications pursuant to Rule 425 under the Securities Act. Reference 1: http://www.xbrl.org/2003/role/presentationRef
-Publisher SEC
-Name Securities Act
-Number 230
-Section 425
| Name: |
dei_WrittenCommunications |
| Namespace Prefix: |
dei_ |
| Data Type: |
xbrli:booleanItemType |
| Balance Type: |
na |
| Period Type: |
duration |
|
National Fuel Gas (NYSE:NFG)
Historical Stock Chart
From Mar 2024 to Apr 2024

National Fuel Gas (NYSE:NFG)
Historical Stock Chart
From Apr 2023 to Apr 2024
