~ Quarterly Revenue Grows to $200 Million
~
~ Same-Store Sales Growth Increases 16%
~
~ Quarterly Pretax Earnings Increases
Ten-fold ~
~ Raises 2016 Annual Guidance ~
MarineMax, Inc. (NYSE:HZO), the nation’s largest recreational
boat and yacht retailer, today announced results for its second
quarter ended March 31, 2016.
Revenue grew 16% to $199.6 million for the quarter ended March
31, 2016 from $172.1 million for the comparable quarter last year.
Same-store sales grew more than 16% which is on top of 27% growth
in the same period a year ago. The Company’s pretax earnings were
$4.0 million compared with $390,000 for the same period a year ago,
an increase of more than 10 times. The Company reported net income
of $2.4 million, or $0.10 per diluted share for the quarter ended
March 31, 2016 compared to net income of $390,000, or $0.02 per
diluted share for the comparable quarter last year. In the same
period last year, the Company was not required to provide an income
tax provision.
Revenue increased 12% to $369.1 million for the six months ended
March 31, 2016 compared with $330.3 million for the comparable
period last year. Same-store sales grew more than 12% on top of 35%
growth for the comparable period last year. The Company’s pretax
earnings were $5.4 million compared with $604,000 for the same
period a year ago. Net income for the six months ended March 31,
2016 was $3.3 million or $0.13 per diluted share, compared to net
income of $604,000, or $0.02 per diluted share for the comparable
period last year. In the same period last year, the Company was not
required to provide an income tax provision.
William H. McGill, Jr., Chairman, President, and Chief Executive
Officer, stated, “We are excited by our results in the quarter and
through the first half of the year. Our performance continues to be
driven by new products from our premium manufacturing partners as
well as great execution by our team on our customer centric
strategies. Our same-store sales growth this quarter provides
additional evidence that the pace of the boating recovery is
continuing to build, especially for MarineMax.”
Mr. McGill continued, “With our product line expansions over the
past few years, combined with new models from our partners, we
expect to continue our ongoing market share gains and improved
earnings performance. We are certainly encouraged by our backlog of
orders, the right inventory mix, a broader geographic reach with
our recent Northeast coastal acquisition of Russo Marine, and the
fact that we are entering the busiest selling season of the year.
Our team is fully engaged as they execute on our strategy to
maximize our customers’ enjoyment of the boating lifestyle, as we
create long-term shareholder value and happy customers.”
2016 Guidance
Based on current business conditions, retail trends and other
factors, the Company is raising annual guidance expectations for
fully taxed earnings per diluted share to be in the range of $0.68
to $0.75 for fiscal 2016 from its previous guidance of $0.60 to
$0.70. This compares to an adjusted, but fully taxed, diluted
earnings per share of $0.47 in fiscal 2015. The adjustments to
fiscal 2015 are the removal of certain gains and a deferred tax
asset valuation allowance reversal noted in previous earnings
releases. These expectations do not take into account, or give
effect, for possible material acquisitions that may potentially be
completed by the Company during the fiscal year or other unforeseen
events.
About MarineMax
Headquartered in Clearwater, Florida, MarineMax is the nation’s
largest recreational boat and yacht retailer. Focused on premium
brands, such as Sea Ray, Boston Whaler, Meridian, Hatteras, Azimut
Yachts, Ocean Alexander, Galeon, Grady-White, Harris, Crest, Scout,
Sailfish, Sea Pro, Scarab Jet Boats, Aquila, and Nautique,
MarineMax sells new and used recreational boats and related marine
products and services as well as provides yacht brokerage and
charter services. MarineMax currently has 56 retail locations in
Alabama, California, Connecticut, Florida, Georgia, Maryland,
Massachusetts, Minnesota, Missouri, New Jersey, New York, North
Carolina, Ohio, Oklahoma, Rhode Island, and Texas and operates
MarineMax Vacations in Tortola, British Virgin Islands. MarineMax
is a New York Stock Exchange-listed company. For more information,
please visit www.marinemax.com.
Certain statements in this press release are forward-looking as
defined in the Private Securities Litigation Reform Act of 1995.
Such forward-looking statements include the Company's anticipated
financial results for the second quarter ended March 31, 2016; our
expectation to continue our ongoing market share gains and improved
earnings performance; our belief that we are entering the time of
the year that is typically our busiest selling season; and our
creation of long-term shareholder value. These statements involve
certain risks and uncertainties that may cause actual results to
differ materially from expectations as of the date of this release.
These risks include the Company’s abilities to reduce inventory,
manage expenses and accomplish its goals and strategies, the
quality of the new product offerings from the Company's
manufacturing partners, general economic conditions, as well as
those within our industry, and the level of consumer spending, the
Company’s ability to integrate acquisitions into existing
operations, and numerous other factors identified in the Company’s
Form 10-K for the fiscal year ended September 30, 2015 and other
filings with the Securities and Exchange Commission.
MarineMax, Inc. and
Subsidiaries
Condensed Consolidated Statements of
Operations
(Amounts in thousands, except share and
per share data)
(Unaudited)
Three Months Ended March 31, Six Months
Ended March 31, 2016
2015 2016 2015
Revenue $ 199,566 $ 172,143 $ 369,103 $ 330,269 Cost of sales
150,539 129,943 278,462 250,614 Gross
profit 49,027 42,200 90,641 79,655 Selling, general, and
administrative expenses 43,459 40,557 82,410
76,652 Income from operations 5,568 1,643 8,231 3,003
Interest expense 1,582 1,253 2,809
2,399 Income before income tax provision 3,986 390 5,422 604
Income tax provision 1,564 — 2,111 —
Net income $ 2,422 $ 390 $ 3,311 $ 604 Basic net income per
common share $ 0.10 $ 0.02 $ 0.14 $ 0.02 Diluted net income
per common share $ 0.10 $ 0.02 $ 0.13 $ 0.02 Weighted
average number of common shares used in computing net income per
common share: Basic 24,154,397 24,544,272
24,183,926 24,409,969 Diluted 24,696,881
25,265,857 24,699,601 25,105,262
MarineMax, Inc. and
Subsidiaries
Condensed Consolidated Balance
Sheets
(Amounts in thousands)
(Unaudited)
March 31, 2016 March 31, 2015
ASSETS CURRENT ASSETS: Cash and cash equivalents $ 43,974 $
42,695 Accounts receivable, net 31,855 23,046 Inventories, net
346,411 277,030 Prepaid expenses and other current assets 10,858
3,876 Deferred tax assets, net 7,644 —
Total current assets 440,742 346,647 Property and equipment,
net 113,012 108,100 Other long-term assets, net 3,850 5,257
Deferred tax assets, net 17,572 — Total
assets $ 575,176 $ 460,004
LIABILITIES AND
STOCKHOLDERS’ EQUITY CURRENT LIABILITIES: Accounts payable $
26,998 $ 11,928 Customer deposits 19,707 17,157 Accrued expenses
22,505 20,741 Short-term borrowings 219,030
165,287 Total current liabilities 288,240 215,113
Long-term liabilities 651 345 Total
liabilities 288,891 215,458 STOCKHOLDERS' EQUITY: Preferred
stock — — Common stock 26 25 Additional paid-in capital 236,885
232,586 Retained earnings 78,744 27,745 Treasury stock
(29,370 ) (15,810 ) Total stockholders’ equity
286,285 244,546 Total liabilities and
stockholders’ equity $ 575,176 $ 460,004
View source
version on businesswire.com: http://www.businesswire.com/news/home/20160426005299/en/
MarineMax, Inc.Michael H. McLambChief Financial OfficerAbbey
HeimensenPublic Relations727-531-1700orIntegrated Corporate
Relations, Inc.Investor Relations:Brad Cohen,
203-682-8211Media:Susan Hartzell, 203-682-8238
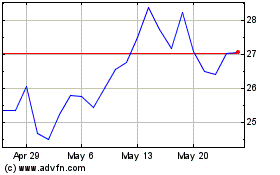
MarineMax (NYSE:HZO)
Historical Stock Chart
From Jun 2024 to Jul 2024

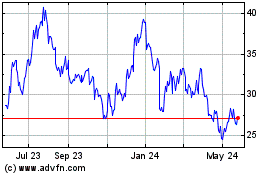
MarineMax (NYSE:HZO)
Historical Stock Chart
From Jul 2023 to Jul 2024
