Mining giant Newmont Mining
Corporation’s (NEM) second quarter-2012 adjusted earnings
of 59 cents a share came in significantly behind last year’s
earnings of 90 cents, and missed the Zacks Consensus Estimate of 94
cents by a huge margin.
Reported profit plunged a
staggering 47% to $279 million, or 56 cents per share, in the
quarter, from $523 million (or $1.06 per share) in the prior-year
quarter.
Revenues went down 6% year over
year to $2.2 billion and trailed the Zacks Consensus Estimate of
$2.4 billion. The company’s below par performance in the second
quarter did not go down well with the investors and the stock lost
almost 4% in extended trading.
Newmont’s attributable gold and
copper production declined 3% and 10%, respectively, from last year
to 1.18 million ounces and 38 million pounds. On a year-over-year
basis, attributable gold and copper sales also dropped 6% and 35%,
respectively, to 1.14 million ounces and 29 million pounds.
Moreover, cost applicable to sales
(CAS) went up 17% from last year to $681 per ounce of gold, whereas
average realized price of gold improved only 6% to $1,598 per
ounce. In addition, copper costs shot up 75% year over year and
this was further compounded by a 25% fall in average realized price
of copper.
The company, which is the only gold
equity in the S&P 500, has had a challenging year so far. The
stock is down roughly 23% this year as against an 8.14% gain
recorded by the S&P 500. It has struggled with various
bottlenecks at its mines, such as protests in Peru and declining
grades.
Regional
Performance
North America:
Gold production at Newmont’s Nevada and La Herradura mines
increased 6% and 11%, respectively, due to higher mill throughput
and higher leach placement. However, lower grade at Midas and
Phoenix in Nevada partially offset growth.
CAS per ounce jumped 13% at Nevada
as a result of higher underground mining costs, higher royalties
and lower by-product credits. Also, La Herradura saw CAS per ounce
increase 11% year over year due to higher waste tons mined, higher
diesel and higher employee profit sharing costs. Newmont has
lowered the gold production outlook for both the mines this
year.
South America:
Gold production at Yanacocha in Peru increased 14% from last year
driven by higher mill grade and recovery, but partially offset by
lower leach placement. CAS per ounce declined 14% year over year as
a result of the production jump and lower mining costs. However,
higher workers' participation costs and lower by-product credits
kept costs from declining further.
Newmont has lowered its 2012
production outlook in South America as well. The company expects to
produce 675,000 to 700,000 ounces at Yanacocha as against the
earlier expectation of 690,000 to 750,000 ounces.
Asia Pacific:
Newmont operates three mines in the Asia-Pacific, namely,
Boddington in Australia, Batu Hijau in Indonesia and Others in
Australia/New Zealand. Boddington produced 180,000 ounces of gold
and 18 million pounds of copper. Gold production was down 10% from
last year due to lower mill grade and recovery but CAS per ounce
jumped 48%, driven by lower gold production and higher milling
costs.
At Batu Hijau, both gold and copper
production fell 68% and 25% to 8,000 ounces and 20 million pounds,
respectively. CAS per ounce of gold and per pound of copper bounced
92% and 79%, respectively. At Others in Australia/New Zealand, gold
production dropped 15% year over year to 207,000 ounces while CAS
per ounce jumped 38%.
The mines suffered from lower
grades, higher costsand a stronger Australian dollar. Newmont has
cut the production forecast for all three mines in the
Asia-Pacific.
Africa:
Attributable gold production at the company’s Ahafo mine in Ghana
dropped 10% from last year to 132,000 ounces as a result of lower
mill throughput and grade. In addition, CAS per ounce jumped 31%
year over year, driven by lower production and higher labor, diesel
and mine maintenance costs. Like other mines, Newmont lowered its
production forecast in this region as well.
Financial
Position
Newmont had cash and cash
equivalents of $1.9 billion as of June 30, 2012, slightly higher
than the $1.85 billion it had as of June 30, 2011. However, the
company’s long-term debt increased significantly to $6.1 billion as
of June 30, 2012 from $3.8 billion as of June 30, 2011.
Consolidated capital expenditure in
the second quarter came in at $882 million, up from $618 million
last year. Newmont has lowered its capital expenditure forecast for
2012 on the account of delays in developing the Conga project in
Peru. It now expects to incur attributable capital expenditure in
the range of $2.7 to $3 billion this year, down from the earlier
projection of $3 to $3.3 billion.
Dividend
Newmont's Board approved
third-quarter 2012 gold price-linked dividend of 35 cents per
share. The dividend is based on the average London P.M. Fix of
$1,609 per ounce for the second quarter of 2012, an increase of 17%
over the dividend paid in the second quarter of 2011.
Outlook
Newmont has cut its attributable
gold and copper production forecasts for the year. Gold production
is expected to be between 5 to 5.1 million ounces, as against 5 to
5.2 million ounces expected earlier. The drop in production outlook
is a result of lower tons mined at Tanami.
However, Newmont maintained the
forecast for the costs applicable to sales. Costs applicable to
sales on a co-product basis are expected to be between $625 and
$675 per ounce for gold. Costs applicable to copper sales on
a co-product basis are expected to be between $1.80 and $2.20 per
pound of copper.
Recommendation
Based in Colorado, Newmont is one
of the world's largest producers of gold with several active mines
in Nevada, Peru, Australia/New Zealand, Indonesia and Ghana. It
competes with the likes of AngloGold Ashanti Ltd.
(AU), Barrick Gold Corporation (ABX) and
Gold Fields Ltd. (GFI).
Newmont is well-positioned to gain
from the rising price of gold. But the company’s direct mining
costs are increasing due to declining grades, increased royalties
and other costs.
We currently have a long-term (more
than 6 months) Neutral recommendation on Newmont. The stock retains
a Zacks #3 Rank, indicating a short-term (1 to 3 months) Hold
rating.
BARRICK GOLD CP (ABX): Free Stock Analysis Report
ANGLOGOLD LTD (AU): Free Stock Analysis Report
GOLD FIELDS-ADR (GFI): Free Stock Analysis Report
NEWMONT MINING (NEM): Free Stock Analysis Report
To read this article on Zacks.com click here.
Zacks Investment Research
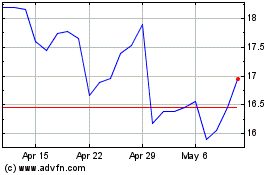
Gold Fields (NYSE:GFI)
Historical Stock Chart
From Jun 2024 to Jul 2024

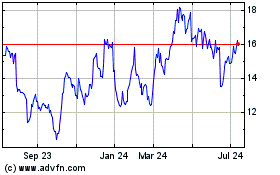
Gold Fields (NYSE:GFI)
Historical Stock Chart
From Jul 2023 to Jul 2024
