UNITED STATES
SECURITIES AND EXCHANGE COMMISSION
Washington, D.C. 20549
FORM 6-K
Report of Foreign Private Issuer
Pursuant to Rule 13a-16 or 15d-16
under the Securities Exchange Act of 1934
For July 2023
Commission File Number: 1-34513
CENOVUS ENERGY INC.
(Translation of registrant’s name into English)
4100, 225 6 Avenue S.W.
Calgary, Alberta, Canada T2P 1N2
(Address of principal executive office)
Indicate by check mark whether the registrant files or will file annual reports under cover of Form 20-F or Form 40-F.
Form 20-F ☐ Form 40-F ☒
Indicate by check mark if the registrant is submitting the Form 6-K in paper as permitted by Regulation S-T Rule 101(b)(1): ☐
Indicate by check mark if the registrant is submitting the Form 6-K in paper as permitted by Regulation S-T Rule 101(b)(7): ☐
Exhibit 99.2 and 99.3 to this report, furnished on Form 6-K, shall be incorporated by reference into or as an exhibit to, as applicable, each of the registrant’s Registration Statements under the Securities Act of 1933, as amended: Form F-10 (File No. 333-259814), Form S-8 (File Nos. 333-163397 and 333-251886), Form F-3D (File No. 333-202165).
DOCUMENTS FILED AS PART OF THIS FORM 6-K
See the Exhibit Index to this Form 6-K.
SIGNATURES
Pursuant to the requirements of the Securities Exchange Act of 1934, the registrant has duly caused this report to be signed on its behalf by the undersigned, thereunto duly authorized.
Date: July 27, 2023
| | | | | | | | | | | | | | | | | |
| | | CENOVUS ENERGY INC. | | |
| | | (Registrant) | | |
| | | | | | | | | | | | | | | | | | | | | | | | | | |
| | By: | | /s/ Christine D. Lee | | |
| | | | Name: | | Christine D. Lee | | |
| | | | Title: | | Assistant Corporate Secretary | | |
Form 6-K Exhibit Index
| | | | | | | | |
| Exhibit No. | | |
| | |
| | News Release dated July 27, 2023 |
| | |
| | Management’s Discussion and Analysis dated July 26, 2023 for the period ended June 30, 2023 |
| | |
| | Interim Consolidated Financial Statements (unaudited) for the period ended June 30, 2023 |
| | |
| | Form 52-109F2 Full Certificate, dated July 27, 2023, of Jonathan M. McKenzie, President & Chief Executive Officer |
| | |
| | Form 52-109F2 Full Certificate, dated July 27, 2023, of Jeffrey R. Hart, Executive Vice-President & Chief Financial Officer |
Cenovus announces 2023 second-quarter results and organizational update
Calgary, Alberta (July 27, 2023) – Cenovus Energy Inc. (TSX: CVE) (NYSE: CVE) generated nearly $2.0 billion in cash from operating activities, approximately $1.9 billion in adjusted funds flow and $897 million in free funds flow in the second quarter of 2023. Total upstream production was approximately 730,000 barrels of oil equivalent per day (BOE/d)1, reflecting a planned turnaround at Foster Creek and production impacts in the Conventional segment in May and June due to Alberta wildfire activity. Downstream throughput averaged almost 538,000 barrels per day (bbls/d), increasing in the quarter as volumes ramped up following restart work at the Superior and Toledo refineries.
“We achieved significant operational milestones across the company over the quarter,” said Jon McKenzie, Cenovus President & Chief Executive Officer. “With all that we have accomplished during the quarter, we’re well positioned for the back half of 2023 and beyond.”
Highlights
•Ramped up throughput at the Toledo Refinery, which is now fully operational. The Superior Refinery is processing crude oil and continues to progress the start-up of its fluid catalytic cracking unit.
•Delivered $575 million to shareholders in the second quarter through buybacks and common share dividends; in addition to the purchase and cancellation of 45.5 million outstanding warrants for $711 million.
•Achieved a major milestone on the West White Rose project as the company completed the concrete pour on the offshore platform’s conical slip.
•Successfully completed a three-week turnaround at the company’s Foster Creek oil sands project.
•Released Cenovus’s 2022 environmental, social and governance (ESG) report, detailing overall sustainability performance and progress on the company’s ESG targets, as well as a new milestone to reduce absolute methane emissions in upstream operations by 80% by year-end 2028, from a 2019 baseline.
| | | | | | | | | | | | | | | | | |
| Financial, production & throughput summary |
| (For the period ended June 30) | 2023 Q2 | 2023 Q1 | % change | 2022 Q2 | % change |
| Financial ($ millions, except per share amounts) |
| Cash from (used in) operating activities | 1,990 | (286) | | 2,979 | (33) |
Adjusted funds flow2 | 1,899 | 1,395 | 36 | 3,098 | (39) |
Per share (basic)2 | 1.00 | 0.73 | | 1.57 | |
Per share (diluted)2 | 0.98 | 0.71 | | 1.53 | |
| Capital investment | 1,002 | 1,101 | (9) | 822 | 22 |
Free funds flow2 | 897 | 294 | 205 | 2,276 | (61) |
Excess free funds flow2 | 505 | (499) | | 2,020 | (75) |
| Net earnings (loss) | 866 | 636 | 36 | 2,432 | (64) |
| Per share (basic) | 0.45 | 0.33 | | 1.23 | |
| Per share (diluted) | 0.44 | 0.32 | | 1.19 | |
| Long-term debt, including current portion | 8,534 | 8,681 | (2) | 11,228 | (24) |
| Net debt | 6,367 | 6,632 | (4) | 7,535 | (16) |
| Production and throughput (before royalties, net to Cenovus) |
Oil and NGLs (bbls/d)1 | 608,400 | 636,200 | (4) | 614,200 | (1) |
| Conventional natural gas (MMcf/d) | 729.4 | 857.0 | (15) | 882.2 | (17) |
Total upstream production (BOE/d)1 | 729,900 | 779,000 | (6) | 761,500 | (4) |
Total downstream throughput (bbls/d) | 537,800 | 457,900 | 17 | 457,300 | 18 |
1 See Advisory for production by product type.
2 Non-GAAP financial measure or contains a non-GAAP financial measure. See Advisory.
Organizational changes
To reflect the further evolution of Cenovus as a company over the past two years, the Board of Directors has approved some role changes on Cenovus’s executive team. Effective September 1, 2023:
•Keith Chiasson (Executive Vice-President, Downstream) will become Cenovus’s Executive Vice-President & Chief Operating Officer, responsible for all aspects of the company’s operations.
•Doreen Cole (Senior Vice-President, Downstream Manufacturing) will join Cenovus’s executive team as Executive Vice-President, Downstream.
•Drew Zieglgansberger (Executive Vice-President, Natural Gas & Technical Services) will become Cenovus’s Executive Vice-President & Chief Commercial Officer, a new role responsible for all commercial arrangements across the company, including strategy, business development, planning and marketing.
•Andrew Dahlin (Executive Vice-President, Corporate & Operations Services) will take on the role of Executive Vice-President, Natural Gas & Technical Services.
•Jeff Hart (Executive Vice-President & Chief Financial Officer) will become Executive Vice-President, Corporate & Operations Services.
•Kam Sandhar (Executive Vice-President, Strategy & Corporate Development) will become Executive Vice-President & Chief Financial Officer and continue to be responsible for Investor Relations.
There are no planned changes to the roles of Susan Anderson, Senior Vice-President, People Services, Rhona DelFrari, Chief Sustainability Officer & Executive Vice-President, Stakeholder Engagement, Gary Molnar, Senior Vice-President, Legal, General Counsel & Corporate Secretary, and Norrie Ramsay, Executive Vice-President, Upstream – Thermal, Major Projects & Offshore.
“These changes reflect the capability and versatility of Cenovus’s exceptional executive team. I have absolute confidence they will continue to generate value for our shareholders,” said McKenzie. “Our executive team structure will now better reflect the size and complexity of the company we are today.”
Board update
The company also announced today that, due to the demands of other commitments, Canning K.N. Fok retired from the Cenovus Board of Directors effective July 26, 2023, and confirms that Mr. Fok will continue to support and assist the company as the CEO of one of its major shareholders. It is expected that, in accordance with the standstill agreements entered into at the time of the Husky Energy transaction, a new director to replace Mr. Fok will be nominated before the end of the year.
“On behalf of the entire Board, I would like to thank Canning for his valuable insights, experience and commitment during his service as a member of the Board,” said Alex Pourbaix, Executive Chair of the Board. “As a director of Cenovus since the Husky Energy transaction, Canning has been a thoughtful and effective contributor to the integration and success of the combined organization."
Second-quarter results
Operating results1
Cenovus’s total revenues were approximately $12.2 billion in the second quarter, in line with $12.3 billion in the first quarter of 2023. Upstream revenues were about $6.8 billion, similar to the previous quarter, and downstream revenues were $7.6 billion, compared with nearly $7.4 billion in the first quarter. Total operating margin3 was $2.4 billion, compared with about $2.1 billion in the first quarter. Upstream operating margin4 was approximately $2.3 billion, an increase from $1.7 billion in the prior
CENOVUS ENERGY NEWS RELEASE | 2
quarter, primarily driven by a tighter light-heavy differential and lower condensate blending costs, partially offset by lower Brent and West Texas Intermediate (WTI) crude oil prices and decreased production volumes. Downstream operating margin4 was $143 million, compared with $391 million in the first quarter. U.S. Manufacturing operating margin was negatively impacted by approximately $170 million due to the cost of processing crude oil purchased in prior periods at higher prices as well as the narrowing of heavy oil differentials.
Total upstream production was 729,900 BOE/d in the second quarter, a decrease from the first quarter as the company experienced production impacts due to Alberta wildfire activity and planned maintenance. Foster Creek production of 167,000 bbls/d, compared with 190,000 bbls/d in the first quarter, reflects a planned three-week turnaround that was completed in the second quarter. Christina Lake production was 234,900 bbls/d, in line with the prior quarter as the company continued to progress its redevelopment and redrill program, including new well pads at both Foster Creek and Christina Lake. Sunrise production was 46,500 bbls/d, in line with first-quarter production of 44,500 bbls/d. At the Lloydminster thermal projects, production increased to 106,200 bbls/d from 99,000 bbls/d in the prior quarter, as the company continued to focus on optimization of the asset.
In response to the Alberta wildfires that began in May and continued into early June, Cenovus shut in several producing conventional fields and processing plants as a precaution. Production in the Conventional segment was 104,600 BOE/d in the second quarter compared with 123,900 BOE/d in the first quarter. No significant damage was identified at any Cenovus assets, and production at all facilities returned to normal rates in late June, with the exception of approximately 5,000 BOE/d to 7,000 BOE/d currently offline at the Rainbow Lake facility due to electric power constraints from a third-party provider. Cenovus estimates the annualized impact to production in the Conventional segment to be approximately 8,000 BOE/d to 10,000 BOE/d, and as a result has revised Conventional production guidance to between 115,000 BOE/d and 130,000 BOE/d.
In the Offshore segment, production was 51,500 BOE/d compared with 65,600 BOE/d in the previous quarter. In Asia Pacific, sales volumes decreased compared with the first quarter as a result of a temporary unplanned outage in China, when an unauthorized vessel travelled into a dedicated pipeline corridor and struck an umbilical line. In Indonesia, sales volumes were higher than the first quarter of 2023, with the MBH and MDA fields continuing to ramp up. In the Atlantic region, production was 5,300 bbls/d compared with 8,900 bbls/d in the first quarter as the company advanced a planned turnaround at the SeaRose floating production, storage and offloading (FPSO) vessel, originally scheduled for the fall, into the first and second quarters. Light crude oil from production at the White Rose field is offloaded from the SeaRose FPSO to tankers and stored at an onshore terminal before shipment to buyers, which results in a timing difference between production and sales. There were no sales volumes in the second quarter due to this timing. The non-operated Terra Nova FPSO remains dockside in Newfoundland and Labrador, as it continues to undergo maintenance as part of its asset life extension program.
In U.S. Manufacturing, crude throughput was 442,500 bbls/d, an increase of 23%, compared with 359,200 bbls/d in the first quarter. The Superior Refinery introduced crude oil in mid-March and increased throughput throughout the second quarter. Cenovus began restarting the Toledo Refinery in April, ramping up volumes through the second quarter, and the facility is now fully operational. The Toledo and Superior refineries are both producing saleable products. The company’s Lima Refinery continues to deliver strong performance, with 93% utilization achieved in the quarter. At the non-operated Borger Refinery, utilization was impacted by a planned turnaround and temporary unplanned outages. The refinery is now fully operational. The non-operated Wood River Refinery completed a planned turnaround in May and is now fully operational.
3 Non-GAAP financial measure. Total operating margin is the total of Upstream operating margin plus Downstream operating margin. See Advisory.
4 Specified financial measure. See Advisory.
CENOVUS ENERGY NEWS RELEASE | 3
Crude utilization in the Canadian Manufacturing segment was 86% with throughput of 95,300 bbls/d, compared with crude utilization and throughput of 89% and 98,700 bbls/d in the first quarter.
Financial results
Second-quarter cash from operating activities, which includes changes in non-cash working capital, was nearly $2.0 billion, compared with cash used in operating activities of $286 million in the first quarter of 2023. Adjusted funds flow was $1.9 billion, compared with $1.4 billion in the prior period, and free funds flow increased to $897 million from $294 million in the first quarter. Second-quarter financial results improved compared with the first quarter, primarily due to higher price realizations in the Oil Sands segment, driven by narrower light-heavy crude oil differentials and lower condensate prices. In addition, Oil Sands segment sales volumes outpaced production by approximately 4,000 BOE/d as the company drew down product inventory built through the first quarter of 2023 and fourth quarter of 2022. These factors were partially offset by higher operating costs in the U.S. Manufacturing segment related to the commissioning and start-up of the Superior and Toledo refineries, as well as planned and unplanned maintenance at Borger. Results in the U.S. Manufacturing segment were lower by approximately $170 million due to the cost of processing crude oil purchased in prior periods at higher prices, in addition to lower sales volumes than production volumes due to inventory build-up at the Lima Refinery and a normal time lag expected on sales with the ramp up of the Toledo and Superior refineries.
Capital investment of $1.0 billion in the second quarter was primarily directed towards sustaining production in the Oil Sands segment, the ongoing construction of the West White Rose project and the Terra Nova asset life extension, in addition to refining reliability initiatives in the U.S. Manufacturing segment and completing rebuild activities at the Superior Refinery.
Net earnings in the second quarter were $866 million, compared with $636 million in the previous quarter. The increase in net earnings was primarily due to higher operating margin and a favourable unrealized foreign exchange gain, partially offset by higher income tax.
Long-term debt, including the current portion, was $8.5 billion at June 30, 2023, compared with $8.7 billion as at March 31, 2023. Net debt was approximately $6.4 billion at June 30, 2023, a decrease of $265 million from March 31, 2023, primarily due to an increase in free funds flow generated in the second quarter of 2023 compared with the prior quarter. The company continues to focus on making progress towards its net debt target of $4.0 billion.
2023 guidance updates
Cenovus has revised its 2023 corporate guidance to reflect the company’s updated outlook for commodity prices, production and operating expenses for the remainder of the year. It is available on cenovus.com under Investors.
Changes to the company’s 2023 guidance include:
•Reducing Conventional output by 10,000 BOE/d to a range of 115,000 BOE/d to 130,000 BOE/d as a result of the production impact from wildfires in Alberta.
•Lowering Lloydminster thermal production by 5,000 bbls/d to a range of 100,000 bbls/d to 110,000 bbls/d, reflecting year-to-date operating performance.
•Adjusting the total production range by 15,000 BOE/d to between 775,000 BOE/d and 795,000 BOE/d.
•Expected cash taxes for 2023 have been lowered at the midpoint by $200 million, to a revised range of $1.1 billion to $1.4 billion for 2023.
CENOVUS ENERGY NEWS RELEASE | 4
In addition, the company has updated Conventional operating expenses and royalties, and revised its commodity price deck and sensitivities. The company continues to execute its capital program and there has been no change to Cenovus’s expected capital investment range of $4.0 billion to $4.5 billion.
Dividend declarations and share purchases
The Board of Directors has declared a quarterly base dividend of $0.14 per common share, payable on September 29, 2023 to shareholders of record as of September 15, 2023. In addition, the Board has declared a quarterly dividend on each of the Cumulative Redeemable First Preferred Shares – Series 1, Series 2, Series 3, Series 5 and Series 7 – payable on October 3, 2023 to shareholders of record as of September 15, 2023 as follows:
| | | | | | | | |
| Preferred shares dividend summary |
| Rate (%) | Amount ($/share) |
| Share series |
| Series 1 | 2.577 | 0.16106 |
| Series 2 | 6.293 | 0.39655 |
| Series 3 | 4.689 | 0.29306 |
| Series 5 | 4.591 | 0.28694 |
| Series 7 | 3.935 | 0.24594 |
All dividends paid on Cenovus’s common and preferred shares will be designated as “eligible dividends” for Canadian federal income tax purposes. Declaration of dividends is at the sole discretion of the Board and will continue to be evaluated on a quarterly basis.
Cenovus’s shareholder returns framework has a target of returning 50% of excess free funds flow to shareholders for quarters where the ending net debt is between $9.0 billion and $4.0 billion. In the second quarter, the company bought approximately 14 million shares under its normal course issuer bid (NCIB), delivering $310 million in returns to shareholders. In June, Cenovus reached separate agreements with each of Hutchison Whampoa Europe Investments S.à r.l. (HWEI) and L.F. Investments S.à r.l. (LFI) to purchase for cancellation all of the warrants held by HWEI and LFI, respectively, representing an aggregate of 45,484,672 warrants (CVE.WT), for a total of $711 million. The company has negotiated payment terms that provide flexibility to work within its shareholder returns framework, and at its discretion Cenovus has the option to pay the aggregate warrant purchase price of $711 million through the remainder of 2023, within each quarter’s excess free funds flow, with full payment being made no later than January 5, 2024. In the second quarter, the company elected to direct excess free funds flow to its NCIB program, and as a result no payment was made to either HWEI or LFI as part of the warrant purchases.
2023 planned maintenance
The following table provides details on planned maintenance activities at Cenovus assets through the remainder of 2023 and anticipated production or throughput impacts.
| | | | | | | | |
| 2023 planned maintenance |
| Potential quarterly production/throughput impact (Mbbls/d) |
| Q3 | Q4 |
| Upstream |
| Lloydminster Thermals | 1 - 2 | - |
| Downstream |
| U.S. Manufacturing | 10 - 12 | 55 - 65 |
CENOVUS ENERGY NEWS RELEASE | 5
Sustainability
During the quarter, Cenovus released its 2022 ESG report, updating progress the company made towards targets in its five ESG focus areas: climate & greenhouse gas (GHG) emissions, water stewardship, biodiversity, Indigenous reconciliation and inclusion & diversity. Cenovus also announced a milestone to reduce absolute methane emissions in its upstream operations by 80% by year-end 2028, from a 2019 baseline. This is a key milestone towards the company’s target to reduce absolute GHG emissions by 35% by year-end 2035 as Cenovus builds toward its long-term ambition of achieving net zero emissions from operations by 2050.
The ESG report shows continued progress in several areas, including reducing absolute methane emissions in upstream operations by 32% from 2021 levels, and 59% between 2019 and 2022. The company also spent $395 million, or the equivalent of more than $1 million each day in 2022, with Indigenous businesses in areas such as engineering and construction services. Building on this work, Cenovus has now achieved its target of spending at least $1.2 billion with Indigenous businesses between 2019 and year-end 2025. The company continues to seek additional opportunities to expand the scope of work it does with Indigenous communities and businesses in the areas that it operates.
In addition, Cenovus has achieved its aspiration to have at least 40% representation from designated groups (defined as women, Indigenous peoples, persons with disabilities and members of visible minorities) among non-management members of the Board of Directors by year-end 2025. Cenovus recognizes and embraces the benefits of having a diverse Board, with a Board Diversity Policy committing it to seeking highly qualified directors and to consider diversity when determining the best composition for the Board.
CENOVUS ENERGY NEWS RELEASE | 6
| | |
Conference call today
9 a.m. Mountain Time (11 a.m. Eastern Time)
Cenovus will host a conference call today, July 27, 2023, starting at 9 a.m. MT (11 a.m. ET). To join the conference call without operator assistance, please register here approximately 5 minutes in advance to receive an automated call-back when the session begins.
Alternatively, you can dial 888-664-6383 (toll-free in North America) or 416-764-8650 to reach a live operator who will join you into the call. A live audio webcast will also be available and will be archived for approximately 90 days.
|
Advisory
Basis of Presentation
Cenovus reports financial results in Canadian dollars and presents production volumes on a net to Cenovus before royalties basis, unless otherwise stated. Cenovus prepares its financial statements in accordance with International Financial Reporting Standards (IFRS).
Barrels of Oil Equivalent
Natural gas volumes have been converted to barrels of oil equivalent (BOE) on the basis of six thousand cubic feet (Mcf) to one barrel (bbl). BOE may be misleading, particularly if used in isolation. A conversion ratio of one bbl to six Mcf is based on an energy equivalency conversion method primarily applicable at the burner tip and does not represent value equivalency at the wellhead. Given that the value ratio based on the current price of crude oil compared with natural gas is significantly different from the energy equivalency conversion ratio of 6:1, utilizing a conversion on a 6:1 basis is not an accurate reflection of value.
Product types
| | | | | |
| Product type by operating segment |
| Three months ended
June 30, 2023 |
| Oil Sands |
| Bitumen (Mbbls/d) | 554.6 |
| Heavy crude oil (Mbbls/d) | 17 |
| Conventional natural gas (MMcf/d) | 12.9 |
| Total Oil Sands segment production (MBOE/d) | 573.8 |
| Conventional | |
| Light crude oil (Mbbls/d) | 4.8 |
| Natural gas liquids (Mbbls/d) | 18 |
| Conventional natural gas (MMcf/d) | 491.4 |
| Total Conventional segment production (MBOE/d) | 104.6 |
| Offshore | |
| Light crude oil (Mbbls/d) | 5.3 |
| Natural gas liquids (Mbbls/d) | 8.7 |
| Conventional natural gas (MMcf/d) | 225.1 |
| Total Offshore segment production (MBOE/d) | 51.5 |
| Total upstream production (MBOE/d) | 729.9 |
CENOVUS ENERGY NEWS RELEASE | 7
Forward‐looking Information
This news release contains certain forward‐looking statements and forward‐looking information (collectively referred to as “forward‐looking information”) within the meaning of applicable securities legislation about Cenovus’s current expectations, estimates and projections about the future of the company, based on certain assumptions made in light of the company’s experiences and perceptions of historical trends. Although Cenovus believes that the expectations represented by such forward‐looking information are reasonable, there can be no assurance that such expectations will prove to be correct.
Forward‐looking information in this document is identified by words such as “anticipate”, “continue”, “deliver”, “expect”, “estimate”, “focus”, “milestone”, “position”, “progress”, “target” and “will” or similar expressions and includes suggestions of future outcomes, including, but not limited to, statements about: performance for the rest of 2023 and beyond; Cenovus’s five ESG focus areas, commitments, targets and ambition, including the governance, strategies, plans and milestones for achieving them; reducing absolute net equity-based scope 1 and 2 GHG emissions by 35% by year-end 2035 from 2019 levels including reducing absolute methane emissions in upstream operations by 80% by year-end 2028 and long-term ambition to achieve net zero GHG emissions from operations by 2050; achieving net debt of $4.0 billion; generating value for shareholders; progressing the start-up of the fluid catalytic cracking unit at the Superior Refinery; the redevelopment and redrill program at Christina Lake and Foster Creek; ongoing construction of the West White Rose project and the Terra Nova asset life extension; planned turnaround activities; dividend payments; excess free funds flow under the shareholder returns framework; and revised 2023 corporate guidance.
Developing forward‐looking information involves reliance on a number of assumptions and consideration of certain risks and uncertainties, some of which are specific to Cenovus and others that apply to the industry generally. The factors or assumptions on which the forward‐looking information in this news release are based include, but are not limited to: the allocation of free funds flow to reducing net debt; commodity prices, inflation and supply chain constraints; Cenovus’s ability to produce on an unconstrained basis; Cenovus’s ability to access sufficient insurance coverage to pursue development plans; Cenovus’s ability to deliver safe and reliable operations and demonstrate strong governance; and the assumptions inherent in Cenovus’s revised 2023 Guidance available on cenovus.com.
The risk factors and uncertainties that could cause actual results to differ materially from the forward‐looking information in this news release include, but are not limited to: the accuracy of estimates regarding commodity production and operating expenses, inflation, taxes, royalties, capital costs and currency and interest rates; risks inherent in the operation of Cenovus’s business; and risks associated with climate change and Cenovus’s assumptions relating thereto and other risks identified under “Risk Management and Risk Factors” and “Advisory” in Cenovus’s Management’s Discussion and Analysis (MD&A) for the year ended December 31, 2022.
Except as required by applicable securities laws, Cenovus disclaims any intention or obligation to publicly update or revise any forward‐looking statements, whether as a result of new information, future events or otherwise. Readers are cautioned that the foregoing lists are not exhaustive and are made as at the date hereof. Events or circumstances could cause actual results to differ materially from those estimated or projected and expressed in, or implied by, the forward‐looking information. For additional information regarding Cenovus’s material risk factors, the assumptions made, and risks and uncertainties which could cause actual results to differ from the anticipated results, refer to “Risk Management and Risk Factors” and “Advisory” in Cenovus’s MD&A for the periods ended December 31, 2022 and June 30, 2023, and to the risk factors, assumptions and uncertainties described in other documents Cenovus files from time to time with securities regulatory authorities in Canada (available on SEDAR at sedar.com, on EDGAR at sec.gov and Cenovus’s website at cenovus.com).
CENOVUS ENERGY NEWS RELEASE | 8
Specified Financial Measures
This news release contains references to certain specified financial measures that do not have standardized meanings prescribed by IFRS. Readers should not consider these measures in isolation or as a substitute for analysis of the company’s results as reported under IFRS. These measures are defined differently by different companies and, therefore, might not be comparable to similar measures presented by other issuers. For information on the composition of these measures, as well as an explanation of how the company uses these measures, refer to the Specified Financial Measures Advisory located in Cenovus’s MD&A for the period ended June 30, 2023 (available on SEDAR at sedar.com, on EDGAR at sec.gov and on Cenovus's website at cenovus.com) which is incorporated by reference into this news release.
Upstream Operating Margin and Downstream Operating Margin
Upstream Operating Margin and Downstream Operating Margin, and the individual components thereof, are included in Note 1 to the interim Consolidated Financial Statements.
Total Operating Margin
Total Operating Margin is the total of Upstream Operating Margin plus Downstream Operating Margin.
| | | | | | | | | | | | | | | | | | | | | | | | | | | | | | | | | | | | | | | | | | | | | | | | | | | | | |
| Upstream (1) | | Downstream (1) | | Total |
| ($ millions) | Q2 2023 | | Q1 2023 | | Q2 2022 | | Q2 2023 | | Q1 2023 | | Q2 2022 | | Q2 2023 | | Q1 2023 | | Q2 2022 |
| Revenues | | | | | | | | | | | | | | | | | |
| Gross Sales | 7,399 | | 7,415 | | 11,685 | | 7,561 | | 7,368 | | 10,719 | | 14,960 | | 14,783 | | 22,404 |
| Less: Royalties | 637 | | 596 | | 1,582 | | — | | — | | — | | 637 | | 596 | | 1,582 |
| 6,762 | | 6,819 | | 10,103 | | 7,561 | | 7,368 | | 10,719 | | 14,323 | | 14,187 | | 20,822 |
| Expenses | | | | | | | | | | | | | | | | | |
| Purchased Product | 885 | | 1,069 | | 1,461 | | 6,581 | | 6,222 | | 8,919 | | 7,466 | | 7,291 | | 10,380 |
| Transportation and Blending | 2,750 | | 2,994 | | 3,238 | | — | | — | | — | | 2,750 | | 2,994 | | 3,238 |
| Operating | 883 | | 1,029 | | 1,010 | | 843 | | 754 | | 866 | | 1,726 | | 1,783 | | 1,876 |
| Realized (Gain) Loss on Risk Management | (13) | | 16 | | 563 | | (6) | | 1 | | 87 | | (19) | | 17 | | 650 |
| Operating Margin | 2,257 | | 1,711 | | 3,831 | | 143 | | 391 | | 847 | | 2,400 | | 2,102 | | 4,678 |
(1) Found in Note 1 of the June 30, 2023, or March 31, 2023, interim Consolidated Financial Statements.
CENOVUS ENERGY NEWS RELEASE | 9
Adjusted Funds Flow, Free Funds Flow and Excess Free Funds Flow
The following table provides a reconciliation of cash from (used in) operating activities found in Cenovus’s Consolidated Financial Statements to Adjusted Funds Flow, Free Funds Flow and Excess Free Funds Flow. Adjusted Funds Flow per Share – Basic and Adjusted Funds Flow per Share – Diluted are calculated by dividing Adjusted Funds Flow by the respective basic or diluted weighted average number of common shares outstanding during the period and may be useful to evaluate a company’s ability to generate cash.
| | | | | | | | | | | |
| Three Months Ended |
($ millions) | June 30, 2023 | March 31, 2022 | June 30, 2022 |
Cash From (Used in) Operating Activities (1) | 1,990 | (286) | 2,979 |
(Add) Deduct: | | | |
Settlement of Decommissioning Liabilities | (41) | (48) | (27) |
Net Change in Non-Cash Working Capital | 132 | (1,633) | (92) |
Adjusted Funds Flow | 1,899 | 1,395 | 3,098 |
Capital Investment | 1,002 | 1,101 | 822 |
Free Funds Flow | 897 | 294 | 2,276 |
Add (Deduct): | | | |
Base Dividends Paid on Common Shares | (265) | (200) | (207) |
Dividends Paid on Preferred Shares | (9) | (18) | (8) |
Settlement of Decommissioning Liabilities | (41) | (48) | (27) |
Principal Repayment of Leases | (76) | (70) | (75) |
Acquisitions, Net of Cash Acquired | (4) | (465) | (1) |
Proceeds From Divestitures | 3 | 8 | 112 |
Payment on Divestiture of Assets | — | — | (50) |
Excess Free Funds Flow | 505 | (499) | 2,020 |
(1) Found in the June 30, 2023, or the March 31, 2023, interim Consolidated Financial Statements.
Cenovus Energy Inc.
Cenovus Energy Inc. is an integrated energy company with oil and natural gas production operations in Canada and the Asia Pacific region, and upgrading, refining and marketing operations in Canada and the United States. The company is focused on managing its assets in a safe, innovative and cost-efficient manner, integrating environmental, social and governance considerations into its business plans. Cenovus common shares and warrants are listed on the Toronto and New York stock exchanges, and the company’s preferred shares are listed on the Toronto Stock Exchange. For more information, visit cenovus.com.
Find Cenovus on Facebook, Twitter, LinkedIn, YouTube and Instagram.
Cenovus contacts | | | | | |
| Investors | Media |
| Investor Relations general line 403-766-7711 | Media Relations general line 403-766-7751 |
CENOVUS ENERGY NEWS RELEASE | 10
Exhibit 99.2
Cenovus Energy Inc.
Management’s Discussion and Analysis (unaudited)
For the Periods Ended June 30, 2023
(Canadian Dollars)
MANAGEMENT’S DISCUSSION AND ANALYSIS 
| | |
For the periods ended June 30, 2023 |
This Management’s Discussion and Analysis (“MD&A”) for Cenovus Energy Inc. (which includes references to “we”, “our”, “us”, “its”, the “Company”, or “Cenovus”, and means Cenovus Energy Inc., the subsidiaries of, and partnership interests held by, Cenovus Energy Inc. and its subsidiaries) dated July 26, 2023, should be read in conjunction with our June 30, 2023 unaudited interim Consolidated Financial Statements and accompanying notes (“interim Consolidated Financial Statements”), the December 31, 2022 audited Consolidated Financial Statements and accompanying notes (“Consolidated Financial Statements”) and the December 31, 2022 MD&A (“annual MD&A”). All of the information and statements contained in this MD&A are made as of July 26, 2023, unless otherwise indicated. This MD&A contains forward-looking information about our current expectations, estimates, projections and assumptions. See the Advisory for information on the risk factors that could cause actual results to differ materially and the assumptions underlying our forward-looking information. Cenovus management (“Management”) prepared the MD&A. The Audit Committee of the Cenovus Board of Directors (“the Board”), reviewed and recommended the MD&A for approval by the Board, which occurred on July 26, 2023. Additional information about Cenovus, including our quarterly and annual reports, Annual Information Form (“AIF”) and Form 40-F, is available on SEDAR at sedar.com, on EDGAR at sec.gov, and on our website at cenovus.com. Information on or connected to our website, even if referred to in this MD&A, does not constitute part of this MD&A. Basis of Presentation
This MD&A and the interim Consolidated Financial Statements have been prepared in Canadian dollars, (which includes references to “dollar” or “$”), except where another currency has been indicated, and in accordance with International Financial Reporting Standards (“IFRS” or “GAAP”) as issued by the International Accounting Standards Board. Production volumes are presented on a before royalties basis. Refer to the Abbreviations section for commonly used oil and gas terms.
| | | | | |
| Cenovus Energy Inc. – Q2 2023 Management's Discussion and Analysis | 2 |
We are a Canadian-based integrated energy company headquartered in Calgary, Alberta. We are the second largest Canadian-based crude oil and natural gas producer, with upstream operations in Canada and the Asia Pacific region, and the second largest Canadian-based refiner and upgrader, with downstream operations in Canada and the United States (“U.S.”).
Our upstream operations include oil sands projects in northern Alberta; thermal and conventional crude oil, natural gas and natural gas liquids (“NGLs”) projects across Western Canada; crude oil production offshore Newfoundland and Labrador; and natural gas and NGLs production offshore China and Indonesia. Our downstream operations include upgrading and refining operations in Canada and the U.S., and commercial fuel operations across Canada.
Our operations involve activities across the full value chain to develop, produce, refine, transport and market crude oil, natural gas and refined petroleum products in Canada and internationally. Our physically integrated upstream and downstream operations help us mitigate the impact of volatility in light-heavy crude oil differentials and contribute to our net earnings by capturing value from crude oil and natural gas production through to the sale of finished products such as transportation fuels.
Our Strategy and Key Priorities for 2023
At Cenovus, our purpose is to energize the world to make people’s lives better. Our strategy is focused on maximizing shareholder value through competitive cost structures and optimizing margins, while delivering top-tier safety performance and sustainability leadership. The Company prioritizes Free Funds Flow generation through all price cycles to manage our balance sheet, increase shareholder returns through dividend growth and share repurchases, reinvest in our business and diversify our portfolio. On December 6, 2022, we released our 2023 budget. Our 2023 guidance as updated on July 26, 2023, is available on our website at cenovus.com. For further details see the Operating and Financial Results section of this MD&A.
In 2023, we aim to deliver on our strategy through five key objectives.
Top-Tier Safety and Operational Performance
Safe and reliable operations are our number one priority. We strive to ensure safe and reliable operations across our portfolio, including top-tier health and safety performance.
We will continue to target improved operating performance, including the safe return of the Superior Refinery to full operations and integration of the Toledo Refinery with a focus on demonstrating consistent and reliable performance at all of our operated assets.
Sustainability Leadership
Sustainability has always been deeply engrained in Cenovus’s culture. We have established ambitious targets in our five environmental, social and governance (“ESG”) focus areas and continue to progress tangible plans to meet these targets. Our five ESG focus areas are:
•Climate & GHG emissions.
•Water stewardship.
•Biodiversity.
•Indigenous reconciliation.
•Inclusion & diversity.
Additional information on Cenovus’s efforts and performance across the ESG focus areas, including our ESG targets and plans to achieve them, are available in Cenovus’s 2022 ESG report on our website at cenovus.com.
Cost Leadership
We aim to maximize shareholder value through competitive cost structures and optimized margins. While we strive to optimize our cost structure in all areas of our business, one of our focus areas is to optimize infrastructure, reduce operating and capital costs, and reduce GHG emissions at our conventional assets.
Financial Discipline and Free Funds Flow Growth
We are focused on achieving and maintaining targeted debt levels while positioning Cenovus for resiliency through all commodity price cycles. We plan to continue to deliver meaningful returns to shareholders in alignment with our financial and shareholder returns framework.
Returns-Focused Capital Allocation
We continue to take a disciplined approach to allocating capital to projects that generate returns at the bottom of the commodity price cycle and provide opportunities to sustainably grow shareholder returns.
We plan to materially progress the West White Rose project to deliver first oil in 2026.
| | | | | |
| Cenovus Energy Inc. – Q2 2023 Management's Discussion and Analysis | 3 |
Our Operations
The Company operates through the following reportable segments:
Upstream Segments
•Oil Sands, includes the development and production of bitumen and heavy oil in northern Alberta and Saskatchewan. Cenovus’s oil sands assets include Foster Creek, Christina Lake, Sunrise, Lloydminster thermal and Lloydminster conventional heavy oil assets. Cenovus jointly owns and operates pipeline gathering systems and terminals through the equity-accounted investment in Husky Midstream Limited Partnership (“HMLP”). The sale and transportation of Cenovus’s production and third-party commodity trading volumes are managed and marketed through access to capacity on third-party pipelines and storage facilities in both Canada and the U.S. to optimize product mix, delivery points, transportation commitments and customer diversification.
•Conventional, includes assets rich in NGLs and natural gas within the Elmworth-Wapiti, Kaybob‑Edson, Clearwater and Rainbow Lake operating areas in Alberta and British Columbia and interests in numerous natural gas processing facilities. Cenovus’s NGLs and natural gas production is marketed and transported, with additional third-party commodity trading volumes, through access to capacity on third-party pipelines, export terminals and storage facilities. These provide flexibility for market access to optimize product mix, delivery points, transportation commitments and customer diversification.
•Offshore, includes offshore operations, exploration and development activities in China and the east coast of Canada, as well as the equity-accounted investment in the Husky-CNOOC Madura Ltd. (“HCML”) joint venture in Indonesia.
Downstream Segments
•Canadian Manufacturing, includes the owned and operated Lloydminster upgrading and asphalt refining complex, which converts heavy oil and bitumen into synthetic crude oil, diesel, asphalt and other ancillary products. Cenovus also owns and operates the Bruderheim crude-by-rail terminal and two ethanol plants. The Company’s commercial fuels business across Canada is included in this segment. Cenovus markets its production and third-party commodity trading volumes in an effort to use its integrated network of assets to maximize value.
•U.S. Manufacturing, includes the refining of crude oil to produce gasoline, diesel, jet fuel, asphalt and other products at the wholly-owned Lima, Superior and Toledo refineries, and the jointly-owned Wood River and Borger refineries (jointly owned with operator Phillips 66). Cenovus also markets some of its own and third-party volumes of refined petroleum products including gasoline, diesel, jet fuel and asphalt.
Corporate and Eliminations
Corporate and Eliminations, primarily includes Cenovus-wide costs for general and administrative, financing activities, gains and losses on risk management for corporate related derivative instruments and foreign exchange. Eliminations include adjustments for internal usage of natural gas production between segments, transloading services provided to the Oil Sands segment by the Company’s crude-by-rail terminal, crude oil production used as feedstock by the Canadian Manufacturing and U.S. Manufacturing segments, the sale of condensate extracted from blended crude oil production in the Canadian Manufacturing segment and sold to the Oil Sands segment, and unrealized profits in inventory. Eliminations are recorded based on current market prices.
| | |
|
| QUARTERLY RESULTS OVERVIEW |
The second quarter was highlighted by significant milestones as well as challenges across our business. In our upstream business, we quickly responded to wildfires impacting the Conventional segment in early May. We temporarily shut-in approximately 85 thousand BOE per day of production to ensure the safety of our staff, local communities and assets. By the end of May, we were able to restart the majority of our wells and facilities impacted by the fire. Approximately 5 to 7 thousand BOE per day of production remained offline near the end of July due to the lack of third-party power infrastructure. In the Oil Sands segment, we began ramping up production on a total of three new wells pads at Foster Creek and Christina Lake in the second quarter, and completed a planned turnaround at Foster Creek. Offshore production was impacted by a planned turnaround in the Atlantic and a temporary unplanned outage in China related to the disconnection of the umbilical by a third-party vessel in early April, reconnected in May. In our Atlantic operations, we achieved another milestone on the West White Rose project, with the completion of the conical slip form operation for the concrete gravity structure in June.
In our downstream business, we achieved the safe restart of the Toledo Refinery, continued safely ramping up operations at the Superior Refinery, and completed planned turnarounds at the Wood River and Borger refineries. The Toledo Refinery was fully operational in June. Ramp-up of the Superior Refinery continued through the second quarter and start-up of the fluid catalytic cracking unit (“FCCU”) is underway. The Borger Refinery ran at reduced rates due to unplanned outages, and our Lima and Lloydminster refineries ran at or near full rates through the quarter.
| | | | | |
| Cenovus Energy Inc. – Q2 2023 Management's Discussion and Analysis | 4 |
Our financial results improved from the first quarter, primarily reflecting higher realized prices from the Oil Sands segment. WCS at Hardisty averaged $58.74 per barrel, an increase from $51.36 per barrel in the first quarter mainly due to the narrowing of the WTI-WCS differential by 39 percent to $15.04 per barrel. In the second quarter, crude oil prices were significantly lower compared with 2022 with WTI decreasing 32 percent to $73.78 per barrel, and the WTI-WCS differential at Hardisty widening $2.24 per barrel from $12.80 per barrel. Average refined product prices declined and average market crack spreads remained relatively consistent with the first quarter of 2023. Refined product prices and average market crack spreads declined compared with historic highs in the second quarter of 2022.
We returned $575 million to shareholders, including $265 million through common share base dividends of $0.140 per common share and the purchase of 14.0 million common shares for $310 million through our NCIB. Net Debt decreased $265 million during the quarter to $6.4 billion at June 30, 2023.
Summary of Quarterly Results
| | | | | | | | | | | | | | | | | | | | | | | | | | | | | | | | | | | | | | | | | | | | | | | | | | | | | | | | | | | | | | | | | |
| Six Months Ended June 30, | | 2023 | | 2022 | | 2021 |
| ($ millions, except where indicated) | 2023 | | 2022 | | Q2 | | Q1 | | Q4 | | Q3 | | Q2 | | Q1 | | Q4 | | Q3 | | Q2 |
| | | | | | | | | | | | | | | | | | | | | |
Upstream Production Volumes (1) (MBOE/d) | 754.4 | | | 779.9 | | | 729.9 | | | 779.0 | | | 806.9 | | | 777.9 | | | 761.5 | | | 798.6 | | | 825.3 | | | 804.8 | | | 765.9 | |
| | | | | | | | | | | | | | | | | | | | | |
Downstream Crude Oil Unit Throughput (2) (Mbbls/d) | 498.1 | | | 479.4 | | | 537.8 | | | 457.9 | | | 473.3 | | | 533.5 | | | 457.3 | | | 501.8 | | | 469.9 | | | 554.1 | | | 539.0 | |
| | | | | | | | | | | | | | | | | | | | | |
Downstream Production Volumes (Mbbls/d) | 530.0 | | | 509.6 | | | 571.9 | | | 487.7 | | | 506.3 | | | 572.6 | | | 482.1 | | | 538.0 | | | 503.4 | | | 590.9 | | | 564.8 | |
| | | | | | | | | | | | | | | | | | | | | |
Revenues | 24,493 | | | 35,363 | | | 12,231 | | | 12,262 | | | 14,063 | | | 17,471 | | | 19,165 | | | 16,198 | | | 13,726 | | | 12,701 | | | 10,637 | |
| | | | | | | | | | | | | | | | | | | | | |
Operating Margin (3) | 4,502 | | | 8,142 | | | 2,400 | | | 2,102 | | | 2,782 | | | 3,339 | | | 4,678 | | | 3,464 | | | 2,600 | | | 2,710 | | | 2,184 | |
| | | | | | | | | | | | | | | | | | | | | |
| Cash From (Used In) Operating Activities | 1,704 | | | 4,344 | | | 1,990 | | | (286) | | | 2,970 | | | 4,089 | | | 2,979 | | | 1,365 | | | 2,184 | | | 2,138 | | | 1,369 | |
| | | | | | | | | | | | | | | | | | | | | |
Adjusted Funds Flow (3) | 3,294 | | | 5,681 | | | 1,899 | | | 1,395 | | | 2,346 | | | 2,951 | | | 3,098 | | | 2,583 | | | 1,948 | | | 2,342 | | | 1,817 | |
Per Share - Basic (3) ($) | 1.73 | | | 2.87 | | | 1.00 | | | 0.73 | | | 1.22 | | | 1.53 | | | 1.57 | | | 1.30 | | | 0.97 | | | 1.16 | | | 0.90 | |
Per Share - Diluted (3) ($) | 1.69 | | | 2.79 | | | 0.98 | | | 0.71 | | | 1.19 | | | 1.49 | | | 1.53 | | | 1.27 | | | 0.97 | | | 1.15 | | | 0.89 | |
| | | | | | | | | | | | | | | | | | | | | |
| Capital Investment | 2,103 | | | 1,568 | | | 1,002 | | | 1,101 | | | 1,274 | | | 866 | | | 822 | | | 746 | | | 835 | | | 647 | | | 534 | |
| | | | | | | | | | | | | | | | | | | | | |
Free Funds Flow (3) | 1,191 | | | 4,113 | | | 897 | | | 294 | | | 1,072 | | | 2,085 | | | 2,276 | | | 1,837 | | | 1,113 | | | 1,695 | | | 1,283 | |
| | | | | | | | | | | | | | | | | | | | | |
Excess Free Funds Flow (3) | n/a | | n/a | | 505 | | | (499) | | | 786 | | | 1,756 | | | 2,020 | | | 2,615 | | | 1,169 | | | 1,626 | | | 1,244 | |
| | | | | | | | | | | | | | | | | | | | | |
Net Earnings (Loss) (4) | 1,502 | | | 4,057 | | | 866 | | | 636 | | | 784 | | | 1,609 | | | 2,432 | | | 1,625 | | | (408) | | | 551 | | | 224 | |
Per Share - Basic ($) | 0.78 | | | 2.04 | | | 0.45 | | | 0.33 | | | 0.40 | | | 0.83 | | | 1.23 | | | 0.81 | | | (0.21) | | | 0.27 | | | 0.11 | |
Per Share - Diluted ($) | 0.76 | | | 1.98 | | | 0.44 | | | 0.32 | | | 0.39 | | | 0.81 | | | 1.19 | | | 0.79 | | | (0.21) | | | 0.27 | | | 0.11 | |
| | | | | | | | | | | | | | | | | | | | | |
| Total Assets | 53,747 | | | 55,894 | | | 53,747 | | | 54,000 | | | 55,869 | | | 55,086 | | | 55,894 | | | 55,655 | | | 54,104 | | | 54,594 | | | 53,384 | |
| | | | | | | | | | | | | | | | | | | | | |
Total Long-Term Liabilities | 19,831 | | | 20,742 | | | 19,831 | | | 19,917 | | | 20,259 | | | 19,378 | | | 20,742 | | | 21,889 | | | 23,191 | | | 22,929 | | | 22,972 | |
| | | | | | | | | | | | | | | | | | | | | |
Long-Term Debt, Including Current Portion | 8,534 | | | 11,228 | | | 8,534 | | | 8,681 | | | 8,691 | | | 8,774 | | | 11,228 | | | 11,744 | | | 12,385 | | | 12,986 | | | 13,380 | |
| | | | | | | | | | | | | | | | | | | | | |
Net Debt | 6,367 | | | 7,535 | | | 6,367 | | | 6,632 | | | 4,282 | | | 5,280 | | | 7,535 | | | 8,407 | | | 9,591 | | | 11,024 | | | 12,390 | |
| | | | | | | | | | | | | | | | | | | | | |
| Cash Returns to Shareholders | | | | | | | | | | | | | | | | | | | | | |
| Common Shares – Base Dividends | 465 | | | 276 | | | 265 | | | 200 | | | 201 | | | 205 | | | 207 | | | 69 | | | 70 | | | 35 | | | 36 | |
Base Dividends Per Common Share ($) | 0.245 | | | 0.140 | | | 0.140 | | | 0.105 | | | 0.105 | | | 0.105 | | | 0.105 | | | 0.035 | | | 0.035 | | | 0.018 | | | 0.018 | |
| Common Shares – Variable Dividends | — | | | — | | | — | | | — | | | 219 | | | — | | | — | | | — | | | — | | | — | | | — | |
Variable Dividends Per Common Share ($) | — | | | — | | | — | | | — | | | 0.114 | | | — | | | — | | | — | | | — | | | — | | | — | |
| Purchase of Common Shares Under NCIB | 350 | | | 1,484 | | | 310 | | | 40 | | | 387 | | | 659 | | | 1,018 | | | 466 | | | 265 | | | — | | | — | |
| Preferred Share Dividends | 27 | | | 17 | | | 9 | | | 18 | | | — | | | 9 | | | 8 | | | 9 | | | 8 | | | 9 | | | 8 | |
(1)Refer to the Operating and Financial Results section of this MD&A for a summary of total upstream production by product type.
(2)Represents Cenovus’s net interest in refining operations.
(3)Non-GAAP financial measure or contains a non-GAAP financial measure. See the Specified Financial Measures Advisory of this MD&A.
(4)Net earnings (loss) for all periods in the table above is the same as net earnings (loss) from continuing operations.
| | | | | |
| Cenovus Energy Inc. – Q2 2023 Management's Discussion and Analysis | 5 |
Upstream production averaged 729.9 thousand BOE per day in the second quarter, a decrease of 49.1 thousand BOE per day and 31.6 thousand BOE per day, respectively, from the first quarter of 2023 and second quarter of 2022. The decreases were primarily due to a planned turnaround at Foster Creek, our response to the wildfires in the Conventional segment and an unplanned outage in China, all impacting the second quarter of 2023. See the Operating and Financial Results section of this MD&A for a summary of upstream production by product type.
Downstream crude oil unit throughput (or “throughput”) averaged 537.8 thousand barrels per day in the second quarter (first quarter of 2023 – 457.9 thousand barrels per day; second quarter of 2022 – 457.3 thousand barrels per day). Consistent with increased throughput, downstream refined products production volumes averaged 571.9 thousand barrels per day in the quarter (first quarter of 2023 – 487.7 thousand barrels per day; second quarter of 2022 – 482.1 thousand barrels per day). The Toledo Refinery was fully operational in June. Ramp-up of the Superior Refinery continued through the second quarter and start-up of the FCCU is underway.
Realized crude oil and refined product prices declined significantly from the second quarter of 2022, a period of elevated benchmark prices. Revenues of $12.2 billion were relatively consistent with the first quarter of 2023, primarily due to higher realized bitumen and heavy crude oil prices, offset by lower realized conventional natural gas prices and decreased sales volumes in the Offshore and Conventional segments. Downstream revenues increased slightly from the first quarter of 2023. Revenue decreased 36 percent from the second quarter of 2022, primarily due to significantly lower commodity pricing in our upstream and downstream operations. Our realized sales price from our upstream operations was $71.15 per BOE in the second quarter of 2023, up 17 percent compared with $60.83 per BOE in the first quarter of 2023 and down 38 percent compared with $114.40 per BOE in the second quarter of 2022.
In our Canadian downstream operations, gross margin declined 33 percent from the first quarter of 2023 primarily due to changes in differentials between heavy oil feedstock and synthetic crude. Gross margin increased 6 percent from the second quarter of 2022, due to higher production volumes from the Lloydminster Refinery and the Lloydminster Upgrader (the “Upgrader”). Gross margin in our U.S. downstream operations was consistent with the first quarter of 2023, and decreased 54 percent from the second quarter of 2022 primarily due to significantly lower market crack spreads.
Operating margin was $2.4 billion, an increase of 14 percent from the first quarter of 2023, primarily due to higher realized crude oil prices. Operating margin decreased 49 percent from the second quarter 2022 primarily due to significantly lower commodity pricing and market crack spreads. Cash from operating activities was $2.0 billion, an increase of $2.3 billion from the first quarter of 2023, driven largely by the payment of a $1.2 billion income tax liability in the first quarter of 2023. Cash from operating activities decreased $989 million from the second quarter of 2022, primarily due to lower operating margin. Adjusted Funds Flow was $1.9 billion in the second quarter of 2023, an increase of 36 percent from the first quarter of 2023, and a decrease of 39 percent from the second quarter of 2022.
On June 14, 2023, we purchased and cancelled 45.5 million outstanding common share purchase warrants (“Cenovus Warrants”) for $711 million. We have the option to pay the aggregate warrant purchase price through the remainder of 2023, with full payment being made no later than January 5, 2024. Payments will be considered as part of our shareholder returns framework. No payments related to the purchased warrants were made in the second quarter.
On July 26, 2023, the Board declared a third quarter base dividend of $0.140 per common share. The dividend is payable on September 29, 2023, to common shareholders of record as at September 15, 2023. The Board also declared third quarter dividends for our preferred shares of $9 million, payable on October 3, 2023, to preferred shareholders of record as at September 15, 2023.
| | | | | |
| Cenovus Energy Inc. – Q2 2023 Management's Discussion and Analysis | 6 |
| | |
|
| OPERATING AND FINANCIAL RESULTS |
Selected Operating Results — Upstream
| | | | | | | | | | | | | | | | | | | | | | | | | | | | | | | | | | | | | | | |
| Three Months Ended June 30, | | Six Months Ended June 30, | | | | |
| | | Percent Change | | | | | | Percent Change | | | | | | |
| 2023 | | | 2022 | | 2023 | | | 2022 | | | |
Upstream Production Volumes by Segment (1) (MBOE/d) | | | | | | | | | | | | | | | |
Oil Sands | 573.8 | | 3 | | | 558.8 | | 581.6 | | 1 | | | 577.9 | | | | |
Conventional | 104.6 | | (21) | | | 132.6 | | 114.2 | | (11) | | | 128.8 | | | | |
Offshore | 51.5 | | (27) | | | 70.1 | | 58.6 | | (20) | | | 73.2 | | | | |
Total Production Volumes | 729.9 | | (4) | | | 761.5 | | 754.4 | | (3) | | | 779.9 | | | | |
| | | | | | | | | | | | | | | |
| Upstream Production Volumes by Product | | | | | | | | | | | | | | | |
Bitumen (Mbbls/d) | 554.6 | | 3 | | | 540.3 | | 562.5 | | 1 | | | 559.5 | | | | |
Heavy Crude Oil (Mbbls/d) | 17.0 | | 4 | | | 16.4 | | 16.9 | | 4 | | | 16.3 | | | | |
Light Crude Oil (Mbbls/d) | 10.1 | | (51) | | | 20.8 | | 12.7 | | (41) | | | 21.4 | | | | |
NGLs (Mbbls/d) | 26.7 | | (27) | | | 36.7 | | 30.0 | | (19) | | | 37.2 | | | | |
Conventional Natural Gas (MMcf/d) | 729.4 | | (17) | | | 882.2 | | 793.1 | | (9) | | | 873.9 | | | | |
Total Production Volumes (MBOE/d) | 729.9 | | (4) | | | 761.5 | | 754.4 | | (3) | | | 779.9 | | | | |
| | | | | | | | | | | | | | | |
Total Upstream Sales Volumes (2) (MBOE/d) | 642.1 | | (6) | | | 684.5 | | 662.0 | | (6) | | | 704.2 | | | | |
| | | | | | | | | | | | | | | |
Netback (3) (4) ($/BOE) | 38.87 | | (45) | | | 71.09 | | 33.89 | | (48) | | | 64.78 | | | | |
| | | | | | | | | | | | | | | |
| | | | | | | | | | | | | | | |
| | | | | | | | | | | | | | | |
| | | | | | | | | | | | | | | |
| | | | | | | | | | | | | | | |
(1)Refer to the Oil Sands, Conventional or Offshore Reportable Segments section of this MD&A for a summary of production by product type.
(2)Total upstream sales volumes exclude natural gas volumes used for internal consumption by the Oil Sands segment of 521 MMcf per day and 534 MMcf per day for the three and six months ended June 30, 2023, respectively (506 MMcf per day and 516 MMcf per day for the three and six months ended June 30, 2022, respectively).
(3)Upstream revenue as found in Note 1 of the interim Consolidated Financial Statements was $6.8 billion and $13.6 billion for the three and six months ended June 30, 2023, respectively ($10.1 billion and $19.8 billion for the three and six months ended June 30, 2022, respectively).
(4)Contains a non-GAAP financial measure. See the Specified Financial Measures Advisory of this MD&A.
In the three and six months ended June 30, 2023, total crude oil, NGLs and natural gas production decreased compared with the same periods in 2022 due to:
•The temporary shut-in of a significant portion of production in our Conventional operations in response to wildfire activity in May and into June.
•A planned turnaround completed at Foster Creek in the second quarter of 2023.
•Changes to the Liwan 3-1 gas sales agreement in China in the second quarter of 2022, concluding the amendment that temporarily increased sales volumes.
•A temporary unplanned outage in China in the second quarter of 2023, related to the disconnection of the umbilical by a third-party vessel in early April, reconnected in May.
•A planned turnaround completed in our Atlantic operations in the second quarter of 2023.
The decrease was partially offset by:
•The acquisition of the remaining 50 percent interest in Sunrise (the “Sunrise Acquisition”) from BP Canada Energy Group ULC (“bp Canada”) on August 31, 2022.
•First oil at the Spruce Lake North thermal plant in the third quarter of 2022.
•First gas production at the MBH and MDA fields in Indonesia in the fourth quarter of 2022.
| | | | | |
| Cenovus Energy Inc. – Q2 2023 Management's Discussion and Analysis | 7 |
Selected Operating Results — Downstream
| | | | | | | | | | | | | | | | | | | | | | | | | | | | | | | | | | | | | | | |
| Three Months Ended June 30, | | Six Months Ended June 30, | | | | |
| | | | | | | | | |
| | | Percent Change | | | | | | Percent Change | | | | | | |
| 2023 | | | 2022 | | 2023 | | | 2022 | | | |
Downstream Crude Oil Unit Throughput (Mbbls/d) | | | | | | | | | | | | | | | |
Canadian Manufacturing | 95.3 | | 18 | | | 80.9 | | 97.0 | | 9 | | | 89.4 | | | | |
U.S. Manufacturing | 442.5 | | 18 | | | 376.4 | | 401.1 | | 3 | | | 390.0 | | | | |
Total Crude Oil Unit Throughput | 537.8 | | 18 | | | 457.3 | | 498.1 | | 4 | | | 479.4 | | | | | |
| | | | | | | | | | | | | | | |
Downstream Production Volumes (Mbbls/d) | | | | | | | | | | | | | | | |
Canadian Manufacturing | 108.3 | | 19 | | | 90.9 | | 110.6 | | 10 | | | 100.7 | | | | |
U.S. Manufacturing | 463.6 | | 19 | | | 391.2 | | 419.4 | | 3 | | | 408.9 | | | | |
Total Downstream Production | 571.9 | | 19 | | | 482.1 | | 530.0 | | 4 | | | 509.6 | | | | |
| | | | | | | | | | | | | | | |
| | | | | | | | | | | | | | | |
| | | | | | | | | | | | | | | |
| | | | | | | | | | | | | | | |
| | | | | | | | | | | | | | | |
In the Canadian Manufacturing segment, throughput increased in the second quarter of 2023 compared with 2022, primarily due to the Lloydminster Refinery operating at or near capacity in 2023 and the completion of planned turnarounds at the Upgrader and the Lloydminster Refinery in 2022. The increase was partially offset by an unplanned outage at the Upgrader in April that was resolved in May.
Year-to-date, throughput in the Canadian Manufacturing segment increased due to the 2022 planned turnarounds, partially offset by cold weather impacts and operational outages experienced in late 2022 at the Upgrader which returned to full rates by the middle of January. In addition, throughput at the Upgrader was impacted by maintenance activities in the first quarter of 2023.
In the U.S. Manufacturing segment, total crude oil unit throughput and refined products production increased in the three and six months ended June 30, 2023, compared with the same periods in 2022 due to:
•Strong performance at the Lima Refinery with an increase in throughput quarter-over-quarter and on a year-to-date basis.
•The purchase of the remaining 50 percent interest in the Toledo Refinery from BP Products North America Inc. (“bp”) on February 28, 2023 (the “Toledo Acquisition”). The refinery partially restarted in April and commenced full operations in June. In the second quarter of 2022, we commenced a significant planned turnaround at the Toledo Refinery that was completed in the third quarter of 2022.
•The introduction of crude oil at the Superior Refinery in mid-March 2023, with throughput ramping up through the second quarter. Work is underway to start up the FCCU.
•An increase in throughput at the Wood River Refinery. The planned turnaround completed in the second quarter had less of an impact than the turnaround in 2022. On a year-to-date basis, the increase in throughput was also due to the decision to operate at reduced rates early in 2022 to optimize margins as market conditions dictated.
Increased throughput and refined products output in the three and six months ended June 30, 2023, was partially offset by:
•A planned turnaround at the Borger Refinery at the end of March and completed by late April. There were temporary unplanned outages at the refinery in the second quarter.
•Unplanned outages at the Wood River and Borger refineries stemming from the fourth quarter of 2022 that were resolved in the first quarter of 2023.
| | | | | |
| Cenovus Energy Inc. – Q2 2023 Management's Discussion and Analysis | 8 |
Selected Consolidated Financial Results
Operating Margin
Operating Margin is a specified financial measure and is used to provide a consistent measure of the cash generating performance of our assets for comparability of our underlying financial performance between periods.
| | | | | | | | | | | | | | | | | | | | | | | | | |
| Three Months Ended June 30, | | Six Months Ended June 30, | | |
| ($ millions) | 2023 | | 2022 | | 2023 | | 2022 | | |
| Gross Sales | 14,960 | | | 22,404 | | | 29,743 | | | 41,417 | | | |
| Less: Royalties | 637 | | | 1,582 | | | 1,233 | | | 2,767 | | | |
| Revenues | 14,323 | | | 20,822 | | | 28,510 | | | 38,650 | | | |
| Expenses | | | | | | | | | |
| Purchased Product | 7,466 | | | 10,380 | | | 14,757 | | | 19,015 | | | |
| Transportation and Blending | 2,750 | | | 3,238 | | | 5,744 | | | 6,432 | | | |
Operating Expenses | 1,726 | | | 1,876 | | | 3,509 | | | 3,430 | | | |
| Realized (Gain) Loss on Risk Management Activities | (19) | | | 650 | | | (2) | | | 1,631 | | | |
Operating Margin | 2,400 | | | 4,678 | | | 4,502 | | | 8,142 | | | |
Operating Margin by Segment
Three Months Ended June 30, 2023
Operating Margin decreased in the three months ended June 30, 2023, compared with the same period in 2022, primarily due to:
•Lower realized crude oil, NGLs and natural gas sales prices resulting from significantly lower benchmark pricing.
•Decreased gross margins in the U.S. Manufacturing segment resulting from lower market crack spreads and inventory build-up.
•Lower sales volumes from our Offshore and Conventional segments.
These decreases in Operating Margin were partially offset by:
•Decreased royalties in the Oil Sands and Conventional segments, resulting from lower crude oil and natural gas benchmark pricing.
•Realized risk management gains in 2023 compared with significant realized risk management losses in 2022.
•Lower blending costs due to decreased condensate prices.
•Decreased operating expenses in our upstream and downstream operations mainly due to lower natural gas prices.
| | | | | |
| Cenovus Energy Inc. – Q2 2023 Management's Discussion and Analysis | 9 |
Six Months Ended June 30, 2023
Operating Margin decreased in the six months ended June 30, 2023, compared with 2022, primarily due to the same reasons as discussed above.
Cash From (Used in) Operating Activities and Adjusted Funds Flow
Adjusted Funds Flow is a non-GAAP financial measure commonly used in the oil and gas industry to assist in measuring a company’s ability to finance its capital programs and meet its financial obligations.
| | | | | | | | | | | | | | | | | | | | | | | | | |
| Three Months Ended June 30, | | Six Months Ended June 30, | |
| ($ millions) | 2023 | | 2022 | | 2023 | | 2022 | | |
| Cash From (Used in) Operating Activities | 1,990 | | | 2,979 | | | 1,704 | | | 4,344 | | | |
| (Add) Deduct: | | | | | | | | | |
Settlement of Decommissioning Liabilities | (41) | | | (27) | | | (89) | | | (46) | | | |
| Net Change in Non-Cash Working Capital | 132 | | | (92) | | | (1,501) | | | (1,291) | | | |
Adjusted Funds Flow | 1,899 | | | 3,098 | | | 3,294 | | | 5,681 | | | |
Cash from operating activities was $2.0 billion in the second quarter of 2023, compared with $3.0 billion in 2022. The decrease was primarily due to lower Operating Margin, partially offset by lower cash taxes, changes in non-cash working capital and the 2022 contingent payment associated with the 2017 acquisition of a 50 percent interest in the FCCL Partnership.
Cash from operating activities was $1.7 billion in the first six months of 2023, compared with $4.3 billion in 2022. The change was primarily due to lower Operating Margin and changes in non-cash working capital, partially offset by lower cash taxes and the 2022 contingent payment as discussed above. The net change in non-cash working capital in the first half of 2023 was $1.5 billion (2022 – $1.3 billion) mainly due to paying a $1.2 billion income tax liability.
Adjusted Funds Flow was lower in the three and six months ended June 30, 2023, compared with the same periods in 2022, primarily due to decreased Operating Margin, as discussed above.
| | | | | |
| Cenovus Energy Inc. – Q2 2023 Management's Discussion and Analysis | 10 |
Net Earnings (Loss)
| | | | | | | | | | | | | | | |
| ($ millions) | Three Months Ended | | Six Months Ended | | | | |
| Net Earnings (Loss), for the Periods Ended June 30, 2022 | 2,432 | | | 4,057 | | | | | |
| Increase (Decrease) due to: | | | | | | | |
| Operating Margin | (2,278) | | | (3,640) | | | | | |
| Corporate and Eliminations: | | | | | | | |
| General and Administrative | 51 | | | 92 | | | | | |
| Finance Costs | 2 | | | 37 | | | | | |
| Integration and Transaction Costs | 11 | | | 15 | | | | | |
| Unrealized Foreign Exchange Gain (Loss) | 432 | | | 279 | | | | | |
| Revaluation Gain (Loss) | — | | | (33) | | | | | |
| Re-measurement of Contingent Payments | 16 | | | 235 | | | | | |
| Gain (Loss) on Divestiture of Assets | (52) | | | (293) | | | | | |
| Other Income (Loss), net | (24) | | | (388) | | | | | |
Other (1) | (59) | | | (70) | | | | | |
Unrealized Risk Management Gain (Loss) | (390) | | | (37) | | | | | |
| Depreciation, Depletion and Amortization | 60 | | | (15) | | | | | |
| Exploration Expense | 6 | | | 18 | | | | | |
| Income Tax (Expense) Recovery | 659 | | | 1,245 | | | | | |
| Net Earnings (Loss), for the Periods Ended June 30, 2023 | 866 | | | 1,502 | | | | | |
(1)Includes Corporate and Eliminations revenues, purchased product, transportation and blending expenses, operating expenses and (gain) loss on risk management; share of income (loss) from equity-accounted affiliates; interest income and realized foreign exchange (gains) losses.
Net earnings in the second quarter of 2023 decreased compared with the same period in 2022 due to declines in Operating Margin and unrealized risk management losses in 2023 compared with gains in 2022. The decrease in net earnings was partially offset by a lower income tax expense and unrealized foreign exchange gains in 2023 compared with losses in 2022.
Net earnings in the first six months of 2023 decreased compared with the same period in 2022 due to declines in Operating Margin, lower other income due to the 2022 insurance proceeds related to the Superior Refinery and Atlantic region incidents, gains on the divestiture of the Tucker and Wembley assets and the divestiture of 12.5 percent of our interest in the White Rose field in 2022, compared with minor divestitures in 2023. The decrease in net earnings was partially offset by a lower income tax expense, unrealized foreign exchange gains in 2023 compared with losses in 2022 and the re-measurement of our contingent payments.
Net Debt
| | | | | | | | | | | | | | | |
As at ($ millions) | June 30, 2023 | | December 31, 2022 | | | | |
| Short-Term Borrowings | — | | | 115 | | | | | |
| Current Portion of Long-Term Debt | — | | | — | | | | | |
| Long-Term Portion of Long-Term Debt | 8,534 | | | 8,691 | | | | | |
| Total Debt | 8,534 | | | 8,806 | | | | | |
| Less: Cash and Cash Equivalents | (2,167) | | | (4,524) | | | | | |
Net Debt | 6,367 | | | 4,282 | | | | | |
For further details see the Liquidity and Capital Resources section of this MD&A.
| | | | | |
| Cenovus Energy Inc. – Q2 2023 Management's Discussion and Analysis | 11 |
Capital Investment (1)
| | | | | | | | | | | | | | | | | | | | | | | | | |
| Three Months Ended June 30, | | Six Months Ended June 30, | | |
| ($ millions) | 2023 | 2022 | | 2023 | | 2022 | | |
| Upstream | | | | | | | | | |
| Oil Sands | 539 | | | 376 | | | 1,174 | | | 751 | | | |
| Conventional | 82 | | | 33 | | | 223 | | | 121 | | | |
| Offshore | 184 | | | 91 | | | 284 | | | 144 | | | |
| Total Upstream | 805 | | | 500 | | | 1,681 | | | 1,016 | | | |
| Downstream | | | | | | | | | |
| Canadian Manufacturing | 34 | | | 38 | | | 61 | | | 53 | | | |
| U.S. Manufacturing | 153 | | | 267 | | | 347 | | | 474 | | | |
| Total Downstream | 187 | | | 305 | | | 408 | | | 527 | | | |
| Corporate and Eliminations | 10 | | | 17 | | | 14 | | | 25 | | | |
| Total Capital Investment | 1,002 | | | 822 | | | 2,103 | | | 1,568 | | | |
(1)Includes expenditures on property, plant and equipment (“PP&E”), exploration and evaluation (“E&E”) assets, and capitalized interest. Excludes cost incurred in our equity-accounted investment in Indonesia.
Oil Sands capital investment in the first six months of 2023 was mainly for sustaining activities at Christina Lake, Foster Creek, the Lloydminster thermal assets and Sunrise, and the drilling of stratigraphic test wells as part of our integrated winter program in the first quarter.
Conventional capital investment in the first half of 2023 continued to focus on drilling, completion and tie-in activities, and infrastructure projects to support multi-year development.
Offshore capital investment in the first six months of 2023 was primarily for the West White Rose project and Terra Nova asset life extension (“ALE”) project in the Atlantic region.
U.S. Manufacturing capital investment in the first half of 2023 focused primarily on the Superior Refinery rebuild, and refining and reliability initiatives at the Wood River, Borger, Lima and Toledo refineries.
Drilling Activity
| | | | | | | | | | | | | | | | | | | | | | | | | | | |
| Net Stratigraphic Test Wells and Observation Wells | | Net Production Wells (1) |
| Six Months Ended June 30, | 2023 | | 2022 | | | | 2023 | | 2022 | | |
Foster Creek | 87 | | | 68 | | | | | 10 | | | 11 | | | |
| Christina Lake | 53 | | | — | | | | | 11 | | | 20 | | | |
| Sunrise | 38 | | | 15 | | | | | 7 | | | 2 | | | |
| Lloydminster Thermal | 1 | | | 1 | | | | | — | | | 22 | | | |
| Lloydminster Conventional Heavy Oil | 1 | | | — | | | | | 5 | | | — | | | |
Other (2) | 3 | | | 6 | | | | | — | | | — | | | |
| 183 | | | 90 | | | | | 33 | | | 55 | | | |
(1)SAGD well pairs in the Oil Sands segment are counted as a single producing well.
(2)Includes new resource plays and the Tucker asset sold on January 31, 2022.
Stratigraphic test wells were drilled to help identify well pad locations for sustaining wells and to further progress the evaluation of other assets. Observation wells were drilled to gather information and monitor reservoir conditions.
| | | | | | | | | | | | | | | | | | | | | | | | | | | | | | | | | | | | | | | | | |
| Six Months Ended | | Six Months Ended | | | | | | |
| June 30, 2023 | | June 30, 2022 | | |
| (net wells) | Drilled | | Completed | | Tied-in | | Drilled | | Completed | | Tied-in | | | | | | |
| Conventional | 17 | | | 21 | | | 22 | | | 13 | | | 28 | | | 22 | | | | | | | |
In the Offshore segment, we drilled and completed one (0.4 net) planned development well at the MAC field in Indonesia in the first six months of 2023 (first six months of 2022 — drilled and completed four (1.6 net) planned development wells at the MBH and MDA fields in Indonesia).
| | | | | |
| Cenovus Energy Inc. – Q2 2023 Management's Discussion and Analysis | 12 |
Future Capital Investment
Future Capital Investment is a specified financial measure. See the Specified Financial Measures Advisory of this MD&A. Our 2023 guidance, as updated on July 26, 2023, is available on our website at cenovus.com.
Our updated guidance reflects lower production mainly due to the impact of wildfires on the Conventional segment in the second quarter of 2023 and year-to-date operating performance in our Oil Sands segment. Crude oil unit throughput guidance did not change as part of the update. Terra Nova production was removed from guidance as part of the April 25, 2023, update.
The following table shows guidance for 2023:
| | | | | | | | | | | | | | | | | | | | | | | | | | | | | |
| | | |
| Capital Investment ($ millions) | | Production (MBOE/d) | | Crude Oil Unit Throughput (Mbbls/d) | | | | | | | | | | | |
| Upstream | | | | | | | | | | | | | | | | | |
| Oil Sands | 2,200 - 2,400 | | 577 - 637 | | | | | | | | | | | | | | |
| Conventional | 350 - 450 | | 115 - 130 | | | | | | | | | | | | | | |
| Offshore | 600 - 700 | | 55 - 68 | | | | | | | | | | | | | | |
| | | | | | | | | | | | | | | | | |
| Downstream | 800 - 900 | | | | 580 - 610 | | | | | | | | | | | | |
| | | | | | | | | | | | | | | | | |
| Corporate and Eliminations | 40 - 50 | | | | | | | | | | | | | | | | |
2023 guidance for total capital investment is between $4.0 billion and $4.5 billion. This includes sustaining capital of approximately $2.8 billion, and between $1.2 billion and $1.7 billion in optimization and growth capital. Capital investment guidance did not change as part of the July 26, 2023, update.
Further information on the changes in our financial and operating results can be found in the Reportable Segments section of this MD&A. Information on our risk management activities can be found in the Risk Management and Risk Factors section of this MD&A and in the notes to the interim Consolidated Financial Statements.
| | | | | |
| Cenovus Energy Inc. – Q2 2023 Management's Discussion and Analysis | 13 |
| | |
|
| COMMODITY PRICES UNDERLYING OUR FINANCIAL RESULTS |
Key performance drivers for our financial results include commodity prices, quality and location price differentials, refining crack spreads as well as the U.S./Canadian dollar and Chinese Yuan (“RMB”)/Canadian dollar exchange rates. The following table shows selected market benchmark prices and average exchange rates to assist in understanding our financial results.
Selected Benchmark Prices and Exchange Rates (1)
| | | | | | | | | | | | | | | | | | | | | | | | | | | | | | | | | | | | | | | | | | | | |
| | | | | | | | | | |
| Six Months Ended June 30, | | | | | | | | | | | | | | | |
| (Average US$/bbl, unless otherwise indicated) | 2023 | | Percent Change | | 2022 | | | | Q2 2023 | | | | Q1 2023 | | | | | | Q2 2022 | |
Dated Brent | 79.83 | | | (26) | | | 107.59 | | | | | 78.39 | | | | | 81.27 | | | | | | | 113.78 | | |
| WTI | 74.96 | | | (26) | | | 101.35 | | | | | 73.78 | | | | | 76.13 | | | | | | | 108.41 | | |
| Differential Dated Brent-WTI | 4.87 | | | (22) | | | 6.24 | | | | | 4.61 | | | | | 5.14 | | | | | | | 5.37 | | |
| WCS at Hardisty | 55.05 | | | (37) | | | 87.68 | | | | | 58.74 | | | | | 51.36 | | | | | | | 95.61 | | |
| Differential WTI-WCS | 19.91 | | | 46 | | | 13.67 | | | | | 15.04 | | | | | 24.77 | | | | | | | 12.80 | | |
WCS (C$/bbl) | 74.17 | | | (34) | | | 111.54 | | | | | 78.90 | | | | | 69.44 | | | | | | | 122.07 | | |
| WCS at Nederland | 64.73 | | | (33) | | | 96.26 | | | | | 66.98 | | | | | 62.49 | | | | | | | 103.34 | | |
| Differential WTI-WCS at Nederland | 10.23 | | | 101 | | | 5.09 | | | | | 6.80 | | | | | 13.64 | | | | | | | 5.07 | | |
| Condensate (C5 @ Edmonton) | 76.13 | | | (26) | | | 102.21 | | | | | 72.39 | | | | | 79.87 | | | | | | | 108.34 | | |
| Differential WTI-Condensate (Premium)/Discount | (1.17) | | | (36) | | | (0.86) | | | | | 1.39 | | | | | (3.74) | | | | | | | 0.07 | | |
Differential WCS (2)-Condensate (Premium)/Discount | (21.08) | | | (45) | | | (14.53) | | | | | (13.65) | | | | | (28.51) | | | | | | | (12.73) | | |
Average (C$/bbl) | 102.61 | | | (21) | | | 129.99 | | | | | 97.25 | | | | | 107.95 | | | | | | | 138.30 | | |
| Synthetic @ Edmonton | 77.42 | | | (25) | | | 103.75 | | | | | 76.66 | | | | | 78.18 | | | | | | | 114.46 | | |
| Differential WTI-Synthetic (Premium)/Discount | (2.46) | | | (3) | | | (2.40) | | | | | (2.88) | | | | | (2.05) | | | | | | | (6.05) | | |
| Refined Product Prices | | | | | | | | | | | | | | | | | | | | |
| Chicago Regular Unleaded Gasoline (“RUL”) | 101.07 | | | (22) | | | 129.11 | | | | | 102.32 | | | | | 99.82 | | | | | | | 149.05 | | |
| Chicago Ultra-low Sulphur Diesel (“ULSD”) | 108.90 | | | (24) | | | 143.11 | | | | | 102.40 | | | | | 115.39 | | | | | | | 166.62 | | |
Refining Benchmarks | | | | | | | | | | | | | | | | | | | | |
Chicago 3-2-1 Crack Spread (3) | 28.72 | | | (11) | | | 32.43 | | | | | 28.57 | | | | | 28.88 | | | | | | | 46.50 | | |
Group 3 3-2-1 Crack Spread (3) | 31.56 | | | (2) | | | 32.15 | | | | | 31.78 | | | | | 31.35 | | | | | | | 44.35 | | |
| Renewable Identification Numbers (“RINs”) | 7.98 | | | 12 | | | 7.12 | | | | | 7.72 | | | | | 8.20 | | | | | | | 7.80 | | |
| Natural Gas Prices | | | | | | | | | | | | | | | | | | | | |
AECO (C$/Mcf) | 3.34 | | | (38) | | | 5.43 | | | | | 2.35 | | | | | 4.34 | | | | | | | 6.28 | | |
NYMEX (US$/Mcf) | 2.76 | | | (54) | | | 6.06 | | | | | 2.10 | | | | | 3.42 | | | | | | | 7.17 | | |
| Foreign Exchange Rates | | | | | | | | | | | | | | | | | | | | |
| US$ per C$1 - Average | 0.742 | | | (6) | | | 0.787 | | | | | 0.745 | | | | | 0.739 | | | | | | | 0.783 | | |
| US$ per C$1 - End of Period | 0.755 | | | (3) | | | 0.776 | | | | | 0.755 | | | | | 0.739 | | | | | | | 0.776 | | |
| RMB per C$1 - Average | 5.143 | | | 1 | | | 5.098 | | | | | 5.228 | | | | | 5.059 | | | | | | | 5.180 | | |
(1)These benchmark prices are not our realized sales prices and represent approximate values. For our average realized sales prices and realized risk management results, refer to the Netback tables in the Reportable Segments section of this MD&A.
(2)WCS at Hardisty.
(3)The average 3-2-1 crack spread is an indicator of the refining margin and is valued on a last in, first out accounting basis.
Crude Oil and Condensate Benchmarks
In the second quarter of 2023, Brent and WTI prices continued to decline compared with the first quarter of 2023 and all quarters in 2022. Prices declined due to ongoing macroeconomic concerns, crude oil supply growth outside of OPEC+ and diminished risk related to Russian export supply shortfall. Further OPEC+ production cuts and strong demand growth following the lifting of China’s COVID-19 restrictions were supportive of pricing in the second quarter of 2023.
WTI is an important benchmark for Canadian crude oil since it reflects inland North American crude oil prices and the Canadian dollar equivalent is the basis for determining royalty rates for a number of our crude oil properties.
The price received for our Atlantic crude oil and Asia Pacific NGLs is primarily driven by the price of Brent. The Brent-WTI differential narrowed in the second quarter of 2023 and on a year-to-date basis compared with 2022 as physical supply uncertainty and high marine fuel prices caused the differential to widen significantly in the months following Russia’s invasion of Ukraine in February 2022.
| | | | | |
| Cenovus Energy Inc. – Q2 2023 Management's Discussion and Analysis | 14 |
WCS is a blended heavy oil which consists of both conventional heavy oil and unconventional diluted bitumen. The WCS at Hardisty differential to WTI is a function of the quality differential of light and heavy crude and the cost of transport. The average WTI-WCS differential at Hardisty narrowed significantly compared with the first quarter of 2023 following the completion of refinery maintenance and OPEC+ cuts to medium and heavy crude production. Reduced supply in the Western Canadian Sedimentary Basin (“WCSB”) due to upstream turnarounds and forest fire activity also narrowed the differential.
During the three and six months ended June 30, 2023, the WTI-WCS differential at Hardisty widened compared with 2022 primarily due to wide light-heavy differentials at the U.S. Gulf Coast (“USGC”) as a result of high global refining utilization and volatile refined product pricing. In addition, lower heavy crude oil demand from planned and unplanned refinery maintenance in the first quarter of 2023 contributed to a wider differential.
WCS at Nederland is a heavy oil benchmark for sales of our product at the USGC. The WTI-WCS at Nederland differential is representative of the heavy oil quality discount and is influenced by global heavy oil refining capacity and global heavy oil supply. The WTI-WCS at Nederland differential narrowed significantly from the first quarter of 2023 and widened compared with 2022 due to the same factors impacting the WTI-WCS differential at Hardisty discussed above.
In Canada, we upgrade heavy crude oil and bitumen into a sweet synthetic crude oil, the Husky Synthetic Blend (“HSB”), at the Upgrader. The price realized for HSB is primarily driven by the price of WTI and by the supply and demand of sweet synthetic crude oil from Western Canada, which influences the WTI-Synthetic differential.
In the second quarter of 2023, synthetic crude at Edmonton was at a lower premium to WTI compared with the second quarter of 2022. Year-to-date, the premium was relatively consistent with 2022. Synthetic crude prices were elevated in the second quarter of 2022 as a result of upgrader maintenance in Western Canada and strong refinery demand for light crude oil.
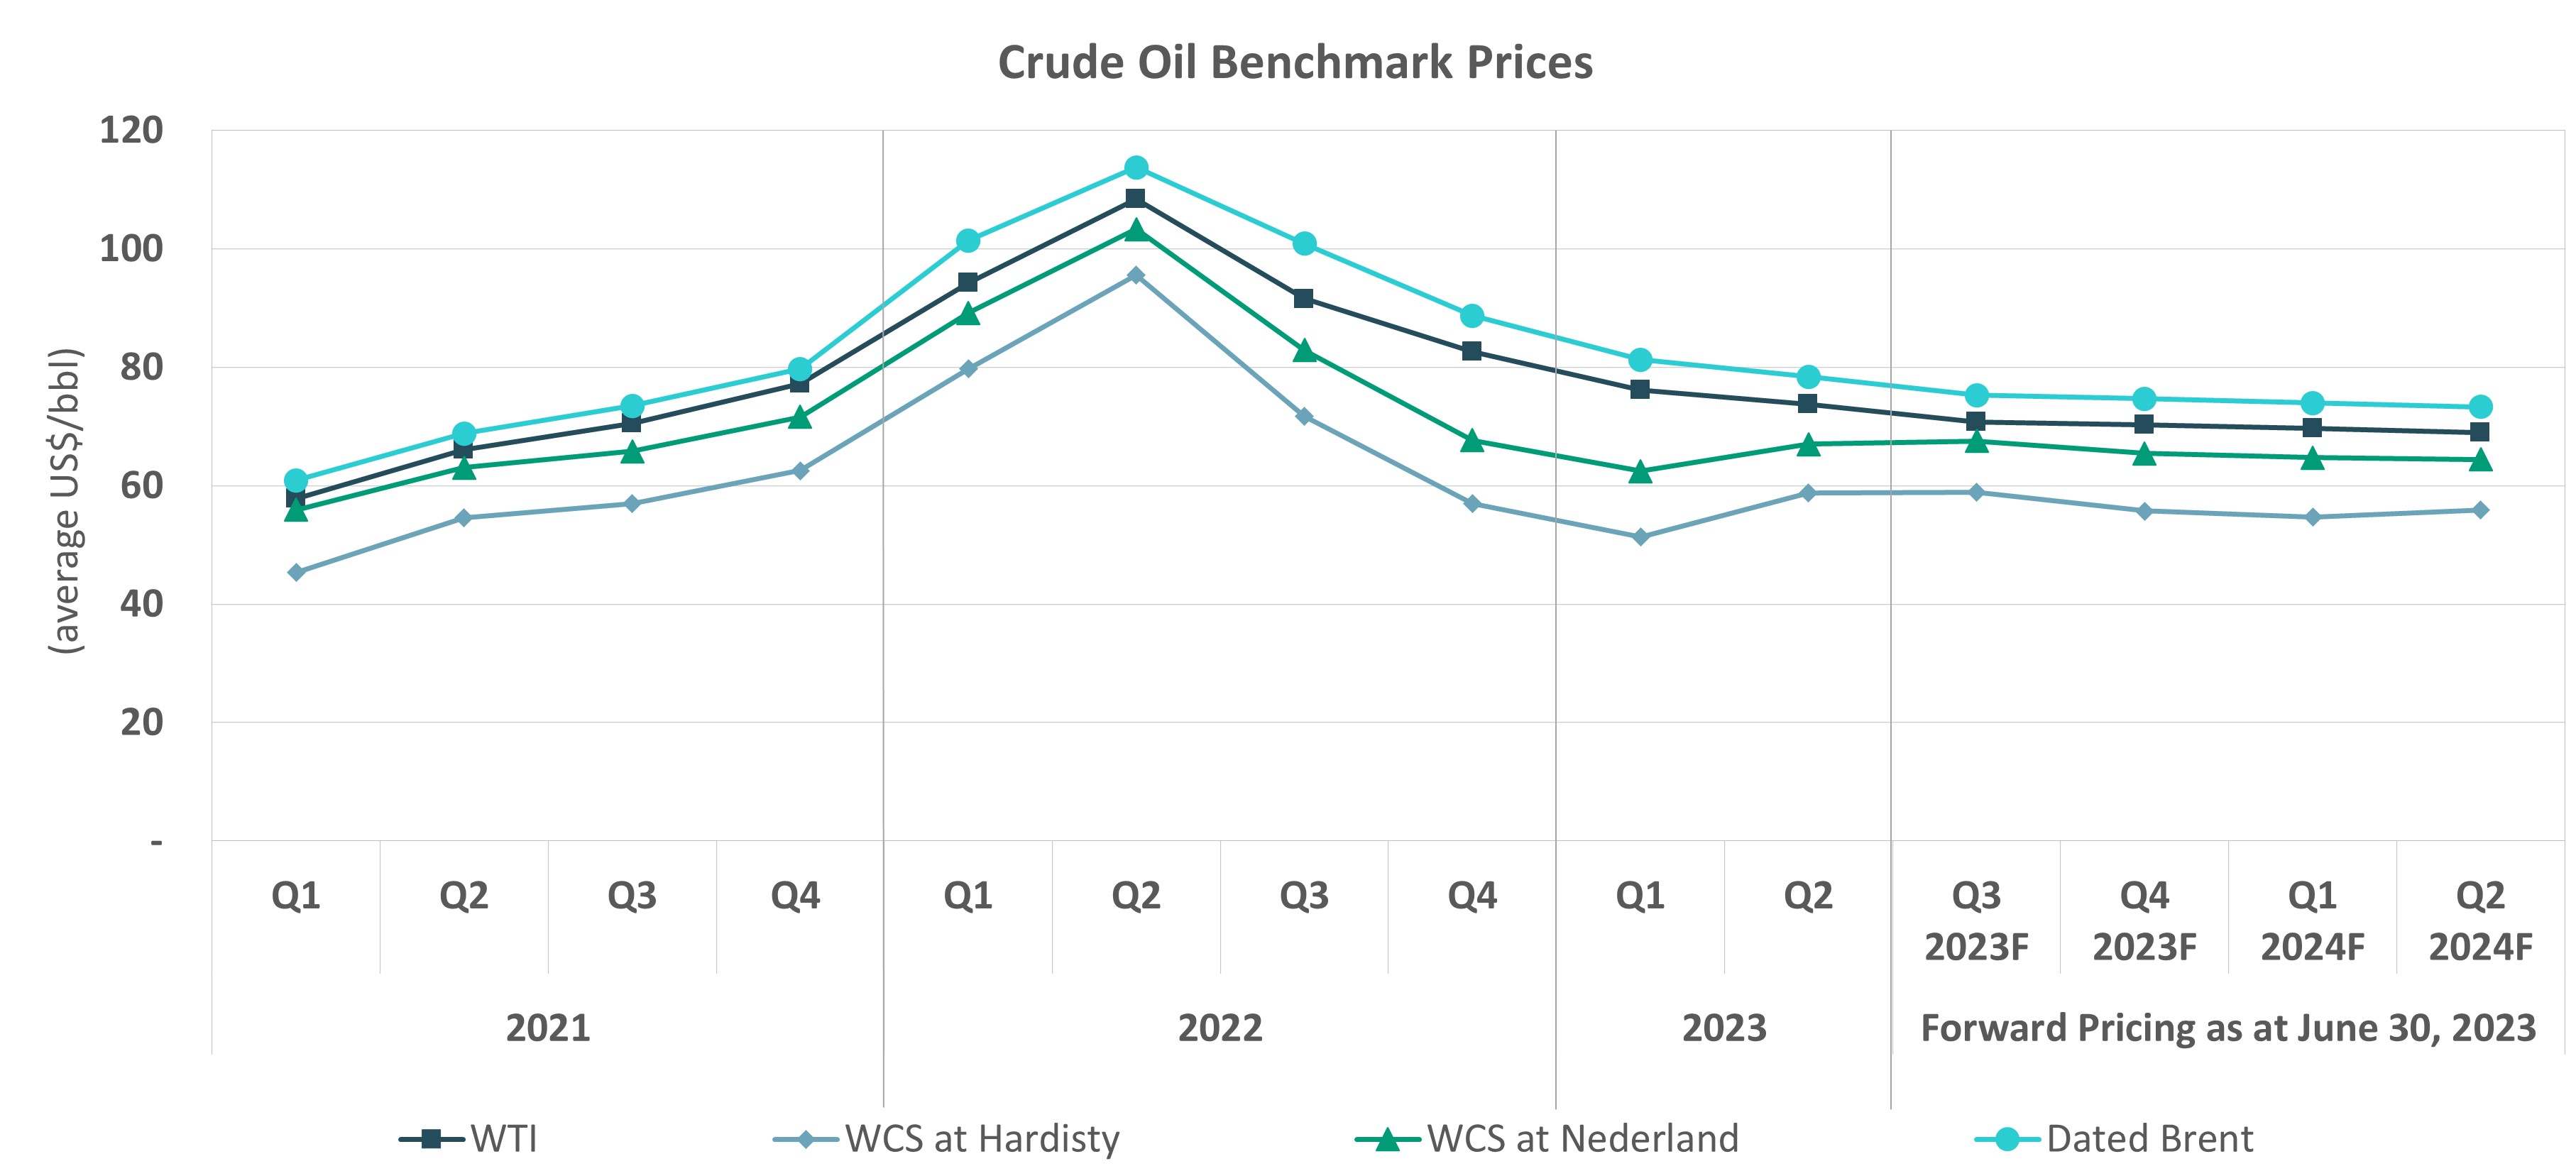
Blending condensate with bitumen enables our production to be transported through pipelines. Our blending ratios, calculated as diluent volumes as a percentage of total blended volumes, range from approximately 22 percent to 35 percent. The WCS-Condensate differential is an important benchmark as a wider differential generally results in a decrease in the recovery of condensate costs when selling a barrel of blended crude oil. When the supply of condensate in Alberta does not meet the demand, Edmonton condensate prices may be driven by USGC condensate prices plus the cost to transport the condensate to Edmonton. Our blending costs are also impacted by the timing of purchases and deliveries of condensate into inventory to be available for use in blending as well as timing of sales of blended product. The WCS-Condensate differential widened in the second quarter of 2023 and on a year-to-date basis compared with 2022.
Edmonton condensate traded at a discount to WTI in the second quarter of 2023 and 2022, and at a premium to WTI in the first quarters of 2023 and 2022, consistent with typical seasonal pricing patterns associated with increased diluent demand in winter months, which supports condensate pricing. In the first half of 2023, the average premium to WTI was consistent with the first half of 2022.
| | | | | |
| Cenovus Energy Inc. – Q2 2023 Management's Discussion and Analysis | 15 |
Refining Benchmarks
RUL and ULSD benchmark prices are representative of inland refined product prices and are used to derive the Chicago 3-2-1 market crack spread. The 3-2-1 market crack spread is an indicator of the refining margin generated by converting three barrels of crude oil into two barrels of regular unleaded gasoline and one barrel of ultra-low sulphur diesel using current-month WTI- based crude oil feedstock prices and valued on a last in, first out basis.
The Chicago 3-2-1 market crack spread reflects the market for the Toledo, Lima and Wood River refineries. The Group 3 3-2-1 market crack spread reflects the market for the Superior and Borger refineries.
Refined product prices declined in line with crude oil prices in the three and six months ended June 30, 2023, compared with the same periods in 2022. Market crack spreads also declined during this period as 2022 saw periods of historically high refined product prices and refining margins. Reduced refinery outages and incremental global capacity additions have resulted in declining refined product prices relative to WTI in 2023, particularly in diesel markets. RINs costs remain high as a result of a tight biofuel market, high feedstock prices and uncertainty around policies that drive RINs demand.
North American refining crack spreads are expressed on a WTI basis, while refined products are generally set by global prices. The strength of refining market crack spreads in the U.S. Midwest and Midcontinent generally reflects the differential between Brent and WTI benchmark prices.
Our refining margins are affected by many other factors such as the variety of crude oil feedstock, refinery configuration and product output, where feedstocks are acquired and the time lag between the purchase and delivery of crude oil feedstock, and the cost of feedstock, which is valued on a first in, first out (“FIFO”) accounting basis. The market crack spreads do not precisely mirror the configuration and product output of our refineries, however they are used as a general market indicator.
(1)There are no forward prices for RINs.
Natural Gas Benchmarks
Average NYMEX and AECO natural gas prices decreased significantly compared with the three and six months ended June 30, 2022, and the first quarter of 2023, due to mild winter conditions weighing on U.S. domestic demand coupled with record high natural gas production and inventories. The price received for our Asia Pacific natural gas production is largely based on long-term contracts.
Foreign Exchange Benchmarks
Our revenues are subject to foreign exchange exposure as the sales prices of our crude oil, NGLs, natural gas and refined products are determined by reference to U.S. benchmark prices. An increase in the value of the Canadian dollar compared with the U.S. dollar has a negative impact on our reported revenue. In addition to our revenues being denominated in U.S. dollars, a significant portion of our long-term debt is also U.S. dollar denominated. As the Canadian dollar weakens, our U.S. dollar debt gives rise to unrealized foreign exchange losses when translated to Canadian dollars. In addition, changes in foreign exchange rates impact the translation of our U.S. and Asia Pacific operations.
| | | | | |
| Cenovus Energy Inc. – Q2 2023 Management's Discussion and Analysis | 16 |
In the three and six months ended June 30, 2023, the Canadian dollar on average weakened relative to the U.S. dollar compared with the same periods in 2022, positively impacting our reported revenues. The Canadian dollar strengthened relative to the U.S. dollar as at June 30, 2023, compared with March 31, 2023 and December 31, 2022, resulting in unrealized foreign exchange gains on the translation of our U.S. dollar debt into Canadian dollars.
A portion of our long-term sales contracts in the Asia Pacific region are priced in RMB. An increase in the value of the Canadian dollar relative to the RMB will decrease the revenues received in Canadian dollars from the sale of natural gas commodities in the region. In the three and six months ended June 30, 2023, the Canadian dollar on average was relatively consistent with RMB compared with the same periods in 2022, resulting in minimal impact on our revenues.
Interest Rate Benchmarks
Our interest income, short-term borrowing costs, reported decommissioning liabilities and fair value measurements are impacted by fluctuations in interest rates. An increase in interest rates could increase our net interest expense and affect how certain liabilities are measured, and could negatively impact our cash flow and financial results.
As at June 30, 2023, the Bank of Canada’s Policy Interest Rate was 4.75 percent, an increase from 4.50 percent on March 31, 2023, and from 4.25 percent on December 31, 2022, due to concerns over inflation. On July 12, 2023, the rate increased to 5.00 percent.
COMMODITY PRICE OUTLOOK
Global crude oil prices have continued to decline since the second quarter of 2022 due to demand concerns amid a weakening macroeconomic environment and adequate supply growth outside of OPEC+. The geopolitical premium associated with Russian supply uncertainty also faded in the back half of 2022 as Russian exports of crude oil and refined products remained resilient. Crude oil price trajectory remains uncertain and volatile amid a market with unpredictable key drivers and government policy playing a large role in supply and demand dynamics. Policies regarding Russia, Iran and Venezuela are among key factors that will drive energy supply and shift global trade patterns. The OPEC+ announced production cuts will continue to be supportive of pricing with production quotas being a key driver of crude oil prices.
Overall, we expect the general outlook for crude oil and refined product prices will be volatile and impacted by OPEC+ policy, the duration and severity of the ongoing Russian invasion of Ukraine, the extent to which Russian exports are reduced by sanctions or production cuts, the timing and ability of producers and governments to replace reduced supply and the refilling or release of SPRs. In addition, weakening global economic activity, inflation and rising interest rates, and the potential for a recession remain a risk to the pace of demand growth.
In addition to the above, our commodity pricing outlook for the next 12 months is influenced by the following:
•We expect the WTI-WCS at Hardisty differential will remain largely tied to global supply factors and heavy crude oil processing capacity as long as supply stays within Canadian crude oil export capacity. We expect the anticipated start-up of the Trans Mountain pipeline expansion in 2024 to have a narrowing impact on WTI-WCS differentials.
•We expect market crack spreads will remain volatile. Economic effects of the ongoing Russian invasion of Ukraine and central bank policies could impact demand. Refining market crack spreads are likely to continue to fluctuate, adjusting for seasonal trends and refinery utilization in North America.
•NYMEX and AECO natural gas prices are expected to remain under pressure in the near-term due to strong supply and ample gas in storage. Weather will continue to be a key driver of demand and impact prices.
•We expect the Canadian dollar to continue to be impacted by crude oil prices, the pace at which the U.S. Federal Reserve Board and the Bank of Canada raise or lower benchmark lending rates relative to each other, and emerging macro-economic factors.
Most of our upstream crude oil and downstream refined products production are exposed to movements in the WTI crude oil price. Our physically integrated upstream and downstream operations help us to mitigate the impact of commodity price volatility. Natural gas and NGLs production associated with our Conventional operations provide economic integration for the fuel, solvent and blending requirements at our Oil Sands operations. Crude oil production in our upstream assets is used as feedstock by our downstream operations, and condensate extracted from our blended crude oil production is sold back to our Oil Sands operations. The restart of the Superior and Toledo refineries provide further integration.
Our refining capacity is focused in the U.S. Midwest along with smaller exposures in the USGC and Alberta, exposing Cenovus to the market crack spreads in all of these markets. We will continue to monitor market fundamentals and optimize run rates at our refineries accordingly.
| | | | | |
| Cenovus Energy Inc. – Q2 2023 Management's Discussion and Analysis | 17 |
Our exposure to crude differentials includes light-heavy and light-medium price differentials. The light-medium price differential exposure is focused on light-medium crudes in the U.S. Midwest market region where we have the majority of our refining capacity, and to a lesser degree in the USGC and Alberta. Our exposure to light-heavy crude oil price differentials is composed of a global light-heavy component, a regional component in markets we transport barrels to, as well as the Alberta differentials, which could be subject to transportation constraints. While we expect to see volatility in crude oil prices, we have the ability to partially mitigate the impact of crude oil and refined product differentials through the following:
•Transportation commitments and arrangements – using our existing firm service commitments for takeaway capacity and supporting transportation projects that move crude oil from our production areas to consuming markets, including tidewater markets.
•Integration – heavy oil refining capacity allows us to capture value from both the WTI-WCS differential for Canadian crude oil as well as from spreads on refined products.
•Dynamic storage – our ability to use the significant storage capacity in our oil sands reservoirs provides us flexibility on timing of production and sales of our inventory. We will continue to manage our production rates in response to pipeline capacity constraints, voluntary and mandated production curtailments and crude oil price differentials.
•Traditional crude oil storage tanks in various geographic locations.
UPSTREAM
Oil Sands
In the second quarter of 2023, we:
•Delivered safe and reliable operations, and completed a planned turnaround at Foster Creek.
•Produced 571.6 thousand barrels of crude oil per day (2022 – 556.7 thousand barrels of crude oil per day).
•Began ramping up production on a total of three new well pads at Foster Creek and Christina Lake.
•Generated Operating Margin of $2.0 billion, a decrease of $885 million compared with 2022 primarily due to lower average realized sales prices.
•Invested capital of $539 million primarily for sustaining activities at Christina Lake, Foster Creek, the Lloydminster thermal assets and Sunrise.
•Achieved a Netback of $38.49 per BOE (2022 – $67.83 per BOE).
Financial Results
| | | | | | | | | | | | | | | | | | | | | | | | | |
| Three Months Ended June 30, | | Six Months Ended June 30, | | |
| ($ millions) | 2023 | | 2022 | | 2023 | | 2022 | | |
| Revenues | | | | | | | | | |
Gross Sales | 6,556 | | | 10,048 | | | 12,467 | | | 19,266 | | | |
| Less: Royalties | 620 | | | 1,491 | | | 1,136 | | | 2,573 | | | |
| 5,936 | | | 8,557 | | | 11,331 | | | 16,693 | | | |
| Expenses | | | | | | | | | |
| Purchased Product | 533 | | | 1,071 | | | 1,092 | | | 2,283 | | | |
Transportation and Blending | 2,700 | | | 3,200 | | | 5,641 | | | 6,356 | | | |
Operating | 676 | | | 806 | | | 1,413 | | | 1,508 | | | |
| Realized (Gain) Loss on Risk Management | (9) | | | 559 | | | (1) | | | 1,426 | | | |
| Operating Margin | 2,036 | | | 2,921 | | | 3,186 | | | 5,120 | | | |
Unrealized (Gain) Loss on Risk Management | 31 | | | (323) | | | (3) | | | (57) | | | |
| Depreciation, Depletion and Amortization | 730 | | | 690 | | | 1,445 | | | 1,325 | | | |
| Exploration Expense | 2 | | | (1) | | | 4 | | | — | | | |
| (Income) Loss from Equity-Accounted Affiliates | 6 | | | 8 | | | 6 | | | 8 | | | |
| Segment Income (Loss) | 1,267 | | | 2,547 | | | 1,734 | | | 3,844 | | | |
| | | | | |
| Cenovus Energy Inc. – Q2 2023 Management's Discussion and Analysis | 18 |
Operating Margin Variance
Three Months Ended June 30, 2023
Six Months Ended June 30, 2023
(1)Reported revenues include the value of condensate sold as heavy oil blend. Condensate costs are recorded in transportation and blending expenses. The crude oil price excludes the impact of condensate purchases. Changes to price include the impact of realized risk management gains and losses.
(2)Other includes third-party sourced volumes, construction and other activities not attributable to the production of crude oil, NGLs or natural gas.
Operating Results
| | | | | | | | | | | | | | | | | | | | | | | | | |
| Three Months Ended June 30, | | Six Months Ended June 30, | | |
| 2023 | | 2022 | | 2023 | | 2022 | | |
Total Sales Volumes (MBOE/d) | 578.1 | | | 563.9 | | | 577.5 | | | 586.7 | | | |
| | | | | | | | | |
Total Realized Price (1) ($/BOE) | 71.03 | | | 119.98 | | | 63.37 | | | 107.54 | | | |
| | | | | | | | | |
Crude Oil Production by Asset (Mbbls/d) | | | | | | | | | |
| Foster Creek | 167.0 | | | 187.8 | | | 178.4 | | | 192.8 | | | |
| Christina Lake | 234.9 | | | 228.8 | | | 236.0 | | | 241.4 | | | |
Sunrise (2) | 46.5 | | | 25.3 | | | 45.5 | | | 24.7 | | | |
| Lloydminster Thermal | 106.2 | | | 98.4 | | | 102.6 | | | 97.4 | | | |
| Lloydminster Conventional Heavy Oil | 17.0 | | | 16.4 | | | 16.9 | | | 16.3 | | | |
Tucker (3) | — | | | — | | | — | | | 3.2 | | | |
Total Crude Oil Production (4) (Mbbls/d) | 571.6 | | | 556.7 | | | 579.4 | | | 575.8 | | | |
Natural Gas (5) (MMcf/d) | 12.9 | | | 12.0 | | | 12.7 | | | 12.4 | | | |
Total Production (MBOE/d) | 573.8 | | 558.8 | | 581.6 | | 577.9 | | |
| | | | | | | | | |
Effective Royalty Rate (percent) | 18.7 | | | 25.7 | | | 19.8 | | | 24.1 | | | |
| | | | | | | | | |
Transportation and Blending Expense (1) ($/BOE) | 8.04 | | | 7.51 | | | 8.55 | | | 7.36 | | | |
| | | | | | | | | |
Operating Expense (1) ($/BOE) | 12.72 | | | 15.70 | | | 13.37 | | | 14.05 | | | |
| | | | | | | | | |
Per Unit DD&A (1) ($/BOE) | 13.00 | | | 11.78 | | | 12.87 | | | 11.93 | | | |
(1)Specified financial measure. See the Specified Financial Measures Advisory of this MD&A.
(2)On August 31, 2022, we acquired the remaining 50 percent interest in Sunrise from bp Canada.
(3)The Tucker asset was sold on January 31, 2022.
(4)Oil Sands production is primarily bitumen, except for Lloydminster conventional heavy oil, which is heavy crude oil.
(5)Conventional natural gas product type.
| | | | | |
| Cenovus Energy Inc. – Q2 2023 Management's Discussion and Analysis | 19 |
Revenues
Price
Our heavy oil and bitumen production must be blended with condensate to reduce its viscosity in order to transport it to market through pipelines. Our realized bitumen sales price does not include the sale of condensate; however, it is influenced by the price of condensate. As the cost of condensate increases relative to the price of blended crude oil, our realized heavy oil and bitumen sales price decreases. In the three and six months ended June 30, 2023, condensate pricing benchmarks were at a US$13.65 per barrel and US$21.08 per barrel premium, respectively, to WCS at Hardisty (2022 – US$12.73 and US$14.53, respectively). The increases had a negative impact on our realized bitumen sales price compared with 2022. Another significant factor is that up to three months may lapse from when we purchase condensate to when we sell our blended production.
Our realized sales price averaged $71.03 per BOE and $63.37 per BOE, respectively, in the three and six months ended June 30, 2023, (2022 – $119.98 per BOE and $107.54 per BOE, respectively) due to lower WTI benchmark prices and wider WTI-WCS differentials. In the three and six months ended June 30, 2023, the WTI-WCS differential at Hardisty widened to US$15.04 per barrel and US$19.91 per barrel, respectively (2022 – US$12.80 per barrel and US$13.67, respectively). To improve our realized sales price in the first half of 2023, we sold approximately 25 percent (2022 – 25 percent) of our crude oil volumes at U.S. destinations.
For the three and six months ended June 30, 2023, gross sales included $470 million and $968 million, respectively (2022 – $975 million and $2.1 billion, respectively), from third-party sourced volumes which are not included in our realized price or our Netbacks. Refer to the Specified Financial Measures Advisory of this MD&A for more detail.
For the three and six months ended June 30, 2023, gross sales included $106 million and $186 million, respectively (2022 – $117 million and $169 million, respectively), relating to construction, transportation and blending activities. These amounts are not included in our realized price or our Netbacks. Refer to the Specified Financial Measures Advisory of this MD&A for more detail.
Cenovus makes storage and transportation decisions about utilizing our marketing and transportation infrastructure, including storage and pipeline assets, to optimize product mix, delivery points, transportation commitments and customer diversification. To price protect our inventories associated with storage or transport decisions, Cenovus employs various price alignment and volatility management strategies, including risk management contracts, to reduce volatility in future cash flows and improve cash flow stability.
In the three and six months ended June 30, 2023, our realized risk management gains were $9 million and $1 million, respectively (2022 – losses of $559 million and $1.4 billion, respectively). The changes from 2022 are due to a rising commodity price environment in the first half of 2022 and management’s decision to liquidate our WTI positions related to crude oil sales price risk management in the second quarter of 2022. In the three and six months ended June 30, 2023, we recorded unrealized risk management losses of $31 million and gains of $3 million, respectively (2022 – gains of $323 million and $57 million, respectively), on our crude oil and condensate financial instruments primarily due to changes in forward benchmark pricing relative to our risk management contract prices that related to future periods.
Production Volumes
Oil Sands crude oil production was 571.6 thousand barrels per day and 579.4 thousand barrels per day in the three and six months ended June 30, 2023, respectively (2022 – 556.7 thousand barrels per day and 575.8 thousand barrels per day, respectively).
Production at Foster Creek decreased 20.8 thousand barrels per day and 14.4 thousand barrels per day in the three and six months ended June 30, 2023, respectively, compared with the same periods in 2022. The decreases were primarily due to a planned turnaround that commenced in mid-April and completed in early May. Production at Christina Lake increased slightly quarter-over-quarter and decreased slightly year-over-year. We completed a turnaround at Christina Lake in the second quarter of 2022. Production at Foster Creek and Christina Lake was impacted in the first six months of 2023 as we prepared for the start-up of new well pads. We began ramping up production on a total of three new well pads at Foster Creek and Christina Lake in the second quarter.
The Sunrise Acquisition was completed on August 31, 2022. Production at Sunrise increased 21.2 thousand barrels per day and 20.8 thousand barrels per day, respectively, in the three and six months ended June 30, 2023, compared with 2022. The increase in production related to the acquisition was partially offset by wells taken offline in preparation for a 2023 redevelopment program.
Production from our Lloydminster thermal assets increased in the three and six months ended June 30, 2023, compared with 2022. The increases are due to first oil at the Spruce Lake North thermal plant in August 2022, partially offset by wells taken offline for a redevelopment program and workover activity in the first six months of 2023.
Lloydminster conventional heavy oil production increased marginally in the three and six months ended June 30, 2023, compared with 2022.
| | | | | |
| Cenovus Energy Inc. – Q2 2023 Management's Discussion and Analysis | 20 |
Royalties
Royalty calculations for our Oil Sands segment are based on government prescribed royalty regimes in Alberta and Saskatchewan.
Our Alberta oil sands royalty projects (Foster Creek, Christina Lake and Sunrise) are based on government prescribed pre- and post-payout royalty rates, which are determined on a sliding scale using the Canadian dollar equivalent WTI benchmark price.
Royalties for a pre-payout project are based on a monthly calculation that applies a royalty rate (ranging from one percent to nine percent, based on the Canadian dollar equivalent WTI benchmark price) to the gross revenues from the project.
Royalties for a post-payout project are based on an annualized calculation which uses the greater of: (1) the gross revenues multiplied by the applicable royalty rate (one percent to nine percent, based on the Canadian dollar equivalent WTI benchmark price); or (2) the net revenues of the project multiplied by the applicable royalty rate (25 percent to 40 percent, based on the Canadian dollar equivalent WTI benchmark price). Gross revenues are a function of sales revenues less diluent costs and transportation costs. Net revenues are calculated as sales revenues less diluent costs, transportation costs, and allowed operating and capital costs.
Foster Creek and Christina Lake are post-payout projects and Sunrise is a pre-payout project.
For our Saskatchewan assets, Lloydminster thermal and Lloydminster conventional heavy oil, royalty calculations are based on an annual rate that is applied to each project, which includes each project's Crown and freehold split. For Crown royalties, the pre-payout calculation is based on a one percent rate and the post-payout calculation is based on a 20 percent rate. The freehold calculation is limited to post-payout projects and is based on an eight percent rate.
Effective royalty rates decreased compared with 2022 primarily due to lower realized pricing and lower Alberta oil sands sliding scale royalty rates. For the three and six months ended June 30, 2023, royalties were $620 million and $1.1 billion, respectively (2022 – $1.5 billion and $2.6 billion, respectively).
Expenses
Transportation and Blending
In the second quarter of 2023, blending costs decreased $556 million to $2.3 billion compared with 2022. In the first half of 2023, blending costs decreased $864 million to $4.7 billion compared with 2022. The declines in both periods were largely due to lower condensate prices, partially offset by higher volumes.
Transportation costs increased $56 million to $450 million in the second quarter of 2023 compared with 2022, due to higher costs as discussed below combined with increased sales volumes. In the first six months of 2023, transportation costs rose $149 million to $940 million, due to higher costs as discussed below.
Per-unit Transportation Expenses
Transportation costs were $8.04 per BOE and $8.55 per BOE in the three and six months ended June 30, 2023, respectively (2022 – $7.51 per BOE and $7.36 per BOE, respectively).
At Foster Creek, per-unit transportation costs increased 23 percent and 30 percent to $12.80 per barrel and $13.13 per barrel in the three and six months ended June 30, 2023, respectively. The increases were mainly due to higher tariff rates and lower sales volumes. In the three and six months ended June 30, 2023, we shipped 47 percent and 48 percent, respectively (2022 – 46 percent and 42 percent, respectively) of our volumes from Foster Creek to U.S. destinations.
At Christina Lake, transportation costs were $5.91 per barrel and $6.81 per barrel in the three and six months ended June 30, 2023 (2022 – $6.75 per barrel and $6.55 per barrel, respectively). The quarter-over-quarter decrease was primarily due to lower fixed rail costs, partially offset by higher sales to the U.S. and increased tariff rates. Year-to-date, per-unit transportation costs increased slightly, primarily due to higher volumes shipped to the U.S. and increased tariff rates, partially offset by lower fixed rail costs. In the three and six months ended June 30, 2023, we shipped 17 percent and 18 percent, respectively (2022 – 14 percent and 15 percent, respectively) of our volumes from Christina Lake to U.S. destinations.
At Sunrise, transportation costs in the three and six months ended June 30, 2023, were $12.58 per barrel and $12.62 per barrel, respectively (2022 – $12.48 per barrel and $12.82 per barrel, respectively). In the three and six months ended June 30, 2023, we shipped 50 percent and 48 percent, respectively (2022 – 48 percent and 58 percent, respectively) of our total volumes to the U.S.
At our other Oil Sands assets, transportation costs in the three and six months ended June 30, 2023, were $3.60 per barrel and $3.67 per barrel, respectively (2022 – $3.28 per barrel and $3.39 per barrel, respectively).
| | | | | |
| Cenovus Energy Inc. – Q2 2023 Management's Discussion and Analysis | 21 |
Operating
Primary drivers of our operating expenses in the first six months of 2023 were fuel, workforce, chemicals, and repairs and maintenance. Total operating expenses decreased due to lower fuel costs as a result of significant declines in AECO benchmark prices in the three and six months ended June 30, 2023, compared with 2022. The decreases were partially offset by higher repairs and maintenance, and workforce costs.
Unit Operating Expenses (1)
| | | | | | | | | | | | | | | | | | | | | | | | | | | | | | | | | | | | | | | |
| Three Months Ended June 30, | | Six Months Ended June 30, | | | | |
($/BOE) | 2023 | | Percent
Change | | 2022 | | 2023 | | Percent
Change | | 2022 | | | | |
| Foster Creek | | | | | | | | | | | | | | | |
Fuel | 3.40 | | | (50) | | | 6.74 | | | 4.27 | | | (25) | | | 5.71 | | | | | |
Non-Fuel | 8.81 | | | 16 | | | 7.57 | | | 8.34 | | | 19 | | | 7.02 | | | | | |
Total | 12.21 | | | (15) | | | 14.31 | | | 12.61 | | | (1) | | | 12.73 | | | | | |
| Christina Lake | | | | | | | | | | | | | | | |
Fuel | 2.77 | | | (55) | | | 6.13 | | | 3.26 | | | (38) | | | 5.27 | | | | | |
Non-Fuel | 5.32 | | | (6) | | | 5.64 | | | 5.34 | | | 4 | | | 5.15 | | | | | |
Total | 8.09 | | | (31) | | | 11.77 | | | 8.60 | | | (17) | | | 10.42 | | | | | |
| Sunrise | | | | | | | | | | | | | | | |
| Fuel | 4.52 | | | (52) | | | 9.32 | | | 5.49 | | | (30) | | | 7.89 | | | | | |
Non-Fuel | 12.86 | | | 8 | | | 11.90 | | | 14.00 | | | 26 | | | 11.14 | | | | | |
Total | 17.38 | | | (18) | | | 21.22 | | | 19.49 | | | 2 | | | 19.03 | | | | | |
Other Oil Sands (2) | | | | | | | | | | | | | | | |
Fuel | 3.97 | | | (60) | | | 9.81 | | | 4.91 | | | (41) | | | 8.38 | | | | | |
Non-Fuel | 16.33 | | | 11 | | | 14.77 | | | 16.73 | | | 18 | | | 14.18 | | | | | |
Total | 20.30 | | | (17) | | | 24.58 | | | 21.64 | | | (4) | | | 22.56 | | | | | |
| Total | 12.72 | | | (19) | | | 15.70 | | | 13.37 | | | (5) | | | 14.05 | | | | | |
(1)Specified financial measure. See the Specified Financial Measures Advisory of this MD&A.
(2)Includes Tucker, Lloydminster thermal and Lloydminster conventional heavy oil assets. The Tucker asset was sold on January 31, 2022.
Per-unit fuel prices decreased overall due to lower natural gas prices as discussed above. Per-unit fuel prices are also impacted by the timing and value of sales out of inventory.
Foster Creek per-unit non-fuel costs increased in the three and six months ended June 30, 2023, compared with 2022 due to lower sales volumes combined with costs related to the planned turnaround in the second quarter of 2023.
Christina Lake per-unit non-fuel costs declined slightly quarter-over-quarter primarily due to lower electricity costs. Year-to-date, per-unit non-fuel costs increased slightly primarily due to lower sales volumes.
Sunrise per-unit non-fuel costs increased in the three and six months ended June 30, 2023, compared with 2022 mainly due to lower gross sales volumes in 2023, combined with higher electricity, workforce, and repairs and maintenance costs, partially offset by lower workover activity. Gross sales volumes in the first half of 2023 were 43.5 thousand barrels per day (2022 – 49.0 thousand barrels per day).
Per-unit non-fuel costs at our other Oil Sands assets increased in 2023 from 2022, primarily due to higher workover activity and repairs and maintenance costs, partially offset by higher sales volumes.
Netbacks
| | | | | | | | | | | | | | | | | | | | | | | | | |
| Three Months Ended June 30, | | Six Months Ended June 30, | | |
| ($/BOE) | 2023 | | 2022 | | 2023 | | 2022 | | |
Sales Price (1) | 71.03 | | | 119.98 | | | 63.37 | | | 107.54 | | | |
Royalties (1) | 11.78 | | | 28.94 | | | 10.87 | | | 24.18 | | | |
Transportation (1) | 8.04 | | | 7.51 | | | 8.55 | | | 7.36 | | | |
Operating Expenses (1) | 12.72 | | | 15.70 | | | 13.37 | | | 14.05 | | | |
Netback (2) | 38.49 | | | 67.83 | | | 30.58 | | | 61.95 | | | |
| | | | | | | | | |
| | | | | | | | | |
| | | | | | | | | |
(1)Specified financial measure. See the Specified Financial Measures Advisory of this MD&A.
(2)Contains a non-GAAP financial measure. See the Specified Financial Measures Advisory of this MD&A.
| | | | | |
| Cenovus Energy Inc. – Q2 2023 Management's Discussion and Analysis | 22 |
DD&A
In the three months and six months ended June 30, 2023, DD&A was $730 million and $1.4 billion, respectively (2022 – $690 million and $1.3 billion, respectively). The average depletion rate for the three and six months ended June 30, 2023, was $13.00 per BOE and $12.87 per BOE, respectively (2022 – $11.78 per BOE and $11.93 per BOE, respectively).
Conventional
In the second quarter of 2023, we:
•Delivered safe operations.
•Produced 104.6 thousand BOE per day (2022 – 132.6 thousand BOE per day).
•Responded to wildfires in northern Alberta. In early May, we temporarily shut-in approximately 85 thousand BOE per day of production in the operating areas of Rainbow Lake, Elmworth-Wapiti, Kaybob-Edson and Clearwater to ensure the safety of our staff, local communities and assets. The majority of our wells and facilities impacted by the fire were restarted by June. Approximately 5 to 7 thousand BOE per day of production remains offline near the end of July due to the lack of third-party power infrastructure.
•Generated Operating Margin of $73 million, a decrease from $434 million in 2022 due to lower average realized sales prices and lower sales volumes.
•Invested capital of $82 million with continued focus on drilling, completion and tie-in activities, and infrastructure projects to support multi-year development.
•Averaged a Netback of $5.89 per BOE (2022 – $36.78 per BOE).
Financial Results
| | | | | | | | | | | | | | | | | | | | | | | | | |
| Three Months Ended June 30, | | Six Months Ended June 30, | | |
| ($ millions) | 2023 | | 2022 | | 2023 | | 2022 | | |
| Revenues | | | | | | | | | |
Gross Sales | 615 | | | 1,079 | | | 1,646 | | | 2,191 | | | |
| Less: Royalties | 4 | | | 89 | | | 58 | | | 160 | | | |
| 611 | | | 990 | | | 1,588 | | | 2,031 | | | |
| Expenses | | | | | | | | | |
| Purchased Product | 352 | | | 390 | | | 862 | | | 996 | | | |
Transportation and Blending | 46 | | | 34 | | | 94 | | | 68 | | | |
| Operating | 144 | | | 128 | | | 294 | | | 262 | | | |
| Realized (Gain) Loss on Risk Management | (4) | | | 4 | | | 4 | | | 8 | | | |
| Operating Margin | 73 | | | 434 | | | 334 | | | 697 | | | |
Unrealized (Gain) Loss on Risk Management | (1) | | | (1) | | | (21) | | | (1) | | | |
| Depreciation, Depletion and Amortization | 87 | | | 99 | | | 182 | | | 179 | | | |
| Exploration Expense | — | | | 1 | | | — | | | 1 | | | |
| Segment Income (Loss) | (13) | | | 335 | | | 173 | | | 518 | | | |
Operating Margin Variance
Three Months Ended June 30, 2023
| | | | | |
| Cenovus Energy Inc. – Q2 2023 Management's Discussion and Analysis | 23 |
Six Months Ended June 30, 2023
(1)Reflects Operating Margin from processing facilities.
Operating Results
| | | | | | | | | | | | | | | | | | | | | | | | | |
| Three Months Ended June 30, | | Six Months Ended June 30, | | |
| 2023 | | 2022 | | 2023 | | 2022 | | |
Total Sales Volumes (MBOE/d) | 104.6 | | | 132.6 | | | 114.2 | | | 128.8 | | | |
| | | | | | | | | |
Total Realized Price (1) ($/BOE) | 25.83 | | | 57.11 | | | 35.80 | | | 50.22 | | | |
Light Crude Oil ($/bbl) | 104.40 | | | 134.66 | | | 103.48 | | | 123.27 | | | |
NGLs ($/bbl) | 46.59 | | | 73.47 | | | 47.39 | | | 64.53 | | | |
Conventional Natural Gas ($/Mcf) | 2.79 | | | 7.87 | | | 4.82 | | | 6.77 | | | |
| | | | | | | | | |
| Production by Product | | | | | | | | | |
Light Crude Oil (Mbbls/d) | 4.8 | | | 7.5 | | | 5.6 | | | 7.9 | | | |
NGLs (Mbbls/d) | 18.0 | | | 24.7 | | | 20.0 | | | 24.6 | | | |
Conventional Natural Gas (MMcf/d) | 491.4 | | | 601.2 | | | 531.9 | | | 578.3 | | | |
Total Production (MBOE/d) | 104.6 | | | 132.6 | | | 114.2 | | | 128.8 | | | |
| | | | | | | | | |
Conventional Natural Gas Production (percentage of total) | 78 | | | 76 | | | 78 | | | 75 | | | |
Crude Oil and NGLs Production (percentage of total) | 22 | | | 24 | | | 22 | | | 25 | | | |
| | | | | | | | | |
Effective Royalty Rate (percent) | 2.5 | | | 13.6 | | | 11.5 | | | 14.5 | | | |
Transportation Costs (1) ($/BOE) | 4.82 | | | 2.97 | | | 4.56 | | | 3.07 | | | |
Operating Expense (1) ($/BOE) | 14.59 | | | 10.02 | | | 13.77 | | | 10.65 | | | |
Per Unit DD&A (1) ($/BOE) | 9.01 | | | 8.21 | | | 8.76 | | | 8.20 | | | |
(1)Specified financial measure. See the Specified Financial Measures Advisory of this MD&A.
Revenues
Price
Our total realized sales price decreased in the three and six months ended June 30, 2023, due to lower crude oil and natural gas benchmark prices. The AECO benchmark price declined 63 percent and 38 percent, respectively, for the three and six months ended June 30, 2023 compared with the same periods in 2022.
For the three and six months ended June 30, 2023, gross sales included $352 million and $862 million, respectively (2022 – $390 million and $996 million, respectively), relating to third-party sourced volumes, which are not included in our realized prices or our Netbacks. Refer to the Specified Financial Measures Advisory of this MD&A for more detail.
For the three and six months ended June 30, 2023, gross sales included amounts relating to processing and transportation activities undertaken for third parties of $17 million and $44 million, respectively (2022 – $14 million and $27 million, respectively), which are not included in our realized prices or our Netbacks. Refer to the Specified Financial Measures Advisory of this MD&A for more detail.
Production Volumes
For the three and six months ended June 30, 2023, production volumes decreased 28.0 thousand BOE per day and 14.6 thousand BOE per day, respectively, primarily due to the impact of wildfires discussed above.
| | | | | |
| Cenovus Energy Inc. – Q2 2023 Management's Discussion and Analysis | 24 |
Royalties
The Conventional assets are subject to royalty regimes in Alberta and British Columbia. Effective royalty rates decreased in the three and six months ended June 30, 2023, compared with the same periods in 2022, primarily due to sharp declines in natural gas pricing, increased gas cost allowance (“GCA”) deductions and the impact of wildfires. In Alberta, natural gas wells benefit from GCA which reduces royalties to account for capital and operating costs incurred to process and transport the Crown’s portion of natural gas production. Total royalties decreased compared with 2022 due to the same factors impacting effective royalty rates combined with lower sales volumes.
Expenses
Transportation
Our transportation costs reflect charges for the movement of crude oil, NGLs and natural gas from the point of production to where the product is sold. In the second quarter of 2023, transportation costs increased $12 million to $46 million, compared with 2022, and per-unit transportation costs averaged $4.82 per BOE in 2023, compared with $2.97 per BOE in 2022. Year-to-date, transportation costs increased $26 million to $94 million, and per-unit transportation costs averaged $4.56 per BOE, compared with $3.07 per BOE in 2022. The increases were due mainly to incremental costs related to the wildfires and additional storage contracts.
Operating
Primary drivers of our operating expenses in the first half of 2023 were repairs and maintenance, workforce, property taxes and lease costs, and electricity. Operating expenses per BOE increased in the three and six months ended June 30, 2023, compared with 2022, primarily due to lower sales volumes and higher total operating expenses. Total operating expenses increased $16 million to $144 million quarter-over-quarter and $32 million to $294 million year-over-year. The increases were primarily due to higher repairs and maintenance and workforce costs. The wildfires had minimal impact on total operating expenses.
Netbacks
| | | | | | | | | | | | | | | | | | | | | | | | | |
| Three Months Ended June 30, | | Six Months Ended June 30, | | |
| ($/BOE) | 2023 | | 2022 | | 2023 | | 2022 | | |
Sales Price (1) | 25.83 | | | 57.11 | | | 35.80 | | | 50.22 | | | |
Royalties (1) | 0.53 | | | 7.34 | | | 2.84 | | | 6.83 | | | |
Transportation and Blending (1) | 4.82 | | | 2.97 | | | 4.56 | | | 3.07 | | | |
Operating Expenses (1) | 14.59 | | | 10.02 | | | 13.77 | | | 10.65 | | | |
Netback (2) | 5.89 | | | 36.78 | | | 14.63 | | | 29.67 | | | |
| | | | | | | | | |
| | | | | | | | | |
| | | | | | | | | |
(1)Specified financial measure. See the Specified Financial Measures Advisory of this MD&A.
(2)Contains a non-GAAP financial measure. See the Specified Financial Measures Advisory of this MD&A.
DD&A
For the three and six months ended June 30, 2023, total Conventional DD&A was $87 million and $182 million, respectively (2022 – $99 million and $179 million, respectively). The average depletion rate for the three and six months ended June 30, 2023, was $9.01 per BOE and $8.76 per BOE, respectively (2022 – $8.21 per BOE and $8.20 per BOE, respectively).
Offshore
In the second quarter of 2023, we:
•Delivered safe operations.
•Produced 51.5 thousand BOE per day (2022 – 70.1 thousand BOE per day).
•Generated Operating Margin of $148 million, a decrease of $328 million compared with 2022, largely due to decreased sales volumes from our Atlantic and China operations. We had no sales volumes from our Atlantic operations due to timing differences between production and sales, and planned turnaround activity.
•Earned a Netback of $45.11 per BOE (2022 – $76.48 per BOE).
•Invested capital of $184 million mainly for the West White Rose project and Terra Nova ALE project in the Atlantic region.
The West White Rose project was around 70 percent complete as at June 30, 2023. Since our decision to restart the project, we have invested approximately $300 million. We reached a major milestone on the project in June with the completion of the conical slip form operation for the concrete gravity structure.
At Terra Nova, quayside preparation and maintenance activities continue on the floating production, storage and offloading unit (“FPSO”) and we are evaluating the schedule.
| | | | | |
| Cenovus Energy Inc. – Q2 2023 Management's Discussion and Analysis | 25 |
Financial Results
| | | | | | | | | | | | | | | | | | | | | | | | | | | | | | | | | | | |
| Three Months Ended June 30, |
| | | 2023 | | | | 2022 |
| ($ millions) | Atlantic | | Asia Pacific | | Offshore | | Atlantic | | Asia Pacific | | Offshore |
| Revenues | | | | | | | | | | | |
| Gross Sales | 5 | | 223 | | 228 | | 207 | | 351 | | 558 |
Less: Royalties | 1 | | 12 | | 13 | | (16) | | 18 | | 2 |
| 4 | | 211 | | 215 | | 223 | | 333 | | 556 |
| Expenses | | | | | | | | | | | |
Transportation and Blending | 4 | | — | | 4 | | 4 | | — | | 4 |
Operating | 26 | | 37 | | 63 | | 47 | | 29 | | 76 |
Operating Margin (1) | (26) | | 174 | | 148 | | 172 | | 304 | | 476 |
| Depreciation, Depletion and Amortization | | | | | 91 | | | | | | 159 |
| Exploration Expense | | | | | 2 | | | | | | 10 |
| (Income) Loss from Equity-Accounted Affiliates | | | | | (12) | | | | | | (6) |
| Segment Income (Loss) | | | | | 67 | | | | | | 313 |
(1)Atlantic and Asia Pacific Operating Margin are non-GAAP financial measures. See the Specified Financial Measures Advisory of this MD&A.
Operating Margin Variance
Three Months Ended June 30, 2023
| | | | | | | | | | | | | | | | | | | | | | | | | | | | | | | | | | | |
| Six Months Ended June 30, |
| 2023 | | 2022 |
| ($ millions) | Atlantic | | Asia Pacific | | Offshore | | Atlantic | | Asia Pacific | | Offshore |
| Revenues | | | | | | | | | | | |
| Gross Sales | 154 | | 547 | | 701 | | 379 | | 746 | | 1,125 |
Less: Royalties | 9 | | 30 | | 39 | | (6) | | 40 | | 34 |
| 145 | | 517 | | 662 | | 385 | | 706 | | 1,091 |
| Expenses | | | | | | | | | | | |
Transportation and Blending | 9 | | — | | 9 | | 8 | | — | | 8 |
Operating | 143 | | 62 | | 205 | | 93 | | 56 | | 149 |
Operating Margin (1) | (7) | | 455 | | 448 | | 284 | | 650 | | 934 |
| Depreciation, Depletion and Amortization | | | | | 219 | | | | | | 309 |
| Exploration Expense | | | | | 4 | | | | | | 25 |
| (Income) Loss from Equity-Accounted Affiliates | | | | | (18) | | | | | | (10) |
| Segment Income (Loss) | | | | | 243 | | | | | | 610 |
(1)Atlantic and Asia Pacific Operating Margin are non-GAAP financial measures. See the Specified Financial Measures Advisory of this MD&A.
| | | | | |
| Cenovus Energy Inc. – Q2 2023 Management's Discussion and Analysis | 26 |
Operating Margin Variance
Six Months Ended June 30, 2023
Operating Results
| | | | | | | | | | | | | | | | | | | | | | | |
| Three Months Ended June 30, | | Six Months Ended June 30, |
| 2023 | | 2022 | | 2023 | | 2022 |
Sales Volumes | | | | | | | |
Atlantic (Mbbls/d) | — | | | 15.5 | | 7.8 | | 15.1 |
Asia Pacific (MBOE/d) | | | | | | | |
| China | 31.2 | | 46.8 | | 37.2 | | 50.1 |
Indonesia (1) | 15.0 | | 10.0 | | 14.3 | | 9.6 |
| Total Asia Pacific | 46.2 | | 56.8 | | 51.5 | | 59.7 |
Total Sales Volumes (MBOE/d) | 46.2 | | 72.3 | | | 59.3 | | 74.8 | |
| | | | | | | |
Total Realized Price (2) ($/BOE) | 73.12 | | | 95.16 | | | 79.51 | | | 92.74 |
| | | | | | | |
Atlantic - Light Crude Oil ($/bbl) | — | | | 146.38 | | | 108.73 | | | 138.92 |
| | | | | | | |
Asia Pacific (1) ($/BOE) | 71.86 | | | 81.16 | | | 75.07 | | | 81.09 |
NGLs ($/bbl) | 84.95 | | | 120.75 | | | 91.43 | | | 115.33 |
Conventional Natural Gas ($/Mcf) | 11.47 | | | 11.76 | | | 11.85 | | | 12.00 |
| | | | | | | |
| Production by Product | | | | | | | |
Atlantic - Light Crude Oil (Mbbls/d) | 5.3 | | 13.3 | | 7.1 | | 13.5 |
Asia Pacific (1) | | | | | | | |
NGLs (Mbbls/d) | 8.7 | | 12.0 | | 10.0 | | 12.6 |
Conventional Natural Gas (MMcf/d) | 225.1 | | 269.0 | | 248.5 | | 283.2 |
Total Asia Pacific (MBOE/d) | 46.2 | | 56.8 | | 51.5 | | 59.7 |
Total Production (MBOE/d) | 51.5 | | 70.1 | | 58.6 | | 73.2 |
| | | | | | | |
Effective Royalty Rate (percent) | | | | | | | |
| Atlantic | — | | | (8.0) | | | 5.3 | | | (1.6) | |
Asia Pacific (1) | 10.1 | | | 13.1 | | | 10.1 | | | 11.9 | |
| | | | | | | |
Operating Expense (2) ($/BOE) | 19.48 | | | 12.27 | | | 18.88 | | | 11.94 |
| Atlantic | — | | | 30.57 | | | 85.02 | | | 33.22 |
Asia Pacific (1) | 10.96 | | | 7.27 | | | 8.82 | | | 6.58 |
| | | | | | | |
Per Unit DD&A (2) ($/BOE) | 25.31 | | | 30.11 | | | 25.81 | | | 29.98 |
(1)Reported sales volumes, associated per-unit values and royalty rates reflect Cenovus’s 40 percent interest in HCML. Revenues and expenses related to the HCML joint venture are accounted for using the equity method in the consolidated financial statements.
(2)Specified financial measure. See the Specified Financial Measures Advisory of this MD&A.
Revenues
Price
The price we receive for natural gas sold in Asia is set under long-term contracts. Our realized sales price on light crude oil and NGLs decreased in the three and six months ended June 30, 2023, compared with 2022, primarily due to lower Brent benchmark pricing.
| | | | | |
| Cenovus Energy Inc. – Q2 2023 Management's Discussion and Analysis | 27 |
Production Volumes
Atlantic production decreased 8.0 thousand barrels per day and 6.4 thousand barrels per day in the three and six months ended June 30, 2023, respectively, compared with 2022. The decreases were due to turnaround work on the SeaRose FPSO completed in March and April of 2023. Operations partially resumed in late April and we returned to full operations in mid-June. In addition, the decrease in Cenovus’s working interest at the White Rose field and satellite extensions effective May 31, 2022, lowered production year-over-year. Light crude oil from production at the White Rose fields is offloaded from the SeaRose FPSO to tankers and stored at an onshore terminal before shipment to buyers, which results in a timing difference between production and sales. There were no sales volumes in the second quarter of 2023 due to this timing and the planned turnaround activity.
Asia Pacific production decreased 10.6 thousand barrels per day and 8.2 thousand barrels per day in the three and six months ended June 30, 2023, respectively, compared with 2022. The decrease was due to a temporary unplanned outage early in the second quarter in China, related to the disconnection of the umbilical by a third-party vessel in early April and reconnected in May. In addition, we completed planned maintenance in China in June 2023. Changes to gas sales agreements at Liwan 3-1 and Liuhua 29-1 in the second quarter of 2022 also resulted in a net decrease in production. The decrease was partially offset by first gas production at the MBH and MDA fields in Indonesia in the fourth quarter of 2022, and planned maintenance in China in the second quarter of 2022. At our equity-accounted assets in Indonesia, we drilled and completed the third of three planned development wells at the MAC field in the first quarter of 2023. We expect first gas production from the field in the third quarter of 2023.
Royalties
In the three and six months ended June 30, 2023, Atlantic royalties were $1 million and $9 million, respectively (2022 – recoveries of $16 million and $6 million, respectively). In 2022, royalties at the White Rose field included year-to-date adjustments based on an amended agreement between our working interest partners and the Government of Newfoundland and Labrador.
Royalty rates in China and Indonesia are governed by production sharing contracts in which production is shared with the Chinese and Indonesian governments. The effective royalty rate for the three and six months ended June 30, 2023, declined slightly to 10.1 percent (2022 – 13.1 percent and 11.9 percent, respectively) as a result of first gas production at the MBH and MDA fields starting in the fourth quarter of 2022.
Expenses
Operating
Primary drivers of our Atlantic operating expenses in the first half of 2023 were vessel and helicopter costs, repairs and maintenance, and workforce. In the second quarter of 2023, operating costs decreased $21 million in the Atlantic compared with 2022, primarily due to lower production and sales volumes, partially offset by costs related to turnaround work on the SeaRose FPSO and costs related to continued preparation and maintenance activities for the Terra Nova FPSO. Operating expenses in the first six months of 2023 increased $50 million due to the ramp-up of the West White Rose project leading up to the start of major construction in late March, costs related to turnaround work on the SeaRose FPSO and costs related to continued preparation and maintenance activities for the Terra Nova FPSO. Per-unit operating expenses increased in the three and six months ended June 30, 2023, compared with the same periods in 2022 mainly due to lower sales volumes.
Primary drivers of our Asia Pacific operating expenses in the first six months of 2023 were repairs and maintenance, insurance and workforce. Total operating expenses increased in the three and six months ended June 30, 2023, compared with 2022 primarily due to costs related to the unplanned outage in the second quarter. Per-unit operating expenses increased in the three and six months ended June 30, 2023, mainly due to the same factors that impacted total operating expenses combined with lower sales volumes.
Transportation
Transportation costs in the Atlantic region remained consistent compared with 2022 and includes the cost of transporting crude oil from the SeaRose FPSO unit to onshore via tankers, as well as storage costs.
| | | | | |
| Cenovus Energy Inc. – Q2 2023 Management's Discussion and Analysis | 28 |
Netbacks
| | | | | | | | | | | | | | | | | | | | | | | | | | |
| Three Months Ended June 30, 2023 |
| ($/BOE, except where indicated) | Atlantic (1) ($/bbl) | | China | Indonesia (2) | Total Offshore |
| | | | | | | | |
Sales Price (3) | | — | | | 78.48 | | | 58.05 | | | 73.12 | |
Royalties (3) | | — | | | 4.23 | | | 13.60 | | | 7.47 | |
Transportation and Blending (3) | | — | | | — | | | — | | | 1.06 | |
Operating Expenses (3) | | — | | | 11.91 | | | 8.98 | | | 19.48 | |
Netback (3) | | — | | | 62.34 | | | 35.47 | | | 45.11 | |
| | | | | | | | | | | | | | | | | | | | | | | | | | | | | |
| Three Months Ended June 30, 2022 | |
| ($/BOE, except where indicated) | Atlantic ($/bbl) | | China | Indonesia (2) | Total Offshore | |
| | | | | | | | | |
Sales Price (3) | | 146.38 | | | 82.25 | | | 76.06 | | | 95.16 | | |
Royalties (3) | | (11.50) | | | 4.44 | | | 39.69 | | | 5.89 | | |
Transportation and Blending (3) | | 2.40 | | | — | | | — | | | 0.52 | | |
Operating Expenses (3) | | 30.57 | | | 5.89 | | | 13.70 | | | 12.27 | | |
Netback (4) | | 124.91 | | | 71.92 | | | 22.67 | | | 76.48 | | |
(1)No sales volumes from our Atlantic operations in the second quarter of 2023.
(2)Reported sales volumes, associated per-unit values and royalty rates reflect Cenovus’s 40 percent interest in HCML. Revenues and expenses related to the HCML joint venture are accounted for using the equity method in the consolidated financial statements.
(3)Specified financial measure. See the Specified Financial Measures Advisory of this MD&A.
(4)Contains a non-GAAP financial measure. See the Specified Financial Measures Advisory of this MD&A.
| | | | | | | | | | | | | | | | | | | | | | | | | | | | | |
| Six Months Ended June 30, 2023 | |
| ($/BOE, except where indicated) | Atlantic ($/bbl) | | China | Indonesia (1) | Total Offshore | |
| | | | | | | | | |
Sales Price (2) | | 108.73 | | | 81.37 | | | 58.72 | | | 79.51 | | |
Royalties (2) | | 6.14 | | | 4.44 | | | 15.83 | | | 7.42 | | |
Transportation and Blending (2) | | 6.31 | | | — | | | — | | | 0.83 | | |
Operating Expenses (2) | | 85.02 | | | 8.26 | | | 10.26 | | | 18.88 | | |
Netback (3) | | 11.26 | | | 68.67 | | | 32.63 | | | 52.38 | | |
| | | | | | | | | | | | | | | | | | | | | | | | | | |
| Six Months Ended June 30, 2022 |
| ($/BOE, except where indicated) | Atlantic ($/bbl) | | China | Indonesia (1) | Total Offshore |
| | | | | | | | |
Sales Price (2) | | 138.92 | | | 82.16 | | | 75.47 | | | 92.74 | |
Royalties (2) | | (2.20) | | | 4.44 | | | 37.10 | | | 7.27 | |
Transportation and Blending (2) | | 2.93 | | | — | | | — | | | 0.59 | |
Operating Expenses (2) | | 33.22 | | | 5.24 | | | 13.61 | | | 11.94 | |
Netback (3) | | 104.97 | | | 72.48 | | | 24.76 | | | 72.94 | |
(1)Reported sales volumes, associated per-unit values and royalty rates reflect Cenovus’s 40 percent interest in HCML. Revenues and expenses related to the HCML joint venture are accounted for using the equity method in the consolidated financial statements.
(2)Specified financial measure. See the Specified Financial Measures Advisory of this MD&A.
(3)Contains a non-GAAP financial measure. See the Specified Financial Measures Advisory of this MD&A.
DD&A
In the three and six months ended June 30, 2023, total Offshore DD&A was $91 million and $219 million, respectively (2022 – $159 million and $309 million, respectively). The average depletion rate in the three and six months ended June 30, 2023, was $25.31 per BOE and $25.81 per BOE, respectively (2022 – $30.11 per BOE and $29.98 per BOE, respectively).
| | | | | |
| Cenovus Energy Inc. – Q2 2023 Management's Discussion and Analysis | 29 |
DOWNSTREAM
Canadian Manufacturing
In the second quarter of 2023, we:
•Achieved crude utilization of 86 percent (2022 – 73 percent) in our Canadian Manufacturing segment.
•Generated Operating Margin of $116 million, an increase of $62 million compared with 2022, primarily due to lower operating expenses and higher production from the Lloydminster Refinery and the Upgrader.
•Experienced an unplanned outage at the Upgrader in April that was resolved in May.
Financial Results
| | | | | | | | | | | | | | | | | | | | | | | | | |
| Three Months Ended June 30, | | Six Months Ended June 30, | | |
| ($ millions) | 2023 | | 2022 | | 2023 | | 2022 | | |
| Revenues | 1,363 | | | 2,245 | | | 2,871 | | | 3,852 | | | |
| Purchased Product | 1,083 | | | 1,980 | | | 2,176 | | | 3,315 | | | |
Gross Margin (1) | 280 | | | 265 | | | 695 | | | 537 | | | |
| Expenses | | | | | | | | | |
| Operating | 164 | | | 211 | | | 316 | | | 362 | | | |
| Operating Margin | 116 | | | 54 | | | 379 | | | 175 | | | |
| Depreciation, Depletion and Amortization | 43 | | | 72 | | | 86 | | | 122 | | | |
| Segment Income (Loss) | 73 | | | (18) | | | 293 | | | 53 | | | |
(1)Non-GAAP financial measure. See the Specified Financial Measures Advisory of this MD&A.
Select Operating Results
| | | | | | | | | | | | | | | | | | | | | | | | | |
| Three Months Ended June 30, | | Six Months Ended June 30, | | |
| 2023 | | 2022 | | 2023 | | 2022 | | |
Heavy Crude Oil Unit Throughput Capacity (Mbbls/d) | 110.5 | | | 110.5 | | | 110.5 | | | 110.5 | | | |
Lloydminster Upgrader | 81.5 | | | 81.5 | | | 81.5 | | | 81.5 | | | |
Lloydminster Refinery | 29.0 | | | 29.0 | | | 29.0 | | | 29.0 | | | |
| | | | | | | | | |
Heavy Crude Oil Unit Throughput (Mbbls/d) | 95.3 | | | 80.9 | | | 97.0 | | | 89.4 | | | |
Lloydminster Upgrader | 68.1 | | | 64.6 | | | 69.0 | | | 67.6 | | | |
Lloydminster Refinery | 27.2 | | | 16.3 | | | 28.0 | | | 21.8 | | | |
| | | | | | | | | |
Crude Utilization (1) (percent) | 86 | | | 73 | | | 88 | | | 81 | | | |
| | | | | | | | | |
Total Production (Mbbls/d) | 108.3 | | | 90.9 | | | 110.6 | | | 100.7 | | | |
| Diesel | 12.4 | | | 7.0 | | | 12.4 | | | 8.2 | | | |
| Synthetic Crude Oil | 44.8 | | | 43.5 | | | 45.2 | | | 45.7 | | | |
| Asphalt | 15.3 | | | 9.2 | | | 15.5 | | | 12.1 | | | |
| Other | 31.9 | | | 26.6 | | | 33.0 | | | 30.0 | | | |
| Ethanol | 3.9 | | | 4.6 | | | 4.5 | | | 4.7 | | | |
| | | | | | | | | |
| | | | | | | | | |
| | | | | | | | | |
Upgrading Differential (2) ($/bbl) | 26.40 | | | 26.47 | | | 34.06 | | | 23.44 | | | |
| | | | | | | | | |
Refining Margin (3) ($/bbl) | 28.36 | | | 24.87 | | | 35.93 | | | 24.55 | | | |
Lloydminster Upgrader | 27.66 | | | 25.54 | | | 38.22 | | | 26.29 | | | |
Lloydminster Refinery | 30.14 | | | 22.22 | | | 30.28 | | | 19.17 | | | |
| | | | | | | | | |
Unit Operating Expense (4) ($/bbl) | 13.40 | | | 19.93 | | | 12.92 | | | 15.05 | | | |
| | | | | | | | | |
| Rail | | | | | | | | | |
Volumes Loaded (5) (Mbbls/d) | — | | | — | | | 1.1 | | | 1.5 | | | |
(1)Based on crude oil unit throughput volumes and results of operations at the Upgrader and Lloydminster Refinery.
(2)Based on benchmark price differential between heavy oil feedstock and synthetic crude.
(3)Contains a non-GAAP financial measure. See the Specified Financial Measures Advisory of this MD&A. Revenues from the Upgrader and commercial fuels business for the three and six months ended June 30, 2023, were $1.0 billion and $2.3 billion, respectively (2022 – $1.2 billion and $1.9 billion, respectively, from the Upgrader). Revenues from the Lloydminster Refinery for the three and six months ended were $226 million and $414 million, respectively (2022 – $243 million and $429 million, respectively).
(4)Specified financial measure. See the Specified Financial Measures Advisory of this MD&A.
(5)Volumes transported outside of Alberta, Canada.
| | | | | |
| Cenovus Energy Inc. – Q2 2023 Management's Discussion and Analysis | 30 |
Throughput at the Upgrader increased 3.5 thousand barrels per day from the second quarter of 2022 to 68.1 thousand barrels per day, primarily due to planned turnaround activities in the second quarter of 2022. The increase was partially offset by an unplanned outage at the Upgrader in the second quarter of 2023, which impacted throughput for about one month. Crude utilization was 84 percent in the second quarter of 2023 compared with 79 percent in the second quarter of 2022.
Year-to-date throughput at the Upgrader increased 1.4 thousand barrels per day compared with the first six months of 2022 to 69.0 thousand barrels per day. The increase was primarily due to the completion of planned turnarounds in 2022, combined with maintenance outages in the first quarter of 2022. The increase in 2023 was partially offset by the unplanned outage discussed above and unplanned outages and cold weather impacts in the fourth quarter of 2022. The outages were resolved and the Upgrader returned to full rates by the middle of January 2023. Crude utilization was flat in the six months ended June 30, 2023, compared with the same period in 2022.
The Lloydminster Refinery operated at or near capacity throughout the first six months of 2023. Throughput increased 10.9 thousand barrels per day from the second quarter of 2022 to 27.2 thousand barrels per day. The increase was primarily due to the completion of a planned turnaround in the second quarter of 2022. In the six months ended June 30, 2023, throughput increased 6.2 thousand barrels per day compared with the same period in 2022 to 28.0 thousand barrels per day due to the same reason discussed above.
Revenues and Gross Margin
The Upgrader processes blended heavy crude oil and bitumen into high value synthetic crude oil and low sulphur diesel. Revenues are dependent on the sales price of synthetic crude oil and diesel. Upgrading gross margin is primarily dependent on the differential between the sales price of synthetic crude oil and diesel, and the cost of heavy crude oil feedstock.
The Lloydminster Refinery processes blended heavy crude oil into asphalt and industrial products. Gross margin is largely dependent on asphalt and industrial products pricing and the cost of heavy crude oil feedstock. Sales from the Lloydminster Refinery increase during paving season, which typically runs from May through October each year.
The Upgrader and Lloydminster Refinery source crude oil feedstock from our Lloydminster thermal and Lloydminster conventional heavy oil production.
In the second quarter of 2023, revenues decreased by $882 million to $1.4 billion compared with 2022, due to the disposition of our retail fuels business in the third quarter of 2022 and lower refined product prices, partially offset by increased production. In the first half of 2023, revenues decreased by $981 million to $2.9 billion mainly due to the same factors discussed above.
In the three and six months ended June 30, 2023, synthetic crude prices fell 33 percent and 25 percent, respectively, to US$76.66 per barrel and US$77.42 per barrel, respectively, compared with 2022.
Gross margin increased $15 million to $280 million in the second quarter of 2023 compared with 2022 due to higher production from the Lloydminster Refinery and the Upgrader. The increase was offset by the disposition of the retail fuels business in the third quarter of 2022.
Gross margin increased $158 million to $695 million in the first half of 2023 compared with 2022 due to a higher upgrading differential combined with the same reasons as discussed above.
See the Specified Financial Measures Advisory of this MD&A for revenues and gross margin by asset.
Operating Expenses
Primary drivers of operating expenses in the first six months of 2023 were repairs and maintenance, workforce and energy costs. Total and per-unit operating costs decreased in the three and six months ended June 30, 2023, compared with 2022, due to planned turnarounds at the Upgrader and Lloydminster Refinery in the second quarter of 2022 as well as the disposition of our retail fuels network in the third quarter of 2022. Per-unit operating expenses apply only to operating costs and throughput at the Upgrader and Lloydminster Refinery.
DD&A
In the three and six months ended June 30, 2023, Canadian Manufacturing DD&A was $43 million and $86 million, respectively (2022 – $72 million and $122 million, respectively). The decrease is due to asset write-downs in the second quarter of 2022.
| | | | | |
| Cenovus Energy Inc. – Q2 2023 Management's Discussion and Analysis | 31 |
U.S. Manufacturing
In the second quarter of 2023, we:
•Successfully restarted the Toledo Refinery and returned the refinery to full operations in June.
•Continued ramping up the Superior Refinery in a safe and controlled manner. Work is underway to start up the FCCU.
•Achieved crude utilization of 93 percent at the Lima Refinery (2022 – 91 percent).
•Generated Operating Margin of $27 million, a decrease of $766 million compared with 2022, largely due to a lower per-barrel refining margin. The decrease was partially offset by higher crude oil unit throughput and higher refined product output.
•Completed planned turnarounds at the Wood River and Borger refineries that commenced in the first quarter.
•Invested capital of $153 million focused primarily on the Superior Refinery rebuild and sustaining capital spend at the Lima Refinery.
Financial Results
| | | | | | | | | | | | | | | | | | | | | | | | | |
| Three Months Ended June 30, | | Six Months Ended June 30, | | |
| ($ millions) | 2023 | | 2022 | | 2023 | | 2022 | | |
| Revenues | 6,198 | | | 8,474 | | | 12,058 | | | 14,983 | | | |
| Purchased Product | 5,498 | | | 6,939 | | | 10,627 | | | 12,421 | | | |
Gross Margin (1) | 700 | | | 1,535 | | | 1,431 | | | 2,562 | | | |
| Expenses | | | | | | | | | |
| | | | | | | | | |
| Operating | 679 | | | 655 | | | 1,281 | | | 1,149 | | | |
| Realized (Gain) Loss on Risk Management | (6) | | | 87 | | | (5) | | | 197 | | | |
| Operating Margin | 27 | | | 793 | | | 155 | | | 1,216 | | | |
Unrealized (Gain) Loss on Risk Management | (5) | | | (41) | | | (11) | | | (14) | | | |
| Depreciation, Depletion and Amortization | 102 | | | 83 | | | 205 | | | 168 | | | |
| Segment Income (Loss) | (70) | | | 751 | | | (39) | | | 1,062 | | | |
(1)Non-GAAP financial measure. See the Specified Financial Measures Advisory of this MD&A.
| | | | | |
| Cenovus Energy Inc. – Q2 2023 Management's Discussion and Analysis | 32 |
Select Operating Results
| | | | | | | | | | | | | | | | | | | | | | | | | |
| Three Months Ended June 30, | | Six Months Ended June 30, | | |
| 2023 | | 2022 | | 2023 | | 2022 | | |
Crude Oil Unit Throughput Capacity (1) (Mbbls/d) | 635.2 | | | 502.5 | | | 635.2 | | | 502.5 | | | |
Lima Refinery (2) | 178.7 | | | 175.0 | | | 178.7 | | | 175.0 | | | |
Toledo Refinery (3) | 160.0 | | | 80.0 | | | 160.0 | | | 80.0 | | | |
| Superior Refinery | 49.0 | | | — | | | 49.0 | | | — | | | |
Wood River and Borger Refineries (4) | 247.5 | | | 247.5 | | | 247.5 | | | 247.5 | | | |
| | | | | | | | | |
Crude Oil Unit Throughput (Mbbls/d) | 442.5 | | | 376.4 | | | 401.1 | | | 390.0 | | | |
| Lima Refinery | 165.8 | | | 159.4 | | | 166.5 | | | 147.8 | | | |
Toledo Refinery (3) | 48.3 | | | 27.0 | | | 24.3 | | | 49.5 | | | |
| Superior Refinery | 25.2 | | | — | | | 12.8 | | | — | | | |
Wood River and Borger Refineries (4) | 203.2 | | | 190.0 | | | 197.5 | | | 192.7 | | | |
| | | | | | | | | |
Crude Oil Unit Throughput by Product (Mbbls/d) | | | | | | | | | |
| Heavy Crude Oil | 155.1 | | | 106.5 | | | 161.5 | | | 130.1 | | | |
| Light and Medium Crude Oil | 287.4 | | | 269.9 | | | 239.6 | | | 259.9 | | | |
| | | | | | | | | |
Crude Utilization (5) (percent) | 70 | | | 75 | | | 69 | | | 78 | | | |
| | | | | | | | | |
Total Production (Mbbls/d) | 463.6 | | | 391.2 | | | 419.4 | | | 408.9 | | | |
| Gasoline | 199.4 | | | 175.1 | | | 193.2 | | | 196.7 | | | |
| Distillates | 160.9 | | | 144.4 | | | 149.6 | | | 146.4 | | | |
| Other | 103.3 | | | 71.7 | | | 76.6 | | | 65.8 | | | |
| | | | | | | | | |
| | | | | | | | | |
| | | | | | | | | |
Refining Margin (6) (7) ($/bbl) | 17.40 | | | 44.81 | | | 19.72 | | | 36.29 | | | |
Unit Operating Expense (7) (8) ($/bbl) | 16.88 | | | 19.13 | | | 17.66 | | | 16.28 | | | |
(1)Based on crude oil name plate capacity.
(2)The name plate capacity at the Lima Refinery increased effective January 1, 2023.
(3)Cenovus acquired the remaining 50 percent interest in the Toledo Refinery from bp on February 28, 2023.
(4)Represents Cenovus’s 50 percent interest in the non-operated Wood River and Borger refinery operations.
(5)The Superior Refinery’s crude oil unit throughput and crude oil unit throughput capacity are included in the crude utilization calculation effective April 1, 2023. The Toledo Refinery’s crude utilization includes a weighted average crude oil capacity with full ownership acquired on February 28, 2023.
(6)Contains a non-GAAP financial measure. See the Specified Financial Measures Advisory of this MD&A.
(7)Based on crude oil unit throughput volumes and operating results at Wood River, Borger, Lima, Toledo and Superior refineries.
(8)Specified financial measure. See the Specified Financial Measures Advisory of this MD&A.
In the second quarter of 2023, U.S. Manufacturing crude oil unit throughput increased 66.1 thousand barrels per day from 2022 to 442.5 thousand barrels per day due to:
•Strong performance at the Lima Refinery, achieving crude utilization of 93 percent during the three months ended June 30, 2023 (2022 – 91 percent). Throughput increased 6.4 thousand barrels per day quarter-over-quarter. The increase was primarily due to outages on the pipeline that supplies feedstock to the refinery in 2022.
•The Toledo Acquisition on February 28, 2023, and the full restart of the refinery. The small capacity crude oil unit restarted in April and the large capacity unit restarted in June. Crude utilization in the three months ended June 30, 2023, was 30 percent (2022 – 34 percent). Crude oil unit throughput increased 21.3 thousand barrels per day to 48.3 thousand barrels per day in the second quarter of 2023 compared with the second quarter of 2022. The increase in throughput was due to the Toledo Acquisition and was offset by lower rates as the refinery ramped up. In the second quarter of 2022, Toledo commenced a significant planned turnaround that was completed in the third quarter of 2022.
•The ramp-up of the Superior Refinery continued through the second quarter. Throughput averaged 25.2 thousand barrels per day in the second quarter of 2023 after we started circulating hydrocarbons in February and introduced crude oil in mid-March 2023. Refined product output averaged 25.1 thousand barrels per day in the second quarter.
•An increase in throughput at the Wood River Refinery. In the second quarter of 2023, the second phase of the planned turnaround was completed and the refinery returned to full operations in May. A significant planned turnaround was completed at the refinery in 2022. The 2022 turnaround had a larger scope, leading to a larger throughput impact in 2022.
•The Borger Refinery safely completed a planned turnaround in late April. The refinery experienced temporary unplanned outages in the second quarter that impacted throughput.
•Combined crude utilization for the Wood River and Borger refineries in the three months ended June 30, 2023, was 82 percent (2022 – 77 percent).
| | | | | |
| Cenovus Energy Inc. – Q2 2023 Management's Discussion and Analysis | 33 |
In the first half of 2023, U.S. Manufacturing crude oil unit throughput increased 11.1 thousand barrels per day for the same reasons discussed above as well as:
•Lima Refinery’s performance, achieving crude utilization of 93 percent during the six months ended June 30 (2022 – 84 percent). Throughput increased 18.7 thousand barrels per day compared with the first half of 2022. The increase was due to the 2022 supply issue discussed above, temporary unplanned equipment outages in 2022 and operating the refinery at reduced rates in early 2022 due to low market crack spreads.
•Increased throughput at the Wood River Refinery primarily due to the decision in the first quarter of 2022 to operate at reduced rates to optimize margins as market conditions dictated. The refinery also began a turnaround in the first quarter of 2022 that extended into the second quarter of 2022.
•The Borger Refinery had unplanned outages in the fourth quarter of 2022 and returned to full rates in January 2023. The refinery’s planned turnaround commenced in March 2023, further impacting throughput.
•Combined crude utilization for the Wood River and Borger refineries for the six months ended June 30, 2023, was 80 percent (2022 – 78 percent).
Revenues and Gross Margin
Market crack spreads do not precisely mirror the configuration and product output of our refineries; however, they are used as a general market indicator. While market crack spreads are an indicator of margin from processing crude oil into refined products, the refining realized crack spread, which is the gross margin on a per-barrel basis, is affected by many factors. These factors include the type of crude oil feedstock processed, refinery configuration and the proportion of gasoline, distillates and secondary product output, the time lag between the purchase of crude oil feedstock and the processing of that crude oil through the refineries, and the cost of feedstock. Processing less expensive crude relative to WTI creates a feedstock cost advantage. Our feedstock costs are valued on a FIFO accounting basis. In the three and six months ended June 30, 2023, the Chicago 3-2-1 crack spread decreased 39 percent and 11 percent, respectively, to US$28.57 per barrel and US$28.72 per barrel, respectively, compared with 2022. In the three and six months ended June 30, 2023, the Group 3 crack spread declined 28 percent and 2 percent, respectively, to US$31.78 per barrel and US$31.56 per barrel, respectively, compared with 2022.
Revenues decreased $2.3 billion and $2.9 billion, respectively, in the three and six months ended June 30, 2023, compared with 2022. The decrease was primarily due to lower refined product pricing, partially offset by higher refined product output. In addition, sales volumes lagged production volumes due to inventory build-up at the Lima Refinery and a normal time lag expected on the ramp up of the Toledo and Superior refineries. Gasoline prices fell in the three and six months ended June 30, 2023, averaging US$102.32 and US$101.07, respectively, compared with US$149.05 and US$129.11, respectively, during the same time period of 2022. Diesel prices also fell, averaging US$102.40 and US$108.90, respectively, compared with US$166.62 and US$143.11, respectively, in 2022.
Gross margin decreased $835 million and $1.1 billion in the three and six months ended June 30, 2023, respectively, compared with 2022. The decreases were primarily due to lower market crack spreads, partially offset by higher refined product production.
In the three and six months ended June 30, 2023, we incurred realized risk management gains of $6 million and $5 million, respectively (2022 – losses of $87 million and $197 million, respectively), due to the settlement of benchmark prices relative to our risk management contract prices. In the three and six months ended June 30, 2023, we recorded unrealized risk management gains of $5 million and $11 million, respectively (2022 – $41 million and $14 million, respectively), on our crude oil and refined products financial instruments primarily due to changes to forward benchmark pricing relative to our risk management contract prices that related to future periods.
Operating Expenses
Primary drivers of operating expenses in the first six months of 2023 were repairs and maintenance and workforce.
Operating expenses increased $24 million in the three months ended June 30, 2023, compared with the same period in 2022 due to:
•The Toledo Acquisition on February 28, 2023.
•Increased maintenance activities combined with commissioning and ramp-up costs at the Superior Refinery.
•Turnaround preparation costs at the Lima Refinery.
•Increased workforce costs.
The increases were partially offset by turnaround costs at the Toledo Refinery in the second quarter of 2022, combined with lower turnaround costs at the Wood River Refinery compared with 2022 due to a significantly smaller scope of work in 2023.
| | | | | |
| Cenovus Energy Inc. – Q2 2023 Management's Discussion and Analysis | 34 |
Operating expenses increased by $132 million in the six months ended June 30, 2023, compared with the same period in 2022 due to:
•The Toledo Acquisition on February 28, 2023.
•Increased repairs, maintenance and services costs primarily related to start up activities at the Superior Refinery and maintenance projects at the Lima Refinery.
•Increased workforce costs.
The increase was partially offset by turnaround costs at the Toledo Refinery in the second quarter of 2022, combined with lower turnaround costs at the Wood River and Borger refineries due to a significantly smaller scope of work in 2023 compared with 2022.
Per-unit operating expenses decreased $2.25 per barrel in the three months ended June 30, 2023, compared with the same period in 2022, primarily due to higher throughput. Per-unit operating expenses increased $1.38 per barrel in the six months ended June 30, 2023, compared with the same period in 2022, due to the same factors as discussed above, partially offset by higher throughput.
DD&A
U.S. Manufacturing DD&A in the three and six months ended June 30, 2023, was $102 million and $205 million, respectively, compared with $83 million and $168 million, respectively, in 2022.
CORPORATE AND ELIMINATIONS
Risk Management
In the three and six months ended June 30, 2023, our corporate risk management activities resulted in:
•A realized risk management gain of $4 million and a realized risk management loss of $3 million, respectively (2022 – losses of $14 million and $7 million, respectively), related to foreign exchange risk management contracts.
•Unrealized risk management losses of $21 million and $51 million, respectively (2022 – gains of $16 million and losses of $2 million, respectively), related to renewable power contracts and foreign exchange risk management contracts.
Financial Results
| | | | | | | | | | | | | | | | | | | | | | | | | |
| Three Months Ended June 30, | | Six Months Ended June 30, | | |
| ($ millions) | 2023 | | 2022 | | 2023 | | 2022 | | |
General and Administrative | 167 | | | 218 | | | 325 | | | 417 | | | |
| Finance Costs | 193 | | | 195 | | | 387 | | | 424 | | | |
| Interest Income | (34) | | | (8) | | | (67) | | | (23) | | | |
| Integration and Transaction Costs | 17 | | | 28 | | | 37 | | | 52 | | | |
| Foreign Exchange (Gain) Loss, Net | (119) | | | 192 | | | (126) | | | 90 | | | |
| Revaluation (Gain) Loss | — | | | — | | | 33 | | | — | | | |
| Re-measurement of Contingent Payments | (1) | | | 15 | | | 16 | | | 251 | | | |
| (Gain) Loss on Divestiture of Assets | (10) | | | (62) | | | (11) | | | (304) | | | |
Other (Income) Loss, Net | (14) | | | (38) | | | (20) | | | (408) | | | |
| 199 | | | 540 | | | 574 | | | 499 | | | |
General and Administrative
Primary drivers of our general and administrative expenses in the first half of 2023 were workforce costs, information technology costs and employee long-term incentive costs. General and administrative expenses decreased in the three and six months ended June 30, 2023, compared with 2022, primarily due to lower long-term incentive costs. Our closing common share price was $22.50 per share on June 30, 2023, a decrease from March 31, 2023, and December 31, 2022. Our closing common share price was $24.49 per share on June 30, 2022, an increase from March 31, 2022, and December 31, 2021.
Finance Costs
Finance costs were consistent in the second quarter of 2023 compared with 2022, primarily due to debt purchases in 2022 that lowered the Company’s average long-term debt, offset by a $32 million discount on the redemption of long-term debt in 2022. Year-to-date, finance costs decreased compared with 2022 due to the same reasons impacting the second quarter of 2023. Refer to the Liquidity and Capital Resources section of this MD&A for further details on long-term debt.
The weighted average interest rate on outstanding debt for the year ended June 30, 2023, was 4.7 percent (2022 – 4.7 percent).
| | | | | |
| Cenovus Energy Inc. – Q2 2023 Management's Discussion and Analysis | 35 |
Integration and Transaction Costs
In the three and six months ended June 30, 2023, we incurred integration and transaction costs of $17 million and $37 million, respectively, associated with the Toledo Acquisition.
We incurred integration and transaction costs of $28 million and $52 million in the three and six months ended June 30, 2022, respectively, related to the integration of Cenovus and Husky Energy Inc.
Foreign Exchange
| | | | | | | | | | | | | | | | | | | | | | | | | |
| Three Months Ended June 30, | | Six Months Ended June 30, | | |
| ($ millions) | 2023 | | 2022 | | 2023 | | 2022 | | |
| Unrealized Foreign Exchange (Gain) Loss | (172) | | | 260 | | | (158) | | | 121 | | | |
| Realized Foreign Exchange (Gain) Loss | 53 | | | (68) | | | 32 | | | (31) | | | |
| (119) | | | 192 | | | (126) | | | 90 | | | |
In the second quarter of 2023 and on a year-to-date basis, unrealized foreign exchange gains were mainly related to the translation of U.S. denominated debt. Realized foreign exchange losses in both periods in 2023 were mainly related to the settlement of intercompany debt and working capital.Revaluation (Gain) Loss
Cenovus recognized a revaluation loss of $33 million in the first quarter of 2023 as part of the Toledo Acquisition. As required by IFRS 3, “Business Combinations”, when an acquirer achieves control in stages, the previously held interest is remeasured to fair value at the acquisition date with any gain or loss recognized in net earnings (loss). Refer to Note 4 of the interim Consolidated Financial Statements for further details.
Re-measurement of Contingent Payments
In connection with the Sunrise Acquisition, Cenovus agreed to make quarterly variable payments to bp Canada for up to eight quarters subsequent to August 31, 2022, if the average WCS crude oil price in a quarter exceeds $52.00 per barrel. The maximum cumulative variable payment is $600 million. Refer to Note 16 of the interim Consolidated Financial Statements for further details.
The contingent payment is accounted for as a financial option with changes in fair value recognized in net earnings (loss). As at June 30, 2023, the fair value of the variable payment was estimated to be $320 million, resulting in non-cash re-measurement gains of $1 million and losses of $16 million in the three and six months ended June 30, 2023, respectively.
In the six months ended June 30, 2023, we paid $134 million under this agreement. The next quarterly payment of $73 million is due July 28, 2023. The payments are recognized in cash from (used in) investing activities with no impact to Adjusted Funds Flow. As of June 30, 2023, average estimated WCS forward pricing for the remaining term of the variable payment is approximately $74.46 per barrel. As at June 30, 2023, the maximum payment over the remaining term of the contract is $393 million.
The contingent payment associated with the transaction with ConocoPhillips related to its 50 percent interest in the FCCL Partnership ended on May 17, 2022, and the final payment was made in July 2022. For the three and six months ended June 30, 2022, non-cash remeasurement losses of $15 million and $251 million, respectively, were recorded.
(Gain) Loss on Divestiture of Assets
We had no material divestitures in the first six months of 2023. In the first six months of 2022, we recognized a gain on divestiture of assets of $304 million, primarily due to the sale of our Tucker and Wembley assets and the divestiture of 12.5 percent of our interest in the White Rose field and satellite extensions.
Other (Income) Loss, Net
In the three and six months ended June 30, 2023, other income decreased by $24 million and $388 million, respectively, compared with the same periods in 2022. Other income in the first half of 2022 was primarily due to insurance proceeds related to the 2018 incidents at the Superior Refinery and in the Atlantic region.
DD&A
DD&A for the three and six months ended June 30, 2023, was $19 million and $40 million, respectively (2022 – $29 million and $59 million, respectively).
| | | | | |
| Cenovus Energy Inc. – Q2 2023 Management's Discussion and Analysis | 36 |
Income Taxes
| | | | | | | | | | | | | | | | | | | | | | | | | |
| Three Months Ended June 30, | | Six Months Ended June 30, | | |
| ($ millions) | 2023 | | 2022 | | 2023 | | 2022 | | |
| Current Tax | | | | | | | | | |
| Canada | 199 | | | 570 | | | 457 | | | 937 | | | |
| United States | (17) | | | 261 | | | — | | | 281 | | | |
| Asia Pacific | 38 | | | 71 | | | 84 | | | 109 | | | |
| Other International | 6 | | | — | | | 12 | | | — | | | |
| Total Current Tax Expense (Recovery) | 226 | | | 902 | | | 553 | | | 1,327 | | | |
| Deferred Tax Expense (Recovery) | (44) | | | (61) | | | (414) | | | 57 | | | |
| 182 | | | 841 | | | 139 | | | 1,384 | | | |
For the six months ended June 30, 2023, the Company recorded a current tax expense related to operations in all jurisdictions that Cenovus operates, other than the U.S. The decline in current income tax expense in 2023 is due to lower earnings compared with 2022. The effective tax rate in the first six months of 2023 was 8.5 percent (2022 – 25.4 percent). The lower rate is primarily due to the deferred tax recovery recorded in the first quarter of 2023 related to the step-up in the tax basis on the Toledo Acquisition and unrealized foreign exchange gains compared with losses in 2022. Excluding the impact of the Toledo Acquisition and amounts related to foreign exchange, the effective tax rate in 2023 would be consistent with the statutory rate.
Tax interpretations, regulations and legislation in the various jurisdictions in which Cenovus and its subsidiaries operate are subject to change. We believe that our provision for income taxes is adequate. There are usually a number of tax matters under review and with consideration of the current economic environment, income taxes are subject to measurement uncertainty. The timing of the recognition of income and deductions for the purpose of current tax expense is determined by relevant tax legislation.
Our effective tax rate is a function of the relationship between total tax expense (recovery) and the amount of earnings (loss) before income taxes. The effective tax rate differs from the statutory tax rate for many reasons, including but not limited to, different tax rates between jurisdictions, non-taxable foreign exchange (gains) losses, adjustments for changes in tax rates and other legislation.
| | |
|
| LIQUIDITY AND CAPITAL RESOURCES |
Our capital allocation framework enables us to strengthen our balance sheet, provide flexibility in both high and low commodity price environments, and deliver value to shareholders. The framework enables a shift to paying out a higher percentage of Excess Free Funds Flow to common shareholders, with lower leverage and a lower risk profile.
We expect to fund our near-term cash requirements through cash from operating activities, the prudent use of our cash and cash equivalents, and other sources of liquidity. This includes draws on our committed credit facility, draws on our uncommitted demand facilities and other corporate and financial opportunities which provide timely access to funding to supplement cash flow. We remain committed to maintaining our investment grade credit ratings at S&P Global Ratings, Moody’s Investor Service, DBRS Morningstar and Fitch Ratings. The cost and availability of borrowing and access to sources of liquidity and capital are dependent on current credit ratings and market conditions.
| | | | | | | | | | | | | | | | | | | | | | | | | |
| Three Months Ended June 30, | | Six Months Ended June 30, | | |
($ millions) | 2023 | | 2022 | | 2023 | | 2022 | | |
| Cash From (Used In) | | | | | | | | | |
| Operating Activities | 1,990 | | | 2,979 | | | 1,704 | | | 4,344 | | | |
| Investing Activities | (1,159) | | | (791) | | | (2,914) | | | (454) | | | |
| Net Cash Provided (Used) Before Financing Activities | 831 | | | 2,188 | | | (1,210) | | | 3,890 | | | |
| Financing Activities | (639) | | | (2,011) | | | (1,074) | | | (3,104) | | | |
| Effect of Foreign Exchange on Cash and Cash Equivalents | (74) | | | 117 | | | (73) | | | 34 | | | |
| Increase (Decrease) in Cash and Cash Equivalents | 118 | | | 294 | | | (2,357) | | | 820 | | | |
| | | | | | | | | |
| As at ($ millions) | | | | | June 30, 2023 | | December 31, 2022 | | |
Cash and Cash Equivalents | | | | | 2,167 | | | 4,524 | | | |
Total Debt | | | | | 8,534 | | | 8,806 | | | |
| | | | | |
| Cenovus Energy Inc. – Q2 2023 Management's Discussion and Analysis | 37 |
Cash From (Used in) Operating Activities
For the three months ended June 30, 2023, cash from operating activities was $2.0 billion compared with $3.0 billion in the same period in 2022. The change was mainly due to lower Operating Margin.
For the six months ended June 30, 2023, cash from operating activities was $1.7 billion (2022 – $4.3 billion). The significant decrease is primarily due to lower Operating Margin and a working capital build driven largely by the payment of the December 31, 2022, income tax liability of $1.2 billion in the first quarter of 2023.
Cash From (Used in) Investing Activities
Cash used in investing activities increased in the second quarter of 2023 compared with 2022 primarily due to higher capital spending and lower proceeds from divestitures. In addition, non-cash working capital decreased in 2023 primarily due to the Sunrise contingent payment and insurance proceeds in 2022 related to the Superior incident.
Cash used in investing activities increased significantly in the first half of 2023 compared with 2022 largely due to lower proceeds from divestitures than in 2022, higher capital spending and the closing of the Toledo Acquisition in the first quarter of 2023. In addition, non-cash working capital decreased in 2023 primarily due to the reasons discussed above.
Cash From (Used in) Financing Activities
Cash used in financing activities decreased in the three and six months ended June 30, 2023, compared with the same period in 2022. The decreases were mainly due to the payment of $750 million in the second quarter of 2022 to purchase the full amount of our 3.55 percent unsecured notes as well as payment of US$402 million in the first quarter of 2022 to purchase the remaining balances on two of our unsecured notes with principal amounts aggregating US$384 million. The decreases were also caused by higher common share purchases through our NCIB in 2022, partially offset by an increase in common share base dividend payments in 2023 and fewer common shares exercised under our stock option plans. In the first half of 2023, we paid base dividends of $0.245 per share on our common shares (2022 – $0.140 per share).
In the three and six months ended June 30, 2023, we repaid $nil and $115 million, respectively, in short-term borrowings (2022 – $63 million and $79 million, respectively).
Working Capital
Excluding the contingent payment, our adjusted working capital at June 30, 2023, was $3.6 billion (December 31, 2022 – $4.7 billion).
We anticipate that we will continue to meet our payment obligations as they come due.
Adjusted Funds Flow, Free Funds Flow and Excess Free Funds Flow
Adjusted Funds Flow is a non-GAAP financial measure commonly used in the oil and gas industry to assist in measuring a company’s ability to finance its capital programs and meet its financial obligations. Free Funds Flow is a non-GAAP financial measure used to assist in measuring the available funds Cenovus has after financing its capital programs. Excess Free Funds Flow is a non-GAAP financial measure used by the Company to deliver shareholder returns and allocate capital according to our shareholder returns plan.
| | | | | |
| Cenovus Energy Inc. – Q2 2023 Management's Discussion and Analysis | 38 |
| | | | | | | | | | | | | | | | | | | | | | | | | |
| Three Months Ended June 30, | | Six Months Ended June 30, |
| ($ millions) | 2023 | | 2022 | | 2023 | | 2022 | | |
| Cash From (Used in) Operating Activities | 1,990 | | | 2,979 | | | 1,704 | | | 4,344 | | | |
| (Add) Deduct: | | | | | | | | | |
Settlement of Decommissioning Liabilities | (41) | | | (27) | | | (89) | | | (46) | | | |
| Net Change in Non-Cash Working Capital | 132 | | | (92) | | | (1,501) | | | (1,291) | | | |
| Adjusted Funds Flow | 1,899 | | | 3,098 | | | 3,294 | | | 5,681 | | | |
Capital Investment | 1,002 | | | 822 | | | 2,103 | | 1,568 | | | |
Free Funds Flow | 897 | | | 2,276 | | | 1,191 | | | 4,113 | | | |
| Add (Deduct): | | | | | | | | | |
| Base Dividends Paid on Common Shares | (265) | | | (207) | | | | | | | |
| Dividends Paid on Preferred Shares | (9) | | | (8) | | | | | | | |
Settlement of Decommissioning Liabilities | (41) | | | (27) | | | | | | | |
| Principal Repayment of Leases | (76) | | | (75) | | | | | | | |
| Acquisitions, Net of Cash Acquired | (4) | | | (1) | | | | | | | |
| Proceeds From Divestitures | 3 | | | 112 | | | | | | | |
| Payment on Divestiture of Assets | — | | | (50) | | | | | | | |
Excess Free Funds Flow | 505 | | | 2,020 | | | | | | | |
Returns to Shareholders Target
Maintaining a strong balance sheet with the resilience to withstand price volatility and capitalize on opportunities throughout the commodity price cycle is a key element of Cenovus’s capital allocation framework. We have set an ultimate Net Debt target of $4 billion, which serves as our floor on Net Debt. Our $4 billion Net Debt Target represents a Net Debt to Adjusted Funds Flow Ratio Target of approximately 1.0 times at the bottom of the commodity pricing cycle. We plan to return incremental value to shareholders through share buybacks and/or variable dividends as follows:
•When Net Debt is less than $9 billion and above $4 billion at quarter-end, we will target to allocate 50 percent of the Excess Free Funds Flow achieved in the following quarter to shareholder returns, while still continuing to deleverage the balance sheet until we reach the Net Debt Target of $4 billion.
•When Net Debt is above $9 billion at quarter-end, we plan to allocate all of the following quarter’s Excess Free Funds Flow to deleveraging the balance sheet.
•When Net Debt is at the $4 billion floor at quarter-end, we will target to return 100 percent of the following quarter’s Excess Free Funds Flow to shareholder returns.
Share buybacks are executed opportunistically, driven by return thresholds. Where the value of share buybacks in a quarter is less than the targeted value of returns, the remainder will be delivered through a variable dividend payable for that quarter, if the remainder is greater than $50 million. Where the value of share buybacks in a quarter is greater than or equal to the targeted value of returns, no variable dividend will be paid for that quarter.
No variable dividend was declared for the second quarter of 2023.
On March 31, 2023, our long-term debt was $8.7 billion, resulting in a Net Debt position of $6.6 billion. Therefore, our returns to shareholders target for the three months ended June 30, 2023, was 50 percent of the current quarter’s Excess Free Funds Flow of $505 million. As such, our target return was $253 million. We returned $310 million to our shareholders through share buybacks. We met our returns to shareholders target through share buybacks, as such no variable dividend was declared for the third quarter.
| | | | | | | | | | | | | |
| Three Months Ended |
| ($ millions) | June 30, 2023 | | March 31, 2023 | | |
| Excess Free Funds Flow | 505 | | | (499) | | | |
| | | | | |
| Target Return | 253 | | | — | | | |
Less: Purchase of Common Shares Under NCIBs | (310) | | | (40) | | | |
| Amount Available for Variable Dividend | — | | | — | | | |
At June 30, 2023, our Net Debt position was $6.4 billion and as a result our returns to shareholders target for the three months ended September 30, 2023, will be 50 percent of the third quarter’s Excess Free Funds Flow.
| | | | | |
| Cenovus Energy Inc. – Q2 2023 Management's Discussion and Analysis | 39 |
Short-Term Borrowings
As at June 30, 2023, $nil was drawn on the WRB uncommitted demand facilities (December 31, 2022 – the Company’s proportionate share was US$85 million (C$115 million)). There were no direct borrowings on our uncommitted demand facilities as at June 30, 2023, or December 31, 2022.
Long-Term Debt and Total Debt
Total debt and long-term debt as at June 30, 2023, was $8.5 billion. As at December 31, 2022, total debt was $8.8 billion which included $8.7 billion of long-term debt. The change in long‑term debt was primarily due to unrealized foreign exchange gains on the translation of our U.S. dollar debt.
As at June 30, 2023, we were in compliance with all of the terms of our debt agreements.
Available Sources of Liquidity
The following sources of liquidity are available as at June 30, 2023:
| | | | | | | | | | | | | | | | | |
| ($ millions) | Maturity | | | | | | | | Amount Available |
| Cash and Cash Equivalents | n/a | | | | | | | | 2,167 | |
Committed Credit Facility (1) | | | | | | | | | |
Revolving Credit Facility – Tranche A | November 10, 2026 | | | | | | | | 3,700 | |
Revolving Credit Facility – Tranche B | November 10, 2025 | | | | | | | | 1,800 | |
| Uncommitted Demand Facilities | | | | | | | | | |
Cenovus Energy Inc. (2) | n/a | | | | | | | | 1,061 | |
WRB (3) | n/a | | | | | | | | 298 | |
(1)No amounts were drawn on the committed credit facility as at June 30, 2023 (December 31, 2022 - $nil).
(2)Our uncommitted demand facilities include $1.9 billion, of which $1.4 billion may be drawn for general purposes, or the full amount can be available to issue letters of credit. As at June 30, 2023, there were outstanding letters of credit aggregating to $390 million (December 31, 2022 – $490 million) and no direct borrowings.
(3)Represents Cenovus's proportionate share of US$225 million available to cover short-term working capital requirements. As at June 30, 2023, $nil of this capacity was drawn (December 31, 2022 – US$85 million (C$115 million)).
Under the terms of our committed credit facility, we are required to maintain a debt to capitalization ratio, as defined in the debt agreements, not to exceed 65 percent. We are well below this limit.
U.S. Dollar Denominated Unsecured Notes and Canadian Dollar Unsecured Notes
At June 30, 2023, the total outstanding principal amount of U.S. dollar denominated unsecured notes was US$4.8 billion, or C$6.4 billion (December 31, 2022 – US$4.8 billion, or C$6.5 billion) and the total outstanding principal amount of Canadian dollar denominated unsecured notes was $2.0 billion (December 31, 2022 – $2.0 billion).
Base Shelf Prospectus
We have a base shelf prospectus that allows us to offer, from time to time, up to US$5.0 billion, or the equivalent in other currencies, of debt securities, common shares, preferred shares, subscription receipts, warrants, share purchase contracts and units in Canada, the U.S. and elsewhere, where permitted by law. The base shelf prospectus will expire in November 2023. As at June 30, 2023, US$4.7 billion remained available under the base shelf prospectus for permitted offerings (December 31, 2022 – US$4.7 billion). Offerings under the base shelf prospectus are subject to market availability.
Financial Metrics
We monitor our capital structure and financing requirements using the Net Debt to Capitalization Ratio, Net Debt to Adjusted Funds Flow Ratio and Net Debt to Adjusted EBITDA Ratio. Refer to Note 14 of the interim Consolidated Financial Statements for further details.
We define Net Debt as short-term borrowings and the current and long-term portions of long-term debt, net of cash and cash equivalents and short-term investments. The components of the ratios include Capitalization, Adjusted Funds Flow and Adjusted EBITDA. We define Capitalization as Net Debt plus Shareholders Equity. We define Adjusted Funds Flow, as used in the Net Debt to Adjusted Funds Flow Ratio, as cash from (used in) operating activities, less settlement of decommissioning liabilities and net change in operating non-cash working capital calculated on a trailing twelve-month basis. We define Adjusted EBITDA, as used in the Net Debt to Adjusted EBITDA Ratio, as net earnings (loss) before finance costs, net of capitalized interest, interest income, income tax expense (recovery), DD&A, E&E asset write-downs, goodwill impairments, (income) loss from equity-accounted affiliates, unrealized (gain) loss on risk management, net foreign exchange (gain) loss, revaluation (gain) loss, re-measurement of contingent payments, (gain) loss on divestiture of assets, and net other (income) loss calculated on a trailing twelve-month basis. These ratios are used to steward our overall debt position and are measures of our overall financial strength.
| | | | | |
| Cenovus Energy Inc. – Q2 2023 Management's Discussion and Analysis | 40 |
| | | | | | | | | | | | | |
| As at | June 30, 2023 | | December 31, 2022 | | |
Net Debt to Capitalization Ratio (percent) | 19 | | | 13 | | | |
Net Debt to Adjusted Funds Flow Ratio (times) | 0.7 | | 0.4 | | |
Net Debt to Adjusted EBITDA Ratio (times) | 0.7 | | 0.3 | | |
Our Net Debt to Adjusted Funds Flow Ratio and our Net Debt to Adjusted EBITDA Ratio Targets are approximately 1.0 times at the bottom of the commodity price cycle, which we believe is approximately US$45 per barrel WTI. This ratio may fluctuate periodically outside the range due to factors such as persistently high or low commodity prices. Our objective is to maintain a high level of capital discipline and manage our capital structure to help ensure we have sufficient liquidity through all stages of the economic cycle. To ensure financial resilience, we may, among other actions, adjust capital and operating spending, draw down on our credit facilities or repay existing debt, adjust dividends paid to shareholders, purchase our common shares for cancellation, issue new debt, or issue new shares.
Our Net Debt to Capitalization Ratio as at June 30, 2023, increased compared with December 31, 2022, primarily due to higher Net Debt.
Our Net Debt to Adjusted Funds Flow Ratio and Net Debt to Adjusted EBITDA Ratio as at June 30, 2023, increased compared with December 31, 2022, as a result of higher Net Debt and lower Operating Margin. See the Operating and Financial Results section of this MD&A for more information on Operating Margin and Net Debt.
Share Capital and Stock-Based Compensation Plans
Our common shares and Cenovus Warrants are listed on the Toronto Stock Exchange (“TSX”) and New York Stock Exchange (“NYSE”). Our cumulative redeemable preferred shares series 1, 2, 3, 5 and 7 are listed on the TSX.
As at June 30, 2023, there were approximately 1,896.5 million common shares outstanding (December 31, 2022 – 1,909.2 million common shares) and 36 million preferred shares outstanding (December 31, 2022 – 36 million preferred shares). Refer to Note 19 of the interim Consolidated Financial Statements for further details.
Cenovus has an NCIB program to purchase up to 136.7 million common shares during the period from November 9, 2022, to November 8, 2023. In the first six months of 2023, Cenovus purchased and cancelled 15.6 million common shares for $350 million (2022 – 68.0 million common shares for $1.5 billion), at a volume weighted average price of $22.43 per common share (2022 – $21.89 per common share) through our NCIB program. Paid in surplus was reduced by $217 million (2022 – $907 million), representing the excess of the purchase price of the common shares over their average carrying value. As at June 30, 2023, 109.6 million common shares remain available for purchase under the NCIB, which expires on November 8, 2023.
On June 14, 2023, we purchased and cancelled 45.5 million outstanding Cenovus Warrants. The price for each warrant purchased represents a price of $22.18 per common share, less the warrant exercise price of $6.54 per common share, for a total of $711 million. We also recorded $2 million of transaction costs. This purchase represented 84 percent of Cenovus’s outstanding warrants. Under the warrant repurchase agreements, Cenovus has the option to pay the aggregate warrant purchase price through the remainder of 2023, within each quarter’s Excess Free Funds Flow, with full payment being made no later than January 5, 2024. As at June 30, 2023, no payments have been made related to the purchased warrants. As at June 30, 2023, there were approximately 8.6 million Cenovus Warrants outstanding (December 31, 2022 – 55.7 million Cenovus Warrants).
Each Cenovus Warrant entitles the holder to acquire one common share for a period of five years from the date of issue at an exercise price of $6.54 per common share. The Cenovus Warrants expire on January 1, 2026. Refer to Note 19 of the interim Consolidated Financial Statements for further details.
Refer to Note 21 of the interim Consolidated Financial Statements for further details on our stock option plans and our performance share unit, restricted share unit and deferred share unit plans.
| | | | | |
| Cenovus Energy Inc. – Q2 2023 Management's Discussion and Analysis | 41 |
Our outstanding share data is as follows:
| | | | | | | | | | | |
| As at July 24, 2023 | Units Outstanding (thousands) | | Units Exercisable (thousands) |
Common Shares | 1,896,529 | | n/a |
| Cenovus Warrants | 8,590 | | n/a |
| Series 1 First Preferred Shares | 10,740 | | n/a |
| Series 2 First Preferred Shares | 1,260 | | n/a |
| Series 3 First Preferred Shares | 10,000 | | n/a |
| Series 5 First Preferred Shares | 8,000 | | n/a |
| Series 7 First Preferred Shares | 6,000 | | n/a |
Stock Options | 16,013 | | 10,539 |
| Other Stock-Based Compensation Plans | 19,134 | | 1,679 |
Common Share Dividends
In the second quarter of 2023, we paid base dividends of $265 million or $0.140 per common share (2022 – $207 million or $0.105 per common share). In the first six months of 2023, we paid base dividends of $465 million or $0.245 per common share (2022 – $276 million or $0.140 per common share).
The Board declared a third quarter base dividend of $0.140 per common share, payable on September 29, 2023, to common shareholders of record as at September 15, 2023.
The declaration of common share dividends is at the sole discretion of the Board and is considered quarterly.
Cumulative Redeemable Preferred Share Dividends
In the three and six months ended June 30, 2023, dividends of $9 million and $27 million, respectively, were paid on the series 1, 2, 3, 5 and 7 preferred shares (2022 – $8 million and $17 million, respectively). The declaration of preferred share dividends is at the sole discretion of the Board and is considered quarterly. The Board declared a third quarter dividend on the series 1, 2, 3, 5 and 7 preferred shares of $9 million, payable on October 3, 2023, to preferred shareholders of record as at September 15, 2023.
Capital Investment Decisions
Our 2023 capital program is forecast to be between $4.0 billion and $4.5 billion, including approximately $2.8 billion of sustaining capital and between $1.2 billion to $1.7 billion of optimization and growth capital. Our Future Capital Investment is focused on disciplined capital allocation, investment plans to progress opportunities across our integrated portfolio, cost control and positioning the Company for continued growth in shareholder returns. We expect our annual upstream production to average between 775 thousand BOE per day and 795 thousand BOE per day and our downstream crude oil unit throughput average between 580 thousand barrels per day to 610 thousand barrels per day in 2023. Our guidance as updated on July 26, 2023, is available at our website at cenovus.com.
Contractual Obligations and Commitments
We have obligations for goods and services entered into in the normal course of business. Obligations that have original maturities of less than one year are excluded. For further information, see Note 26 to the interim Consolidated Financial Statements.
Our total commitments were $24.8 billion as at June 30, 2023, of which $20.2 billion are for various transportation and storage commitments and $1.4 billion are for product purchase commitments. Transportation commitments include $9.1 billion that are subject to regulatory approval or have been approved, but are not yet in service. Terms are up to 20 years subsequent to the date of commencement and should help align with the Company’s future transportation requirements.
As at June 30, 2023, our total commitments include commitments with HMLP of $2.1 billion related to long-term transportation and storage commitments.
As at June 30, 2023, outstanding letters of credit issued as security for performance under certain contracts totaled $390 million.
Legal Proceedings
We are involved in a limited number of legal claims associated with the normal course of operations. We believe that any liabilities that might arise from such matters, to the extent not provided for, are not likely to have a material effect on our interim Consolidated Financial Statements.
| | | | | |
| Cenovus Energy Inc. – Q2 2023 Management's Discussion and Analysis | 42 |
Transactions with Related Parties
Cenovus holds a 35 percent interest in HMLP. As the operator of the assets held by HMLP, we provide management services for which we recover shared service costs in accordance with our profit sharing agreement. We are also the contractor for HMLP and construct its assets on a cost recovery basis with certain restrictions. For the three and six months ended June 30, 2023, we charged HMLP $31 million and $63 million, respectively for construction and management services (three and six months ended June 30, 2022 – $29 million and $77 million, respectively).
We pay an access fee to HMLP for the use of its pipeline systems that are used by our blending business. We also pay HMLP for transportation and storage services. For the three and six months ended June 30, 2023, we incurred costs of $71 million and $138 million, respectively, for the use of HMLP’s pipeline systems, as well as transportation and storage services (three and six months ended June 30, 2022 – $64 million and $133 million, respectively).
| | |
|
| RISK MANAGEMENT AND RISK FACTORS |
For a full understanding of the risks that impact us, the following discussion should be read in conjunction with the Risk Management and Risk Factors section of our 2022 annual MD&A.
We are exposed to a number of risks through the pursuit of our strategic objectives. Some of these risks impact the energy industry as a whole and others are unique to our operations. The impact of any risk or a combination of risks may adversely affect, among other things, our business, reputation, financial condition, results of operations and cash flows, which may, without limitation, reduce or restrict our ability to pursue our strategic priorities, meet our targets or outlooks, goals, initiatives and ambitions, respond to changes in our operating environment, repurchase our shares, pay dividends to our shareholders, and fulfill our obligations (including debt servicing requirements) and may materially affect the market price of our securities.
| | |
|
| CRITICAL ACCOUNTING JUDGMENTS, ESTIMATION UNCERTAINTIES AND ACCOUNTING POLICIES |
Management is required to make estimates and assumptions, as well as use judgment in the application of accounting policies that could have a significant impact on our financial results. Actual results may differ from estimates and those differences may be material. The estimates and assumptions used are subject to updates based on experience and the application of new information. Our material accounting policies are reviewed annually by the Audit Committee of the Board. Further details on the basis of preparation and our material accounting policies can be found in the notes to the Consolidated Financial Statements for the year ended December 31, 2022.
Critical Judgments in Applying Accounting Policies and Key Sources of Estimation Uncertainty
Critical judgments are those judgments made by Management in the process of applying accounting policies that have the most significant effect on the amounts recorded in our annual and interim Consolidated Financial Statements. A full list of the critical judgments used in applying accounting policies and key sources of estimation uncertainty can be found in the notes to the Consolidated Financial Statements for the year ended December 31, 2022. There have been no changes to our critical judgments used in applying accounting policies and key sources of measurement uncertainty during the six months ended June 30, 2023.
New Accounting Standards and Interpretations Not Yet Adopted
There are new accounting standards, amendments to accounting standards and interpretations that were effective for annual periods beginning on or after January 1, 2023, but are not material to Cenovus’s operations. There were no new or amended accounting standards or interpretations issued during the six months ended June 30, 2023, that are expected to have a material impact on the Company’s interim Consolidated Financial Statements.
Management, including our President & Chief Executive Officer and Executive Vice-President & Chief Financial Officer, assessed the design and effectiveness of internal control over financial reporting (“ICFR”) and disclosure controls and procedures (“DC&P”) as at June 30, 2023. In making its assessment, Management used the Committee of Sponsoring Organizations of the Treadway Commission Framework in Internal Control – Integrated Framework (2013) to evaluate the design and effectiveness of ICFR. Based on our evaluation, Management has concluded that both ICFR and DC&P were effective as at June 30, 2023.
| | | | | |
| Cenovus Energy Inc. – Q2 2023 Management's Discussion and Analysis | 43 |
On February 28, 2023, Cenovus closed the Toledo Acquisition. As permitted by and in accordance with, National Instrument 52-109, “Certification of Disclosure in Issuers’ Annual and Interim Filings”, and guidance issued by the U.S. Securities and Exchange Commission, Management has limited the scope and design of ICFR and DC&P to exclude the controls, policies and procedures in respect of the business acquired from bp. Such scope limitation is primarily due to the time required for Management to assess the ICFR and DC&P relating to bp in a manner consistent with our other operations. Further integration will take place throughout the remainder of the year as processes and systems align.
Assets acquired from bp represented approximately one percent of Cenovus’s total assets at June 30, 2023. Revenues attributable to assets acquired from bp were less than three percent of Cenovus’s total revenues for the three and six months ended June 30, 2023. Operating expenses attributable to assets acquired from bp were approximately five percent of Cenovus’s total operating expenses for the three and six months ended June 30, 2023.
Internal control systems, no matter how well designed, have inherent limitations. Therefore, even those systems determined to be effective can provide only reasonable assurance with respect to financial statement preparation and presentation. Also, projections of any evaluation of effectiveness to future periods are subject to the risk that controls may become inadequate because of changes in conditions, or that the degree of compliance with the policies or procedures may deteriorate.
Oil and Gas Information
Barrels of Oil Equivalent – natural gas volumes have been converted to BOE on the basis of six Mcf to one bbl. BOE may be misleading, particularly if used in isolation. A conversion ratio of one bbl to six Mcf is based on an energy equivalency conversion method primarily applicable at the burner tip and does not represent value equivalency at the wellhead. Given that the value ratio based on the current price of crude oil compared with natural gas is significantly different from the energy equivalency conversion ratio of 6:1, utilizing a conversion on a 6:1 basis is not an accurate reflection of value.
Forward-looking Information
This document contains forward-looking statements and other information (collectively “forward-looking information”) about the Company’s current expectations, estimates and projections, made in light of the Company’s experience and perception of historical trends. Although the Company believes that the expectations represented by such forward-looking information are reasonable, there can be no assurance that such expectations will prove to be correct.
This forward-looking information is identified by words such as “aim”, “anticipate”, “believe”, “capacity”, “commit”, “continue”, “could”, “estimate”, “expect”, “focus”, “forecast”, “future”, “may”, “on track”, “objective”, “opportunities”, “plan”, “position”, “prioritize”, “strive”, “target”, and “will”, or similar expressions and includes suggestions of future outcomes, including, but not limited to, statements about: shareholder value and returns; cost structure; margins; safety performance; sustainability and sustainability leadership; using the Company’s integrated assets to maximize value; delivering on our strategy; GHG emissions; interest expense; infrastructure; operating and capital costs; capital investment, allocation, and structure; capital discipline; Free Funds Flow generation; resiliency; Excess Free Funds Flow allocation; balance sheet management and strength; managing capital structure; dividends of any kind; share repurchases under the NCIB; full payment of the aggregate warrant purchase price; reinvestment in the business; diversifying the portfolio; deleveraging; near-term funding requirements; meeting payment obligations; maintaining credit ratings; debt levels; Net Debt; Net Debt to Adjusted Funds Flow Ratio; Net Debt to Adjusted EBITDA Ratio; drawing on credit facilities; maintaining liquidity; flexibility; capital expenditures; production and production rates; crude oil unit throughput or throughput; consistent and reliable operations at all operated assets; operating performance; liabilities from legal proceedings; cash flow; financial results; variable payments; provision for income taxes; financial resilience; capturing value; monitoring market fundamentals; mitigating the impact of commodity differentials; plans to achieve targets for the Company’s five ESG focus areas: climate and GHG emissions, water stewardship, biodiversity, indigenous reconciliation, inclusion and diversity; the focus of our 2023 budget; business and asset integration; optimizing run rates at the Company’s refineries; ramping up production on new well pads at Foster Creek and Christina Lake; multi-year development in the conventional segment; ramp-up of the Superior Refinery and start-up of the FCCU; integration of the Toledo Refinery; integration and ramp up of the Toledo Refinery; transportation and storage commitments; progressing the West White Rose project to deliver first oil in 2026; resuming production at the Terra Nova ALE project; development wells in, and first gas production from, the MAC field in Indonesia; and the Company’s outlook for commodities and the Canadian dollar and the influences and effects on Cenovus.
Readers are cautioned not to place undue reliance on forward-looking information as the Company’s actual results may differ materially from those expressed or implied.
Developing forward-looking information involves reliance on a number of assumptions and consideration of certain risks and uncertainties, some of which are specific to the Company and others that apply to the industry generally. The factors or assumptions on which the forward-looking information is based include, but are not limited to: forecast oil and natural gas, natural gas liquids, condensate and refined products prices, light-heavy crude oil price differentials; the Company’s ability to
| | | | | |
| Cenovus Energy Inc. – Q2 2023 Management's Discussion and Analysis | 44 |
realize the anticipated benefits and anticipated cost synergies of acquisitions; the accuracy of any assessments undertaken in connection with acquisitions; forecast production and crude oil unit throughput volumes and timing thereof; projected capital investment levels, the flexibility of capital spending plans and associated sources of funding; the absence of significant adverse changes to government policies, legislation and regulations (including related to climate change), Indigenous relations, interest rates, inflation, foreign exchange rates, competitive conditions and the supply and demand for crude oil and natural gas, NGLs, condensate and refined products; the political, economic and social stability of jurisdictions in which the Company operates; the absence of significant disruption of operations, including as a result of harsh weather, natural disaster, accident, civil unrest or other similar events; the prevailing climatic conditions in the Company’s operating locations; achievement of further cost reductions and sustainability thereof; applicable royalty regimes, including expected royalty rates; future improvements in availability of product transportation capacity; increase to the Company’s share price and market capitalization over the long term; opportunities to purchase shares for cancellation at prices acceptable to the Company; the sufficiency of cash balances, internally generated cash flows, existing credit facilities, management of the Company’s asset portfolio and access to capital and insurance coverage to pursue and fund future investments, sustainability and development plans and dividends, including any increase thereto; production from the Company’s Conventional segment providing an economic hedge for the natural gas required as a fuel source at both the Company’s oil sands and refining operations; realization of expected capacity to store within the Company’s oil sands reservoirs barrels not yet produced, including that the Company will be able to time production and sales of our inventory at later dates when demand has increased, pipeline and/or storage capacity has improved and future crude oil differentials have narrowed; the WTI-WCS differential in Alberta remains largely tied to global supply factors and heavy crude processing capacity; the ability of the Company’s refining capacity, dynamic storage, existing pipeline commitments, crude-by-rail loading capacity and financial hedge transactions to partially mitigate a portion of the Company’s WCS crude oil volumes against wider differentials; the Company’s ability to produce from oil sands facilities on an unconstrained basis; estimates of quantities of oil, bitumen, natural gas and liquids from properties and other sources not currently classified as proved; the accuracy of accounting estimates and judgments; the Company’s ability to obtain necessary regulatory and partner approvals; the successful, timely and cost effective implementation of capital projects, development projects or stages thereof; the Company’s ability to meet current and future obligations; estimated abandonment and reclamation costs, including associated levies and regulations applicable thereto; the Company’s ability to obtain and retain qualified staff and equipment in a timely and cost-efficient manner; the Company’s ability to complete acquisitions and dispositions, including with desired transaction metrics and within expected timelines; the accuracy of climate scenarios and assumptions, including third party data on which the Company relies; ability to access and implement all technology and equipment necessary to achieve expected future results, including in respect of climate and GHG emissions targets and ambitions and the commercial viability and scalability of emission reduction strategies and related technology and products; collaboration with the government, Pathways Alliance and other industry organizations; alignment of realized WCS and WCS prices used to calculate the variable payment to bp Canada; market and business conditions; forecast inflation and other assumptions inherent in the Company’s 2023 guidance available on cenovus.com and as set out below; the availability of Indigenous owned or operated businesses and the Company’s ability to retain them; and other risks and uncertainties described from time to time in the filings the Company makes with securities regulatory authorities.
2023 guidance, as updated on July 26, 2023, and available on cenovus.com, assumes: Brent prices of US$76.00 per barrel, WTI prices of US$71.00 per barrel; WCS of US$54.50 per barrel; Differential WTI-WCS of US$16.50 per barrel; AECO natural gas prices of $2.90 per Mcf; Chicago 3-2-1 crack spread of US$26.50 per barrel; and an exchange rate of $0.75 US$/C$.
The risk factors and uncertainties that could cause the Company’s actual results to differ materially from the forward-looking information, include, but are not limited to: the effect of the COVID-19 pandemic, including any variants thereof, on the Company’s business, including any related restrictions, containment, and treatment measures taken by varying levels of government in the jurisdictions in which the Company operates; the success of the Company’s COVID-19 workplace policies; the Company’s ability to realize the anticipated benefits of acquisitions in a timely manner or at all; unforeseen or underestimated liabilities associated with acquisitions; risks associated with acquisitions and dispositions; the Company’s ability to access or implement some or all of the technology necessary to efficiently and effectively operate its assets and achieve expected future results including in respect of climate and GHG emissions targets and ambitions and the commercial viability and scalability of emission reduction strategies and related technology and products; the development and execution of implementing strategies to meet climate and GHG emissions targets and ambitions; the effect of new significant shareholders; volatility of and other assumptions regarding commodity prices; the duration of any market downturn; foreign exchange risk, including related to agreements denominated in foreign currencies; the Company’s continued liquidity is sufficient to sustain operations through a prolonged market downturn; WTI-WCS differential will remain largely tied to global supply factors and heavy crude processing capacity; the Company’s ability to realize the expected impacts of its capacity to store within its oil sands reservoirs barrels not yet produced, including possible inability to time production and sales at later dates when pipeline and/or storage capacity and crude oil differentials have improved; the effectiveness of the Company’s risk management program; the accuracy of cost estimates regarding commodity prices, currency and interest rates; lack of alignment of realized WCS prices and WCS prices used to recalculate the variable payment to bp Canada; product supply and demand; the accuracy of the Company’s share price and market capitalization assumptions; market competition, including from alternative energy sources; risks inherent in the Company’s marketing operations, including credit risks, exposure to counterparties and partners, including the ability and
| | | | | |
| Cenovus Energy Inc. – Q2 2023 Management's Discussion and Analysis | 45 |
willingness of such parties to satisfy contractual obligations in a timely manner; risks inherent in the operation of the Company’s crude-by-rail terminal, including health, safety and environmental risks; the Company’s ability to maintain desirable ratios of Net Debt to Adjusted EBITDA and Net Debt to Adjusted Funds Flow; the Company’s ability to access various sources of debt and equity capital, generally, and on acceptable terms; the Company’s ability to finance growth and sustaining capital expenditures; changes in credit ratings applicable to the Company or any of its securities; changes to the Company’s dividend plans; the Company’s ability to utilize tax losses in the future; the accuracy of the Company’s reserves, future production and future net revenue estimates; the accuracy of the Company’s accounting estimates and judgements; the Company’s ability to replace and expand crude oil and natural gas reserves; the costs to acquire exploration rights, undertake geological studies, appraisal drilling and project developments; potential requirements under applicable accounting standards for impairment or reversal of estimated recoverable amounts of some or all of the Company’s assets or goodwill from time to time; the Company’s ability to maintain its relationships with its partners and to successfully manage and operate its integrated operations and business; reliability of the Company’s assets including in order to meet production targets; potential disruption or unexpected technical difficulties in developing new products and manufacturing processes; the occurrence of unexpected events resulting in operational interruptions, including at facilities operated by our partners or third parties, such as blowouts, fires, explosions, railcar incidents or derailments, aviation incidents, iceberg collisions, gaseous leaks, migration of harmful substances, loss of containment, releases or spills, including releases or spills from offshore facilities and shipping vessels at terminals or hubs and as a result of pipeline or other leaks, corrosion, epidemics or pandemics, and catastrophic events, including, but not limited to, war, adverse sea conditions, extreme weather events, natural disasters, acts of activism, vandalism and terrorism, and other accidents or hazards that may occur at or during transport to or from commercial or industrial sites and other accidents or similar events; refining and marketing margins; cost escalations, including inflationary pressures on operating costs, such as labour, materials, natural gas and other energy sources used in oil sands processes and downstream operations and increased insurance deductibles or premiums; the cost and availability of equipment necessary to the Company’s operations; potential failure of products to achieve or maintain acceptance in the market; risks associated with the energy industry’s and the Company’s reputation, social license to operate and litigation related thereto; unexpected cost increases or technical difficulties in operating, constructing or modifying manufacturing or refining facilities; unexpected difficulties in producing, transporting or refining bitumen and/or crude oil into petroleum and chemical products; risks associated with technology and equipment and its application to the Company’s business, including potential cyberattacks; geo-political and other risks associated with the Company’s international operations; risks associated with climate change and the Company’s assumptions relating thereto; the timing and the costs of well and pipeline construction; the Company’s ability to access markets and to secure adequate and cost effective product transportation including sufficient pipeline, crude-by-rail, marine or alternate transportation, including to address any gaps caused by constraints in the pipeline system or storage capacity; availability of, and the Company’s ability to attract and retain, critical and diverse talent; possible failure to obtain and retain qualified leadership and personnel, and equipment in a timely and cost efficient manner; changes in labour demographics and relationships, including with any unionized workforces; unexpected abandonment and reclamation costs; changes in the regulatory frameworks, permits and approvals in any of the locations in which the Company operates or to any of the infrastructure upon which it relies; government actions or regulatory initiatives to curtail energy operations or pursue broader climate change agendas; changes to regulatory approval processes and land use designations, royalty, tax, environmental, GHG, carbon, climate change and other laws or regulations, or changes to the interpretation of such laws and regulations, as adopted or proposed, the impact thereof and the costs associated with compliance; the expected impact and timing of various accounting pronouncements, rule changes and standards on the Company’s business, its financial results and Consolidated Financial Statements; changes in general economic, market and business conditions; the impact of production agreements among OPEC and non-OPEC members; the political, social and economic conditions in the jurisdictions in which the Company operates or supplies; the status of the Company’s relationships with the communities in which it operates, including with Indigenous communities; the occurrence of unexpected events such as protests, pandemics, war, terrorist threats and the instability resulting therefrom; and risks associated with existing and potential future lawsuits, shareholder proposals and regulatory actions against the Company. In addition, there are risks that the effect of actions taken by us in implementing targets, commitments and ambitions for ESG focus areas may have a negative impact on our existing business, growth plans and future results from operations.
Readers are cautioned that the foregoing lists are not exhaustive and are made as at the date hereof. Events or circumstances could cause our actual results to differ materially from those estimated or projected and expressed in, or implied by, the forward-looking information. For a full discussion of the Company’s material risk factors, see Risk Management and Risk Factors in the Company’s most recently filed Annual MD&A, and the risk factors described in other documents the Company files from time to time with securities regulatory authorities in Canada, available on SEDAR at sedar.com, and with the U.S. Securities and Exchange Commission on EDGAR at sec.gov, and on the Company’s website at cenovus.com.
Information on or connected to the Company’s website at cenovus.com does not form part of this MD&A unless expressly incorporated by reference herein.
| | | | | |
| Cenovus Energy Inc. – Q2 2023 Management's Discussion and Analysis | 46 |
ABBREVIATIONS
The following abbreviations and definitions have been used in this document:
| | | | | | | | | | | | | | | | | |
| Crude Oil | Natural Gas | Other |
| | | | | |
| bbl | barrel | Mcf | thousand cubic feet | BOE | barrel of oil equivalent |
| mbbls/d | thousand barrels per day | MMcf | million cubic feet | MBOE | thousand barrels of oil
equivalent |
| WTI | West Texas Intermediate | MMcf/d | million cubic feet per day | MBOE/d | thousand barrels of oil
equivalent per day |
| WCS | Western Canadian Select | | | OPEC | Organization of Petroleum
Exporting Countries |
| | | | OPEC+ | OPEC and a group of 10
non-OPEC members |
| | | | GHG | Greenhouse Gas |
| | | | AECO | Alberta Energy Company |
| | | | NCIB | Normal Course Issuer Bid |
| | | | NYMEX | New York Mercantile Exchange |
| | | | SAGD | steam-assisted gravity drainage |
| | | | | |
| Cenovus Energy Inc. – Q2 2023 Management's Discussion and Analysis | 47 |
SPECIFIED FINANCIAL MEASURES
Certain financial measures in this document do not have a standardized meaning as prescribed by IFRS including Operating Margin, Operating Margin for the Upstream or Downstream operations, Operating Margin by asset, Adjusted Funds Flow, Adjusted Funds Flow Per Share – Basic, Adjusted Funds Flow Per Share – Diluted, Free Funds Flow, Excess Free Funds Flow, Gross Margin, Refining Margin, Unit Operating Expense, Per Unit DD&A and Netbacks (including the total netbacks per BOE).
These measures may not be comparable to similar measures presented by other issuers. These measures have been described and presented in order to provide shareholders and potential investors with additional measures for analyzing our ability to generate funds to finance our operations and information regarding our liquidity. This additional information should not be considered in isolation or as a substitute for measures prepared in accordance with IFRS. The definition and reconciliation, if applicable, of each specified financial measure is presented in this Advisory and may also be presented in the Operating and Financial Results or Liquidity and Capital Resources sections of this MD&A. Refer to the Specified Financial Measures Advisory of our 2022 annual MD&A for reconciliations of Operating Margin for the Upstream or Downstream segment, Operating Margin, Adjusted Funds Flow, Free Funds Flow, Excess Free Funds Flow for quarters in 2022 and 2021 not found below.
Operating Margin
Operating Margin and Operating Margin by asset are non-GAAP financial measures, and Operating Margin for the Upstream or Downstream segment are specified financial measures. These are used to provide a consistent measure of the cash generating performance of our operations and assets for comparability of our underlying financial performance between periods. Operating Margin is defined as revenues less purchased product, transportation and blending expenses, operating expenses, plus realized gains less realized losses on risk management activities. Items within the Corporate and Eliminations segment are excluded from the calculation of Operating Margin.
| | | | | | | | | | | | | | | | | | | | | | | | | | | | | | | | | | | | | | | | | | | | | | |
| Three Months Ended June 30, | | | | | | | | | | | |
| 2023 | | 2022 | | 2023 | | 2022 | | 2023 | | 2022 | | | | | | | | | | | |
| ($ millions) | Upstream (1) | | Downstream (1) | | Total | | | | | | | | | | | |
| Revenues | | | | | | | | | | | | | | | | | | | | | | |
Gross Sales | 7,399 | | 11,685 | | 7,561 | | 10,719 | | 14,960 | | 22,404 | | | | | | | | | | | |
Less: Royalties | 637 | | 1,582 | | — | | — | | 637 | | 1,582 | | | | | | | | | | | |
| 6,762 | | 10,103 | | 7,561 | | 10,719 | | 14,323 | | 20,822 | | | | | | | | | | | |
| Expenses | | | | | | | | | | | | | | | | | | | | | | |
Purchased Product | 885 | | 1,461 | | 6,581 | | 8,919 | | 7,466 | | 10,380 | | | | | | | | | | | |
Transportation and Blending | 2,750 | | 3,238 | | — | | — | | 2,750 | | 3,238 | | | | | | | | | | | |
Operating | 883 | | 1,010 | | 843 | | 866 | | 1,726 | | 1,876 | | | | | | | | | | | |
| Realized (Gain) Loss on Risk Management | (13) | | 563 | | (6) | | 87 | | (19) | | 650 | | | | | | | | | | | |
| Operating Margin | 2,257 | | 3,831 | | 143 | | 847 | | 2,400 | | 4,678 | | | | | | | | | | | |
(1)Found in Note 1 of the interim Consolidated Financial Statements.
| | | | | | | | | | | | | | | | | | | | | | | | | | | | | | | | | | | | | | | | | | | | | | |
| Six Months Ended June 30, | | | | | | | | | | | |
| 2023 | | 2022 | | 2023 | | 2022 | | 2023 | | 2022 | | | | | | | | | | | |
| ($ millions) | Upstream (1) | | Downstream (1) | | Total | | | | | | | | | | | |
| Revenues | | | | | | | | | | | | | | | | | | | | | | |
Gross Sales | 14,814 | | 22,582 | | 14,929 | | 18,835 | | 29,743 | | 41,417 | | | | | | | | | | | |
Less: Royalties | 1,233 | | 2,767 | | — | | — | | 1,233 | | 2,767 | | | | | | | | | | | |
| 13,581 | | 19,815 | | 14,929 | | 18,835 | | 28,510 | | 38,650 | | | | | | | | | | | |
| Expenses | | | | | | | | | | | | | | | | | | | | | | |
Purchased Product | 1,954 | | 3,279 | | 12,803 | | 15,736 | | 14,757 | | 19,015 | | | | | | | | | | | |
Transportation and Blending | 5,744 | | 6,432 | | — | | — | | 5,744 | | 6,432 | | | | | | | | | | | |
Operating | 1,912 | | 1,919 | | 1,597 | | 1,511 | | 3,509 | | 3,430 | | | | | | | | | | | |
| Realized (Gain) Loss on Risk Management | 3 | | 1,434 | | (5) | | 197 | | (2) | | 1,631 | | | | | | | | | | | |
| Operating Margin | 3,968 | | 6,751 | | 534 | | 1,391 | | 4,502 | | 8,142 | | | | | | | | | | | |
(1)Found in Note 1 of the interim Consolidated Financial Statements.
| | | | | |
| Cenovus Energy Inc. – Q2 2023 Management's Discussion and Analysis | 48 |
Operating Margin by Asset
| | | | | | | | | | | | | | | | | | | | | | | | | | | | | | | | | | | |
| Three Months Ended June 30, 2023 | | Six Months Ended June 30, 2023 |
| ($ millions) | Atlantic | | Asia Pacific | | Offshore (1) | | Atlantic | | Asia Pacific | | Offshore (1) |
| Revenues | | | | | | | | | | | |
| Gross Sales | 5 | | 223 | | 228 | | 154 | | 547 | | 701 |
Less: Royalties | 1 | | 12 | | 13 | | 9 | | 30 | | 39 |
| 4 | | 211 | | 215 | | 145 | | 517 | | 662 |
| Expenses | | | | | | | | | | | |
Transportation and Blending | 4 | | — | | 4 | | 9 | | — | | 9 |
Operating | 26 | | 37 | | 63 | | 143 | | 62 | | 205 |
| Operating Margin | (26) | | 174 | | 148 | | (7) | | 455 | | 448 |
(1)Found in Note 1 of the interim Consolidated Financial Statements.
| | | | | | | | | | | | | | | | | | | | | | | | | | | | | | | | | | | |
| Three Months Ended June 30, 2022 | | Six Months Ended June 30, 2022 |
| ($ millions) | Atlantic | | Asia Pacific | | Offshore (1) | | Atlantic | | Asia Pacific | | Offshore (1) |
| Revenues | | | | | | | | | | | |
| Gross Sales | 207 | | 351 | | 558 | | 379 | | 746 | | 1,125 |
Less: Royalties | (16) | | 18 | | 2 | | (6) | | 40 | | 34 |
| 223 | | 333 | | 556 | | 385 | | 706 | | 1,091 |
| Expenses | | | | | | | | | | | |
Transportation and Blending | 4 | | — | | 4 | | 8 | | — | | 8 |
Operating | 47 | | 29 | | 76 | | 93 | | 56 | | 149 |
| Operating Margin | 172 | | 304 | | 476 | | 284 | | 650 | | 934 |
(1)Found in Note 1 of the interim Consolidated Financial Statements.
Adjusted Funds Flow, Free Funds Flow and Excess Free Funds Flow
Adjusted Funds Flow is a non-GAAP financial measure commonly used in the oil and gas industry to assist in measuring a company’s ability to finance its capital programs and meet its financial obligations, in total and on a per-share basis. Adjusted Funds Flow is defined as cash from (used in) operating activities excluding settlement of decommissioning liabilities and net change in non-cash working capital. Non-cash working capital is composed of accounts receivable and accrued revenues, income tax receivable, inventories (excluding non-cash inventory write-downs and reversals), accounts payable and accrued liabilities and income tax payable. Adjusted Funds Flow Per Share – Basic is defined as Adjusted Funds Flow divided by the basic weighted average number of shares. Adjusted Funds Flow Per Share – Diluted is defined as Adjusted Funds Flow divided by the diluted weighted average number of shares.
Free Funds Flow is a non-GAAP financial measure used to assist in measuring the available funds the Company has after financing its capital programs. Free Funds Flow is defined as cash from (used in) operating activities excluding settlement of decommissioning liabilities and net change in non-cash working capital minus capital investment.
Excess Free Funds Flow is a non-GAAP financial measure used by the Company to deliver shareholder returns and allocate capital according to our shareholder returns and capital allocation framework. Excess Free Funds Flow is defined as Free Funds Flow minus base dividends paid on common shares, dividends paid on preferred shares, other uses of cash (including settlement of decommissioning liabilities and principal repayment of leases), and acquisition costs, plus proceeds from or payments related to divestitures.
| | | | | |
| Cenovus Energy Inc. – Q2 2023 Management's Discussion and Analysis | 49 |
| | | | | | | | | | | | | | | | | | | | | | | |
| Three Months Ended June 30, | | Six Months Ended June 30, |
| ($ millions) | 2023 | | 2022 | | 2023 | | 2022 |
| Cash From (Used in) Operating Activities | 1,990 | | | 2,979 | | | 1,704 | | | 4,344 | |
| (Add) Deduct: | | | | | | | |
Settlement of Decommissioning Liabilities | (41) | | | (27) | | | (89) | | | (46) | |
Net Change in Non-Cash Working Capital | 132 | | | (92) | | | (1,501) | | | (1,291) | |
Adjusted Funds Flow | 1,899 | | | 3,098 | | | 3,294 | | | 5,681 | |
| Capital Investment | 1,002 | | | 822 | | | 2,103 | | | 1,568 | |
Free Funds Flow | 897 | | | 2,276 | | | 1,191 | | | 4,113 | |
| Add (Deduct): | | | | | | | |
| Base Dividends Paid on Common Shares | (265) | | | (207) | | | | | |
| Dividends Paid on Preferred Shares | (9) | | | (8) | | | | | |
Settlement of Decommissioning Liabilities | (41) | | | (27) | | | | | |
| Principal Repayment of Leases | (76) | | | (75) | | | | | |
| Acquisitions, Net of Cash Acquired | (4) | | | (1) | | | | | |
| Proceeds From Divestitures | 3 | | | 112 | | | | | |
| Payment on Divestiture of Assets | — | | | (50) | | | | | |
Excess Free Funds Flow | 505 | | | 2,020 | | | | | |
Gross Margin, Refining Margin and Unit Operating Expense
Gross Margin and Refining Margin are non-GAAP financial measures, or contain a non-GAAP financial measure, used to evaluate the performance of our downstream operations. We define Gross Margin as revenues less purchased product. We define Refining Margin as Gross Margin divided by barrels of crude oil unit throughput. Unit Operating Expenses are specified financial measures used to evaluate the performance of our upstream and downstream operations. We define Unit Operating Expense as operating expenses divided by barrels of crude oil unit throughput in our downstream operations.
Canadian Manufacturing
| | | | | | | | | | | | | | | | | | | | | | | | | | | | | |
| Three Months Ended June 30, 2023 |
| Basis of Refining Margin Calculation | | | | |
| ($ millions) | Lloydminster Upgrader | | Lloydminster Refinery | | Lloydminster Upgrader and Lloydminster Refinery Total | | Other (1) | | Total Canadian Manufacturing (2) |
| Revenues | 1,041 | | 226 | | 1,267 | | 96 | | 1,363 |
| Purchased Product | 867 | | 152 | | 1,019 | | 64 | | 1,083 |
| Gross Margin | 174 | | 74 | | 248 | | 32 | | 280 |
| | | | | | | | | |
| Operating Statistics | | | | |
| Lloydminster Upgrader | | Lloydminster Refinery | | Lloydminster Upgrader and Lloydminster Refinery Total | | | | |
Heavy Crude Oil Unit Throughput (Mbbls/d) | 68.1 | | 27.2 | | 95.3 | | | | |
| | | | | | | | | |
Refining Margin ($/bbl) | 27.66 | | 30.14 | | 28.36 | | | | |
(1)Includes ethanol operations and crude-by-rail operations.
(2)These amounts, excluding gross margin, are found in Note 1 of the interim Consolidated Financial Statements.
| | | | | |
| Cenovus Energy Inc. – Q2 2023 Management's Discussion and Analysis | 50 |
| | | | | | | | | | | | | | | | | | | | | | | | | | | | | |
| Three Months Ended June 30, 2022 |
| Basis of Refining Margin Calculation | | | | |
| ($ millions) | Lloydminster Upgrader | | Lloydminster Refinery | | Lloydminster Upgrader and Lloydminster Refinery Total | | Other (1) | | Total Canadian Manufacturing (2) |
| Revenues | 1,162 | | 243 | | 1,405 | | 840 | | 2,245 |
| Purchased Product | 1,012 | | 210 | | 1,222 | | 758 | | 1,980 |
| Gross Margin | 150 | | 33 | | 183 | | 82 | | 265 |
| | | | | | | | | |
| Operating Statistics | | | | |
| Lloydminster Upgrader | | Lloydminster Refinery | | Lloydminster Upgrader and Lloydminster Refinery Total | | | | |
Heavy Crude Oil Unit Throughput (Mbbls/d) | 64.6 | | 16.3 | | 80.9 | | | | |
| | | | | | | | | |
Refining Margin ($/bbl) | 25.54 | | 22.22 | | 24.87 | | | | |
(1)Includes ethanol operations, crude-by-rail operations, and the retail and commercial fuels business.
(2)These amounts, excluding gross margin, are found in Note 1 of the interim Consolidated Financial Statements.
| | | | | | | | | | | | | | | | | | | | | | | | | | | | | |
| Six Months Ended June 30, 2023 |
| Basis of Refining Margin Calculation | | | | |
| ($ millions) | Lloydminster Upgrader | | Lloydminster Refinery | | Lloydminster Upgrader and Lloydminster Refinery Total | | Other (1) | | Total Canadian Manufacturing (2) |
| Revenues | 2,254 | | 414 | | 2,668 | | 203 | | 2,871 |
| Purchased Product | 1,774 | | 261 | | 2,035 | | 141 | | 2,176 |
| Gross Margin | 480 | | 153 | | 633 | | 62 | | 695 |
| | | | | | | | | |
| Operating Statistics | | | | |
| Lloydminster Upgrader | | Lloydminster Refinery | | Lloydminster Upgrader and Lloydminster Refinery Total | | | | |
Heavy Crude Oil Unit Throughput (Mbbls/d) | 69.0 | | 28.0 | | 97.0 | | | | |
| | | | | | | | | |
Refining Margin ($/bbl) | 38.22 | | 30.28 | | 35.93 | | | | |
(1)Includes ethanol operations and crude-by-rail operations.
(2)These amounts, excluding gross margin, are found in Note 1 of the interim Consolidated Financial Statements.
| | | | | | | | | | | | | | | | | | | | | | | | | | | | | |
| Six Months Ended June 30, 2022 |
| Basis of Refining Margin Calculation | | | | |
| ($ millions) | Lloydminster Upgrader | | Lloydminster Refinery | | Lloydminster Upgrader and Lloydminster Refinery Total | | Other (1) | | Total Canadian Manufacturing (2) |
| Revenues | 1,919 | | 429 | | 2,348 | | 1,504 | | 3,852 |
| Purchased Product | 1,597 | | 353 | | 1,950 | | 1,365 | | 3,315 |
| Gross Margin | 322 | | 76 | | 398 | | 139 | | 537 |
| | | | | | | | | |
| Operating Statistics | | | | |
| Lloydminster Upgrader | | Lloydminster Refinery | | Lloydminster Upgrader and Lloydminster Refinery Total | | | | |
Heavy Crude Oil Unit Throughput (Mbbls/d) | 67.6 | | 21.8 | | 89.4 | | | | |
| | | | | | | | | |
Refining Margin ($/bbl) | 26.29 | | 19.17 | | 24.55 | | | | |
(1)Includes ethanol operations, crude-by-rail operations, and the retail and commercial fuels business.
(2)These amounts, excluding gross margin, are found in Note 1 of the interim Consolidated Financial Statements.
| | | | | |
| Cenovus Energy Inc. – Q2 2023 Management's Discussion and Analysis | 51 |
U.S. Manufacturing
| | | | | | | | | | | | | | | | | | | | | | | |
| Three Months Ended June 30, | | Six Months Ended June 30, |
| ($ millions) | 2023 | | 2022 | | 2023 | | 2022 |
Revenues (1) | 6,198 | | | 8,474 | | | 12,058 | | | 14,983 | |
Purchased Product (1) | 5,498 | | | 6,939 | | | 10,627 | | | 12,421 | |
| Gross Margin | 700 | | | 1,535 | | | 1,431 | | | 2,562 | |
| | | | | | | |
Crude Oil Unit Throughput (Mbbls/d) | 442.5 | | | 376.4 | | | 401.1 | | | 390.0 | |
| | | | | | | |
Refining Margin ($/bbl) | 17.40 | | | 44.81 | | | 19.72 | | | 36.29 | |
(1)Found in Note 1 of the interim Consolidated Financial Statements.
Per Unit DD&A
Per Unit DD&A is a specified financial measure used to measure DD&A on a per-unit basis in our upstream segments. We define Per Unit DD&A as the sum of upstream depletion on producing crude oil and natural gas properties and the associated asset retirement costs divided by sales volumes.
| | | | | |
| Cenovus Energy Inc. – Q2 2023 Management's Discussion and Analysis | 52 |
Netback Reconciliations
Netback is a non-GAAP financial measure commonly used in the oil and gas industry to assist in measuring operating performance and is also presented on a per-unit basis. Our Netback calculation is aligned with the definition found in the Canadian Oil and Gas Evaluation Handbook. Netbacks per BOE reflect our margin on a per-barrel of oil equivalent basis. Netback is defined as gross sales less royalties, transportation and blending and operating expenses, and Netback per BOE is divided by sales volumes. Netbacks do not reflect non-cash write-downs or reversals of product inventory until it is realized when the product is sold and exclude risk management activities. The sales price, transportation and blending expense, and sales volumes exclude the impact of purchased condensate. Condensate is blended with crude oil to transport it to market.
The following tables provide a reconciliation of the items comprising Netbacks, and Netbacks per BOE to Operating Margin found in our interim Consolidated Financial Statements.
Upstream Financial Results
| | | | | | | | | | | | | | | | | | | | | | | | | | | | | |
| | | Adjustments | | Basis of Netback Calculation |
Three Months Ended June 30, 2023 ($ millions) | Total Upstream (1) | | Condensate | Third-Party Sourced | Internal Consumption (2) | Equity Adjustment (3) | Other (4) | | Total Upstream |
| Gross Sales | 7,399 | | | (2,244) | | (822) | | (133) | | 79 | | (123) | | | 4,156 | |
| Royalties | 637 | | | — | | — | | — | | 18 | | 1 | | | 656 | |
Purchased Product | 885 | | | — | | (822) | | — | | — | | (63) | | | — | |
| Transportation and Blending | 2,750 | | | (2,244) | | — | | — | | — | | (33) | | | 473 | |
| Operating | 883 | | | — | | — | | (133) | | 10 | | (4) | | | 756 | |
| Netback | 2,244 | | | — | | — | | — | | 51 | | (24) | | | 2,271 | |
| Realized (Gain) Loss on Risk Management | (13) | | | — | | — | | — | | — | | 1 | | | (12) | |
| Operating Margin | 2,257 | | | — | | — | | — | | 51 | | (25) | | | 2,283 | |
| | | | | | | | | | | | | | | | | | | | | | | | | | | | | |
| | | Adjustments | | Basis of Netback Calculation |
Three Months Ended June 30, 2022 ($ millions) | Total Upstream (1) | | Condensate | Third-Party Sourced | Internal Consumption (2) | Equity Adjustment (3) | Other (4) | | Total Upstream |
Gross Sales | 11,685 | | | (2,801) | | (1,365) | | (347) | | 70 | | (117) | | | 7,125 | |
| Royalties | 1,582 | | | — | | — | | — | | 36 | | (5) | | | 1,613 | |
| Purchased Product | 1,461 | | | — | | (1,365) | | — | | — | | (96) | | | — | |
| Transportation and Blending | 3,238 | | | (2,801) | | — | | — | | — | | (12) | | | 425 | |
| Operating | 1,010 | | | — | | — | | (347) | | 8 | | (10) | | | 661 | |
| Netback | 4,394 | | | — | | — | | — | | 26 | | 6 | | | 4,426 | |
| Realized (Gain) Loss on Risk Management | 563 | | | — | | (4) | | — | | — | | — | | | 559 | |
| Operating Margin | 3,831 | | | — | | 4 | | — | | 26 | | 6 | | | 3,867 | |
(1)These amounts, excluding Netback, are found in Note 1 of the interim Consolidated Financial Statements.
(2)Represents natural gas volumes produced by the Conventional segment used for internal consumption by the Oil Sands segment.
(3)Revenues and expenses related to the HCML joint venture are accounted for using the equity method in the consolidated financial statements.
(4)Other includes construction, transportation and blending and third-party processing margin.
| | | | | |
| Cenovus Energy Inc. – Q2 2023 Management's Discussion and Analysis | 53 |
| | | | | | | | | | | | | | | | | | | | | | | | | | | | | |
| | | Adjustments | | Basis of Netback Calculation |
Six Months Ended June 30, 2023 ($ millions) | Total Upstream (1) | | Condensate | Third-Party Sourced | Internal Consumption (2) | Equity Adjustment (3) | Other (4) | | Total Upstream |
| Gross Sales | 14,814 | | | (4,689) | | (1,830) | | (320) | | 152 | | (230) | | | 7,897 | |
| Royalties | 1,233 | | | — | | — | | — | | 41 | | 1 | | | 1,275 | |
Purchased Product | 1,954 | | | — | | (1,830) | | — | | — | | (124) | | | — | |
| Transportation and Blending | 5,744 | | | (4,689) | | — | | — | | — | | (59) | | | 996 | |
| Operating | 1,912 | | | — | | — | | (320) | | 20 | | (47) | | | 1,565 | |
| Netback | 3,971 | | | — | | — | | — | | 91 | | (1) | | | 4,061 | |
| Realized (Gain) Loss on Risk Management | 3 | | | — | | — | | — | | — | | — | | | 3 | |
| Operating Margin | 3,968 | | | — | | — | | — | | 91 | | (1) | | | 4,058 | |
| | | | | | | | | | | | | | | | | | | | | | | | | | | | | |
| | | Adjustments | | Basis of Netback Calculation |
Six Months Ended June 30, 2022 ($ millions) | Total Upstream (1) | | Condensate | Third-Party Sourced | Internal Consumption (2) | Equity Adjustment (3) | Other (4) | | Total Upstream |
Gross Sales | 22,582 | | | (5,559) | | (3,115) | | (586) | | 131 | | (193) | | | 13,260 | |
| Royalties | 2,767 | | | — | | — | | — | | 64 | | (5) | | | 2,826 | |
| Purchased Product | 3,279 | | | — | | (3,115) | | — | | — | | (164) | | | — | |
| Transportation and Blending | 6,432 | | | (5,559) | | — | | — | | — | | (11) | | | 862 | |
| Operating | 1,919 | | | — | | — | | (586) | | 15 | | (31) | | | 1,317 | |
| Netback | 8,185 | | | — | | — | | — | | 52 | | 18 | | | 8,255 | |
| Realized (Gain) Loss on Risk Management | 1,434 | | | — | | (8) | | — | | — | | — | | | 1,426 | |
| Operating Margin | 6,751 | | | — | | 8 | | — | | 52 | | 18 | | | 6,829 | |
(1)These amounts, excluding Netback, are found in Note 1 of the interim Consolidated Financial Statements.
(2)Represents natural gas volumes produced by the Conventional segment used for internal consumption by the Oil Sands segment.
(3)Revenues and expenses related to the HCML joint venture are accounted for using the equity method in the consolidated financial statements.
(4)Other includes construction, transportation and blending and third-party processing margin.
| | | | | |
| Cenovus Energy Inc. – Q2 2023 Management's Discussion and Analysis | 54 |
Oil Sands
| | | | | | | | | | | | | | | | | | | | | | | | | | | | | | | | |
| Basis of Netback Calculation |
Three Months Ended June 30, 2023 ($ millions) | Foster Creek | Christina Lake | Sunrise | Other Oil Sands (1) | | Total Bitumen and Heavy Oil | | Natural Gas | | Total Oil Sands |
| Gross Sales | 1,205 | | 1,398 | | 304 | | 827 | | | 3,734 | | | 2 | | | 3,736 | |
| Royalties | 219 | | 314 | | 14 | | 71 | | | 618 | | | 2 | | | 620 | |
| Purchased Product | — | | — | | — | | — | | | — | | | — | | | — | |
| Transportation and Blending | 205 | | 124 | | 54 | | 40 | | | 423 | | | — | | | 423 | |
| Operating | 195 | | 170 | | 75 | | 227 | | | 667 | | | 2 | | | 669 | |
| Netback | 586 | | 790 | | 161 | | 489 | | | 2,026 | | | (2) | | | 2,024 | |
| Realized (Gain) Loss on Risk Management | | | | | | | | | | (8) | |
| Operating Margin | | | | | | | | | | 2,032 | |
| | | | | | | | | | | | | | | | | | | | | | | |
| Basis of Netback Calculation | Adjustments | | |
Three Months Ended June 30, 2023 ($ millions) | Total Oil Sands | | Condensate | Third-party Sourced | Other (2) | | Total Oil Sands (3) |
| Gross Sales | 3,736 | | | 2,244 | | 470 | | 106 | | | 6,556 | |
| Royalties | 620 | | | — | | — | | — | | | 620 | |
| Purchased Product | — | | | — | | 470 | | 63 | | | 533 | |
| Transportation and Blending | 423 | | | 2,244 | | — | | 33 | | | 2,700 | |
| Operating | 669 | | | — | | — | | 7 | | | 676 | |
| Netback | 2,024 | | | — | | — | | 3 | | | 2,027 | |
| Realized (Gain) Loss on Risk Management | (8) | | | — | | — | | (1) | | | (9) | |
| Operating Margin | 2,032 | | | — | | — | | 4 | | | 2,036 | |
| | | | | | | | | | | | | | | | | | | | | | | | | | | | | | | | |
| Basis of Netback Calculation |
Three Months Ended June 30, 2022 ($ millions) | Foster Creek | Christina Lake | Sunrise | Other Oil Sands (1) | | Total Bitumen and Heavy Oil | | Natural Gas | | Total Oil Sands |
| Gross Sales | 2,135 | | 2,419 | | 278 | | 1,317 | | | 6,149 | | | 6 | | | 6,155 | |
| Royalties | 625 | | 722 | | 17 | | 121 | | | 1,485 | | | 1 | | | 1,486 | |
| Purchased Product | — | | — | | — | | — | | | — | | | — | | | — | |
| Transportation and Blending | 182 | | 143 | | 27 | | 34 | | | 386 | | | — | | | 386 | |
| Operating | 250 | | 249 | | 45 | | 253 | | | 797 | | | 7 | | | 804 | |
| Netback | 1,078 | | 1,305 | | 189 | | 909 | | | 3,481 | | | (2) | | | 3,479 | |
| Realized (Gain) Loss on Risk Management | | | | | | | | | | 559 | |
| Operating Margin | | | | | | | | | | 2,920 | |
| | | | | | | | | | | | | | | | | | | | | | | |
| Basis of Netback Calculation | | Adjustments | | |
Three Months Ended June 30, 2022 ($ millions) | Total Oil Sands | | Condensate | Third-party Sourced | Other (2) | | Total Oil Sands (3) |
Gross Sales | 6,155 | | | 2,801 | | 975 | | 117 | | | 10,048 | |
| Royalties | 1,486 | | | — | | — | | 5 | | | 1,491 | |
Purchased Product | — | | | — | | 975 | | 96 | | | 1,071 | |
| Transportation and Blending | 386 | | | 2,801 | | — | | 13 | | | 3,200 | |
| Operating | 804 | | | — | | — | | 2 | | | 806 | |
| Netback | 3,479 | | | — | | — | | 1 | | | 3,480 | |
| Realized (Gain) Loss on Risk Management | 559 | | | — | | — | | — | | | 559 | |
| Operating Margin | 2,920 | | | — | | — | | 1 | | | 2,921 | |
(1)Includes Lloydminster thermal and Lloydminster conventional heavy oil assets.
(2)Other includes construction, transportation and blending margin.
(3)These amounts, excluding Netback, are found in Note 1 of the interim Consolidated Financial Statements.
| | | | | |
| Cenovus Energy Inc. – Q2 2023 Management's Discussion and Analysis | 55 |
| | | | | | | | | | | | | | | | | | | | | | | | | | | | | | | | |
| Basis of Netback Calculation |
Six Months Ended June 30, 2023 ($ millions) | Foster Creek | Christina Lake | Sunrise | Other Oil Sands (1) | | Total Bitumen and Heavy Oil | | Natural Gas | | Total Oil Sands |
| Gross Sales | 2,237 | | 2,465 | | 485 | | 1,432 | | | 6,619 | | | 5 | | | 6,624 | |
| Royalties | 408 | | 587 | | 20 | | 118 | | | 1,133 | | | 3 | | | 1,136 | |
| Purchased Product | — | | — | | — | | — | | | — | | | — | | | — | |
| Transportation and Blending | 427 | | 289 | | 99 | | 78 | | | 893 | | | — | | | 893 | |
| Operating | 410 | | 365 | | 154 | | 463 | | | 1,392 | | | 6 | | | 1,398 | |
| Netback | 992 | | 1,224 | | 212 | | 773 | | | 3,201 | | | (4) | | | 3,197 | |
| Realized (Gain) Loss on Risk Management | | | | | | | | | | (1) | |
| Operating Margin | | | | | | | | | | 3,198 | |
| | | | | | | | | | | | | | | | | | | | | | | |
| Basis of Netback Calculation | Adjustments | | |
Six Months Ended June 30, 2023 ($ millions) | Total Oil Sands | | Condensate | Third-party Sourced | Other (2) | | Total Oil Sands (3) |
| Gross Sales | 6,624 | | | 4,689 | | 968 | | 186 | | | 12,467 | |
| Royalties | 1,136 | | | — | | — | | — | | | 1,136 | |
| Purchased Product | — | | | — | | 968 | | 124 | | | 1,092 | |
| Transportation and Blending | 893 | | | 4,689 | | — | | 59 | | | 5,641 | |
| Operating | 1,398 | | | — | | — | | 15 | | | 1,413 | |
| Netback | 3,197 | | | — | | — | | (12) | | | 3,185 | |
| Realized (Gain) Loss on Risk Management | (1) | | | — | | — | | — | | | (1) | |
| Operating Margin | 3,198 | | | — | | — | | (12) | | | 3,186 | |
| | | | | | | | | | | | | | | | | | | | | | | | | | | | | | | | |
| Basis of Netback Calculation |
Six Months Ended June 30, 2022 ($ millions) | Foster Creek | Christina Lake | Sunrise | Other Oil Sands (1) | | Total Bitumen and Heavy Oil | | Natural Gas | | Total Oil Sands |
| Gross Sales | 3,955 | | 4,651 | | 510 | | 2,293 | | | 11,409 | | | 10 | | | 11,419 | |
| Royalties | 1,013 | | 1,306 | | 28 | | 220 | | | 2,567 | | | 1 | | | 2,568 | |
| Purchased Product | — | | — | | — | | — | | | — | | | — | | | — | |
| Transportation and Blending | 360 | | 294 | | 57 | | 72 | | | 783 | | | — | | | 783 | |
| Operating | 452 | | 468 | | 84 | | 474 | | | 1,478 | | | 13 | | | 1,491 | |
| Netback | 2,130 | | 2,583 | | 341 | | 1,527 | | | 6,581 | | | (4) | | | 6,577 | |
| Realized (Gain) Loss on Risk Management | | | | | | | | | | 1,426 | |
| Operating Margin | | | | | | | | | | 5,151 | |
| | | | | | | | | | | | | | | | | | | | | | | |
| Basis of Netback Calculation | | Adjustments | | |
Six Months Ended June 30, 2022 ($ millions) | Total Oil Sands | | Condensate | Third-party Sourced | Other (2) | | Total Oil Sands (3) |
Gross Sales | 11,419 | | | 5,559 | | 2,119 | | 169 | | | 19,266 | |
| Royalties | 2,568 | | | — | | — | | 5 | | | 2,573 | |
Purchased Product | — | | | — | | 2,119 | | 164 | | | 2,283 | |
| Transportation and Blending | 783 | | | 5,559 | | — | | 14 | | | 6,356 | |
| Operating | 1,491 | | | — | | — | | 17 | | | 1,508 | |
| Netback | 6,577 | | | — | | — | | (31) | | | 6,546 | |
| Realized (Gain) Loss on Risk Management | 1,426 | | | — | | — | | — | | | 1,426 | |
| Operating Margin | 5,151 | | | — | | — | | (31) | | | 5,120 | |
(1)Includes Lloydminster thermal and Lloydminster conventional heavy oil assets.
(2)Other includes construction, transportation and blending margin.
(3)These amounts, excluding Netback, are found in Note 1 of the interim Consolidated Financial Statements.
| | | | | |
| Cenovus Energy Inc. – Q2 2023 Management's Discussion and Analysis | 56 |
Conventional
| | | | | | | | | | | | | | | | | | | | |
| Basis of Netback Calculation | | Adjustments | | |
Three Months Ended June 30, 2023 ($ millions) | Conventional | | Third-party Sourced | Other (1) | | Conventional (2) |
| Gross Sales | 246 | | | 352 | | 17 | | | 615 | |
| Royalties | 5 | | | — | | (1) | | | 4 | |
| Purchased Product | — | | | 352 | | — | | | 352 | |
| Transportation and Blending | 46 | | | — | | — | | | 46 | |
| Operating | 139 | | | — | | 5 | | | 144 | |
| Netback | 56 | | | — | | 13 | | | 69 | |
| Realized (Gain) Loss on Risk Management | (4) | | | — | | — | | | (4) | |
| Operating Margin | 60 | | | — | | 13 | | | 73 | |
| | | | | | |
| | | | | | | | | | | | | | | | | | | | |
| Basis of Netback Calculation | | Adjustments | | |
Three Months Ended June 30, 2022 ($ millions) | Conventional | | Third-party Sourced | Other (1) | | Conventional (2) |
| Gross Sales | 689 | | | 390 | | — | | | 1,079 | |
| Royalties | 89 | | | — | | — | | | 89 | |
| Purchased Product | — | | | 390 | | — | | | 390 | |
| Transportation and Blending | 35 | | | — | | (1) | | | 34 | |
| Operating | 120 | | | — | | 8 | | | 128 | |
| Netback | 445 | | | — | | (7) | | | 438 | |
| Realized (Gain) Loss on Risk Management | — | | | 4 | | — | | | 4 | |
| Operating Margin | 445 | | | (4) | | (7) | | | 434 | |
| | | | | | |
| | | | | | | | | | | | | | | | | | | | |
| Basis of Netback Calculation | | Adjustments | | |
Six Months Ended June 30, 2023 ($ millions) | Conventional | | Third-party Sourced | Other (1) | | Conventional (2) |
| Gross Sales | 740 | | | 862 | | 44 | | | 1,646 | |
| Royalties | 59 | | | — | | (1) | | | 58 | |
| Purchased Product | — | | | 862 | | — | | | 862 | |
| Transportation and Blending | 94 | | | — | | — | | | 94 | |
| Operating | 285 | | | — | | 9 | | | 294 | |
| Netback | 302 | | | — | | 36 | | | 338 | |
| Realized (Gain) Loss on Risk Management | 4 | | | — | | — | | | 4 | |
| Operating Margin | 298 | | | — | | 36 | | | 334 | |
| | | | | | |
| | | | | | | | | | | | | | | | | | | | |
| Basis of Netback Calculation | | Adjustments | | |
Six Months Ended June 30, 2022 ($ millions) | Conventional | | Third-party Sourced | Other (1) | | Conventional (2) |
| Gross Sales | 1,171 | | | 996 | | 24 | | | 2,191 | |
| Royalties | 160 | | | — | | — | | | 160 | |
| Purchased Product | — | | | 996 | | — | | | 996 | |
| Transportation and Blending | 71 | | | — | | (3) | | | 68 | |
| Operating | 248 | | | — | | 14 | | | 262 | |
| Netback | 692 | | | — | | 13 | | | 705 | |
| Realized (Gain) Loss on Risk Management | — | | | 8 | | — | | | 8 | |
| Operating Margin | 692 | | | (8) | | 13 | | | 697 | |
| | | | | | |
(1)Reflects Operating Margin from processing facilities.
(2)These amounts, excluding Netback, are found in Note 1 of the interim Consolidated Financial Statements.
| | | | | |
| Cenovus Energy Inc. – Q2 2023 Management's Discussion and Analysis | 57 |
Offshore
| | | | | | | | | | | | | | | | | | | | | | | | | | | | | | | | | | | |
| Basis of Netback Calculation | | Adjustments | | |
Three Months Ended June 30, 2023 ($ millions) | Atlantic | China | Indonesia (1) | Total
Asia Pacific | | Total Offshore | | Equity Adjustment (1) | Other (2) | | Total Offshore (3) |
| Gross Sales | 5 | | 223 | | 79 | | 302 | | | 307 | | | (79) | | — | | | 228 | |
| Royalties | 1 | | 12 | | 18 | | 30 | | | 31 | | | (18) | | — | | | 13 | |
| Purchased Product | — | | — | | — | | — | | | — | | | — | | — | | | — | |
| Transportation and Blending | 4 | | — | | — | | — | | | 4 | | | — | | — | | | 4 | |
| Operating | 36 | | 33 | | 12 | | 45 | | | 81 | | | (10) | | (8) | | | 63 | |
| Netback | (36) | | 178 | | 49 | | 227 | | | 191 | | | (51) | | 8 | | | 148 | |
| Realized (Gain) Loss on Risk Management | | | | | | — | | | — | | — | | | — | |
| Operating Margin | | | | | | 191 | | | (51) | | 8 | | | 148 | |
| | | | | | | | | | | | | | | | | | | | | | | | | | | | | | | | | | | |
| Basis of Netback Calculation | | Adjustments | | |
Three Months Ended June 30, 2022 ($ millions) | Atlantic | China | Indonesia (1) | Total
Asia Pacific | | Total Offshore | | Equity Adjustment (1) | Other (2) | | Total Offshore (3) |
| Gross Sales | 207 | | 351 | | 70 | | 421 | | | 628 | | | (70) | | — | | | 558 | |
| Royalties | (16) | | 18 | | 36 | | 54 | | | 38 | | | (36) | | — | | | 2 | |
| Purchased Product | — | | — | | — | | — | | | — | | | — | | — | | | — | |
| Transportation and Blending | 4 | | — | | — | | — | | | 4 | | | — | | — | | | 4 | |
| Operating | 47 | | 24 | | 13 | | 37 | | | 84 | | | (8) | | — | | | 76 | |
| Netback | 172 | | 309 | | 21 | | 330 | | | 502 | | | (26) | | — | | | 476 | |
| Realized (Gain) Loss on Risk Management | | | | | | — | | | — | | — | | | — | |
| Operating Margin | | | | | | 502 | | | (26) | | — | | | 476 | |
| | | | | | | | | | | | | | | | | | | | | | | | | | | | | | | | | | | |
| Basis of Netback Calculation | | Adjustments | | |
Six Months Ended June 30, 2023 ($ millions) | Atlantic | China | Indonesia (1) | Total
Asia Pacific | | Total Offshore | | Equity Adjustment (1) | Other (2) | | Total Offshore (3) |
| Gross Sales | 154 | | 547 | | 152 | | 699 | | | 853 | | | (152) | | — | | | 701 | |
| Royalties | 9 | | 30 | | 41 | | 71 | | | 80 | | | (41) | | — | | | 39 | |
| Purchased Product | — | | — | | — | | — | | | — | | | — | | — | | | — | |
| Transportation and Blending | 9 | | — | | — | | — | | | 9 | | | — | | — | | | 9 | |
| Operating | 121 | | 55 | | 26 | | 81 | | | 202 | | | (20) | | 23 | | | 205 | |
| Netback | 15 | | 462 | | 85 | | 547 | | | 562 | | | (91) | | (23) | | | 448 | |
| Realized (Gain) Loss on Risk Management | | | | | | — | | | — | | — | | | — | |
| Operating Margin | | | | | | 562 | | | (91) | | (23) | | | 448 | |
| | | | | | | | | | | | | | | | | | | | | | | | | | | | | | | | | | | |
| Basis of Netback Calculation | | Adjustments | | |
Six Months Ended June 30, 2022 ($ millions) | Atlantic | China | Indonesia (1) | Total
Asia Pacific | | Total Offshore | | Equity Adjustment (1) | Other (2) | | Total Offshore (3) |
| Gross Sales | 379 | | 746 | | 131 | | 877 | | | 1,256 | | | (131) | | — | | | 1,125 | |
| Royalties | (6) | | 40 | | 64 | | 104 | | | 98 | | | (64) | | — | | | 34 | |
| Purchased Product | — | | — | | — | | — | | | — | | | — | | — | | | — | |
| Transportation and Blending | 8 | | — | | — | | — | | | 8 | | | — | | — | | | 8 | |
| Operating | 93 | | 47 | | 24 | | 71 | | | 164 | | | (15) | | — | | | 149 | |
| Netback | 284 | | 659 | | 43 | | 702 | | | 986 | | | (52) | | — | | | 934 | |
| Realized (Gain) Loss on Risk Management | | | | | | — | | | — | | — | | | — | |
| Operating Margin | | | | | | 986 | | | (52) | | — | | | 934 | |
(1)Revenues and expenses related to the HCML joint venture are accounted for using the equity method in the consolidated financial statements.
(2)Relates to West White Rose project expenses.
(3)These amounts, excluding Netback, are found in Note 1 of the interim Consolidated Financial Statements.
| | | | | |
| Cenovus Energy Inc. – Q2 2023 Management's Discussion and Analysis | 58 |
Upstream Sales Volumes (1)
The following table provides the sales volumes used to calculate Netback:
| | | | | | | | | | | | | | | | | | | | | | | | | |
| Three Months Ended June 30, | | Six Months Ended June 30, | | |
| (MBOE/d) | 2023 | | 2022 | | 2023 | | 2022 | | |
| Oil Sands | | | | | | | | | |
| Foster Creek | 175.7 | | | 192.2 | | | 179.6 | | | 196.1 | | | |
| Christina Lake | 231.4 | | | 233.0 | | | 234.6 | | | 248.1 | | | |
| Sunrise | 47.2 | | | 23.8 | | | 43.5 | | | 24.5 | | | |
| Other Oil Sands | 123.8 | | | 114.9 | | | 119.8 | | | 118.0 | | | |
| Total Oil Sands | 578.1 | | | 563.9 | | | 577.5 | | | 586.7 | | | |
| | | | | | | | | |
| Conventional | 104.6 | | | 132.6 | | | 114.2 | | | 128.8 | | | |
| | | | | | | | | |
| Sales Before Internal Consumption | 682.7 | | | 696.5 | | | 691.7 | | | 715.5 | | | |
Less: Internal Consumption (2) | (86.8) | | | (84.3) | | | (89.0) | | | (86.1) | | | |
| Sales After Internal Consumption | 595.9 | | | 612.2 | | | 602.7 | | | 629.4 | | | |
| | | | | | | | | |
| Offshore | | | | | | | | | |
| Atlantic | — | | | 15.5 | | | 7.8 | | | 15.1 | | | |
| Asia Pacific | | | | | | | | | |
| China | 31.2 | | | 46.8 | | | 37.2 | | | 50.1 | | | |
| Indonesia | 15.0 | | | 10.0 | | | 14.3 | | | 9.6 | | | |
| Total Asia Pacific | 46.2 | | | 56.8 | | | 51.5 | | | 59.7 | | | |
| Total Offshore | 46.2 | | | 72.3 | | | 59.3 | | | 74.8 | | | |
| | | | | | | | | |
| Total Sales Volumes | 642.1 | | | 684.5 | | | 662.0 | | | 704.2 | | | |
(1)Sales volumes exclude the impact of purchased condensate.
(2)Represents natural gas volumes produced by the Oil Sands and Conventional segment used for internal consumption by the Oil Sands segment.
| | | | | |
| Cenovus Energy Inc. – Q2 2023 Management's Discussion and Analysis | 59 |
Exhibit 99.3
Cenovus Energy Inc.
Interim Consolidated Financial Statements (unaudited)
For the Periods Ended June 30, 2023
(Canadian Dollars)
CONSOLIDATED FINANCIAL STATEMENTS (unaudited) 
| | |
For the periods ended June 30, 2023 |
| | | | | |
Cenovus Energy Inc. – Q2 2023 Interim Consolidated Financial Statements | 2 |
| | |
CONSOLIDATED STATEMENTS OF EARNINGS (LOSS) (unaudited) |
For the periods ended June 30,
($ millions, except per share amounts)
| | | | | | | | | | | | | | | | | | | | | | | | | | | | | |
| | | Three Months Ended | | Six Months Ended |
| Notes | | 2023 | | 2022 | | 2023 | | 2022 |
| | | | | | | | | |
| Revenues | 1 | | | | | | | | |
| Gross Sales | | | 12,868 | | 20,747 | | 25,726 | | 38,130 |
| Less: Royalties | | | 637 | | 1,582 | | 1,233 | | 2,767 |
| | | 12,231 | | 19,165 | | 24,493 | | 35,363 |
| Expenses | 1 | | | | | | | | |
| Purchased Product | | | 5,709 | | 9,394 | | 11,501 | | 16,878 |
| Transportation and Blending | | | 2,641 | | 3,050 | | 5,494 | | 6,023 |
| Operating | | | 1,541 | | 1,481 | | 3,093 | | 2,768 |
| (Gain) Loss on Risk Management | 23 | | 23 | | 283 | | 17 | | 1,568 |
| Depreciation, Depletion and Amortization | 10,11 | | 1,072 | | 1,132 | | 2,177 | | 2,162 |
| Exploration Expense | | | 4 | | 10 | | 8 | | 26 |
| (Income) Loss From Equity-Accounted Affiliates | 12 | | (6) | | 2 | | (12) | | (2) |
| General and Administrative | | | 167 | | 218 | | 325 | | 417 |
| Finance Costs | 5 | | 193 | | 195 | | 387 | | 424 |
| Interest Income | | | (34) | | (8) | | (67) | | (23) |
| Integration and Transaction Costs | 4 | | 17 | | 28 | | 37 | | 52 |
| Foreign Exchange (Gain) Loss, Net | 6 | | (119) | | 192 | | (126) | | 90 |
| Revaluation (Gain) Loss | 4 | | — | | — | | 33 | | — |
| Re-measurement of Contingent Payments | 16 | | (1) | | 15 | | 16 | | 251 |
| (Gain) Loss on Divestiture of Assets | | | (10) | | (62) | | (11) | | (304) |
| Other (Income) Loss, Net | | | (14) | | (38) | | (20) | | (408) |
| Earnings (Loss) Before Income Tax | | | 1,048 | | 3,273 | | 1,641 | | 5,441 |
| Income Tax Expense (Recovery) | 7 | | 182 | | 841 | | 139 | | 1,384 |
| Net Earnings (Loss) | | | 866 | | 2,432 | | 1,502 | | 4,057 |
| | | | | | | | | |
Net Earnings (Loss) Per Common Share ($) | 8 | | | | | | | | |
| Basic | | | 0.45 | | 1.23 | | 0.78 | | 2.04 |
| Diluted | | | 0.44 | | 1.19 | | 0.76 | | 1.98 |
| | | | | | | | | |
See accompanying Notes to the interim Consolidated Financial Statements (unaudited).
| | | | | |
Cenovus Energy Inc. – Q2 2023 Interim Consolidated Financial Statements | 3 |
| | |
| CONSOLIDATED STATEMENTS OF COMPREHENSIVE INCOME (LOSS) (unaudited) |
For the periods ended June 30,
($ millions)
| | | | | | | | | | | | | | | | | | | | | | | | | | | | | |
| | | Three Months Ended | | Six Months Ended |
| Notes | | 2023 | | 2022 | | 2023 | | 2022 |
| | | | | | | | | |
| Net Earnings (Loss) | | | 866 | | 2,432 | | 1,502 | | 4,057 |
| Other Comprehensive Income (Loss), Net of Tax | 20 | | | | | | | | |
| Items That Will not be Reclassified to Profit or Loss: | | | | | | | | | |
Actuarial Gain (Loss) Relating to Pension and Other Post- Employment Benefits | | | (1) | | 27 | | (4) | | 57 |
Change in the Fair Value of Equity Instruments at FVOCI (1) | | | (1) | | — | | (1) | | — |
| Items That may be Reclassified to Profit or Loss: | | | | | | | | | |
| Foreign Currency Translation Adjustment | | | (265) | | 322 | | (284) | | 172 |
| Total Other Comprehensive Income (Loss), Net of Tax | | | (267) | | 349 | | (289) | | 229 |
| Comprehensive Income (Loss) | | | 599 | | 2,781 | | 1,213 | | 4,286 |
| | | | | | | | | |
(1)Fair value through other comprehensive income (loss) (“FVOCI”).
See accompanying Notes to the interim Consolidated Financial Statements (unaudited).
| | | | | |
Cenovus Energy Inc. – Q2 2023 Interim Consolidated Financial Statements | 4 |
| | |
| CONSOLIDATED BALANCE SHEETS (unaudited) |
As at
($ millions)
| | | | | | | | | | | | | | | | | |
| | | | | |
| Notes | | June 30, 2023 | | December 31, 2022 |
| | | | | |
| Assets | | | | | |
| Current Assets | | | | | |
| Cash and Cash Equivalents | | | 2,167 | | 4,524 |
| Accounts Receivable and Accrued Revenues | | | 3,241 | | 3,473 |
| Income Tax Receivable | | | 290 | | 121 |
| Inventories | | | 4,252 | | 4,312 |
| | | | | |
| Total Current Assets | | | 9,950 | | 12,430 |
| Restricted Cash | 17 | | 202 | | 209 |
| Exploration and Evaluation Assets, Net | 1,9 | | 765 | | 685 |
| Property, Plant and Equipment, Net | 1,10 | | 36,698 | | 36,499 |
| Right-of-Use Assets, Net | 1,11 | | 1,781 | | 1,845 |
| Income Tax Receivable | | | 25 | | 25 |
| Investments in Equity-Accounted Affiliates | 12 | | 358 | | 365 |
| Other Assets | 13 | | 287 | | 342 |
| Deferred Income Taxes | | | 758 | | 546 |
| Goodwill | 1 | | 2,923 | | 2,923 |
| Total Assets | | | 53,747 | | 55,869 |
| | | | | |
| Liabilities and Equity | | | | | |
| Current Liabilities | | | | | |
| Accounts Payable and Accrued Liabilities | | | 6,040 | | 6,124 |
| Income Tax Payable | | | 48 | | 1,211 |
| Short-Term Borrowings | 14 | | — | | 115 |
| | | | | |
| Lease Liabilities | 15 | | 274 | | 308 |
| Contingent Payments | 16 | | 262 | | 263 |
| | | | | |
| Total Current Liabilities | | | 6,624 | | 8,021 |
| Long-Term Debt | 14 | | 8,534 | | 8,691 |
| Lease Liabilities | 15 | | 2,500 | | 2,528 |
| Contingent Payments | 16 | | 58 | | 156 |
| Decommissioning Liabilities | 17 | | 3,605 | | 3,559 |
| Other Liabilities | 18 | | 1,044 | | 1,042 |
| Deferred Income Taxes | | | 4,090 | | 4,283 |
| Total Liabilities | | | 26,455 | | 28,280 |
| Shareholders’ Equity | | | 27,279 | | 27,576 |
| Non-Controlling Interest | | | 13 | | 13 |
| Total Liabilities and Equity | | | 53,747 | | 55,869 |
| | | | | |
| Commitments and Contingencies | 26 | | | | |
| | | | | |
See accompanying Notes to the interim Consolidated Financial Statements (unaudited).
| | | | | |
Cenovus Energy Inc. – Q2 2023 Interim Consolidated Financial Statements | 5 |
| | |
| CONSOLIDATED STATEMENTS OF EQUITY (unaudited) |
($ millions)
| | | | | | | | | | | | | | | | | | | | | | | | | | | | | | | | | | | | | | | | | | | | | | | |
| Shareholders’ Equity | | |
| Common Shares | | Preferred Shares | | Warrants | | Paid in Surplus | | Retained Earnings | | AOCI (1) | | Total | | Non-Controlling Interest |
| (Note 19) | | (Note 19) | | (Note 19) | | | | | | (Note 20) | | | | |
| | | | | | | | | | | | | | | |
As at December 31, 2021 | 17,016 | | 519 | | 215 | | 4,284 | | 878 | | 684 | | 23,596 | | 12 |
| Net Earnings (Loss) | — | | — | | — | | — | | 4,057 | | — | | 4,057 | | — |
| Other Comprehensive Income (Loss), Net of Tax | — | | — | | — | | — | | — | | 229 | | 229 | | — |
| Total Comprehensive Income (Loss) | — | | — | | — | | — | | 4,057 | | 229 | | 4,286 | | — |
| | | | | | | | | | | | | | | |
| Common Shares Issued Under Stock Option Plans | 149 | | — | | — | | (29) | | — | | — | | 120 | | — |
Purchase of Common Shares Under NCIBs (2) | (577) | | — | | — | | (907) | | — | | — | | (1,484) | | — |
| | | | | | | | | | | | | | | |
| | | | | | | | | | | | | | | |
| Warrants Exercised | 65 | | — | | (21) | | — | | — | | — | | 44 | | — |
| Stock-Based Compensation Expense | — | | — | | — | | 6 | | — | | — | | 6 | | — |
| Base Dividends on Common Shares | — | | — | | — | | — | | (276) | | — | | (276) | | — |
| Dividends on Preferred Shares | — | | — | | — | | — | | (17) | | — | | (17) | | — |
| | | | | | | | | | | | | | | |
As at June 30, 2022 | 16,653 | | 519 | | 194 | | 3,354 | | 4,642 | | 913 | | 26,275 | | 12 |
| | | | | | | | | | | | | | | |
As at December 31, 2022 | 16,320 | | 519 | | 184 | | 2,691 | | 6,392 | | 1,470 | | 27,576 | | 13 |
| Net Earnings (Loss) | — | | — | | — | | — | | 1,502 | | — | | 1,502 | | — |
| Other Comprehensive Income (Loss), Net of Tax | — | | — | | — | | — | | — | | (289) | | (289) | | — |
| Total Comprehensive Income (Loss) | — | | — | | — | | — | | 1,502 | | (289) | | 1,213 | | — |
| | | | | | | | | | | | | | | |
| Common Shares Issued Under Stock Option Plans | 23 | | — | | — | | (5) | | — | | — | | 18 | | — |
| | | | | | | | | | | | | | | |
Purchase of Common Shares Under NCIBs (2) | (133) | | — | | — | | (217) | | — | | — | | (350) | | — |
| | | | | | | | | | | | | | | |
| | | | | | | | | | | | | | | |
| Warrants Exercised | 16 | | — | | (5) | | — | | — | | — | | 11 | | — |
| Warrants Purchased and Cancelled | — | | — | | (151) | | — | | (562) | | — | | (713) | | — |
| Stock-Based Compensation Expense | — | | — | | — | | 7 | | — | | — | | 7 | | — |
| Base Dividends on Common Shares | — | | — | | — | | — | | (465) | | — | | (465) | | — |
| | | | | | | | | | | | | | | |
| | | | | | | | | | | | | | | |
| Dividends on Preferred Shares | — | | — | | — | | — | | (18) | | — | | (18) | | — |
| | | | | | | | | | | | | | | |
As at June 30, 2023 | 16,226 | | 519 | | 28 | | 2,476 | | 6,849 | | 1,181 | | 27,279 | | 13 |
| | | | | | | | | | | | | | | |
(1)Accumulated other comprehensive income (loss) (“AOCI”).
(2)Normal course issuer bids (“NCIBs”).
See accompanying Notes to the interim Consolidated Financial Statements (unaudited).
| | | | | |
Cenovus Energy Inc. – Q2 2023 Interim Consolidated Financial Statements | 6 |
| | |
| CONSOLIDATED STATEMENTS OF CASH FLOWS (unaudited) |
For the periods ended June 30,
($ millions)
| | | | | | | | | | | | | | | | | | | | | | | | | | |
| | Three Months Ended | | Six Months Ended |
| Notes | 2023 | | 2022 | | 2023 | | 2022 |
| | | | | | | | |
| Operating Activities | | | | | | | | |
| Net Earnings (Loss) | | 866 | | 2,432 | | 1,502 | | 4,057 |
| Depreciation, Depletion and Amortization | 10,11 | 1,072 | | 1,132 | | 2,177 | | 2,162 |
| | | | | | | | |
| | | | | | | | |
| | | | | | | | |
| Deferred Income Tax Expense (Recovery) | 7 | (44) | | (61) | | (414) | | 57 |
| Unrealized (Gain) Loss on Risk Management | 23 | 46 | | (381) | | 16 | | (70) |
| Unrealized Foreign Exchange (Gain) Loss | 6 | (172) | | 260 | | (158) | | 121 |
| Realized Foreign Exchange (Gain) Loss on Non-Operating Items | | — | | — | | — | | 26 |
| Revaluation (Gain) Loss | 4 | — | | — | | 33 | | — |
| Re-measurement of Contingent Payments, Net of Cash Paid | | (1) | | (279) | | 16 | | (203) |
| (Gain) Loss on Divestiture of Assets | | (10) | | (62) | | (11) | | (304) |
| Unwinding of Discount on Decommissioning Liabilities | 17 | 55 | | 45 | | 110 | | 89 |
| (Income) Loss From Equity-Accounted Affiliates | 12 | (6) | | 2 | | (12) | | (2) |
| Distributions Received From Equity-Accounted Affiliates | 12 | 71 | | 24 | | 94 | | 41 |
| Other | | 22 | | (14) | | (59) | | (293) |
| Settlement of Decommissioning Liabilities | 17 | (41) | | (27) | | (89) | | (46) |
| Net Change in Non-Cash Working Capital | 25 | 132 | | (92) | | (1,501) | | (1,291) |
| Cash From (Used in) Operating Activities | | 1,990 | | 2,979 | | 1,704 | | 4,344 |
| | | | | | | | |
| Investing Activities | | | | | | | | |
| Acquisitions, Net of Cash Acquired | 4 | (4) | | (1) | | (469) | | (1) |
| Capital Investment | 1 | (1,002) | | (822) | | (2,103) | | (1,568) |
| Proceeds From Divestitures | | 3 | | 112 | | 11 | | 1,062 |
| Payment on Divestiture of Assets | | — | | (50) | | — | | (50) |
| | | | | | | | |
| | | | | | | | |
| Net Change in Investments and Other | | (80) | | (110) | | (93) | | (236) |
| Net Change in Non-Cash Working Capital | 25 | (76) | | 80 | | (260) | | 339 |
| Cash From (Used in) Investing Activities | | (1,159) | | (791) | | (2,914) | | (454) |
| | | | | | | | |
| Net Cash Provided (Used) Before Financing Activities | | 831 | | 2,188 | | (1,210) | | 3,890 |
| | | | | | | | |
| Financing Activities | 25 | | | | | | | |
| Net Issuance (Repayment) of Short-Term Borrowings | | — | | (63) | | (115) | | (79) |
| | | | | | | | |
| (Repayment) of Long-Term Debt | | — | | (750) | | — | | (1,260) |
| | | | | | | | |
| Principal Repayment of Leases | 15 | (76) | | (75) | | (146) | | (150) |
| Common Shares Issued Under Stock Option Plans | | 14 | | 76 | | 18 | | 120 |
| Purchase of Common Shares Under NCIBs | 19 | (310) | | (1,018) | | (350) | | (1,484) |
| | | | | | | | |
| Proceeds From Exercise of Warrants | | 8 | | 34 | | 11 | | 44 |
| Base Dividends Paid on Common Shares | 8 | (265) | | (207) | | (465) | | (276) |
| | | | | | | | |
| Dividends Paid on Preferred Shares | 8 | (9) | | (8) | | (27) | | (17) |
| Other | | (1) | | — | | — | | (2) |
| Cash From (Used in) Financing Activities | | (639) | | (2,011) | | (1,074) | | (3,104) |
| | | | | | | | |
Effect of Foreign Exchange on Cash and Cash Equivalents | | (74) | | 117 | | (73) | | 34 |
| Increase (Decrease) in Cash and Cash Equivalents | | 118 | | 294 | | (2,357) | | 820 |
| Cash and Cash Equivalents, Beginning of Period | | 2,049 | | 3,399 | | 4,524 | | 2,873 |
| Cash and Cash Equivalents, End of Period | | 2,167 | | 3,693 | | 2,167 | | 3,693 |
| | | | | | | | |
See accompanying Notes to the interim Consolidated Financial Statements (unaudited).
| | | | | |
Cenovus Energy Inc. – Q2 2023 Interim Consolidated Financial Statements | 7 |
NOTES TO THE INTERIM CONSOLIDATED FINANCIAL STATEMENTS (unaudited)
All amounts in $ millions, unless otherwise indicated
For the periods ended June 30, 2023
| | |
|
1. DESCRIPTION OF BUSINESS AND SEGMENTED DISCLOSURES |
Cenovus Energy Inc., including its subsidiaries, (together “Cenovus” or the “Company”) is an integrated energy company with crude oil and natural gas production operations in Canada and the Asia Pacific region, and upgrading, refining and marketing operations in Canada and the United States (“U.S.”).
Cenovus is incorporated under the Canada Business Corporations Act and its common shares and common share purchase warrants are listed on the Toronto Stock Exchange (“TSX”) and the New York Stock Exchange. Cenovus’s cumulative redeemable preferred shares series 1, 2, 3, 5 and 7 are listed on the TSX. The executive and registered office is located at 4100, 225 6 Avenue S.W., Calgary, Alberta, Canada, T2P 1N2. Information on the Company’s basis of preparation for these interim Consolidated Financial Statements is found in Note 2.
Management has determined the operating segments based on information regularly reviewed for the purposes of decision making, allocating resources and assessing operational performance by Cenovus’s chief operating decision maker. The Company’s operating segments are aggregated based on their geographic locations, the nature of the businesses or a combination of these factors. The Company evaluates the financial performance of its operating segments primarily based on operating margin.
The Company operates through the following reportable segments:
Upstream Segments
•Oil Sands, includes the development and production of bitumen and heavy oil in northern Alberta and Saskatchewan. Cenovus’s oil sands assets include Foster Creek, Christina Lake, Sunrise, Lloydminster thermal and Lloydminster conventional heavy oil assets. Cenovus jointly owns and operates pipeline gathering systems and terminals through the equity-accounted investment in Husky Midstream Limited Partnership (“HMLP”). The sale and transportation of Cenovus’s production and third-party commodity trading volumes are managed and marketed through access to capacity on third-party pipelines and storage facilities in both Canada and the U.S. to optimize product mix, delivery points, transportation commitments and customer diversification.
•Conventional, includes assets rich in natural gas liquids (“NGLs”) and natural gas within the Elmworth-Wapiti, Kaybob‑Edson, Clearwater and Rainbow Lake operating areas in Alberta and British Columbia and interests in numerous natural gas processing facilities. Cenovus’s NGLs and natural gas production is marketed and transported, with additional third-party commodity trading volumes, through access to capacity on third-party pipelines, export terminals and storage facilities. These provide flexibility for market access to optimize product mix, delivery points, transportation commitments and customer diversification.
•Offshore, includes offshore operations, exploration and development activities in China and the east coast of Canada, as well as the equity-accounted investment in the Husky-CNOOC Madura Ltd. (“HCML”) joint venture in Indonesia.
Downstream Segments
•Canadian Manufacturing, includes the owned and operated Lloydminster upgrading and asphalt refining complex, which converts heavy oil and bitumen into synthetic crude oil, diesel, asphalt and other ancillary products. Cenovus also owns and operates the Bruderheim crude-by-rail terminal and two ethanol plants. The Company’s commercial fuels business across Canada is included in this segment. Cenovus markets its production and third-party commodity trading volumes in an effort to use its integrated network of assets to maximize value.
•U.S. Manufacturing, includes the refining of crude oil to produce gasoline, diesel, jet fuel, asphalt and other products at the wholly-owned Lima, Superior and Toledo refineries, and the jointly-owned Wood River and Borger refineries (jointly owned with operator Phillips 66). Cenovus also markets some of its own and third-party volumes of refined petroleum products including gasoline, diesel, jet fuel and asphalt.
Corporate and Eliminations
Corporate and Eliminations, includes Cenovus-wide costs for general and administrative, financing activities, gains and losses on risk management for corporate related derivative instruments and foreign exchange. Eliminations include adjustments for internal usage of natural gas production between segments, transloading services provided to the Oil Sands segment by the Company’s crude-by-rail terminal, crude oil production used as feedstock by the Canadian Manufacturing and U.S. Manufacturing segments, the sale of condensate extracted from blended crude oil production in the Canadian Manufacturing segment and sold to the Oil Sands segment, and unrealized profits in inventory. Eliminations are recorded based on current market prices.
| | | | | |
Cenovus Energy Inc. – Q2 2023 Interim Consolidated Financial Statements | 8 |
NOTES TO THE INTERIM CONSOLIDATED FINANCIAL STATEMENTS (unaudited)
All amounts in $ millions, unless otherwise indicated
For the periods ended June 30, 2023
In December 2022, Management elected to aggregate the commercial fuels business and the historical retail fuels business with the Canadian Manufacturing segment. The marketing operations of the Canadian Manufacturing segment have similar products and services, customer types, distribution methods and operate in the same regulatory environment as the commercial fuels business. Prior period results have been re-presented; see Note 3.
The following tabular financial information presents segmented information first by segment, then by product and geographic location.
A) Results of Operations – Segment and Operational Information
i) Results for the Three Months Ended June 30
| | | | | | | | | | | | | | | | | | | | | | | | | | | | | | | | | | | | | | | | | | | | | | | |
| Upstream |
For the three months ended | Oil Sands | | Conventional | | Offshore | | Total |
| June 30, | 2023 | | 2022 | | 2023 | | 2022 | | 2023 | | 2022 | | 2023 | | 2022 |
| Revenues | | | | | | | | | | | | | | | |
| Gross Sales | 6,556 | | 10,048 | | 615 | | 1,079 | | 228 | | 558 | | 7,399 | | 11,685 |
Less: Royalties | 620 | | 1,491 | | 4 | | 89 | | 13 | | 2 | | 637 | | 1,582 |
| 5,936 | | 8,557 | | 611 | | 990 | | 215 | | 556 | | 6,762 | | 10,103 |
| Expenses | | | | | | | | | | | | | | | |
Purchased Product | 533 | | 1,071 | | 352 | | 390 | | — | | — | | 885 | | 1,461 |
Transportation and Blending | 2,700 | | 3,200 | | 46 | | 34 | | 4 | | 4 | | 2,750 | | 3,238 |
Operating | 676 | | 806 | | 144 | | 128 | | 63 | | 76 | | 883 | | 1,010 |
Realized (Gain) Loss on Risk
Management | (9) | | 559 | | (4) | | 4 | | — | | — | | (13) | | 563 |
| Operating Margin | 2,036 | | 2,921 | | 73 | | 434 | | 148 | | 476 | | 2,257 | | 3,831 |
Unrealized (Gain) Loss on Risk Management | 31 | | (323) | | (1) | | (1) | | — | | — | | 30 | | (324) |
Depreciation, Depletion and
Amortization | 730 | | 690 | | 87 | | 99 | | 91 | | 159 | | 908 | | 948 |
| Exploration Expense | 2 | | (1) | | — | | 1 | | 2 | | 10 | | 4 | | 10 |
(Income) Loss From Equity-
Accounted Affiliates | 6 | | 8 | | — | | — | | (12) | | (6) | | (6) | | 2 |
| Segment Income (Loss) | 1,267 | | 2,547 | | (13) | | 335 | | 67 | | 313 | | 1,321 | | 3,195 |
| | | | | |
Cenovus Energy Inc. – Q2 2023 Interim Consolidated Financial Statements | 9 |
NOTES TO THE INTERIM CONSOLIDATED FINANCIAL STATEMENTS (unaudited)
All amounts in $ millions, unless otherwise indicated
For the periods ended June 30, 2023
| | | | | | | | | | | | | | | | | | | | | | | | | | | | | | | | | | | |
| Downstream |
For the three months ended | Canadian Manufacturing | | U.S. Manufacturing | | Total |
June 30, | 2023 | | 2022 | | 2023 | | 2022 | | 2023 | | 2022 |
| Revenues | | | | | | | | | | | |
| Gross Sales | 1,363 | | 2,245 | | 6,198 | | 8,474 | | 7,561 | | 10,719 |
Less: Royalties | — | | — | | — | | — | | — | | — |
| 1,363 | | 2,245 | | 6,198 | | 8,474 | | 7,561 | | 10,719 |
| Expenses | | | | | | | | | | | |
Purchased Product | 1,083 | | 1,980 | | 5,498 | | 6,939 | | 6,581 | | 8,919 |
Transportation and Blending | — | | — | | — | | — | | — | | — |
Operating | 164 | | 211 | | 679 | | 655 | | 843 | | 866 |
| Realized (Gain) Loss on Risk Management | — | | — | | (6) | | 87 | | (6) | | 87 |
| Operating Margin | 116 | | 54 | | 27 | | 793 | | 143 | | 847 |
Unrealized (Gain) Loss on Risk Management | — | | — | | (5) | | (41) | | (5) | | (41) |
| Depreciation, Depletion and Amortization | 43 | | 72 | | 102 | | 83 | | 145 | | 155 |
| Exploration Expense | — | | — | | — | | — | | — | | — |
| (Income) Loss From Equity-Accounted Affiliates | — | | — | | — | | — | | — | | — |
| Segment Income (Loss) | 73 | | (18) | | (70) | | 751 | | 3 | | 733 |
| | | | | | | | | | | | | | | | | | | | | | | | | | | | | | |
For the three months ended | | | Corporate and Eliminations | | Consolidated |
June 30, | | | | | | 2023 | | 2022 | | 2023 | | 2022 |
| Revenues | | | | | | | | | | | | | | |
| Gross Sales | | | | | | | | (2,092) | | (1,657) | | 12,868 | | 20,747 |
Less: Royalties | | | | | | | | — | | — | | 637 | | 1,582 |
| | | | | | | | (2,092) | | (1,657) | | 12,231 | | 19,165 |
| Expenses | | | | | | | | | | | | | | |
Purchased Product | | | | | | | | (1,757) | | (986) | | 5,709 | | 9,394 |
Transportation and Blending | | | | | | | | (109) | | (188) | | 2,641 | | 3,050 |
Operating | | | | | | | | (185) | | (395) | | 1,541 | | 1,481 |
| Realized (Gain) Loss on Risk Management | | | | | | | | (4) | | 14 | | (23) | | 664 |
Unrealized (Gain) Loss on Risk Management | | | | | | | | 21 | | (16) | | 46 | | (381) |
| Depreciation, Depletion and Amortization | | | | | | | | 19 | | 29 | | 1,072 | | 1,132 |
| Exploration Expense | | | | | | | | — | | — | | 4 | | 10 |
| (Income) Loss From Equity-Accounted Affiliates | | | | | | | | — | | — | | (6) | | 2 |
| Segment Income (Loss) | | | | | | | | (77) | | (115) | | 1,247 | | 3,813 |
| General and Administrative | | | | | | | | 167 | | 218 | | 167 | | 218 |
| Finance Costs | | | | | | | | 193 | | 195 | | 193 | | 195 |
| Interest Income | | | | | | | | (34) | | (8) | | (34) | | (8) |
| Integration and Transaction Costs | | | | | | | | 17 | | 28 | | 17 | | 28 |
| Foreign Exchange (Gain) Loss, Net | | | | | | | | (119) | | 192 | | (119) | | 192 |
| Revaluation (Gain) Loss | | | | | | | | — | | — | | — | | — |
| Re-measurement of Contingent Payments | | | | | | | | (1) | | 15 | | (1) | | 15 |
| (Gain) Loss on Divestiture of Assets | | | | | | | | (10) | | (62) | | (10) | | (62) |
| Other (Income) Loss, Net | | | | | | | | (14) | | (38) | | (14) | | (38) |
| | | | | | | | 199 | | 540 | | 199 | | 540 |
| Earnings (Loss) Before Income Tax | | | | | | | | | | | | 1,048 | | 3,273 |
| Income Tax Expense (Recovery) | | | | | | | | | | | | 182 | | 841 |
| Net Earnings (Loss) | | | | | | | | | | | | 866 | | 2,432 |
| | | | | |
Cenovus Energy Inc. – Q2 2023 Interim Consolidated Financial Statements | 10 |
NOTES TO THE INTERIM CONSOLIDATED FINANCIAL STATEMENTS (unaudited)
All amounts in $ millions, unless otherwise indicated
For the periods ended June 30, 2023
ii) Results for the Six Months Ended June 30
| | | | | | | | | | | | | | | | | | | | | | | | | | | | | | | | | | | | | | | | | | | | | | | |
| Upstream |
| Oil Sands | | Conventional | | Offshore | | Total |
For the six months ended June 30, | 2023 | | 2022 | | 2023 | | 2022 | | 2023 | | 2022 | | 2023 | | 2022 |
| Revenues | | | | | | | | | | | | | | | |
| Gross Sales | 12,467 | | 19,266 | | 1,646 | | 2,191 | | 701 | | 1,125 | | 14,814 | | 22,582 |
Less: Royalties | 1,136 | | 2,573 | | 58 | | 160 | | 39 | | 34 | | 1,233 | | 2,767 |
| 11,331 | | 16,693 | | 1,588 | | 2,031 | | 662 | | 1,091 | | 13,581 | | 19,815 |
| Expenses | | | | | | | | | | | | | | | |
Purchased Product | 1,092 | | 2,283 | | 862 | | 996 | | — | | — | | 1,954 | | 3,279 |
Transportation and Blending | 5,641 | | 6,356 | | 94 | | 68 | | 9 | | 8 | | 5,744 | | 6,432 |
Operating | 1,413 | | 1,508 | | 294 | | 262 | | 205 | | 149 | | 1,912 | | 1,919 |
Realized (Gain) Loss on Risk
Management | (1) | | 1,426 | | 4 | | 8 | | — | | — | | 3 | | 1,434 |
| Operating Margin | 3,186 | | 5,120 | | 334 | | 697 | | 448 | | 934 | | 3,968 | | 6,751 |
Unrealized (Gain) Loss on Risk Management | (3) | | (57) | | (21) | | (1) | | — | | — | | (24) | | (58) |
Depreciation, Depletion and
Amortization | 1,445 | | 1,325 | | 182 | | 179 | | 219 | | 309 | | 1,846 | | 1,813 |
| Exploration Expense | 4 | | — | | — | | 1 | | 4 | | 25 | | 8 | | 26 |
(Income) Loss From Equity-
Accounted Affiliates | 6 | | 8 | | — | | — | | (18) | | (10) | | (12) | | (2) |
| Segment Income (Loss) | 1,734 | | 3,844 | | 173 | | 518 | | 243 | | 610 | | 2,150 | | 4,972 |
| | | | | |
Cenovus Energy Inc. – Q2 2023 Interim Consolidated Financial Statements | 11 |
NOTES TO THE INTERIM CONSOLIDATED FINANCIAL STATEMENTS (unaudited)
All amounts in $ millions, unless otherwise indicated
For the periods ended June 30, 2023
| | | | | | | | | | | | | | | | | | | | | | | | | | | | | | | | | | | |
| Downstream |
| Canadian Manufacturing | | U.S. Manufacturing | | Total |
For the six months ended June 30, | 2023 | | 2022 | | 2023 | | 2022 | | 2023 | | 2022 |
| Revenues | | | | | | | | | | | |
| Gross Sales | 2,871 | | 3,852 | | 12,058 | | 14,983 | | 14,929 | | 18,835 |
Less: Royalties | — | | — | | — | | — | | — | | — |
| 2,871 | | 3,852 | | 12,058 | | 14,983 | | 14,929 | | 18,835 |
| Expenses | | | | | | | | | | | |
Purchased Product | 2,176 | | 3,315 | | 10,627 | | 12,421 | | 12,803 | | 15,736 |
Transportation and Blending | — | | — | | — | | — | | — | | — |
Operating | 316 | | 362 | | 1,281 | | 1,149 | | 1,597 | | 1,511 |
| Realized (Gain) Loss on Risk Management | — | | — | | (5) | | 197 | | (5) | | 197 |
| Operating Margin | 379 | | 175 | | 155 | | 1,216 | | 534 | | 1,391 |
Unrealized (Gain) Loss on Risk Management | — | | — | | (11) | | (14) | | (11) | | (14) |
| Depreciation, Depletion and Amortization | 86 | | 122 | | 205 | | 168 | | 291 | | 290 |
| Exploration Expense | — | | — | | — | | — | | — | | — |
| (Income) Loss From Equity-Accounted Affiliates | — | | — | | — | | — | | — | | — |
| Segment Income (Loss) | 293 | | 53 | | (39) | | 1,062 | | 254 | | 1,115 |
| | | | | | | | | | | | | | | | | | | | | | | |
| Corporate and Eliminations | | Consolidated |
For the six months ended June 30, | 2023 | | 2022 | | 2023 | | 2022 |
| Revenues | | | | | | | |
| Gross Sales | (4,017) | | (3,287) | | 25,726 | | 38,130 |
Less: Royalties | — | | — | | 1,233 | | 2,767 |
| (4,017) | | (3,287) | | 24,493 | | 35,363 |
| Expenses | | | | | | | |
Purchased Product | (3,256) | | (2,137) | | 11,501 | | 16,878 |
Transportation and Blending | (250) | | (409) | | 5,494 | | 6,023 |
Operating | (416) | | (662) | | 3,093 | | 2,768 |
| Realized (Gain) Loss on Risk Management | 3 | | 7 | | 1 | | 1,638 |
Unrealized (Gain) Loss on Risk Management | 51 | | 2 | | 16 | | (70) |
| Depreciation, Depletion and Amortization | 40 | | 59 | | 2,177 | | 2,162 |
| Exploration Expense | — | | — | | 8 | | 26 |
| (Income) Loss From Equity-Accounted Affiliates | — | | — | | (12) | | (2) |
| Segment Income (Loss) | (189) | | (147) | | 2,215 | | 5,940 |
| General and Administrative | 325 | | 417 | | 325 | | 417 |
| Finance Costs | 387 | | 424 | | 387 | | 424 |
| Interest Income | (67) | | (23) | | (67) | | (23) |
| Integration and Transaction Costs | 37 | | 52 | | 37 | | 52 |
| Foreign Exchange (Gain) Loss, Net | (126) | | 90 | | (126) | | 90 |
| Revaluation (Gain) Loss | 33 | | — | | 33 | | — |
| Re-measurement of Contingent Payments | 16 | | 251 | | 16 | | 251 |
| (Gain) Loss on Divestiture of Assets | (11) | | (304) | | (11) | | (304) |
| Other (Income) Loss, Net | (20) | | (408) | | (20) | | (408) |
| 574 | | 499 | | 574 | | 499 |
| Earnings (Loss) Before Income Tax | | | | | 1,641 | | 5,441 |
| Income Tax Expense (Recovery) | | | | | 139 | | 1,384 |
| Net Earnings (Loss) | | | | | 1,502 | | 4,057 |
| | | | | |
Cenovus Energy Inc. – Q2 2023 Interim Consolidated Financial Statements | 12 |
NOTES TO THE INTERIM CONSOLIDATED FINANCIAL STATEMENTS (unaudited)
All amounts in $ millions, unless otherwise indicated
For the periods ended June 30, 2023
B) Revenues by Product
| | | | | | | | | | | | | | | | | | | | | | | |
| Three Months Ended | | Six Months Ended |
For the periods ended June 30, | 2023 | | 2022 | | 2023 | | 2022 |
| Upstream | | | | | | | |
Crude Oil (1) | 5,808 | | 8,627 | | 11,258 | | 16,759 |
| Natural Gas | 496 | | 811 | | 1,359 | | 1,708 |
NGLs (1) | 352 | | 530 | | 706 | | 1,113 |
| Other | 106 | | 135 | | 258 | | 235 |
| Total Upstream | 6,762 | | 10,103 | | 13,581 | | 19,815 |
| Downstream | | | | | | | |
| Canadian Manufacturing | | | | | | | |
| Synthetic Crude Oil | 456 | | 759 | | 950 | | 1,129 |
| Diesel | 346 | | 524 | | 826 | | 977 |
| Gasoline | 137 | | 311 | | 248 | | 539 |
| Asphalt | 141 | | 150 | | 231 | | 234 |
| Other Products and Services | 283 | | 501 | | 616 | | 973 |
| U.S. Manufacturing | | | | | | | |
| Gasoline | 2,854 | | 4,033 | | 5,514 | | 7,261 |
| Distillates | 2,029 | | 2,991 | | 4,298 | | 5,151 |
| Other Products | 1,315 | | 1,450 | | 2,246 | | 2,571 |
| Total Downstream | 7,561 | | 10,719 | | 14,929 | | 18,835 |
| Corporate and Eliminations | (2,092) | | (1,657) | | (4,017) | | (3,287) |
| Consolidated | 12,231 | | 19,165 | | 24,493 | | 35,363 |
(1)Prior period results have been re-presented. Third-party condensate sales previously included in crude oil have been aggregated with NGLs.
C) Geographical Information
| | | | | | | | | | | | | | | | | | | | | | | |
| Revenues (1) |
| Three Months Ended | | Six Months Ended |
For the periods ended June 30, | 2023 | | 2022 | | 2023 | | 2022 |
| Canada | 5,923 | | 9,673 | | 11,797 | | 18,472 |
| United States | 6,097 | | 9,159 | | 12,179 | | 16,185 |
| China | 211 | | 333 | | 517 | | 706 |
| Consolidated | 12,231 | | 19,165 | | 24,493 | | 35,363 |
(1)Revenues by country are classified based on where the operations are located.
| | | | | | | | | | | |
| Non-Current Assets (1) |
| June 30, | | December 31, |
As at | 2023 | | 2022 |
| Canada | 35,258 | | 35,194 |
| United States | 5,184 | | 4,824 |
| China | 1,846 | | 2,064 |
| Indonesia | 358 | | 365 |
| Consolidated | 42,646 | | 42,447 |
(1)Includes exploration and evaluation (“E&E”) assets, property, plant and equipment (“PP&E”), right-of-use (“ROU”) assets, income tax receivable, investments in equity-accounted affiliates, precious metals, intangible assets and goodwill.
| | | | | |
Cenovus Energy Inc. – Q2 2023 Interim Consolidated Financial Statements | 13 |
NOTES TO THE INTERIM CONSOLIDATED FINANCIAL STATEMENTS (unaudited)
All amounts in $ millions, unless otherwise indicated
For the periods ended June 30, 2023
D) Assets by Segment
| | | | | | | | | | | | | | | | | | | | | | | | | | | | | | | | | | | |
| E&E Assets | | PP&E | | ROU Assets |
| June 30, | | December 31, | | June 30, | | December 31, | | June 30, | | December 31, |
As at | 2023 | | 2022 | | 2023 | | 2022 | | 2023 | | 2022 |
| Oil Sands | 755 | | 674 | | 24,415 | | 24,657 | | 612 | | 638 |
| Conventional | 5 | | 6 | | 2,044 | | 2,020 | | 2 | | 2 |
| Offshore | 5 | | 5 | | 2,594 | | 2,549 | | 143 | | 152 |
Canadian Manufacturing | — | | — | | 2,448 | | 2,466 | | 237 | | 252 |
| U.S. Manufacturing | — | | — | | 4,885 | | 4,482 | | 375 | | 329 |
| Corporate and Eliminations | — | | — | | 312 | | 325 | | 412 | | 472 |
| Consolidated | 765 | | 685 | | 36,698 | | 36,499 | | 1,781 | | 1,845 |
| | | | | | | | | | | | | | | | | | | | | | | |
| Goodwill | | Total Assets |
| June 30, | | December 31, | | June 30, | | December 31, |
As at | 2023 | | 2022 | | 2023 | | 2022 |
| Oil Sands | 2,923 | | 2,923 | | 31,763 | | 32,248 |
| Conventional | — | | — | | 2,260 | | 2,410 |
| Offshore | — | | — | | 3,281 | | 3,339 |
Canadian Manufacturing | — | | — | | 3,227 | | 3,172 |
U.S. Manufacturing | — | | — | | 8,899 | | 8,324 |
Corporate and Eliminations | — | | — | | 4,317 | | 6,376 |
| Consolidated | 2,923 | | 2,923 | | 53,747 | | 55,869 |
E) Capital Expenditures (1)
| | | | | | | | | | | | | | | | | | | | | | | |
| Three Months Ended | | Six Months Ended |
For the periods ended June 30, | 2023 | | 2022 | | 2023 | | 2022 |
| Capital Investment | | | | | | | |
| Oil Sands | 539 | | 376 | | 1,174 | | 751 |
| Conventional | 82 | | 33 | | 223 | | 121 |
| Offshore | | | | | | | |
| Asia Pacific | 1 | | 2 | | 1 | | 2 |
| Atlantic | 183 | | 89 | | 283 | | 142 |
| Total Upstream | 805 | | 500 | | 1,681 | | 1,016 |
| | | | | | | |
| Canadian Manufacturing | 34 | | 38 | | 61 | | 53 |
| U.S. Manufacturing | 153 | | 267 | | 347 | | 474 |
| Total Downstream | 187 | | 305 | | 408 | | 527 |
| | | | | | | |
| Corporate and Eliminations | 10 | | 17 | | 14 | | 25 |
| 1,002 | | 822 | | 2,103 | | 1,568 |
Acquisitions (Note 4) | | | | | | | |
Oil Sands | 1 | | — | | 3 | | — |
| Conventional | 2 | | 1 | | 4 | | 1 |
| | | | | | | |
| | | | | | | |
U.S. Manufacturing (2) | 1 | | — | | 337 | | — |
| | | | | | | |
| 4 | | 1 | | 344 | | 1 |
| | | | | | | |
| Total Capital Expenditures | 1,006 | | 823 | | 2,447 | | 1,569 |
(1)Includes expenditures on PP&E, E&E assets and capitalized interest.
(2)Cenovus was deemed to have disposed of its pre-existing interest in BP-Husky Refining LLC (“Toledo”) and reacquired it at fair value as required by International Financial Reporting Standard 3, “Business Combinations” (“IFRS 3”). The acquisition capital above does not include the fair value of the pre‑existing interest in Toledo of $320 million.
| | | | | |
Cenovus Energy Inc. – Q2 2023 Interim Consolidated Financial Statements | 14 |
NOTES TO THE INTERIM CONSOLIDATED FINANCIAL STATEMENTS (unaudited)
All amounts in $ millions, unless otherwise indicated
For the periods ended June 30, 2023
| | |
|
2. BASIS OF PREPARATION AND STATEMENT OF COMPLIANCE |
In these interim Consolidated Financial Statements, unless otherwise indicated, all dollars are expressed in Canadian dollars. All references to C$ or $ are to Canadian dollars and references to US$ are to U.S. dollars.
These interim Consolidated Financial Statements have been prepared in accordance with IFRS, as issued by the International Accounting Standards Board (“IASB”) applicable to the preparation of interim financial statements, including International Accounting Standard 34, “Interim Financial Reporting”, and have been prepared following the same accounting policies and methods of computation as the annual Consolidated Financial Statements for the year ended December 31, 2022, except for income taxes. Income taxes on earnings or loss in the interim period are accrued using the income tax rate that would be applicable to the expected total annual earnings or loss.
Certain information and disclosures normally included in the notes to the annual Consolidated Financial Statements have been condensed or have been disclosed on an annual basis only. Accordingly, these interim Consolidated Financial Statements should be read in conjunction with the annual Consolidated Financial Statements for the year ended December 31, 2022, which have been prepared in accordance with IFRS as issued by the IASB.
These interim Consolidated Financial Statements were approved by the Board of Directors effective July 26, 2023.
| | |
|
|
3. ACCOUNTING POLICIES, CRITICAL ACCOUNTING JUDGMENTS AND KEY SOURCES OF ESTIMATION UNCERTAINTY |
Accounting policies, a list of critical accounting judgments and key sources of estimation uncertainty can be found in the Company’s annual Consolidated Financial Statements for the year ended December 31, 2022.
Adjustments to Segmented Disclosures
Certain comparative information presented in the Consolidated Statements of Earnings (Loss) and segment disclosures was revised.
In September 2022, the Company completed the divestiture of the majority of the retail fuels business. In December 2022, Management elected to aggregate the remaining commercial fuels business and the historical retail fuels business into the Canadian Manufacturing segment. Comparative periods have been re-presented to reflect this change, with no impact to net earnings (loss), financial position or cash flows.
The following tables reconcile the amounts previously reported in the segmented disclosures to the corresponding revised amounts:
| | | | | | | | | | | | | | | | | | | | | | | | | | | | | | | | | | | |
| Three Months Ended | | Six Months Ended |
For the periods ended June 30, 2022 Canadian Manufacturing Segment | Previously Reported | | Revisions | | Revised Balance | | Previously Reported | | Revisions | | Revised Balance |
| Gross Sales | 1,521 | | | 724 | | | 2,245 | | 2,565 | | | 1,287 | | | 3,852 | |
| Purchased Product | 1,296 | | | 684 | | | 1,980 | | | 2,100 | | | 1,215 | | | 3,315 | |
| Transportation and Blending | (2) | | | 2 | | | — | | | — | | | — | | | — | |
| Operating | 180 | | | 31 | | | 211 | | | 304 | | | 58 | | | 362 | |
| Depreciation, Depletion and Amortization | 64 | | | 8 | | | 72 | | | 106 | | | 16 | | | 122 | |
| (17) | | | (1) | | | (18) | | | 55 | | | (2) | | | 53 | |
| | | | | | | | | | | | | | | | | | | | | | | | | | | | | | | | | | | |
| Three Months Ended | | Six Months Ended |
For the periods ended June 30, 2022 Retail Segment | Previously Reported | | Revisions | | Revised Balance | | Previously Reported | | Revisions | | Revised Balance |
| Gross Sales | 849 | | | (849) | | | — | | | 1,543 | | | (1,543) | | | — | |
| Purchased Product | 811 | | | (811) | | | — | | | 1,471 | | | (1,471) | | | — | |
| Operating | 31 | | | (31) | | | — | | | 58 | | | (58) | | | — | |
| Depreciation, Depletion and Amortization | 8 | | | (8) | | | — | | | 16 | | | (16) | | | — | |
| (1) | | 1 | | | — | | | (2) | | | 2 | | | — | |
| | | | | |
Cenovus Energy Inc. – Q2 2023 Interim Consolidated Financial Statements | 15 |
NOTES TO THE INTERIM CONSOLIDATED FINANCIAL STATEMENTS (unaudited)
All amounts in $ millions, unless otherwise indicated
For the periods ended June 30, 2023
| | | | | | | | | | | | | | | | | | | | | | | | | | | | | | | | | | | |
| Three Months Ended | | Six Months Ended |
For the periods ended June 30, 2022 Corporate and Eliminations Segment | Previously Reported | | Revisions | | Revised Balance | | Previously Reported | | Revisions | | Revised Balance |
| Gross Sales | (1,782) | | | 125 | | | (1,657) | | | (3,543) | | | 256 | | | (3,287) | |
| Purchased Product | (1,111) | | | 125 | | | (986) | | | (2,393) | | | 256 | | | (2,137) | |
| (671) | | — | | (671) | | (1,150) | | — | | | (1,150) |
| | | | | | | | | | | | | | | | | | | | | | | | | | | | | | | | | | | |
| Three Months Ended | | Six Months Ended |
For the periods ended June 30, 2022 Consolidated | Previously Reported | | Revisions | | Revised Balance | | Previously Reported | | Revisions | | Revised Balance |
| Purchased Product | 9,396 | | | (2) | | | 9,394 | | | 16,878 | | | — | | | 16,878 | |
| Transportation and Blending | 3,048 | | | 2 | | | 3,050 | | | 6,023 | | | — | | | 6,023 | |
| 12,444 | | — | | 12,444 | | 22,901 | | — | | 22,901 |
A) BP-Husky Refining LLC
i) Summary of the Acquisition
On February 28, 2023, Cenovus acquired the remaining 50 percent interest in Toledo from BP Products North America Inc. (“bp”), a joint operation (the “Toledo Acquisition”). The Toledo Acquisition provides Cenovus full ownership and operatorship of the refinery, and further integrates Cenovus’s heavy oil production and refining capabilities. Total consideration for the Toledo Acquisition was US$369 million (C$502 million) in cash, including working capital.
The Toledo Acquisition has been accounted for using the acquisition method pursuant to IFRS 3. Under the acquisition method, assets and liabilities are recorded at fair value on the date of acquisition and the total consideration is allocated to the assets acquired and liabilities assumed. The excess of consideration given over the fair value of the net assets acquired, if any, is recorded as goodwill.
ii) Identifiable Assets Acquired and Liabilities Assumed
The preliminary purchase price allocation is based on Management’s best estimate of fair value. Upon finalizing the fair value of net assets acquired, adjustments to initial estimates, including goodwill, may be required.
The following table summarizes the recognized amounts of assets acquired and liabilities assumed at the date of acquisition.
| | | | | | | | |
| As at | | February 28, 2023 |
| 100 Percent of the Identifiable Assets Acquired and Liabilities Assumed | | |
| Cash | | 69 |
| Accounts Receivable and Accrued Revenues | | 3 |
| Inventories | | 453 |
| Property, Plant and Equipment | | 674 |
| Right-of-Use Assets | | 33 |
| Other Assets | | 10 |
| Accounts Payable and Accrued Liabilities | | (138) |
| | |
| Lease Liabilities | | (33) |
| Decommissioning Liabilities | | (5) |
| Other Liabilities | | (70) |
| Total Identifiable Net Assets | | 996 |
The fair value and gross contractual amount of acquired accounts receivable and accrued revenues is $3 million, all of which is expected to be collectible.
| | | | | |
Cenovus Energy Inc. – Q2 2023 Interim Consolidated Financial Statements | 16 |
NOTES TO THE INTERIM CONSOLIDATED FINANCIAL STATEMENTS (unaudited)
All amounts in $ millions, unless otherwise indicated
For the periods ended June 30, 2023
iii) Goodwill
| | | | | | | | | |
| As at | | February 28, 2023 | |
| Total Purchase Consideration | | 502 | |
Fair Value of Pre-Existing 50 Percent Ownership Interest in Toledo | | 494 | |
| Fair Value of Identifiable Net Assets | | (996) | |
| Goodwill | | — | |
Fair Value of Pre-Existing 50 Percent Ownership Interest in BP-Husky Refining LLC
Prior to the Toledo Acquisition, Toledo was jointly controlled with bp and met the definition of a joint operation under IFRS 11, “Joint Arrangements”; therefore, Cenovus recognized its share of the assets, liabilities, revenues and expenses in its consolidated results. Subsequent to the Toledo Acquisition, Cenovus controls Toledo, as defined under IFRS 10, “Consolidated Financial Statements”, and, accordingly Toledo has been consolidated. As required by IFRS 3, when an acquirer achieves control in stages, the previously held interest is re-measured to fair value at the acquisition date with any gain or loss recognized as a revaluation (gain) loss in the Consolidated Statements of Earnings (Loss). When a disposition includes a foreign operation, the associated cumulative amount of foreign exchange differences are reclassified to earnings as part of the revaluation (gain) loss.
The acquisition-date fair value of the previously held interest was estimated to be $494 million and the net carrying value of Toledo assets was $539 million. On February 28, 2023, Cenovus recognized a non-cash revaluation loss of $33 million ($22 million, after tax) on the re-measurement of its existing interest in Toledo to fair value, net of $12 million in associated cumulative foreign exchange differences.
iv) Integration and Transaction Costs
For the three and six months ended June 30, 2023, integration costs of $13 million and $28 million, respectively, and transaction costs of $4 million and $9 million, respectively, associated with the Toledo Acquisition were recognized in the Consolidated Statements of Earnings (Loss).
v) Revenue and Profit Contribution
The acquired business contributed revenues of $604 million and net loss of $176 million for the period from February 28, 2023, to June 30, 2023. On September 20, 2022, an incident occurred at the Toledo Refinery, resulting in the shutdown of the facility. The Toledo Refinery was fully operational in June. If the closing of the Toledo Acquisition had occurred on January 1, 2023, Cenovus’s consolidated pro forma revenues and net earnings for the six months ended June 30, 2023, would have been $24.5 billion and $1.4 billion, respectively. These amounts have been calculated using results from the acquired business, adjusting them for:
•Additional DD&A that would have been charged assuming the fair value adjustments to PP&E had applied from January 1, 2023.
•Additional accretion on the decommissioning liabilities if they had been assumed on January 1, 2023.
•The consequential tax effects.
This pro forma information is not necessarily indicative of the results that would have been obtained if the Toledo Acquisition had actually occurred on January 1, 2023.
B) Sunrise Oil Sands Partnership
On August 31, 2022, Cenovus closed a transaction with BP Canada Energy Group ULC (“bp Canada”) to purchase the remaining 50 percent interest in Sunrise Oil Sands Partnership (“SOSP”), previously a joint operation, in northern Alberta (the “Sunrise Acquisition”). It provided Cenovus with full ownership and further enhanced Cenovus’s core strength in the oil sands.
The final purchase price allocation was based on Management’s best estimate of the assets acquired and liabilities assumed. No additional adjustments were made to the purchase price allocation in the period. For more details, see Note 5 of the annual Consolidated Financial Statements for the year ended December 31, 2022.
| | | | | |
Cenovus Energy Inc. – Q2 2023 Interim Consolidated Financial Statements | 17 |
NOTES TO THE INTERIM CONSOLIDATED FINANCIAL STATEMENTS (unaudited)
All amounts in $ millions, unless otherwise indicated
For the periods ended June 30, 2023
| | | | | | | | | | | | | | | | | | | | | | | |
| | | |
| Three Months Ended | | Six Months Ended |
For the periods ended June 30, | 2023 | | 2022 | | 2023 | | 2022 |
| Interest Expense – Short-Term Borrowings and Long-Term Debt | 95 | | 130 | | 191 | | 260 |
Net Premium (Discount) on Redemption of Long-Term Debt (1) | — | | (32) | | — | | (25) |
Interest Expense – Lease Liabilities (Note 15) | 40 | | 41 | | 80 | | 83 |
Unwinding of Discount on Decommissioning Liabilities (Note 17) | 55 | | 45 | | 110 | | 89 |
| Other | 7 | | 12 | | 13 | | 18 |
| 197 | | 196 | | 394 | | 425 |
| Capitalized Interest | (4) | | (1) | | (7) | | (1) |
| 193 | | 195 | | 387 | | 424 |
(1)Includes the premium or discount on redemption, net of transaction costs and the amortization of associated fair value adjustments.
| | |
|
6. FOREIGN EXCHANGE (GAIN) LOSS, NET |
| | | | | | | | | | | | | | | | | | | | | | | |
| | | | | | | |
| Three Months Ended | | Six Months Ended |
For the periods ended June 30, | 2023 | | 2022 | | 2023 | | 2022 |
| Unrealized Foreign Exchange (Gain) Loss on Translation of: | | | | | | | |
| U.S. Dollar Debt Issued From Canada | (142) | | 273 | | (147) | | 120 |
| Other | (30) | | (13) | | (11) | | 1 |
| Unrealized Foreign Exchange (Gain) Loss | (172) | | 260 | | (158) | | 121 |
| Realized Foreign Exchange (Gain) Loss | 53 | | (68) | | 32 | | (31) |
| (119) | | 192 | | (126) | | 90 |
The provision for income taxes is:
| | | | | | | | | | | | | | | | | | | | | | | |
| | | |
| Three Months Ended | | Six Months Ended |
For the periods ended June 30, | 2023 | | 2022 | | 2023 | | 2022 |
| Current Tax | | | | | | | |
| Canada | 199 | | 570 | | 457 | | 937 |
| United States | (17) | | 261 | | — | | 281 |
| Asia Pacific | 38 | | 71 | | 84 | | 109 |
| Other International | 6 | | — | | 12 | | — |
| Total Current Tax Expense (Recovery) | 226 | | 902 | | 553 | | 1,327 |
| Deferred Tax Expense (Recovery) | (44) | | (61) | | (414) | | 57 |
| 182 | | 841 | | 139 | | 1,384 |
For the six months ended June 30, 2023, Cenovus recorded a current tax expense in all jurisdictions in which the Company operates, other than the U.S. The decrease from the prior year is due to lower earnings in the first six months of 2023. For the six months ended June 30, 2023, Cenovus incurred a deferred tax recovery of $414 million of which $176 million related to a step-up in the tax basis on the Toledo Acquisition on February 28, 2023.
| | | | | |
Cenovus Energy Inc. – Q2 2023 Interim Consolidated Financial Statements | 18 |
NOTES TO THE INTERIM CONSOLIDATED FINANCIAL STATEMENTS (unaudited)
All amounts in $ millions, unless otherwise indicated
For the periods ended June 30, 2023
A) Net Earnings (Loss) Per Common Share – Basic and Diluted
| | | | | | | | | | | | | | | | | | | | | | | |
| Three Months Ended | | Six Months Ended |
For the periods ended June 30, | 2023 | | 2022 | | 2023 | | 2022 |
| Net Earnings (Loss) | 866 | | 2,432 | | 1,502 | | 4,057 |
| Effect of Cumulative Dividends on Preferred Shares | (9) | | (8) | | (18) | | (17) |
| Net Earnings (Loss) – Basic and Diluted | 857 | | 2,424 | | 1,484 | | 4,040 |
| | | | | | | |
| Basic – Weighted Average Number of Shares | 1,903 | | 1,971 | | 1,906 | | 1,981 |
| Dilutive Effect of Warrants | 33 | | 47 | | 37 | | 46 |
| Dilutive Effect of Net Settlement Rights | 6 | | 11 | | 7 | | 12 |
Dilutive Effect of Cenovus Replacement Stock Options (1) | 1 | | — | | 1 | | — |
| Diluted – Weighted Average Number of Shares | 1,943 | | 2,029 | | 1,951 | | 2,039 |
| | | | | | | |
Net Earnings (Loss) Per Common Share – Basic ($) | 0.45 | | 1.23 | | 0.78 | | 2.04 |
Net Earnings (Loss) Per Common Share – Diluted (1) (2) ($) | 0.44 | | 1.19 | | 0.76 | | 1.98 |
(1)For the three and six months ended June 30, 2023, the dilutive effect of Cenovus replacement stock options was 1 million common shares. For the three and six months ended June 30, 2022, net earnings of $24 million and $41 million, respectively, and common shares of 2 million and 2 million, respectively, related to the assumed exercise of the Cenovus replacement stock options were excluded from the calculation of dilutive net earnings (loss) per share as the impact was anti-dilutive.
(2)For the three and six months ended June 30, 2023, net settlement rights (“NSRs”) of 2 million (three and six months ended June 30, 2022 – nil and 2 million, respectively) were excluded from the calculation of diluted weighted average number of shares as the effect would have been anti-dilutive or the exercise prices exceeded the market price of Cenovus’s common shares.
B) Common Share Dividends
| | | | | | | | | | | | | | | | | | | | | | | |
| 2023 | | 2022 |
For the six months ended June 30, | Per Share | | Amount | | Per Share | | Amount |
| Base Dividends | 0.245 | | 465 | | 0.140 | | 276 |
| Variable Dividends | — | | — | | — | | — |
| Total Common Share Dividends Declared and Paid | 0.245 | | 465 | | 0.140 | | 276 |
The declaration of common share dividends is at the sole discretion of the Company’s Board of Directors and is considered quarterly. On July 26, 2023, the Company’s Board of Directors declared a third quarter base dividend of $0.140 per common share, payable on September 29, 2023, to common shareholders of record as at September 15, 2023.
C) Preferred Share Dividends
| | | | | | | | | | | | | | | | | | | | | | | |
| Three Months Ended | | Six Months Ended |
For the periods ended June 30, | 2023 | | 2022 | | 2023 | | 2022 |
| Series 1 First Preferred Shares | 1 | | 2 | | 3 | | 4 |
| Series 2 First Preferred Shares | 1 | | — | | 1 | | — |
| Series 3 First Preferred Shares | 3 | | 3 | | 6 | | 6 |
| Series 5 First Preferred Shares | 3 | | 2 | | 5 | | 4 |
| Series 7 First Preferred Shares | 1 | | 1 | | 3 | | 3 |
| Total Preferred Share Dividends Declared | 9 | | 8 | | 18 | | 17 |
The declaration of preferred share dividends is at the sole discretion of the Company’s Board of Directors and is considered quarterly.
In the three and six months ended June 30, 2023, the Company paid $9 million and $27 million, respectively, in preferred share dividends (three and six months ended June 30, 2022 — $8 million and $17 million, respectively).
On July 26, 2023, the Company’s Board of Directors declared third quarter dividends of $9 million payable on October 3, 2023, to preferred shareholders of record as at September 15, 2023.
| | | | | |
Cenovus Energy Inc. – Q2 2023 Interim Consolidated Financial Statements | 19 |
NOTES TO THE INTERIM CONSOLIDATED FINANCIAL STATEMENTS (unaudited)
All amounts in $ millions, unless otherwise indicated
For the periods ended June 30, 2023
| | |
|
9. EXPLORATION AND EVALUATION ASSETS, NET |
| | | | | |
| Total |
As at December 31, 2022 | 685 |
| Additions | 81 |
| |
| |
| |
| |
Exchange Rate Movements and Other | (1) |
As at June 30, 2023 | 765 |
| | |
|
10. PROPERTY, PLANT AND EQUIPMENT, NET |
| | | | | | | | | | | | | | | | | | | | | | | | | | | | | |
| Crude Oil and Natural Gas Properties | | Processing, Transportation and Storage Assets | | Manufacturing Assets | | Other Assets (1) | | Total |
| COST | | | | | | | | | |
As at December 31, 2022 | 43,528 | | 254 | | 12,132 | | 1,825 | | 57,739 |
Acquisitions (Note 4) (2) | 7 | | — | | 674 | | — | | 681 |
| Additions | 1,600 | | 17 | | 391 | | 14 | | 2,022 |
| Change in Decommissioning Liabilities | 38 | | — | | 3 | | — | | 41 |
Divestitures (Note 4) (2) | (17) | | — | | (633) | | (1) | | (651) |
| Exchange Rate Movements and Other | (57) | | 5 | | (247) | | (8) | | (307) |
| | | | | | | | | |
As at June 30, 2023 | 45,099 | | 276 | | 12,320 | | 1,830 | | 59,525 |
| | | | | | | | | |
| ACCUMULATED DEPRECIATION, DEPLETION AND AMORTIZATION | | | | | | | | | |
As at December 31, 2022 | 14,302 | | 106 | | 5,547 | | 1,285 | | 21,240 |
| Depreciation, Depletion and Amortization | 1,758 | | 5 | | 241 | | 29 | | 2,033 |
| | | | | | | | | |
| | | | | | | | | |
Divestitures (Note 4) (2) | (8) | | — | | (299) | | — | | (307) |
| Exchange Rate Movements and Other | (6) | | 5 | | (131) | | (7) | | (139) |
| | | | | | | | | |
As at June 30, 2023 | 16,046 | | 116 | | 5,358 | | 1,307 | | 22,827 |
| | | | | | | | | |
| CARRYING VALUE | | | | | | | | | |
As at December 31, 2022 | 29,226 | | 148 | | 6,585 | | 540 | | 36,499 |
As at June 30, 2023 | 29,053 | | 160 | | 6,962 | | 523 | | 36,698 |
(1)Includes assets within the commercial fuels business, office furniture, fixtures, leasehold improvements, information technology and aircraft.
(2)In connection with the Toledo Acquisition, Cenovus was deemed to have disposed of its pre-existing interest and reacquired it at fair value as required by IFRS 3. As at February 28, 2023, the carrying value of the pre-existing interest in Toledo’s PP&E was $334 million.
| | | | | |
Cenovus Energy Inc. – Q2 2023 Interim Consolidated Financial Statements | 20 |
NOTES TO THE INTERIM CONSOLIDATED FINANCIAL STATEMENTS (unaudited)
All amounts in $ millions, unless otherwise indicated
For the periods ended June 30, 2023
| | |
|
11. RIGHT-OF-USE ASSETS, NET |
| | | | | | | | | | | | | | | | | | | | | | | | | | | | | |
| Real Estate | | Transportation and Storage Assets (1) | | Manufacturing Assets | | Other Assets (2) | | Total |
| COST | | | | | | | | | |
As at December 31, 2022 | 599 | | 1,840 | | 174 | | 74 | | 2,687 |
Acquisitions (Note 4) (3) | 1 | | 24 | | 8 | | — | | 33 |
| Additions | 1 | | 25 | | — | | — | | 26 |
| | | | | | | | | |
| Modifications | (1) | | 31 | | 1 | | 1 | | 32 |
| Re-measurements | — | | 8 | | — | | 1 | | 9 |
Divestitures (Note 4) (3) | — | | — | | (19) | | — | | (19) |
| Terminations | (2) | | (3) | | — | | (2) | | (7) |
| Exchange Rate Movements and Other | (4) | | (9) | | (3) | | (5) | | (21) |
| | | | | | | | | |
As at June 30, 2023 | 594 | | 1,916 | | 161 | | 69 | | 2,740 |
| | | | | | | | | |
| ACCUMULATED DEPRECIATION | | | | | | | | | |
As at December 31, 2022 | 127 | | 645 | | 58 | | 12 | | 842 |
| Depreciation | 18 | | 108 | | 11 | | 7 | | 144 |
| | | | | | | | | |
Divestitures (Note 4) (3) | — | | — | | (12) | | — | | (12) |
| Terminations | (1) | | (2) | | — | | (1) | | (4) |
| Exchange Rate Movements and Other | (2) | | (5) | | (3) | | (1) | | (11) |
| | | | | | | | | |
As at June 30, 2023 | 142 | | 746 | | 54 | | 17 | | 959 |
| | | | | | | | | |
| CARRYING VALUE | | | | | | | | | |
As at December 31, 2022 | 472 | | 1,195 | | 116 | | 62 | | 1,845 |
As at June 30, 2023 | 452 | | 1,170 | | 107 | | 52 | | 1,781 |
(1)Transportation and storage assets include railcars, barges, vessels, pipelines, caverns and storage tanks.
(2)Includes assets in the commercial fuels business, fleet vehicles and other equipment.
(3)In connection with the Toledo Acquisition, Cenovus was deemed to have disposed of its pre-existing interest and reacquired it at fair value as required by IFRS 3. As at February 28, 2023, the carrying value of the pre-existing interest in Toledo’s ROU assets was $7 million.
A) Joint Operations
Cenovus has a number of joint operations in the Upstream segments. The Company also holds the following joint operation in the U.S. Manufacturing segment.
WRB Refining LP (“WRB”)
Cenovus holds a 50 percent interest in the Wood River and Borger refineries with Phillips 66. Phillips 66 holds the remaining 50 percent interest and is the operator of the Wood River Refinery in Illinois and the Borger Refinery in Texas.
B) Joint Ventures
Husky-CNOOC Madura Ltd.
The Company holds a 40 percent interest in the jointly controlled entity, HCML, which is engaged in the exploration for and production of NGLs and natural gas in offshore Indonesia. The Company’s share of equity investment income (loss) related to the joint venture is included in the Consolidated Statements of Earnings (Loss) in the Offshore segment.
Summarized below is the financial information for HCML accounted for using the equity method.
| | | | | |
Cenovus Energy Inc. – Q2 2023 Interim Consolidated Financial Statements | 21 |
NOTES TO THE INTERIM CONSOLIDATED FINANCIAL STATEMENTS (unaudited)
All amounts in $ millions, unless otherwise indicated
For the periods ended June 30, 2023
Results of Operations
| | | | | | | | | | | | | | | |
| | | Six Months Ended |
For the periods ended June 30, | | | | | 2023 | | 2022 |
| Revenue | | | | | 283 | | 129 |
| Expenses | | | | | 215 | | 127 |
| Net Earnings (Loss) | | | | | 68 | | 2 |
Balance Sheet
| | | | | | | | | | | |
| June 30, | | December 31, |
As at | 2023 | | 2022 |
Current Assets (1) | 279 | | 247 |
| Non-Current Assets | 1,794 | | 1,926 |
| Current Liabilities | 114 | | 160 |
Non-Current Liabilities | 1,161 | | 1,293 |
| Net Assets | 798 | | 720 |
(1)Includes cash and cash equivalents of $84 million (December 31, 2022 – $64 million).
For the six months ended June 30, 2023, the Company’s share of income from the equity-accounted affiliate was $18 million (2022 – $10 million). As at June 30, 2023, the carrying amount of the Company’s share of net assets was $358 million (December 31, 2022 – $365 million). These amounts do not equal the 40 percent joint control of the revenues, expenses and net assets of HCML due to differences in the values attributed to the investment and accounting policies between the joint venture and the Company.
For the six months ended June 30, 2023, the Company received $38 million of distributions from HCML (2022 – $19 million) and paid $24 million in contributions (2022 – $25 million).
Husky Midstream Limited Partnership
The Company jointly owns and is the operator of HMLP, which owns midstream assets, including pipeline, storage and other ancillary infrastructure assets in Alberta and Saskatchewan. The Company holds a 35 percent interest in HMLP, with Power Assets Holdings Limited holding a 49 percent interest and CK Infrastructure Holdings Limited holding a 16 percent interest in HMLP.
For the six months ended June 30, 2023, HMLP had net earnings of $84 million (2022 – $80 million). The Company’s share of (income) loss from the equity-accounted affiliate does not equal the 35 percent of the net earnings of HMLP due to the nature of the profit-sharing arrangement as set forth in the partnership agreement. The Company’s share of earnings will fluctuate depending on certain income thresholds of HMLP. For the six months ended June 30, 2023, the Company did not record its share of pre-tax loss relating to HMLP of $8 million (2022 – pre-tax loss of $6 million). The carrying value was $nil at June 30, 2023 (December 31, 2022 – $nil).
As at June 30, 2023, the Company had $33 million in cumulative unrecognized losses and other comprehensive income (“OCI”), net of tax (June 30, 2022 – $17 million). The Company records its share of equity investment income related to the joint venture only in excess of the cumulated unrecognized loss and is included in the Consolidated Statements of Earnings (Loss) in the Oil Sands segment.
For the six months ended June 30, 2023, the Company received $56 million of distributions from HMLP (2022 – $22 million) and paid $62 million in contributions (2022 – $30 million). The net amount of the distributions received and contributions paid is recorded in (income) loss from equity-accounted affiliates in the Oil Sands segment.
| | | | | |
Cenovus Energy Inc. – Q2 2023 Interim Consolidated Financial Statements | 22 |
NOTES TO THE INTERIM CONSOLIDATED FINANCIAL STATEMENTS (unaudited)
All amounts in $ millions, unless otherwise indicated
For the periods ended June 30, 2023
| | | | | | | | | | | |
| June 30, | | December 31, |
As at | 2023 | | 2022 |
Long-Term Receivables and Prepaids | 65 | | 120 |
| Precious Metals | 82 | | 86 |
| Net Investment in Finance Leases | 63 | | 62 |
Private Equity Investments (Note 23) | 63 | | 55 |
| Intangible Assets | 14 | | 19 |
| | | |
| | | |
| 287 | | 342 |
| | |
|
14. DEBT AND CAPITAL STRUCTURE |
A) Short-Term Borrowings
| | | | | | | | | | | | | | | | | |
| | | June 30, | | December 31, |
As at | Notes | | 2023 | | 2022 |
| Uncommitted Demand Facilities | i | | — | | — |
| | | | | |
| WRB Uncommitted Demand Facilities | ii | | — | | 115 |
| Total Debt Principal | | | — | | 115 |
i) Uncommitted Demand Facilities
As at June 30, 2023, the Company had uncommitted demand facilities of $1.9 billion (December 31, 2022 – $1.9 billion) in place, of which $1.4 billion may be drawn for general purposes, or the full amount may be available to issue letters of credit. As at June 30, 2023, there were outstanding letters of credit aggregating to $390 million (December 31, 2022 – $490 million) and no direct borrowings.
ii) WRB Uncommitted Demand Facilities
WRB has uncommitted demand facilities of US$450 million that may be used to cover short-term working capital requirements, of which Cenovus’s proportionate share is 50 percent. As at June 30, 2023, Cenovus’s proportionate share drawn on the facilities was $nil. As at December 31, 2022, Cenovus’s proportionate share of the capacity was US$225 million and US$85 million (C$115 million) of this capacity was drawn.
B) Long-Term Debt
| | | | | | | | | | | | | | | | | |
| | | June 30, | | December 31, |
As at | | | 2023 | | 2022 |
Committed Credit Facility (1) | | | — | | — |
U.S. Dollar Denominated Unsecured Notes (2) | | | 6,390 | | 6,537 |
| Canadian Dollar Unsecured Notes | | | 2,000 | | 2,000 |
| Total Debt Principal | | | 8,390 | | 8,537 |
| Debt Premiums (Discounts), Net, and Transaction Costs | | | 144 | | 154 |
| Long-Term Debt | | | 8,534 | | 8,691 |
| | | | | |
| | | | | |
(1) The committed credit facility may include Bankers’ Acceptances, secured overnight financing rate loans, prime rate loans and U.S. base rate loans.
(2)Total U.S. dollar denominated unsecured notes as at June 30, 2023, was US$4.8 billion (December 31, 2022 – US$4.8 billion).
As at June 30, 2023, the Company had in place a committed credit facility that consists of a $1.8 billion tranche maturing on November 10, 2025, and a $3.7 billion tranche maturing on November 10, 2026. As at June 30, 2023, no amount was drawn on the credit facility (December 31, 2022 – $nil).
As at June 30, 2023, the Company was in compliance with all of the terms of its debt agreements. Under the terms of Cenovus’s committed credit facility, the Company is required to maintain a total debt to capitalization ratio, as defined in the agreements, not to exceed 65 percent. The Company is well below this limit.
| | | | | |
Cenovus Energy Inc. – Q2 2023 Interim Consolidated Financial Statements | 23 |
NOTES TO THE INTERIM CONSOLIDATED FINANCIAL STATEMENTS (unaudited)
All amounts in $ millions, unless otherwise indicated
For the periods ended June 30, 2023
C) Capital Structure
Cenovus’s capital structure consists of shareholders’ equity plus Net Debt. Net Debt includes the Company’s short-term borrowings, and the current and long-term portions of long-term debt, net of cash and cash equivalents and short-term investments. Net Debt is used in managing the Company’s capital structure. The Company’s objectives when managing its capital structure are to maintain financial flexibility, preserve access to capital markets, ensure its ability to finance internally generated growth and to fund potential acquisitions while maintaining the ability to meet the Company’s financial obligations as they come due. To ensure financial resilience, Cenovus may, among other actions, adjust capital and operating spending, draw down on its credit facilities or repay existing debt, adjust dividends paid to shareholders, purchase the Company’s common shares or preferred shares for cancellation, issue new debt, or issue new shares.
Cenovus monitors its capital structure and financing requirements using, among other things, specified financial measures consisting of Total Debt, Net Debt to adjusted earnings before interest, taxes and DD&A (“Adjusted EBITDA”), Net Debt to Adjusted Funds Flow and Net Debt to Capitalization. These measures are used to steward Cenovus’s overall debt position as measures of Cenovus’s overall financial strength.
Cenovus targets a Net Debt to Adjusted EBITDA ratio and a Net Debt to Adjusted Funds Flow ratio of approximately 1.0 times and Net Debt at or below $4 billion over the long-term at a West Texas Intermediate (“WTI”) price of US$45.00 per barrel. These measures may fluctuate periodically outside this range due to factors such as persistently high or low commodity prices.
Net Debt to Adjusted EBITDA
| | | | | | | | | | | |
| June 30, | | December 31, |
As at | 2023 | | 2022 |
| Short-Term Borrowings | — | | 115 |
| Current Portion of Long-Term Debt | — | | — |
| Long-Term Portion of Long-Term Debt | 8,534 | | 8,691 |
| Total Debt | 8,534 | | 8,806 |
| Less: Cash and Cash Equivalents | (2,167) | | (4,524) |
| Net Debt | 6,367 | | 4,282 |
| | | |
| Net Earnings (Loss) | 3,895 | | 6,450 |
| Add (Deduct): | | | |
| Finance Costs | 783 | | 820 |
| Interest Income | (125) | | (81) |
| Income Tax Expense (Recovery) | 1,036 | | 2,281 |
| Depreciation, Depletion and Amortization | 4,694 | | 4,679 |
| Exploration and Evaluation Asset Write-downs | 64 | | 64 |
| (Income) Loss From Equity-Accounted Affiliates | (25) | | (15) |
| Unrealized (Gain) Loss on Risk Management | (40) | | (126) |
| Foreign Exchange (Gain) Loss, Net | 127 | | 343 |
| Revaluation (Gain) Loss | (516) | | (549) |
| Re-measurement of Contingent Payments | (73) | | 162 |
| (Gain) Loss on Divestiture of Assets | 24 | | (269) |
| Other (Income) Loss, Net | (144) | | (532) |
Adjusted EBITDA (1) | 9,700 | | 13,227 |
| | | |
| Net Debt to Adjusted EBITDA | 0.7x | | 0.3x |
(1)Calculated on a trailing twelve-month basis.
| | | | | |
Cenovus Energy Inc. – Q2 2023 Interim Consolidated Financial Statements | 24 |
NOTES TO THE INTERIM CONSOLIDATED FINANCIAL STATEMENTS (unaudited)
All amounts in $ millions, unless otherwise indicated
For the periods ended June 30, 2023
Net Debt to Adjusted Funds Flow
| | | | | | | | | | | |
| June 30, | | December 31, |
As at | 2023 | | 2022 |
| Net Debt | 6,367 | | 4,282 |
| | | |
| Cash From (Used in) Operating Activities | 8,763 | | 11,403 |
| (Add) Deduct: | | | |
| Settlement of Decommissioning Liabilities | (193) | | (150) |
| Net Change in Non-Cash Working Capital | 365 | | 575 |
Adjusted Funds Flow (1) | 8,591 | | 10,978 |
| | | |
| Net Debt to Adjusted Funds Flow | 0.7x | | 0.4x |
(1)Calculated on a trailing twelve-month basis.
Net Debt to Capitalization
| | | | | | | | | | | |
| June 30, | | December 31, |
As at | 2023 | | 2022 |
| Net Debt | 6,367 | | 4,282 |
Shareholders’ Equity | 27,279 | | 27,576 |
| Capitalization | 33,646 | | 31,858 |
| | | |
| Net Debt to Capitalization | 19 | % | | 13 | % |
| | | | | |
| Total |
As at December 31, 2022 | 2,836 |
Acquisitions (Note 4) (1) | 33 |
| Additions | 26 |
Interest Expense (Note 5) | 80 |
| Lease Payments | (226) |
| Modifications | 32 |
| Re-measurements | 9 |
Divestitures (Note 4) (1) | (11) |
| Terminations | (4) |
| Exchange Rate Movements and Other | (1) |
| |
As at June 30, 2023 | 2,774 |
| Less: Current Portion | 274 |
| Long-Term Portion | 2,500 |
(1)In connection with the Toledo Acquisition, Cenovus was deemed to have disposed of its pre-existing interest and reacquired it at fair value as required by IFRS 3. As at February 28, 2023, the carrying value of the pre-existing interest in Toledo’s lease liabilities was $11 million.
The Company has lease liabilities for contracts related to office space, transportation and storage assets, which includes barges, vessels, pipelines, caverns, railcars and storage tanks, commercial fuels assets and other refining and field equipment. Lease terms are negotiated on an individual basis and contain a wide range of different terms and conditions.
The Company has variable lease payments related to property taxes for real estate contracts. Short-term leases are leases with terms of twelve months or less.
The Company includes extension options in the calculation of lease liabilities when the Company has the right to extend a lease term at its discretion and is reasonably certain to exercise the extension option. The Company does not have any significant termination options and the residual amounts are not material.
| | | | | |
Cenovus Energy Inc. – Q2 2023 Interim Consolidated Financial Statements | 25 |
NOTES TO THE INTERIM CONSOLIDATED FINANCIAL STATEMENTS (unaudited)
All amounts in $ millions, unless otherwise indicated
For the periods ended June 30, 2023
In connection with the Sunrise Acquisition, Cenovus agreed to make quarterly variable payments, up to $600 million, from SOSP to bp Canada for up to eight quarters subsequent to August 31, 2022, when the average Western Canadian Select (“WCS”) price in a quarter exceeds $52.00 per barrel. The quarterly payment is calculated as $2.8 million plus the difference between the average WCS price less $53.00 multiplied by $2.8 million, for any of the eight quarters the average WCS price is equal to or greater than $52.00 per barrel. If the average WCS price is less than $52.00 per barrel, no payment will be made for that quarter. As at June 30, 2023, the maximum payment over the remaining term of the contract is $393 million.
The variable payment will be re-measured to fair value at each reporting date, with changes in fair value recorded to re-measurement of contingent payments in the Consolidated Statements of Earnings (Loss).
Payments made during the six months ended June 30, 2023, totaled $134 million for the quarterly payment periods ending November 30, 2022, and February 28, 2023.
| | | | | |
| Total |
As at December 31, 2022 | 419 |
| |
| Liabilities Settled or Payable | (115) |
Re-measurement | 16 |
As at June 30, 2023 | 320 |
| Less: Current Portion | 262 |
| Long-Term Portion | 58 |
| | |
|
17. DECOMMISSIONING LIABILITIES |
The decommissioning provision represents the present value of the expected future costs associated with the retirement of producing well sites, upstream processing facilities, surface and subsea plant and equipment, manufacturing facilities, the commercial fuels assets and the crude-by-rail terminal.
The aggregate carrying amount of the obligation is:
| | | | | |
| Total |
As at December 31, 2022 | 3,559 |
| |
| Liabilities Incurred | 7 |
Liabilities Acquired (Note 4) (1) | 5 |
| Liabilities Settled | (90) |
Liabilities Disposed (Note 4) (1) | (4) |
| |
| Change in Estimated Future Cash Flows | 34 |
| |
Unwinding of Discount on Decommissioning Liabilities (Note 5) | 110 |
| Exchange Rate Movements and Other | (16) |
As at June 30, 2023 | 3,605 |
(1)In connection with the Toledo Acquisition, Cenovus was deemed to have disposed of its pre-existing interest and reacquired it at fair value as required by IFRS 3. As at February 28, 2023, the carrying value of the pre-existing interest in Toledo’s decommissioning liabilities was $2 million.
As at June 30, 2023, the undiscounted amount of estimated future cash flows required to settle the obligation has been discounted using a credit-adjusted risk-free rate of 6.1 percent (December 31, 2022 – 6.1 percent) and assumes an inflation rate of two percent (December 31, 2022 – two percent).
The Company deposits cash into restricted accounts that will be used to fund decommissioning liabilities in offshore China in accordance with the provisions of the regulations of the People’s Republic of China. As at June 30, 2023, the Company had $202 million in restricted cash (December 31, 2022 – $209 million).
| | | | | |
Cenovus Energy Inc. – Q2 2023 Interim Consolidated Financial Statements | 26 |
NOTES TO THE INTERIM CONSOLIDATED FINANCIAL STATEMENTS (unaudited)
All amounts in $ millions, unless otherwise indicated
For the periods ended June 30, 2023
| | | | | | | | | | | |
| June 30, | | December 31, |
As at | 2023 | | 2022 |
Renewable Volume Obligation, Net (1) | 244 | | 101 |
| Pension and Other Post-Employment Benefit Plan | 225 | | 201 |
Provision for West White Rose Expansion Project | 184 | | 204 |
| Provisions for Onerous and Unfavourable Contracts | 82 | | 95 |
| Employee Long-Term Incentives | 86 | | 245 |
| Drilling Provisions | 25 | | 31 |
| Deferred Revenue | 39 | | 45 |
| Other | 159 | | 120 |
| 1,044 | | 1,042 |
(1)The gross amounts of the renewable volume obligation and renewable identification numbers asset were $1.0 billion and $0.8 billion, respectively (December 31, 2022 — $1.1 billion and $1.0 billion, respectively).
| | |
|
19. SHARE CAPITAL AND WARRANTS |
A) Authorized
Cenovus is authorized to issue an unlimited number of common shares, and first and second preferred shares not exceeding, in aggregate, 20 percent of the number of issued and outstanding common shares. The first and second preferred shares may be issued in one or more series with rights and conditions to be determined by the Board of Directors prior to issuance and subject to the Company’s articles.
B) Issued and Outstanding – Common Shares
| | | | | | | | | | | | | | | | | | | | | | | |
| June 30, 2023 | | December 31, 2022 |
| Number of Common Shares (thousands) | | Amount | | Number of Common Shares (thousands) | | Amount |
| Outstanding, Beginning of Year | 1,909,190 | | 16,320 | | 2,001,211 | | 17,016 |
| | | | | | | |
| Issued Upon Exercise of Warrants | 1,645 | | 16 | | 9,399 | | 93 |
| Issued Under Stock Option Plans | 1,266 | | 23 | | 11,069 | | 170 |
| Purchase of Common Shares Under NCIBs | (15,608) | | (133) | | (112,489) | | (959) |
| Outstanding, End of Period | 1,896,493 | | 16,226 | | 1,909,190 | | 16,320 |
As at June 30, 2023, there were 43.1 million (December 31, 2022 – 43.1 million) common shares available for future issuance under the stock option plan.
C) Normal Course Issuer Bid
On November 7, 2022, the Company received approval from the TSX to renew the Company’s NCIB program (the “2023 NCIB”) to purchase up to 136.7 million common shares during the period from November 9, 2022, to November 8, 2023.
For the six months ended June 30, 2023, the Company purchased and cancelled 15.6 million common shares through the 2023 NCIB. The shares were purchased at a volume weighted average price of $22.43 per common share for a total of $350 million. Paid in surplus was reduced by $217 million, representing the excess of the purchase price of the common shares over their average carrying value.
| | | | | |
Cenovus Energy Inc. – Q2 2023 Interim Consolidated Financial Statements | 27 |
NOTES TO THE INTERIM CONSOLIDATED FINANCIAL STATEMENTS (unaudited)
All amounts in $ millions, unless otherwise indicated
For the periods ended June 30, 2023
D) Issued and Outstanding – Preferred Shares
For the six months ended June 30, 2023, there were no preferred shares issued. As at June 30, 2023, there were 36 million preferred shares outstanding (December 31, 2022 – 36 million), with a carrying value of $519 million (December 31, 2022 – $519 million).
| | | | | | | | | | | | | | | | | |
As at June 30, 2023 | Dividend Reset Date | | Dividend Rate | | Number of Preferred Shares (thousands) |
| Series 1 First Preferred Shares | March 31, 2026 | | 2.58 | % | | 10,740 |
Series 2 First Preferred Shares (1) | Quarterly | | 6.29 | % | | 1,260 |
| Series 3 First Preferred Shares | December 31, 2024 | | 4.69 | % | | 10,000 |
| Series 5 First Preferred Shares | March 31, 2025 | | 4.59 | % | | 8,000 |
| Series 7 First Preferred Shares | June 30, 2025 | | 3.94 | % | | 6,000 |
(1) The floating-rate dividend was 5.86 percent for the period from December 31, 2022, to March 30, 2023, and 6.29 percent for the period from March 31, 2023, to June 29, 2023.
E) Issued and Outstanding – Warrants
| | | | | | | | | | | | | | | | | | | | | | | |
| June 30, 2023 | | December 31, 2022 |
| Number of Warrants (thousands) | | Amount | | Number of Warrants (thousands) | | Amount |
| Outstanding, Beginning of Year | 55,720 | | 184 | | 65,119 | | 215 |
| | | | | | | |
| Exercised | (1,645) | | (5) | | (9,399) | | (31) |
| Purchased and Cancelled | (45,485) | | (151) | | — | | — |
| Outstanding, End of Period | 8,590 | | 28 | | 55,720 | | 184 |
The exercise price of the Cenovus warrants is $6.54 per share.
On June 14, 2023, Cenovus purchased and cancelled 45.5 million warrants. The price for each warrant purchased represents a price of $22.18 per common share, less the warrant exercise price of $6.54 per common share, for a total of $711 million. Retained earnings was reduced by $560 million, representing the excess of the purchase price of the warrants over their average carrying value. The Company recorded $2 million in transaction costs associated with the warrant purchase directly to retained earnings.
Cenovus has the option to pay the warrant purchase price of $711 million through the remainder of 2023, with full payment required by January 5, 2024. As at June 30, 2023, no payments have been made related to the purchased warrants.
| | |
|
20. ACCUMULATED OTHER COMPREHENSIVE INCOME (LOSS) |
| | | | | | | | | | | | | | | | | | | | | | | |
| Pension and Other Post-Employment Benefits | | Private Equity Instruments | | Foreign Currency Translation Adjustment | | Total |
As at December 31, 2021 | 28 | | 27 | | 629 | | 684 |
| Other Comprehensive Income (Loss), Before Tax | 77 | | — | | 172 | | 249 |
| Income Tax (Expense) Recovery | (20) | | — | | — | | (20) |
As at June 30, 2022 | 85 | | 27 | | 801 | | 913 |
| | | | | | | |
As at December 31, 2022 | 99 | | 29 | | 1,342 | | 1,470 |
| Other Comprehensive Income (Loss), Before Tax | (5) | | (1) | | (296) | | (302) |
Reclassification on Divestiture (Note 4) | — | | — | | 12 | | 12 |
| Income Tax (Expense) Recovery | 1 | | — | | — | | 1 |
As at June 30, 2023 | 95 | | 28 | | 1,058 | | 1,181 |
| | | | | |
Cenovus Energy Inc. – Q2 2023 Interim Consolidated Financial Statements | 28 |
NOTES TO THE INTERIM CONSOLIDATED FINANCIAL STATEMENTS (unaudited)
All amounts in $ millions, unless otherwise indicated
For the periods ended June 30, 2023
| | |
|
21. STOCK-BASED COMPENSATION PLANS |
Cenovus has a number of stock-based compensation plans that include NSRs, Cenovus replacement stock options, performance share units (“PSUs”), restricted share units (“RSUs”) and deferred share units.
On February 27, 2023, Cenovus granted PSUs and RSUs to certain employees under its new Performance Share Unit Plan for Local Employees in the Asia Pacific Region and Restricted Share Unit Plan for Local Employees in the Asia Pacific Region. The PSUs are time-vested whole-share units that entitle employees to receive a cash payment equal to the value of a Cenovus common share. The number of units eligible to vest is determined by a multiplier that ranges from zero percent to 200 percent and is based on the Company achieving key pre-determined performance measures. The RSUs are whole-share units and entitle employees to receive, upon vesting, a cash payment equal to the value of a Cenovus common share.
The following tables summarize information related to the Company’s stock-based compensation plans:
| | | | | | | | | | | |
| Units Outstanding | | Units Exercisable |
As at June 30, 2023 | (thousands) | | (thousands) |
| Stock Options With Associated Net Settlement Rights | 14,336 | | 8,946 | |
| Cenovus Replacement Stock Options | 1,735 | | 1,670 | |
| Performance Share Units | 10,200 | | — | |
| Restricted Share Units | 7,252 | | — | |
| Deferred Share Units | 1,679 | | 1,679 | |
The weighted average exercise price of NSRs and Cenovus replacement stock options outstanding as at June 30, 2023, were $13.29 and $8.73, respectively.
| | | | | | | | | | | |
| Units Granted | | Units Vested and Exercised/ Paid Out |
For the six months ended June 30, 2023 | (thousands) | | (thousands) |
| Stock Options With Associated Net Settlement Rights | 1,536 | | 1,414 |
| Cenovus Replacement Stock Options | — | | 1,511 |
| Performance Share Units | 2,508 | | 972 |
| Restricted Share Units | 2,931 | | 2,277 |
| Deferred Share Units | 154 | | — |
| | | | | | | | | | | |
| Weighted Average Exercise Price | | Units Exercised |
For the six months ended June 30, 2023 | ($/unit) | | (thousands) |
| Stock Options With Associated Net Settlement Rights Exercised for Net Cash Payment | 15.33 | | 1,218 |
Stock Options With Associated Net Settlement Rights Exercised and Net Settled for Common Shares (1) | 17.18 | | 196 |
| Cenovus Replacement Stock Options Exercised and Net Settled for Cash | 10.34 | | 1,508 |
Cenovus Replacement Stock Options Exercised and Net Settled for Common Shares (2) | 3.54 | | 3 |
(1)NSRs were net settled for 46 thousand common shares.
(2)Cenovus replacement stock options were net settled for 2 thousand common shares.
The following table summarizes the stock-based compensation expense (recovery) recorded for all plans:
| | | | | | | | | | | | | | | | | | | | | | | |
| Three Months Ended | | Six Months Ended |
For the periods ended June 30, | 2023 | | 2022 | | 2023 | | 2022 |
| Stock Options With Associated Net Settlement Rights | 3 | | 5 | | 7 | | 9 |
| Cenovus Replacement Stock Options | (1) | | 22 | | (7) | | 41 |
| Performance Share Units | 18 | | 28 | | 27 | | 65 |
| Restricted Share Units | 10 | | 24 | | 21 | | 61 |
| Deferred Share Units | (1) | | 8 | | (3) | | 18 |
| Stock-Based Compensation Expense (Recovery) | 29 | | 87 | | 45 | | 194 |
| | | | | |
Cenovus Energy Inc. – Q2 2023 Interim Consolidated Financial Statements | 29 |
NOTES TO THE INTERIM CONSOLIDATED FINANCIAL STATEMENTS (unaudited)
All amounts in $ millions, unless otherwise indicated
For the periods ended June 30, 2023
| | |
|
22. RELATED PARTY TRANSACTIONS |
Transactions with HMLP are related party transactions as the Company has a 35 percent ownership interest (see Note 12). As the operator of the assets held by HMLP, Cenovus provides management services for which it recovers shared service costs.
The Company is also the contractor for HMLP and constructs its assets based on fixed price contracts or on a cost recovery basis with certain restrictions. For the three and six months ended June 30, 2023, the Company charged HMLP $31 million and $63 million, respectively, for construction costs and management services (three and six months ended June 30, 2022 – $29 million and $77 million, respectively).
The Company pays an access fee to HMLP for pipeline systems that are used by Cenovus’s blending business. Cenovus also pays HMLP for transportation and storage services. For the three and six months ended June 30, 2023, the Company incurred costs of $71 million and $138 million, respectively, for the use of HMLP’s pipeline systems, as well as for transportation and storage services (three and six months ended June 30, 2022 – $64 million and $133 million, respectively).
| | |
|
23. FINANCIAL INSTRUMENTS |
Cenovus’s financial assets and financial liabilities consist of cash and cash equivalents, accounts receivable and accrued revenues, restricted cash, net investment in finance leases, risk management assets and liabilities, investments in the equity of companies, long-term receivables, accounts payable and accrued liabilities, short-term borrowings, lease liabilities, contingent payments, long-term debt and other liabilities. Risk management assets and liabilities arise from the use of derivative financial instruments.
A) Fair Value of Non-Derivative Financial Instruments
The fair values of cash and cash equivalents, accounts receivable and accrued revenues, accounts payable and accrued liabilities, and short-term borrowings approximate their carrying amount due to the short-term maturity of these instruments.
The fair values of restricted cash, net investment in finance leases and long-term receivables approximate their carrying amount due to the specific non-tradeable nature of these instruments.
Long-term debt is carried at amortized cost. The estimated fair value of long-term debt has been determined based on period-end trading prices of long-term debt on the secondary market (Level 2). As at June 30, 2023, the carrying value of Cenovus’s long-term debt was $8.5 billion and the fair value was $7.7 billion (December 31, 2022, carrying value – $8.7 billion; fair value – $7.8 billion).
The Company classifies certain private equity investments as FVOCI as they are not held for trading and fair value changes are not reflective of the Company’s operations. These assets are carried at fair value on the Consolidated Balance Sheets in other assets. Fair value is determined based on recent private placement transactions (Level 3) when available.
The following table provides a reconciliation of changes in the fair value of private equity investments classified as FVOCI:
| | | | | | | |
| | | |
| Total | | |
| As at December 31, 2022 | 55 | | |
| Acquisition | 9 | | |
Changes in Fair Value (1) | (1) | | |
As at June 30, 2023 | 63 | | |
(1)Changes in fair value are recorded in OCI.
B) Fair Value of Risk Management Assets and Liabilities
The Company’s risk management assets and liabilities consist of crude oil, condensate, natural gas, and refined product futures, as well as renewable power, power and foreign exchange contracts. The Company may also enter into swaps, forwards, and options to manage commodity, foreign exchange and interest rate exposures. The Company’s risk management assets and liabilities are measured as Level 2 or Level 3 prices in the fair value hierarchy. Level 2 prices sourced from observable data or market corroboration refer to the fair value of contracts valued in part using active quotes and in part using observable, market-corroborated data. Level 3 prices are sourced from partially observable data used in internal valuations.
| | | | | |
Cenovus Energy Inc. – Q2 2023 Interim Consolidated Financial Statements | 30 |
NOTES TO THE INTERIM CONSOLIDATED FINANCIAL STATEMENTS (unaudited)
All amounts in $ millions, unless otherwise indicated
For the periods ended June 30, 2023
Crude oil, natural gas, condensate, refined product and power contracts are recorded at their estimated fair value based on the difference between the contracted price and the period-end forward price for the same commodity, using quoted market prices or the period-end forward price for the same commodity extrapolated to the end of the term of the contract (Level 2). The fair value of foreign exchange rate contracts, and interest rate swaps are calculated using external valuation models that incorporate observable market data, including foreign exchange forward curves (Level 2) and interest rate yield curves (Level 2), respectively. The fair value of cross currency interest rate swaps are calculated using external valuation models that incorporate observable market data, including foreign exchange forward curves (Level 2) and interest rate yield curves (Level 2).
The fair value of renewable power contracts are calculated using internal valuation models that incorporate broker pricing for relevant markets, some observable market prices and extrapolated market prices with inflation assumptions (Level 3). The fair value of renewable power contracts are calculated by Cenovus’s internal valuation team that consists of individuals who are knowledgeable and have experience in fair value techniques.
Risk management assets and liabilities are carried at fair value on the Consolidated Balance Sheets in accounts receivable and accrued revenues, and accounts payable and accrued liabilities (for short-term positions) and other liabilities and other assets (for long-term positions). Changes in fair value are recorded in the Consolidated Statements of Earnings (Loss) within (gain) loss on risk management.
Summary of Risk Management Positions
| | | | | | | | | | | | | | | | | | | | | | | | | | | | | | | | | | | |
| | | |
| June 30, 2023 | | December 31, 2022 |
| Risk Management | | Risk Management |
As at | Asset | | Liability | | Net | | Asset | | Liability | | Net |
| Crude Oil, Natural Gas, Condensate and Refined Products | 8 | | 13 | | (5) | | 2 | | 40 | | (38) |
| Power Swap Contracts | 2 | | 3 | | (1) | | 1 | | 7 | | (6) |
| Renewable Power Contracts | 37 | | — | | 37 | | 90 | | — | | 90 |
| Foreign Exchange Rate Contracts | 2 | | — | | 2 | | — | | — | | — |
| 49 | | 16 | | 33 | | 93 | | 47 | | 46 |
The following table presents the Company’s fair value hierarchy for risk management assets and liabilities carried at fair value:
| | | | | | | | | | | |
| June 30, | | December 31, |
As at | 2023 | | 2022 |
| Level 2 – Prices Sourced From Observable Data or Market Corroboration | (4) | | (44) |
| Level 3 – Prices Sourced From Partially Unobservable Data | 37 | | 90 |
| 33 | | 46 |
The following table provides a reconciliation of changes in the fair value of Cenovus’s risk management assets and liabilities:
| | | | | | | |
| Total | | |
| As at December 31, 2022 | 46 | | |
| | | |
Change in Fair Value of Contracts in Place at Beginning of Year | 8 | | |
| Change in Fair Value of Contracts Entered Into During the Period | (24) | | |
| Fair Value of Contracts Realized During the Period | 1 | | |
| Unrealized Foreign Exchange Gain (Loss) on U.S. Dollar Contracts | 2 | | |
| As at June 30, 2023 | 33 | | |
C) Earnings Impact of (Gains) Losses From Risk Management Positions
| | | | | | | | | | | | | | | | | | | | | | | |
| Three Months Ended | | Six Months Ended |
For the periods ended June 30, | 2023 | | 2022 | | 2023 | | 2022 |
| Realized (Gain) Loss | (23) | | 664 | | 1 | | 1,638 |
| Unrealized (Gain) Loss | 46 | | (381) | | 16 | | (70) |
(Gain) Loss on Risk Management | 23 | | 283 | | 17 | | 1,568 |
Realized and unrealized gains and losses on risk management are recorded in the reportable segment to which the derivative instrument relates.
| | | | | |
Cenovus Energy Inc. – Q2 2023 Interim Consolidated Financial Statements | 31 |
NOTES TO THE INTERIM CONSOLIDATED FINANCIAL STATEMENTS (unaudited)
All amounts in $ millions, unless otherwise indicated
For the periods ended June 30, 2023
D) Fair Value of Contingent Payments
The variable payment (Level 3) associated with the Sunrise Acquisition is carried at fair value in the Consolidated Balance Sheets within contingent payments. Fair value is estimated by calculating the present value of the expected future cash flows using an option pricing model, which assumes the probability distribution for WCS is based on the volatility of WTI options, volatility of Canadian-U.S. foreign exchange rate options and both WTI and WCS futures pricing that have been discounted using a credit-adjusted risk-free rate. Fair value of the variable payment has been calculated by Cenovus’s internal valuation team, which consists of individuals who are knowledgeable and have experience in fair value techniques. As at June 30, 2023, the fair value of the variable payment was estimated to be $320 million applying a credit-adjusted risk-free rate of 5.9 percent.
As at June 30, 2023, average WCS forward pricing for the remaining term of the variable payment is $74.46 per barrel. The average volatility of WTI options and the Canadian-U.S. foreign exchange rates was 36.6 percent and 6.1 percent, respectively. Changes in the following inputs to the option pricing model, with fluctuations in all other variables held constant, would impact earnings before income tax as follows:
| | | | | | | | | | | | | | | | | | | | |
| | Sensitivity Range | | Increase | | Decrease |
| WCS Forward Prices | | ± $10.00 per barrel | | (56) | | 107 |
| WTI Option Volatility | | ± 10 percent | | (1) | | 4 |
| | | | | | |
A five percent increase or decrease in the Canadian-U.S. dollar foreign exchange rate options would result in a nominal impact on earnings before income tax.
Cenovus is exposed to financial risks, including market risk related to commodity prices, foreign exchange rates, interest rates, commodity power prices as well as credit risk and liquidity risk.
To manage exposure to commodity price movements between when products are produced or purchased and when sold to the customer or used by Cenovus, the Company may periodically enter into financial positions as a part of ongoing operations to market the Company’s production and physical inventory positions of crude oil, natural gas, condensate, refined products, and power consumption. The Company may also enter into arrangements to manage exposure to future carbon compliance costs or to offset select carbon emissions.
The Company entered into risk management positions to help capture incremental margin expected to be received in future periods at the time products will be sold and to mitigate overall exposure to fluctuations in commodity prices related to inventories and physical sales. Mitigation of commodity price volatility may utilize financial positions to protect future cash flows. To manage exposure to interest rate volatility, the Company periodically enters into interest rate swap contracts. To mitigate the Company’s exposure to foreign exchange rate fluctuations, the Company periodically enters into foreign exchange contracts. To manage interest costs on short-term borrowings, the Company periodically enters into cross currency interest rate swaps. To manage electricity costs associated with the production and transportation of crude oil, the Company may enter into power swaps and other energy instruments, including renewable power contracts. To manage exposure to future carbon costs, power prices, or to generate potential offsets for carbon emissions, the Company may enter into renewable power contracts.
As at June 30, 2023, the fair value of risk management positions was a net asset of $33 million and consisted of crude oil, natural gas, condensate, refined products, power, including renewable power, and foreign exchange rate instruments. As at June 30, 2023, there were foreign exchange contracts with a notional value of US$200 million (December 31, 2022 – US$168 million) and no interest rate contracts or cross currency interest rate swap contracts (December 31, 2022 – $nil).
| | | | | |
Cenovus Energy Inc. – Q2 2023 Interim Consolidated Financial Statements | 32 |
NOTES TO THE INTERIM CONSOLIDATED FINANCIAL STATEMENTS (unaudited)
All amounts in $ millions, unless otherwise indicated
For the periods ended June 30, 2023
Net Fair Value of Risk Management Positions
| | | | | | | | | | | | | | | | | | | | | | | |
As at June 30, 2023 | Notional Volumes (1) (2) | | Terms (3) | | Weighted Average Price (1) (2) | | Fair Value Asset (Liability) |
Futures Contracts Related to Blending (4) | | | | | | | |
| WTI Fixed – Sell | 5.3 MMbbls | | August 2023 - June 2024 | | US$71.54/bbl | | 6 |
| WTI Fixed – Buy | 2.7 MMbbls | | August 2023 - June 2024 | | US$71.58/bbl | | (3) |
| Power Swap Contracts | | | | | | | (1) |
| Renewable Power Contracts | | | | | | | 37 |
Other Financial Positions (5) | | | | | | | (8) |
| Foreign Exchange Rate Contracts | | | | | | | 2 |
| Total Fair Value | | | | | | | 33 |
(1) Million barrels (“MMbbls”). Barrel (“bbl”).
(2) Notional volumes and weighted average price represent various contracts over the respective terms. The notional volumes and weighted average price may fluctuate from month to month as it represents the averages for various individual contracts with different terms.
(3) Summarizes various individual contracts with terms ranging from one to eleven months.
(4) WTI futures contracts are used to help manage price exposure to condensate used for blending.
(5) Includes risk management positions related to WCS, heavy oil and condensate differential contracts, Belvieu fixed price contracts, reformulated blendstock for oxygenate blending gasoline contracts, heating oil and natural gas fixed price contracts and the Company’s U.S. manufacturing and marketing activities.
A) Commodity Price and Foreign Exchange Rate Risk
Sensitivities
The following table summarizes the sensitivity of the fair value of Cenovus’s risk management positions to independent fluctuations in commodity prices and foreign exchange rates, with all other variables held constant. Management believes the fluctuations identified in the table below are a reasonable measure of volatility.
The impact of fluctuating commodity prices and foreign exchange rates on the Company’s open risk management positions could have resulted in an unrealized gain (loss) impacting earnings before income tax as follows:
| | | | | | | | | | | | | | |
As at June 30, 2023 | Sensitivity Range | Increase | | Decrease |
| Crude Oil Commodity Price | ± US$10.00/bbl Applied to WTI, Condensate and Related Hedges | 1 | | (1) |
| | | | |
| | | | |
| Refined Products Commodity Price | ± US$10.00/bbl Applied to Heating Oil and Gasoline Hedges | (2) | | 2 |
| Natural Gas Basis Price | ± US$0.50/Mcf (1) Applied to Natural Gas Basis Hedges | 2 | | (2) |
| Power Commodity Price | ± C$20.00/Megawatt Hour Applied to Power Hedges | 110 | | (110) |
| U.S. to Canadian Dollar Exchange Rate | ± 0.05 in the U.S. to Canadian Dollar Exchange Rate | 16 | | (19) |
(1)One million British thermal units per thousand cubic feet (“Mcf”).
A US$2.50 per barrel increase or decrease in the WCS and Condensate differential price (excluding WCS (Hardisty) differential), and a US$5.00 per barrel increase or decrease in WCS (Hardisty) differential price would result in a nominal unrealized gain (loss) impact to earnings before income tax.
B) Credit Risk
Credit risk arises from the potential that the Company may incur a financial loss if a counterparty to a financial instrument fails to meet its financial or performance obligations in accordance with agreed terms. Cenovus has in place a Credit Policy approved by the Audit Committee and the Board of Directors, which is designed to ensure that its credit exposures are within an acceptable risk level. The Credit Policy outlines the roles and responsibilities related to credit risk, sets a framework for how credit exposures will be measured, monitored and mitigated, and sets parameters around credit concentration limits.
Cenovus assesses the credit risk of new counterparties and continues risk-based monitoring of all counterparties on an ongoing basis. A substantial portion of Cenovus’s accounts receivable are with customers in the oil and gas industry and are subject to normal industry credit risks. Cenovus’s exposure to its counterparties is within its credit policy tolerances. The maximum credit risk exposure associated with accounts receivable and accrued revenues, net investment in finance leases, risk management assets and long-term receivables is the total carrying value.
As at June 30, 2023, approximately 82 percent (December 31, 2022 – 85 percent) of the Company’s accounts receivable and accrued revenues were with investment grade counterparties, and 98 percent of the Company’s accounts receivable were outstanding for less than 60 days. The associated average expected credit loss on these accounts was 0.5 percent as at June 30, 2023 (December 31, 2022 – 0.4 percent).
| | | | | |
Cenovus Energy Inc. – Q2 2023 Interim Consolidated Financial Statements | 33 |
NOTES TO THE INTERIM CONSOLIDATED FINANCIAL STATEMENTS (unaudited)
All amounts in $ millions, unless otherwise indicated
For the periods ended June 30, 2023
C) Liquidity Risk
Liquidity risk is the risk that the Company will not be able to meet all of its financial obligations as they become due. Liquidity risk also includes the risk of not being able to liquidate assets in a timely manner at a reasonable price. Cenovus manages its liquidity risk through the active management of cash and debt, and by maintaining appropriate access to credit, which may be impacted by the Company’s credit ratings. As disclosed in Note 14, over the long term, Cenovus targets a Net Debt to Adjusted EBITDA ratio and Net Debt to Adjusted Funds Flow ratio of approximately 1.0 times at the bottom of the commodity price cycle to manage the Company’s overall debt position.
Undiscounted cash outflows relating to financial liabilities are:
| | | | | | | | | | | | | | | | | | | | | | | | | | | | | |
As at June 30, 2023 | Less than 1 Year | | Years 2 and 3 | | Years 4 and 5 | | Thereafter | | Total |
Accounts Payable and Accrued Liabilities (1) | 6,040 | | — | | — | | — | | 6,040 |
| | | | | | | | | |
Lease Liabilities (2) | 424 | | 744 | | 585 | | 2,747 | | 4,500 |
Long-Term Debt (2) | 394 | | 959 | | 3,214 | | 9,555 | | 14,122 |
| Contingent Payments | 270 | | 62 | | — | | — | | 332 |
| | | | | | | | | |
As at December 31, 2022 | Less than 1 Year | | Years 2 and 3 | | Years 4 and 5 | | Thereafter | | Total |
Accounts Payable and Accrued Liabilities (1) | 6,124 | | — | | — | | — | | 6,124 |
Short-Term Borrowings (2) | 115 | | — | | — | | — | | 115 |
Lease Liabilities (2) | 426 | | 746 | | 596 | | 2,889 | | 4,657 |
Long-Term Debt (2) | 401 | | 983 | | 2,014 | | 11,196 | | 14,594 |
| Contingent Payments | 271 | | 167 | | — | | — | | 438 |
(1)Includes current risk management liabilities.
(2)Principal and interest, including current portion, if applicable.
| | |
|
25. SUPPLEMENTARY CASH FLOW INFORMATION |
A) Working Capital
| | | | | | | | | | | |
| June 30, | | December 31, |
As at | 2023 | | 2022 |
| Total Current Assets | 9,950 | | 12,430 |
| Total Current Liabilities | 6,624 | | 8,021 |
| Working Capital | 3,326 | | 4,409 |
As at June 30, 2023, adjusted working capital was $3.6 billion (December 31, 2022 – $4.7 billion), excluding the current portion of the contingent payments of $262 million (December 31, 2022 – $263 million).
Changes in non-cash working capital is as follows:
| | | | | | | | | | | | | | | | | | | | | | | |
| Three Months Ended | | Six Months Ended |
For the periods ended June 30, | 2023 | | 2022 | | 2023 | | 2022 |
| Accounts Receivable and Accrued Revenues | 126 | | 282 | | 191 | | (1,627) |
| Income Tax Receivable | (32) | | 8 | | (169) | | 23 |
| Inventories | (83) | | (505) | | 162 | | (1,310) |
| Accounts Payable and Accrued Liabilities | 68 | | (388) | | (782) | | 1,159 |
| Income Tax Payable | (23) | | 591 | | (1,163) | | 803 |
| Total Change in Non-Cash Working Capital | 56 | | (12) | | (1,761) | | (952) |
| | | | | | | |
| Net Change in Non-Cash Working Capital – Operating Activities | 132 | | (92) | | (1,501) | | (1,291) |
| Net Change in Non-Cash Working Capital – Investing Activities | (76) | | 80 | | (260) | | 339 |
| Total Change in Non-Cash Working Capital | 56 | | (12) | | (1,761) | | (952) |
| | | | | |
Cenovus Energy Inc. – Q2 2023 Interim Consolidated Financial Statements | 34 |
NOTES TO THE INTERIM CONSOLIDATED FINANCIAL STATEMENTS (unaudited)
All amounts in $ millions, unless otherwise indicated
For the periods ended June 30, 2023
B) Reconciliation of Liabilities
The following table provides a reconciliation of liabilities to cash flows arising from financing activities:
| | | | | | | | | | | | | | | | | | | | | | | | | | | | | |
| Dividends Payable | | Warrant Purchase Payable | | Short-Term Borrowings | | Long-Term Debt | | Lease Liabilities |
As at December 31, 2021 | — | | — | | 79 | | 12,385 | | 2,957 |
| | | | | | | | | |
| Changes From Financing Cash Flows: | | | | | | | | | |
| Net Issuance (Repayment) of Short-Term Borrowings | — | | — | | (79) | | — | | — |
| | | | | | | | | |
| | | | | | | | | |
| (Repayment) of Long-Term Debt | — | | — | | — | | (1,260) | | — |
| Principal Repayment of Leases | — | | — | | — | | — | | (150) |
| Base Dividends Paid on Common Shares | (276) | | — | | — | | — | | — |
| Dividends Paid on Preferred Shares | (17) | | — | | — | | — | | — |
| Non-Cash Changes: | | | | | | | | | |
| Net Premium (Discount) on Redemption of Long-Term Debt | — | | — | | — | | (25) | | — |
| Finance and Transaction Costs | — | | — | | — | | (18) | | — |
| Lease Additions | — | | — | | — | | — | | 3 |
| Lease Modifications | — | | — | | — | | — | | 42 |
| Lease Re-measurements | — | | — | | — | | — | | 3 |
| Lease Terminations | — | | — | | — | | — | | (1) |
| | | | | | | | | |
| Base Dividends Declared on Common Shares | 276 | | — | | — | | — | | — |
| Dividends Declared on Preferred Shares | 17 | | — | | — | | — | | — |
| Exchange Rate Movements and Other | — | | — | | — | | 146 | | 12 |
As at June 30, 2022 | — | | — | | — | | 11,228 | | 2,866 |
| | | | | | | | | |
As at December 31, 2022 | 9 | | — | | 115 | | 8,691 | | 2,836 |
| Changes From Financing Cash Flows: | | | | | | | | | |
| Net Issuance (Repayment) of Short-Term Borrowings | — | | — | | (115) | | — | | — |
| Issuance of Long-Term Debt | — | | — | | — | | — | | — |
| (Repayment) of Long-Term Debt | — | | — | | — | | — | | — |
| Net Issuance (Repayment) of Revolving Long-Term Debt | — | | — | | — | | — | | — |
| Principal Repayment of Leases | — | | — | | — | | — | | (146) |
| Base Dividends Paid on Common Shares | (465) | | — | | — | | — | | — |
| Variable Dividends Paid on Common Shares | — | | — | | — | | — | | — |
| | | | | | | | | |
| Dividends Paid on Preferred Shares | (27) | | — | | — | | — | | — |
| Non-Cash Changes: | | | | | | | | | |
| Net Premium (Discount) on Redemption of Long-Term Debt | — | | — | | — | | — | | — |
| Finance and Transaction Costs | — | | 2 | | — | | (10) | | — |
Lease Acquisitions (Note 4) | — | | — | | — | | — | | 33 |
| Lease Additions | — | | — | | — | | — | | 26 |
| Lease Modifications | — | | — | | — | | — | | 32 |
| Lease Re-measurements | — | | — | | — | | — | | 9 |
Lease Divestitures (Note 4) | — | | — | | — | | — | | (11) |
| Lease Terminations | — | | — | | — | | — | | (4) |
| Base Dividends Declared on Common Shares | 465 | | — | | — | | — | | — |
| Variable Dividends Declared on Common Shares | — | | — | | — | | — | | — |
| Dividends Declared on Preferred Shares | 18 | | — | | — | | — | | — |
| Warrants Purchased and Cancelled | — | | 711 | | — | | — | | — |
| Exchange Rate Movements and Other | — | | — | | — | | (147) | | (1) |
| | | | | | | | | |
As at June 30, 2023 | — | | 713 | | — | | 8,534 | | 2,774 |
| | | | | |
Cenovus Energy Inc. – Q2 2023 Interim Consolidated Financial Statements | 35 |
NOTES TO THE INTERIM CONSOLIDATED FINANCIAL STATEMENTS (unaudited)
All amounts in $ millions, unless otherwise indicated
For the periods ended June 30, 2023
| | |
|
26. COMMITMENTS AND CONTINGENCIES |
A) Commitments
Cenovus has entered into various commitments in the normal course of operations. Commitments that have original maturities less than one year are excluded from the table below. Future payments for the Company’s commitments are below:
| | | | | | | | | | | | | | | | | | | | | | | | | | | | | | | | | | | | | | | | | |
As at June 30, 2023 | Remainder of Year | | 2 Years | | 3 Years | | 4 Years | | 5 Years | | Thereafter | | Total |
Transportation and Storage (1) | 843 | | 1,917 | | 1,681 | | 1,416 | | 1,368 | | 12,978 | | 20,203 |
Product Purchases | 709 | | 711 | | — | | — | | — | | — | | 1,420 |
| | | | | | | | | | | | | |
Real Estate (2) | 27 | | 53 | | 54 | | 55 | | 59 | | 619 | | 867 |
Obligation to Fund Equity-Accounted Affiliate (3) | 48 | | 103 | | 94 | | 94 | | 89 | | 139 | | 567 |
Other Long-Term Commitments (4) | 318 | | 147 | | 132 | | 134 | | 126 | | 875 | | 1,732 |
Total Commitments | 1,945 | | 2,931 | | 1,961 | | 1,699 | | 1,642 | | 14,611 | | 24,789 |
(1)Includes transportation commitments of $9.1 billion (December 31, 2022 – $9.1 billion) that are subject to regulatory approval or have been approved, but are not yet in service. Terms are up to 20 years subsequent to the commencement of the contract. Estimated tolls reflect the original contract rate and are subject to change pending approval by the Canada Energy Regulator.
(2)Relates to the non-lease components of lease liabilities consisting of operating costs and unreserved parking for office space. Excludes committed payments for which a provision has been provided.
(3)Relates to funding obligations for HCML.
(4)Includes Cenovus’s proportionate share of the commitments related to WRB and joint arrangements in the Offshore segment.
As at June 30, 2023, the Company had commitments with HMLP that included $2.1 billion related to long-term transportation and storage commitments (December 31, 2022 – $2.2 billion).
The Company acquired $538 million of commitments as part of the Toledo Acquisition on February 28, 2023.
There were also outstanding letters of credit aggregating to $390 million (December 31, 2022 – $490 million) issued as security for financial and performance conditions under certain contracts.
B) Contingencies
Legal Proceedings
Cenovus is involved in a limited number of legal claims associated with the normal course of operations. Cenovus believes that any liabilities that might arise from such matters, to the extent not provided for, are not likely to have a material effect on its interim Consolidated Financial Statements.
Income Tax Matters
The tax regulations and legislation and interpretations thereof in the various jurisdictions in which Cenovus operates are continually changing. As a result, there are usually a number of tax matters under review. Management believes that the provision for taxes is adequate.
| | | | | |
Cenovus Energy Inc. – Q2 2023 Interim Consolidated Financial Statements | 36 |
FORM 52-109F2
CERTIFICATION OF INTERIM FILINGS
FULL CERTIFICATE
I, Jonathan M. McKenzie, President & Chief Executive Officer of Cenovus Energy Inc., certify the following:
1.Review: I have reviewed the interim financial report and interim MD&A (together, the “interim filings”) of Cenovus Energy Inc. (the “issuer”) for the interim period ended June 30, 2023.
2.No misrepresentations: Based on my knowledge, having exercised reasonable diligence, the interim filings do not contain any untrue statement of a material fact or omit to state a material fact required to be stated or that is necessary to make a statement not misleading in light of the circumstances under which it was made, with respect to the period covered by the interim filings.
3.Fair presentation: Based on my knowledge, having exercised reasonable diligence, the interim financial report together with the other financial information included in the interim filings fairly present in all material respects the financial condition, financial performance and cash flows of the issuer, as of the date of and for the periods presented in the interim filings.
4.Responsibility: The issuer’s other certifying officer(s) and I are responsible for establishing and maintaining disclosure controls and procedures (“DC&P”) and internal control over financial reporting (“ICFR”), as those terms are defined in National Instrument 52-109 Certification of Disclosure in Issuers’ Annual and Interim Filings, for the issuer.
5.Design: Subject to the limitations, if any, described in paragraphs 5.2 and 5.3, the issuer’s other certifying officer(s) and I have, as at the end of the period covered by the interim filings
(a)designed DC&P, or caused it to be designed under our supervision, to provide reasonable assurance that
(i)material information relating to the issuer is made known to us by others, particularly during the period in which the interim filings are being prepared; and
(ii)information required to be disclosed by the issuer in its annual filings, interim filings or other reports filed or submitted by it under securities legislation is recorded, processed, summarized and reported within the time periods specified in securities legislation; and
(b)designed ICFR, or caused it to be designed under our supervision, to provide reasonable assurance regarding the reliability of financial reporting and the preparation of financial statements for external purposes in accordance with the issuer’s GAAP.
5.1 Control framework: The control framework the issuer’s other certifying officer(s) and I used to design the issuer’s ICFR is the Committee of Sponsoring Organizations of the Treadway Commission (“COSO”) framework in Internal Control – Integrated Framework.
5.2 ICFR - material weakness relating to design: N/A
5.3 Limitation on scope of design: The issuer has disclosed in its interim MD&A
(a) the fact that the issuer's other certifying officer(s) and I have limited the scope of our design of DC&P and ICFR to exclude controls, policies and procedures of a business that the issuer acquired not more than 365 days before the last day of the period covered by the interim filings; and
(b) summary financial information about the business that the issuer acquired that has been proportionately consolidated or consolidated in the issuer's financial statements.
6.Reporting changes in ICFR: The issuer has disclosed in its interim MD&A any change in the issuer’s ICFR that occurred during the period beginning on April 1, 2023 and ended on June 30, 2023 that has materially affected, or is reasonably likely to materially affect, the issuer’s ICFR.
Date: July 27, 2023
/s/ Jonathan M. McKenzie
Jonathan M. McKenzie
President & Chief Executive Officer
FORM 52-109F2
CERTIFICATION OF INTERIM FILINGS
FULL CERTIFICATE
I, Jeffrey R. Hart, Executive Vice-President & Chief Financial Officer of Cenovus Energy Inc., certify the following:
1.Review: I have reviewed the interim financial report and interim MD&A (together, the “interim filings”) of Cenovus Energy Inc. (the “issuer”) for the interim period ended June 30, 2023.
2.No misrepresentations: Based on my knowledge, having exercised reasonable diligence, the interim filings do not contain any untrue statement of a material fact or omit to state a material fact required to be stated or that is necessary to make a statement not misleading in light of the circumstances under which it was made, with respect to the period covered by the interim filings.
3.Fair presentation: Based on my knowledge, having exercised reasonable diligence, the interim financial report together with the other financial information included in the interim filings fairly present in all material respects the financial condition, financial performance and cash flows of the issuer, as of the date of and for the periods presented in the interim filings.
4.Responsibility: The issuer’s other certifying officer(s) and I are responsible for establishing and maintaining disclosure controls and procedures (“DC&P”) and internal control over financial reporting (“ICFR”), as those terms are defined in National Instrument 52-109 Certification of Disclosure in Issuers’ Annual and Interim Filings, for the issuer.
5.Design: Subject to the limitations, if any, described in paragraphs 5.2 and 5.3, the issuer’s other certifying officer(s) and I have, as at the end of the period covered by the interim filings
(a)designed DC&P, or caused it to be designed under our supervision, to provide reasonable assurance that
(i)material information relating to the issuer is made known to us by others, particularly during the period in which the interim filings are being prepared; and
(ii)information required to be disclosed by the issuer in its annual filings, interim filings or other reports filed or submitted by it under securities legislation is recorded, processed, summarized and reported within the time periods specified in securities legislation; and
(b)designed ICFR, or caused it to be designed under our supervision, to provide reasonable assurance regarding the reliability of financial reporting and the preparation of financial statements for external purposes in accordance with the issuer’s GAAP.
5.1 Control framework: The control framework the issuer’s other certifying officer(s) and I used to design the issuer’s ICFR is the Committee of Sponsoring Organizations of the Treadway Commission (“COSO”) framework in Internal Control – Integrated Framework.
5.2 ICFR - material weakness relating to design: N/A
5.3 Limitation on scope of design: The issuer has disclosed in its interim MD&A
(a) the fact that the issuer's other certifying officer(s) and I have limited the scope of our design of DC&P and ICFR to exclude controls, policies and procedures of a business that the issuer acquired not more than 365 days before the last day of the period covered by the interim filings; and
(b) summary financial information about the business that the issuer acquired that has been proportionately consolidated or consolidated in the issuer's financial statements.
6.Reporting changes in ICFR: The issuer has disclosed in its interim MD&A any change in the issuer’s ICFR that occurred during the period beginning on April 1, 2023 and ended on June 30, 2023 that has materially affected, or is reasonably likely to materially affect, the issuer’s ICFR.
Date: July 27, 2023
/s/ Jeffrey R. Hart
Jeffrey R. Hart
Executive Vice-President & Chief Financial Officer
Cenovus Energy (NYSE:CVE)
Historical Stock Chart
From Apr 2024 to May 2024

Cenovus Energy (NYSE:CVE)
Historical Stock Chart
From May 2023 to May 2024
