UNITED STATES
SECURITIES AND EXCHANGE COMMISSION
Washington, D.C. 20549
FORM 6-K
Report of Foreign Private Issuer
Pursuant to Rule 13a-16 or 15d-16
under the Securities Exchange Act of 1934
For July 2021
Commission File Number: 1-34513
CENOVUS ENERGY INC.
(Translation of registrant’s name into English)
4100, 225 6 Avenue S.W.
Calgary, Alberta, Canada T2P 1N2
(Address of principal executive office)
Indicate by check mark whether the registrant files or will file annual reports under cover of Form 20-F or Form 40-F.
Form 20-F ☐ Form 40-F ☒
Indicate by check mark if the registrant is submitting the Form 6-K in paper as permitted by Regulation S-T Rule 101(b)(1): ☐
Indicate by check mark if the registrant is submitting the Form 6-K in paper as permitted by Regulation S-T Rule 101(b)(7): ☐
Exhibit 99.2, 99.3 and 99.4 to this report, furnished on Form 6-K, shall be incorporated by reference into or as an exhibit to, as applicable, each of the registrant’s Registration Statements under the Securities Act of 1933, as amended: Form F-10 (File No. 333-233702), Form S-8 (File Nos. 333-163397 and 333-251886), Form F-3D (File No. 333-202165).
DOCUMENTS FILED AS PART OF THIS FORM 6-K
See the Exhibit Index to this Form 6-K.
SIGNATURES
Pursuant to the requirements of the Securities Exchange Act of 1934, the registrant has duly caused this report to be signed on its behalf by the undersigned, thereunto duly authorized.
Date: July 29, 2021
| | | | | | | | | | | | | | | | | |
| | | CENOVUS ENERGY INC. | | |
| | | (Registrant) | | |
| | | | | | | | | | | | | | | | | | | | | | | | | | |
| | By: | | /s/ Elizabeth A. McNamara | | |
| | | | Name: | | Elizabeth A. McNamara | | |
| | | | Title: | | Assistant Corporate Secretary | | |
Form 6-K Exhibit Index
| | | | | | | | |
| Exhibit No. | | |
| | |
| | News Release dated July 29, 2021 |
| | |
| | Management’s Discussion and Analysis dated July 28, 2021 for the period ended June 30, 2021 |
| | |
| | Interim Consolidated Financial Statements (unaudited) for the period ended July 30, 2021 |
| | |
| | Supplemental Financial Information (unaudited) – Consolidated Interest Coverage Ratios Exhibit to June 30, 2021 Interim Consolidated Financial Statements |
| | |
| | Form 52-109F2 Full Certificate, dated July 29, 2021, of Alex J. Pourbaix, President & Chief Executive Officer |
| | |
| | Form 52-109F2 Full Certificate, dated July 29, 2021, of Jeffrey R. Hart, Executive Vice-President & Chief Financial Officer |
Cenovus generates $1.8 billion in adjusted funds flow in Q2 2021
Delivers free funds flow of $1.3 billion
Calgary, Alberta (July 29, 2021) – Cenovus Energy Inc. (TSX: CVE) (NYSE: CVE) continues to demonstrate the strengths of the company’s integrated portfolio in its second quarter results, generating cash from operating activities of $1.4 billion, adjusted funds flow of $1.8 billion and free funds flow of $1.3 billion, supporting a reduction in net debt of nearly $1 billion since March 31, 2021. Total production of nearly 770,000 barrels of oil equivalent per day (BOE/d) despite planned turnarounds at several assets, and strong realized commodity prices in the upstream business along with continued recovery of demand for U.S. downstream products drove Cenovus’s strong financial performance, which the company expects will continue through the rest of the year.
“Our results underscore the earnings power of the combined company as we further integrate and deliver on our expanded asset base,” said Alex Pourbaix, Cenovus President & Chief Executive Officer. “We posted a strong second quarter and expect to accelerate deleveraging in the second half of this year.”
Second quarter highlights
•Generated cash from operating activities of $1.4 billion, adjusted funds flow of $1.8 billion and free funds flow of $1.3 billion.
•Increasing production guidance for 2021 by 2% with total capital guidance unchanged.
•On track to achieve $1.2 billion of run-rate synergies and net debt of $10 billion by end of 2021.
| | | | | | | | | | | |
Financial, production & throughput summary |
(For the period ended June 30) | 2021 Q2 | 2020 Q21 | % change1 |
Financial ($ millions, except per share amounts) |
Cash from operating activities | 1,369 | (834) |
|
Adjusted funds flow2,3 | 1,817 | (469) |
|
Per share (basic) | 0.90 | (0.38) |
|
Capital investment | 534 | 147 | 263 |
Free funds flow2,3 | 1,283 | (616) |
|
Net earnings (loss) | 224 | (235) |
|
Per share (basic) | 0.11 | (0.19) |
|
Net debt2 | 12,390 | 8,232 | 51 |
Production and throughput (before royalties, net to Cenovus) |
Oil and NGLs (bbls/d) | 614,900 | 400,050 | 54 |
Natural gas (MMcf/d) | 906 | 392 | 131 |
Total upstream production (BOE/d) | 765,900 | 465,415 | 65 |
Total downstream throughput (bbls/d) | 539,000 | 162,300 | 232 |
1 Comparative figures include Cenovus results prior to the January 1, 2021 closing of the Husky transaction and do not reflect historical data from Husky.
2 Adjusted funds flow, free funds flow and net debt are non-GAAP measures. See Advisory.
3 Prior period has been restated to conform with the current definition of adjusted funds flow.
Overview of Q2 results
Progress on integration and synergies
In the second quarter, integration expenditures of $46 million included costs associated with workforce reductions and consolidation of debt, head offices and IT systems. Integration expenditures for the first six months of 2021 were $291 million, including $34 million in capitalized costs.
Cenovus has reduced its integration costs guidance for 2021 to between $400 million and $450 million. The company remains on pace to realize at least $1 billion in synergies in 2021 and to reach its go-forward annual run-rate of $1.2 billion in synergies by the end of this year. Total integration costs for the Husky transaction are still expected to be in the range of $500 million to $550 million, with the remainder to be spent in 2022.
The company continues to identify additional synergies for its expanded asset base, including further opportunities to apply Cenovus’s in situ operating expertise to improve the performance of assets in Alberta and Saskatchewan. For example, through the application of the company’s operating philosophy, including the use of downhole temperature monitoring data, the Lloydminster thermal projects achieved quarterly average daily production of 97,700 barrels per day (bbls/d) and similar opportunities at the other Oil Sands assets are being evaluated. The marketing team is also leveraging the broader portfolio of assets and transportation contracts to optimize sales and marketing activities for our production.
“We continue to make great progress on our integration and remain focused on accessing the next layer of synergies,” said Pourbaix. “We benefit from a top-tier asset base with a wealth of opportunities to improve returns, all guided by an experienced team with a track record of safe and reliable operations.”
Financial results
Operating margin for the quarter was $2.2 billion, compared with $1.9 billion in the first quarter of 2021 and $291 million in the second quarter of 2020. The improvement over 2020 was primarily driven by higher commodity prices, increased sales volumes and higher downstream throughputs due to the addition of Husky assets. This was delivered while completing several planned turnarounds, speaking to the strength of the company’s overall production base. Second quarter operating margin was also impacted by realized risk management losses and receipt of cash related to a take or pay contract for the Bruderheim crude-by-rail terminal operations.
Adjusted funds flow of $1.8 billion included the impact of integration costs incurred in the quarter. Cash from operating activities was $1.4 billion, including changes in non-cash working capital of $430 million. Free funds flow of $1.3 billion included capital investment in the quarter of $534 million. The company continues to expect total capital expenditures for the year in the range of $2.3 billion to $2.7 billion.
Cenovus generated net earnings of $224 million in the second quarter compared with a net loss of $235 million in the same period of 2020. The improvement in net earnings was driven by higher operating margin, partially offset by higher unrealized risk management losses and integration costs.
The company recorded a realized loss on risk management of $199 million in the second quarter of 2021, primarily related to inventory risk management which was offset by higher revenues from the physical sales. Risk management gains and losses are a result of both inventory risk management and corporate hedging. Inventory risk management is undertaken to ensure that as decisions are made to transport or store barrels, the margin on this transaction is captured. Resulting inventory risk management gains or losses are designed to mirror revenue gains or losses on the related physical transactions. It should be expected that in periods of rising price environments, the company will report inventory risk management losses that are offset by physical positions and vice versa. In the second quarter, crude oil production volumes exceeded sales volumes as the company exercised its ability to store and defer a portion of sales to realize higher price opportunities.
Asset sales update
During the second quarter, as previously announced, Cenovus divested its gross overriding royalty (GORR) in the Marten Hills area of Alberta for gross cash proceeds of $102 million, which were used to repay debt. In addition, Cenovus entered into agreements in June and July to divest assets in the East Clearwater and Kaybob areas of Alberta for total expected cash proceeds of approximately $110 million. Combined net production from the East Clearwater and Kaybob assets was approximately 12,000 BOE/d (about 45% oil and NGLs) and the sale of these assets is now assumed in the updated 2021 Guidance ranges for the Conventional segment. Both sales are expected to close around the middle of the third quarter of 2021 and proceeds will be used for debt reduction. In line with its strategy, Cenovus will pursue further value accretive asset sales through the balance of 2021 to accelerate debt reduction towards its interim net debt target of $10 billion.
Debt Repayment
Net debt at the end of the second quarter was $12.4 billion, compared with $13.3 billion at March 31, 2021, with the nearly $1 billion decrease primarily due to free funds flow of $1.3 billion and an unrealized foreign exchange gain of $150 million on U.S. denominated debt, partially offset by a net change in non-cash working capital of $389 million. The increase in non-cash working capital was related to an increase in inventories and accounts receivable, partially offset by an increase in accounts payable. Inventories increased as U.S. refinery utilization ramped up and product was stored in June for sale at higher prices in the third quarter, and accounts receivable increased mainly due to higher commodity and refined product prices.
Deleveraging remains a top priority and Cenovus expects to meet its interim net debt target of $10 billion within 2021, assuming current commodity prices and foreign exchange rates hold, with a longer-term target of $8 billion or lower. The company will continue to prioritize the balance sheet after reaching $10 billion net debt, however opportunities for incremental shareholder returns and investment in the business will be considered around achievement of the interim target.
Consistent operating performance
Cenovus produced 765,900 BOE/d in the quarter, resulting in a total upstream operating margin of about $1.9 billion. Oil Sands crude oil production of 549,400 bbls/d was driven by record production at Christina Lake and the Lloydminster thermal operations, and partially offset by planned
turnarounds at Foster Creek, Sunrise and several Lloydminster thermal projects. As a result of continued strong performance, Cenovus has updated its 2021 production guidance to between 750,000 BOE/d and 790,000 BOE/d.
In the company’s downstream operations, the Canadian upgrading and refining business had a utilization rate in the second quarter of 94%. The U.S. refineries continued to ramp up throughput to 435,500 bbls/d, in line with increasing demand for refined products and improved market crack spreads. U.S. throughput was affected by planned and unplanned maintenance at the Wood River and Borger refineries, and planned third-party pipeline outages on lines supplying the Lima Refinery. Total downstream operating margin was $291 million.
Health and safety
Cenovus continues to prioritize the health and safety of its staff and neighbouring communities. As provinces in Western Canada continue to roll out vaccination programs and ease COVID-19 restrictions, Cenovus is gradually adjusting the protocols at its operations in those areas, aligned with the direction of governments, public health officials and the company’s internal health and safety experts. Office staff in Western Canada are beginning to return to the workplace, with Calgary employees returning in early September. Staff in other regions previously returned to the office following local guidance. The company continues to closely monitor the evolving situation.
The safety of its people and operations, as well as the protection of the environment, is critical for Cenovus. In June, the company began implementing the Cenovus Operations Integrity Management System, a framework of safety requirements leveraging the best practices of both Cenovus and Husky, which will be used at all sites and facilities.
Operating highlights
Oil Sands
Total crude oil production was 549,400 bbls/d for the Oil Sands segment in the quarter even with planned turnarounds at Foster Creek, Sunrise and several Lloydminster thermal assets. The segment generated operating margin of $1.4 billion in the second quarter, compared with $130 million in the second quarter of 2020. The increase was primarily due to higher average pricing and additional sales volumes from the Husky assets, partially offset by higher transportation and blending costs. Oil sands average netbacks were $32.43/BOE in the quarter, compared with a loss of $4.08/BOE in the second quarter of 2020.
Christina Lake production averaged 230,500 bbls/d in the quarter, an increase of about 7,600 bbls/d from the first quarter of 2021 as re-drilled wells came online and more than 23,000 bbls/d year-over-year, primarily because in the second quarter of 2020 the company voluntarily ran at reduced levels in response to low prices. Production at Foster Creek was 156,800 bbls/d, down approximately 6,300 bbls/d compared with the first quarter of the year and 9,200 bbls/d year-over-year due to a planned turnaround and unplanned operational outages. The application of Cenovus operating techniques at the legacy Husky Lloydminster thermal projects resulted in record quarterly production of 97,700 bbls/d despite turnarounds at several of the operations. Cenovus has increased its Oil Sands
production guidance to between 540,000 bbls/d and 596,000 bbls/d, including an additional 10,000 bbls/d from the Lloydminster thermal business.
Oil sands per-unit transportation costs decreased 14% in the quarter to $7.37/bbl compared with $8.56/bbl in the second quarter of 2020. Transportation costs for Foster Creek production increased 8% to $12.25/bbl in the second quarter compared with 2020 as Cenovus optimized its pipeline capacity out of Alberta to ship more crude to U.S. destinations to obtain higher prices, partially offset by shipping less by rail than in 2020. The per-barrel transportation costs for Christina Lake production decreased to $6.10/bbl from $6.19/bbl in the same period in 2020 as less crude was sold to the U.S. Gulf Coast than the year before, with no volumes shipped by rail. Blending costs in the quarter were driven by higher condensate prices.
Per-barrel operating costs for the segment were $11.91/bbl compared with $7.36/bbl in the second quarter of 2020, due to higher per-unit operating costs of the legacy Husky assets, planned turnarounds at Foster Creek, Sunrise and several Lloydminster thermal projects, and increased AECO pricing and other commodity-linked costs. Cenovus continues to focus on applying its operating techniques to Husky assets to enhance performance, including further expected reductions in operating costs.
Conventional
The Conventional assets generated operating margin of $142 million in the quarter compared with $32 million in the same period a year ago, due to higher realized sales prices on total production of 141,300 BOE/d, which reflected increased volumes from legacy Husky assets.
Per-unit operating costs were $10.41/bbl compared with $9.05/bbl in the second quarter of 2020, primarily due to higher average operating expenses for the legacy Husky assets. The segment had netbacks of $10.00/bbl in the quarter, compared with $2.93/bbl in 2020.
Offshore
The Offshore segment had total production of 73,000 BOE/d, generating operating margin of $340 million, with a netback of $57.06/BOE.
In the Asia Pacific region, sales volumes of 57,800 BOE/d received total realized sales pricing of $67.93/BOE in the quarter, based on long-term contracted pricing for natural gas and annual pricing contracts for NGLs. Operating netback for Asia Pacific production was $58.34/BOE. In Indonesia, a final investment decision was taken by the joint venture partners for the MAC field in the Madura Strait.
Atlantic region production of 15,200 bbls/d received Brent-like realized pricing of $86.07/bbl in the second quarter, with a netback averaging $52.17/bbl.
Cenovus has increased its Offshore production guidance to reflect the strength and consistency of its operations through the first half of 2021.
Downstream
Cenovus’s Downstream segment, with total crude throughput of 539,000 bbls/d, generated operating margin of $291 million in the second quarter compared with $129 million in the same period of 2020, due to assets added in the Husky transaction.
Canadian Manufacturing
With solid average utilization of 94%, the Lloydminster Upgrader and Lloydminster Asphalt Refinery contributed to total Canadian Manufacturing operating margin of $189 million. The facilities have been operating reliably and at near capacity throughout the year, with throughput in the second quarter of 103,500 bbls/d. The Canadian Manufacturing segment had operating expense of $9.89/bbl in the quarter compared with $9.69/bbl in the first quarter of 2021.
Volumes shipped by rail through the Bruderheim terminal were 3,100 bbls/d in the quarter compared with 5,700 bbls/d in the same period of 2020 as Cenovus optimized its expanded pipeline capacity out of Alberta to U.S. destinations. The company received $55 million in cash related to a take-or-pay contract for the Bruderheim operations.
U.S. Manufacturing
Increasing demand for refined products saw throughput in the U.S. Manufacturing segment increase to 435,500 bbls/d, compared with 162,300 bbls/d in 2020. This increase was also due to the addition of legacy Husky assets, offset by planned and unplanned maintenance at the Wood River and Borger refineries, and planned outages on third-party pipelines supplying the Lima Refinery. The planned turnarounds at the Wood River and Borger refineries were completed in the quarter.
Utilization in the second quarter averaged 87%. The segment generated operating margin of $96 million compared with $123 million in the second quarter of 2020, largely due to increased operating expenses related to the turnarounds and the higher cost of purchasing Renewable Identification Numbers (RINs). RINs were priced at $8.12/bbl in the second quarter compared with $2.21/bbl in the same period in 2020. RINs pricing was volatile in the first half of the year, ranging from slightly more than US$4.00/bbl to almost US$10.00/bbl.
Operating margin for the second quarter was comparable to the first quarter of 2021 despite higher benchmark crack spreads and increased throughput rates. Operating margin and gross margin were impacted by higher RINs costs, which increased from $180 million in the first quarter to $305 million in the second quarter, and increased refinery feedstock costs due to higher benchmark WTI prices.
Operating expense in the quarter was $9.96/bbl, compared with $11.91/bbl in the year ago period due to higher throughput year-over-year with the addition of legacy Husky assets and as product demand recovers.
Sustainability
Cenovus has entered into a 15-year power purchase agreement with a partnership between Cold Lake First Nations and Elemental Energy Inc. to buy solar-power produced electricity and the associated emissions offsets. The agreement will help Cenovus mitigate its scope 2 emissions, supporting its
efforts to both reduce greenhouse gas (GHG) emissions and further support Indigenous reconciliation through economic engagement. The 150-megawatt project, to be built in southern Alberta, is expected to begin adding electricity to the provincial grid in 2023.
In June, Cenovus announced its participation in the Oil Sands Pathways to Net Zero initiative, an alliance of five companies with the goal of achieving net zero GHG emissions from their oil sands operations by 2050. The alliance’s net zero ambition will support Canada’s efforts to meet its Paris Agreement commitments and 2050 net zero aspirations.
“We are committed to global climate leadership and to taking bold action to address our emissions challenge, while also helping Canada meet its climate goals and preserving the long-term success of our business and industry, and the benefits it provides,” said Pourbaix. “We will continue working with governments, the clean tech industry and Indigenous communities to make our vision a reality, cementing a spot as the supplier of choice to meet the world’s growing demand for energy.”
Cenovus has released its 2020 Environmental, Social and Governance (ESG) data report, aligning with the Sustainability Accounting Standards Board (SASB) and IPIECA (formerly the International Petroleum Industry Environmental Conservation Association) reporting frameworks. The report includes 2020 performance metrics for Cenovus and Husky and 2016-2019 historical data for Cenovus. Later this year the company will publish a more comprehensive ESG report, aligning with the Task Force on Climate-related Disclosures, and containing pro forma 2020 metrics and revised targets for its five priority areas: climate & GHG emissions, water stewardship, biodiversity, Indigenous reconciliation and inclusion & diversity.
2021 Guidance update
Cenovus has updated its 2021 Guidance. The capital guidance range remains $2.3 billion to $2.7 billion for the year. However it now reflects an increase to the Oil Sands spend of $100 million, which will add production in 2022 including accelerating completion of the Spruce Lake North Lloydminster thermal project and carrying out some redevelopment wells at Christina Lake. This capital increase is offset by a reduction in Downstream of $100 million, which reflects efficiencies identified across the portfolio. The production guidance range for 2021 increased by 2%, including an additional 10,000 bbls/d from Lloydminster thermals and increases in Offshore, partially offset by announced asset sales in the Conventional segment.
The operating cost guidance range for Oil Sands has been increased modestly, reflecting increases in AECO pricing and other commodity-linked costs. While these also impact operating costs for the Lloydminster thermal projects, this is more than offset by efficiencies achieved by applying Cenovus’s operating techniques, and as a result the operating cost range has been reduced. The operating cost guidance for Conventional has also been reduced, reflecting efficiencies achieved there.
See the Guidance document for more detail, including royalties, cash taxes and adjusted funds flow sensitivities, at cenovus.com.
Dividend
For the third quarter of 2021, the Board of Directors declared a dividend of $0.0175 per share, payable on September 30, 2021 to common shareholders of record as of September 15, 2021. The Board also declared a third-quarter dividend on each of the Cumulative Redeemable First Preferred Shares – Series 1, Series 2, Series 3, Series 5 and Series 7 – payable on September 30, 2021, to shareholders of record as of September 15, 2021 as follows:
| | | | | | | | |
Preferred shares dividend summary |
| Rate (%) | Amount ($/share) |
Share series |
Series 1 | 2.577 | 0.16106 |
Series 2 | 1.839 | 0.11588 |
Series 3 | 4.689 | 0.29306 |
Series 5 | 4.591 | 0.28694 |
Series 7 | 3.935 | 0.24594 |
All dividends paid on Cenovus’s common and preferred shares will be designated as "eligible dividends" for Canadian federal income tax purposes. Declaration of dividends is at the sole discretion of the Board and will continue to be evaluated on a quarterly basis.
| | |
Conference call today 9 a.m. Mountain Time (11 a.m. Eastern Time) Cenovus will host a conference call today, July 29, 2021, starting at 9 a.m. MT (11 a.m. ET).
To participate, please dial 888-390-0605 (toll-free in North America) or 416-764-8609 approximately 10 minutes prior to the conference call. A live audio webcast of the conference call will also be available. The webcast will be archived for approximately 90 days. |
Advisory
Basis of Presentation
Cenovus reports financial results in Canadian dollars and presents production volumes on a net to Cenovus before royalties basis, unless otherwise stated. Cenovus prepares its financial statements in accordance with International Financial Reporting Standards (IFRS).
Barrels of Oil Equivalent
Natural gas volumes have been converted to barrels of oil equivalent (BOE) on the basis of six thousand cubic feet (Mcf) to one barrel (bbl). BOE may be misleading, particularly if used in isolation. A conversion ratio of one bbl to six Mcf is based on an energy equivalency conversion method primarily applicable at the burner tip and does not represent value equivalency at the wellhead. Given that the value ratio based on the current price of crude oil compared with natural gas is significantly different from the energy equivalency conversion ratio of 6:1, utilizing a conversion on a 6:1 basis is
not an accurate reflection of value.
Non-GAAP Measures and Additional Subtotal
This news release contains references to adjusted funds flow, free funds flow and net debt, which are non-GAAP measures. These measures do not have a standardized meaning as prescribed by IFRS. Readers should not consider these measures in isolation or as a substitute for analysis of the company’s results as reported under IFRS. These measures are defined differently by different companies and therefore are not comparable to similar measures presented by other issuers. For definitions, as well as reconciliations to GAAP measures, and more information on these and other non-GAAP measures and additional subtotals, refer to “Non-GAAP Measures and Additional Subtotals” on page 1 of Cenovus’s Management’s Discussion and Analysis (MD&A) for the period ended June 30, 2021 (available on SEDAR at sedar.com, on EDGAR at sec.gov and Cenovus’s website at cenovus.com).
Forward-looking Information
This news release contains certain forward-looking statements and forward-looking information (collectively referred to as “forward-looking information”) within the meaning of applicable securities legislation, including the U.S. Private Securities Litigation Reform Act of 1995, about Cenovus’s current expectations, estimates and projections about the future of the combined company, based on certain assumptions made in light of experiences and perceptions of historical trends. Although Cenovus believes that the expectations represented by such forward-looking information are reasonable, there can be no assurance that such expectations will prove to be correct.
Forward-looking information in this document is identified by words such as “achieve”, “ambition”, “aspirations”, “commitments”, “committed”, “continue”, “deliver”, “expect”, “focus”, “goal”, “opportunities”, “on pace”, “on track”, “priority”, “remain”, “target”, “vision” and “will” or similar expressions and includes suggestions of future outcomes, including, but not limited to statements about: general and 2021 priorities; delivering at least $1 billion in synergies in 2021 and reaching $1.2 billion in annual run-rate synergies by the end of 2021; achieving $10 billion net debt in 2021 and a longer term net debt target of $8 billion or lower; allocation of free cash flow; leveraging and capturing additional synergies from the acquisition of Husky; status of expected one-time integration-related costs; current and future asset sales and the use of proceeds; full year inventory risk management and corporate hedging programs to manage inventory positions and improve certainty; opportunity for incremental shareholder returns and investment in the business; future reductions of per-barrel operating costs in the Oil Sands segment; our expected results for the remainder of 2021; timing of workforce return to the workplace; implementation of the Cenovus Operations Integrity Management System at all sites and facilities; Cenovus’s ambition to achieve net zero emissions by 2050 and plans to set new ESG targets; Cenovus’s expectations for its participation in the Oil Sands Pathways to Net Zero and the power purchase agreement with a partnership between Cold Lake First Nations and Elemental Energy Inc.; quarterly evaluation of declaring dividends; planned turnarounds; and all statements related to the company’s updated 2021 Guidance.
Developing forward-looking information involves reliance on a number of assumptions and consideration of certain risks and uncertainties, some of which are specific to Cenovus and others that apply to the industry generally. The factors or assumptions on which the forward-looking information in this news release are based include, but are not limited to: Cenovus’s ability to realize the anticipated benefits of the Husky transaction; the allocation of free cash flow to Cenovus’s balance sheet; commodity prices; future narrowing of crude oil differentials; Cenovus’s ability to produce on
an unconstrained basis; Cenovus’s ability to access sufficient insurance coverage to pursue development plans; Cenovus’s ability to deliver safe and reliable operations and demonstrate strong governance; and the assumptions inherent in Cenovus’s updated 2021 Guidance available on cenovus.com.
The risk factors and uncertainties that could cause actual results to differ materially from the forward-looking information in this news release include, but are not limited to: Cenovus’s ability to realize the anticipated benefits of the Husky transaction; the effectiveness of Cenovus’s risk management program; the accuracy of estimates regarding commodity prices, operating and capital costs and currency and interest rates; risks inherent in the operation of Cenovus’s business; ability to successfully complete development plans and improve asset performance; and risks associated with climate change and Cenovus’s assumptions relating thereto.
Except as required by applicable securities laws, Cenovus disclaims any intention or obligation to publicly update or revise any forward-looking statements, whether as a result of new information, future events or otherwise. Readers are cautioned that the foregoing lists are not exhaustive and are made as at the date hereof. Events or circumstances could cause actual results to differ materially from those estimated or projected and expressed in, or implied by, the forward-looking information. For additional information regarding Cenovus’s material risk factors, the assumptions made, and risks and uncertainties which could cause actual results to differ from the anticipated results, refer to “Risk Management and Risk Factors” and “Advisory” in Cenovus’s MD&A for the period ended June 30, 2021 and to the risk factors, assumptions and uncertainties described in other documents Cenovus files from time to time with securities regulatory authorities in Canada (available on SEDAR at sedar.com, on EDGAR at sec.gov and Cenovus’s website at cenovus.com).
Additional information concerning Husky’s business and assets as of December 31, 2020 may be found in Husky’s MD&A and Annual Information Form, each of which is filed and available on SEDAR under Husky’s profile at sedar.com.
Cenovus Energy Inc.
Cenovus Energy Inc. is an integrated energy company with oil and natural gas production operations in Canada and the Asia Pacific region, and upgrading, refining and marketing operations in Canada and the United States. The company is focused on managing its assets in a safe, innovative and cost-efficient manner, integrating environmental, social and governance considerations into its business plans. Cenovus common shares and warrants are listed on the Toronto and New York stock exchanges, and the company’s preferred shares are listed on the Toronto Stock Exchange. For more information, visit cenovus.com.
Find Cenovus on Facebook, Twitter, LinkedIn, YouTube and Instagram.
Cenovus contacts:
| | | | | |
Investors | Media |
Investor Relations general line | Media Relations general line |
403-766-7711 | 403-766-7751 |
MANAGEMENT’S DISCUSSION AND ANALYSIS
For the periods ended June 30, 2021
This Management’s Discussion and Analysis (“MD&A”) for Cenovus Energy Inc. (which includes references to “we”, “our”, “us”, “its”, the “Company”, or “Cenovus”, and means Cenovus Energy Inc., the subsidiaries of, and partnership interests held by, Cenovus Energy Inc. and its subsidiaries) dated July 28, 2021 should be read in conjunction with our June 30, 2021 unaudited interim Consolidated Financial Statements and accompanying notes (“interim Consolidated Financial Statements”), the December 31, 2020 audited Consolidated Financial Statements and accompanying notes (“Consolidated Financial Statements”) and the December 31, 2020 MD&A (“annual MD&A”). All of the information and statements contained in this MD&A are made as of July 28, 2021, unless otherwise indicated. This MD&A contains forward-looking information about our current expectations, estimates, projections and assumptions. See the Advisory for information on the risk factors that could cause actual results to differ materially and the assumptions underlying our forward-looking information. Cenovus management (“Management”) prepared the MD&A. The interim MD&As and the annual MD&A are reviewed by the Audit Committee and recommended for approval by the Cenovus Board of Directors (“the Board”). Additional information about Cenovus, including our quarterly and annual reports, the Annual Information Form (“AIF”) and Form 40-F, is available on SEDAR at sedar.com, on EDGAR at sec.gov, and on our website at cenovus.com. Information on or connected to our website, even if referred to in this MD&A, does not constitute part of this MD&A. On January 1, 2021, pursuant to a plan of arrangement under the Business Corporations Act (Alberta), Husky Energy Inc. (“Husky”) became a wholly-owned subsidiary of Cenovus. Husky was subsequently amalgamated with Cenovus on March 31, 2021 (the “amalgamation”) under the Canada Business Corporations Act and ceased to make separate filings as a reporting issuer. Unless the context requires otherwise, any reference herein to Husky refers to the business and operations of Husky prior to the amalgamation. In connection with its acquisition of Husky and in accordance with applicable securities laws, Cenovus filed a business acquisition report on March 26, 2021 containing the pro forma financial statements of the combined company as at December 31, 2020. Additional information concerning Husky’s business and assets as at December 31, 2020 may be found in the annual information form of Husky dated February 8, 2021 for the year ended December 31, 2020 (the “Husky AIF”) and Husky’s management’s discussion and analysis of the financial and operating results for the year ended December 31, 2020 (the "Husky MD&A"), each of which is filed and available on SEDAR under Husky’s profile at sedar.com.
Basis of Presentation
This MD&A and the interim Consolidated Financial Statements and comparative information have been prepared in Canadian dollars, (which includes references to “dollar” or “$”), except where another currency has been indicated, and in accordance with International Financial Reporting Standards (“IFRS” or “GAAP”) as issued by the International Accounting Standards Board (“IASB”). Production volumes are presented on a before royalties basis.
Non-GAAP Measures and Additional Subtotals
Certain financial measures in this document do not have a standardized meaning as prescribed by IFRS, such as Netbacks, Adjusted Funds Flow, Free Funds Flow, Net Debt, Capitalization and Adjusted Earnings Before Interest, Taxes, Depreciation and Amortization (“Adjusted EBITDA”) and therefore are considered non-GAAP measures. In addition, Operating Margin is considered an additional subtotal found in Note 1 of our interim Consolidated Financial Statements. These measures may not be comparable to similar measures presented by other issuers. These measures have been described and presented in order to provide shareholders and potential investors with additional measures for analyzing our ability to generate funds to finance our operations and information regarding our liquidity. This additional information should not be considered in isolation or as a substitute for measures prepared in accordance with IFRS. The definition and reconciliation, if applicable, of each non-GAAP measure or additional subtotal is presented in the Operating and Financial Results, Liquidity and Capital Resources, or Advisory sections of this MD&A.
We are a Canadian-based integrated energy company headquartered in Calgary, Alberta. Our common shares and warrants are listed on the Toronto (“TSX”) and New York (“NYSE”) stock exchanges. Our cumulative redeemable preferred shares Series 1, 2, 3, 5 and 7 are listed on the TSX. We are the third largest Canadian-based crude oil and natural gas producer and the second largest Canadian-based refiner and upgrader, with operations in Canada, the United States (“U.S.”) and the Asia Pacific region. Our upstream operations include oil sands projects in northern Alberta, thermal and conventional crude oil, natural gas and natural gas liquids (“NGLs”) projects across Western Canada, crude oil production offshore Newfoundland and Labrador and natural gas and NGLs production offshore China and Indonesia. Our downstream operations include upgrading, refining and retail operations in Canada and the U.S.
Our operations involve activities across the full value chain to develop, transport, produce and market crude oil and natural gas in Canada and internationally. Our physically integrated upstream and downstream operations help us mitigate the impact of volatility in light-heavy crude oil differentials and contributes to our bottom line by capturing value from crude oil and natural gas production through to the sale of finished products like transportation fuels.
During the three months ended June 30, 2021, crude oil production from our Oil Sands assets averaged 549.4 thousand barrels per day which is generally aligned with our downstream crude oil throughput of 539.0 thousand barrels per day. Total upstream production averaged 765.9 thousand barrels of oil equivalent (“BOE”) per day.
Cenovus and Husky Arrangement
On January 1, 2021, Cenovus and Husky Energy Inc. (“Husky”) closed the transaction to combine the two companies through a plan of arrangement (the “Arrangement”) pursuant to which Cenovus acquired all the issued and outstanding common shares of Husky in exchange for common shares and common share purchase warrants of Cenovus. In addition, all of the issued and outstanding Husky preferred shares were exchanged for Cenovus preferred shares with substantially identical terms.
The Arrangement combines high quality oil sands and heavy oil assets with extensive trading, supply and logistics infrastructure, and downstream assets, which creates opportunities to optimize the margin captured across the heavy oil value chain. With the combination of processing capacity and market access outside Alberta for the majority of the Company’s oil sands and heavy oil production, exposure to Alberta heavy oil price differentials is reduced while maintaining exposure to global commodity prices.
Our Strategy
Our strategy remains focused on maximizing shareholder value through cost leadership and realizing the best margins for our products. Our diverse and integrated portfolio will help us to deliver stable cash flow through price cycles while maintaining safe and reliable operations. The Company has a cost-and-market-advantaged asset portfolio, and prioritizes free funds flow generation, balance sheet strength and returns to shareholders. We remain focused on reducing Net Debt (as defined in this MD&A) and sustainably growing shareholder returns. We believe that maintaining a strong balance sheet will help Cenovus navigate through commodity price volatility.
Our financial framework has established an interim Net Debt target of $10 billion and longer term, $8 billion or lower which is in line with a target of a Net Debt to Adjusted EBITDA ratio of less than two times at the bottom of the cycle, which we see as approximately US$45 per barrel WTI. We plan to use our capital allocation framework to evaluate disciplined investments in our portfolio against dividends, share repurchases and managing to the optimal debt level while maintaining investment grade status. Environmental, Social and Governance ("ESG") considerations are embedded into our framework and business plan. Our investment focus will be on areas where we believe we have the greatest competitive advantage to generate the highest returns.
On January 28, 2021, we announced our 2021 budget focused on sustaining capital and generating Free Funds Flow to strengthen the balance sheet, accelerated by capturing transaction-related synergies across the organization. 2021 guidance dated January 28, 2021, and updated on July 28, 2021, is available on our website at cenovus.com.
Our Operations
The Company operates through the following reportable segments:
Upstream Segments
•Oil Sands, includes the development and production of bitumen and heavy oil in northern Alberta and Saskatchewan. Cenovus’s oil sands assets include Foster Creek, Christina Lake, Sunrise (jointly owned with BP Canada Energy Group ULC (“BP Canada”) and operated by Cenovus) and Tucker oil sands projects, as well as Lloydminster thermal and cold and enhanced oil recovery ("EOR") assets. Cenovus jointly owns and operates pipeline gathering systems and terminals through the equity-accounted investment in Husky Midstream Limited Partnership (“HMLP”). The sale and transportation of Cenovus’s production and third-party commodity trading volumes are managed and marketed
through access to capacity on third-party pipelines and storage facilities in both Canada and the U.S. to optimize product mix, delivery points, transportation commitments and customer diversification.
•Conventional, includes assets rich in NGLs and natural gas within the Elmworth-Wapiti, Kaybob‑Edson, Clearwater and Rainbow Lake operating areas in Alberta and British Columbia and interests in numerous natural gas processing facilities. Cenovus’s NGLs and natural gas production is marketed and transported with other third-party commodity trading volumes through access to capacity on third-party pipelines, export terminals and storage facilities, which provides flexibility for market access to optimize product mix, delivery points, transportation commitments and customer diversification.
•Offshore, includes offshore operations, exploration and development activities in China and the east coast of Canada, as well as the equity-accounted investment in the Husky-CNOOC Madura Ltd. (“HCML”) joint venture in Indonesia.
Downstream Segments
•Canadian Manufacturing, includes the owned and operated Lloydminster upgrading and asphalt refining complex which upgrades heavy oil into synthetic crude oil, diesel fuel and asphalt. Cenovus seeks to maximize the value per barrel from its heavy oil production through its integrated network of assets. In addition, Cenovus owns and operates the Bruderheim crude-by-rail terminal and two ethanol plants. Cenovus also markets its production and third-party commodity trading volumes of synthetic crude oil, asphalt and ancillary products.
•U.S. Manufacturing, includes the refining of crude oil to produce diesel fuel, gasoline, jet fuel, asphalt and other products at the wholly-owned Lima Refinery and Superior Refinery, the Wood River and Borger refineries (jointly owned with operator Phillips 66) and the Toledo Refinery (jointly owned with operator BP Products North America Inc. (“BP”)). Cenovus also markets its own and third-party volumes of refined petroleum products including gasoline, diesel and jet fuel.
•Retail, includes the marketing of our own and third-party volumes of refined petroleum products, including gasoline and diesel, through retail, commercial and bulk petroleum outlets, as well as wholesale channels in Canada.
Corporate and Eliminations, primarily includes Cenovus-wide costs for general and administrative, financing activities, foreign exchange gain or loss and gain or loss on risk management on corporate related derivative instruments. Eliminations include adjustments for internal usage of natural gas production between segments, transloading services provided to the Oil Sands segment by the Company’s crude-by-rail terminal and crude oil production used as feedstock by the Canadian Manufacturing and U.S. Manufacturing segments. Eliminations are recorded at transfer prices based on current market prices.
To conform to the presentation adopted for the current period’s operating segments, the following comparatives prior to January 1, 2021, have been reclassified:
•The Company’s market optimization activities, previously reported in the Refining and Marketing segment, have been reclassified to the Oil Sands and Conventional segments.
•The Bruderheim crude-by-rail terminal results, previously reported under the Refining and Marketing segment, have been reclassified to the Canadian Manufacturing segment.
•The refining activities in the U.S. with operator Phillips 66, previously reported in the Refining and Marketing segment, have been reclassified to the U.S. Manufacturing segment.
•The Company’s unrealized gain and loss on risk management, previously reported in the Corporate and Eliminations segment, have been reclassified to the reportable segment to which the derivative instrument relates.
The Arrangement was accounted for using the acquisition method pursuant to IFRS 3, “Business Combinations”. Under the acquisition method, assets and liabilities are measured at their estimated fair value on the date of acquisition with the exception of income tax, stock-based compensation, lease liabilities and right-of-use (“ROU”) assets. The total consideration was allocated to the tangible and intangible assets acquired and liabilities assumed. Comparative figures in this MD&A include Cenovus results prior to the closing of the Arrangement on January 1, 2021, and does not reflect any historical data from Husky. Significant differences on operating and financial results compared with 2020 are primarily the result of the Arrangement.
The preliminary purchase price allocation is based on Management’s best estimate of the assets acquired and liabilities assumed. The Company will finalize the value of net assets acquired by December 31, 2021, and adjustments to initial estimates, including goodwill, may be required. No significant adjustments were made to the preliminary purchase price allocation as at June 30, 2021.
| | |
| QUARTERLY RESULTS OVERVIEW |
During the second quarter, we continued to build on our strong operational performance in the first quarter with our integrated asset base and the improving commodity price environment driving financial results. The strong results helped us reduce our net debt by nearly $1 billion during the three months ended June 30, 2021.
During the quarter we sold our GORR interest in Marten Hills for gross cash proceeds of approximately $100 million. We also entered into definitive agreements to sell assets within the Conventional segment located in the East Clearwater area and the Kaybob area for combined gross proceeds of approximately $110 million. The Kaybob transaction closed in July and the East Clearwater transaction is expected to close in the third quarter of 2021.
Cenovus also focused on health and safety as our top priority while maintaining our low operating and capital cost structure.
| | | | | | | | | | | | | | | | | | | | | | | | | | | | | | | | | | | | | | | | | | | | | | | | | | | | | | | | | | | | | | | | | | | | | | | | | | | | | | | | | | | |
| Six Months
Ended
June 30, | | | | | | | | | | | | | | | | | | | | | | |
| | 2021 | | 2020 | | | 2019 | |
| ($ millions, except where indicated) | | 2021 | | | 2020 | | | Q2 | | | Q1 | | Q4 | | Q3 | | Q2 | | Q1 | | | Q4 | | Q3 | | Q2 | |
| | | | | | | | | | | | | | | | | | | | | | | | | | | |
Production Volumes (MBOE/d) | | 767.6 | | | | 474.0 | | | | 765.9 | | | | 769.3 | | | 467.2 | | | 471.8 | | | 465.4 | | | 482.6 | | | | 467.4 | | | 448.5 | | | 443.3 | | |
| | | | | | | | | | | | | | | | | | | | | | | | | | | |
Crude Throughput (1) (Mbbls/d) | | 504.2 | | | | 191.7 | | | | 539.0 | | | | 469.1 | | | 169.0 | | | 191.1 | | | 162.3 | | | 221.1 | | | | 227.9 | | | 232.4 | | | 237.0 | | |
| | | | | | | | | | | | | | | | | | | | | | | | | | | |
Revenues (2) | | 19,727 | | | | 6,135 | | | | 10,577 | | | | 9,150 | | | 3,426 | | | 3,659 | | | 2,174 | | | 3,961 | | | | 4,838 | | | 4,736 | | | 5,603 | | |
| | | | | | | | | | | | | | | | | | | | | | | | | | | |
Operating Margin (3) | | 4,063 | | | | (298) | | | | 2,184 | | | | 1,879 | | | 625 | | | 594 | | | 291 | | | (589) | | | | 864 | | | 1,080 | | | 1,277 | | |
| | | | | | | | | | | | | | | | | | | | | | | | | | | |
Cash From (Used in) Operating
Activities | | 1,597 | | | | (709) | | | | 1,369 | | | | 228 | | | 250 | | | 732 | | | (834) | | | 125 | | | | 740 | | | 834 | | | 1,275 | | |
| | | | | | | | | | | | | | | | | | | | | | | | | | | |
Adjusted Funds Flow (4) | | 2,958 | | | | (623) | | | | 1,817 | | | | 1,141 | | | 333 | | | 407 | | | (469) | | | (154) | | | | 679 | | | 917 | | | 1,075 | | |
| | | | | | | | | | | | | | | | | | | | | | | | | | | |
| Net Earnings (Loss) | | 444 | | | | (2,032) | | | | 224 | | | | 220 | | | (153) | | | (194) | | | (235) | | | (1,797) | | | | 113 | | | 187 | | | 1,784 | | |
Per Share ($) (5) | | 0.21 | | | | (1.65) | | | | 0.11 | | | | 0.10 | | | (0.12) | | | (0.16) | | | (0.19) | | | (1.46) | | | | 0.09 | | | 0.15 | | | 1.45 | | |
| | | | | | | | | | | | | | | | | | | | | | | | | | | |
Capital Investment (6) | | 1,081 | | | | 451 | | | | 534 | | | | 547 | | | 242 | | | 148 | | | 147 | | | 304 | | | | 317 | | | 294 | | | 248 | | |
| | | | | | | | | | | | | | | | | | | | | | | | | | | |
Net Debt (7) | | 12,390 | | | | 8,232 | | | | 12,390 | | | | 13,340 | | | 7,184 | | | 7,530 | | | 8,232 | | | 7,421 | | | | 6,513 | | | 6,802 | | | 7,088 | | |
| | | | | | | | | | | | | | | | | | | | | | | | | | | |
| Cash Dividends | | | | | | | | | | | | | | | | | | | | | | | | | | | |
| Common Shares | | 71 | | | | 77 | | | | 36 | | | | 35 | | | — | | | — | | | — | | | 77 | | | | 77 | | | 60 | | | 62 | | |
Per Common Share ($) | | 0.0350 | | | | 0.0625 | | | | 0.0175 | | | | 0.0175 | | | — | | | — | | | — | | | 0.0625 | | | | 0.0625 | | | 0.0500 | | | 0.0500 | | |
| Preferred Shares | | 17 | | | | — | | | | 8 | | | | 9 | | | — | | | — | | | — | | | — | | | | — | | | — | | | — | | |
(1)Represents Cenovus’s net interest in refining operations. The comparative periods have been restated to Cenovus’s net interest.
(2)Comparative figures have been re-presented for portion of inventory write-downs reclassified to royalties.
(3)Additional subtotal found in Note 1 of the interim Consolidated Financial Statements and defined in this MD&A.
(4)Non-GAAP measure defined in this MD&A. Comparative figures have been restated to conform with the definition in this MD&A.
(5)Represented on a basic and diluted per share basis.
(6)Includes expenditures on property, plant and equipment (“PP&E”) and exploration and evaluation (“E&E”) assets.
(7)Non-GAAP measure defined in this MD&A. Includes long-term debt and short-term borrowings assumed at fair value of $6,642 million as part of the Arrangement.
Crude oil prices and market crack spreads continued to improve in the second quarter compared with the first quarter and the first six months of 2020. Rebounding crude oil global demand amid roll out efforts of the novel coronavirus (“COVID-19”) vaccines, economic recoveries, and declines in crude oil inventories drove improved commodity markets.
Operationally, variables under Management's control performed very well. Our upstream production averaged 765.9 thousand BOE per day in the second quarter, compared with 465.4 thousand BOE per day in the second quarter of 2020. Assets acquired in the Arrangement averaged 286.8 thousand BOE per day during the quarter. Christina Lake increased production compared with 2020, and Foster Creek production declined slightly compared with 2020 as we completed a planned maintenance turnaround. Our Lloydminster thermal assets continue to perform well as we apply our operating strategy and production and well delivery techniques.
Our downstream crude throughput averaged 539.0 thousand barrels per day in the second quarter compared with 162.3 thousand barrels per day in the second quarter of 2020. Assets acquired in the Arrangement averaged 330.1 thousand barrels per day of crude throughput during the quarter. The Lloydminster Upgrader and Lloydminster Refinery ran near capacity throughout the quarter. Our U.S. refineries had increased utilization rates driven by increased demand, partially offset by the impact of planned and unplanned outages.
In the second quarter we incurred $46 million of integration expenditures, including capital of $12 million. Year-to-date expenditures, including capital, are approximately $291 million of the $400 million to $450 million expected in 2021 as integration work continues throughout the year.
Following the close of the Arrangement we anticipated that we could achieve approximately $600 million in run-rate synergies within the first six months of 2021. We have achieved this objective.
We prioritize ongoing ESG leadership and integration of sustainability considerations into our business decisions. During the quarter, we announced the Oil Sands Pathways to Net Zero initiative, an alliance of peers working collectively with the federal and provincial governments with a goal to achieve net zero greenhouse gas ("GHG") emissions from oil sands operations by 2050.
In the second quarter we:
•Generated cash flow from operating activities of $1,369 million. Adjusted funds flow was $1,817 million and capital investment was $534 million, resulting in Free Funds Flow of $1,283 million.
•Generated an operating margin of $2,184 million compared with $291 million in the second quarter of 2020, primarily due to higher average realized crude oil, NGLs and natural gas sales prices, higher market crack spreads, and increased sales volumes from assets acquired in the Arrangement.
•Reduced our net debt by nearly $1 billion.
•Sold our GORR interest in Marten Hills for gross cash proceeds of approximately $100 million.
We expect our total capital expenditures to be between $2.3 billion and $2.7 billion in 2021, including sustaining capital of approximately $2.1 billion, and $520 million to $570 million (excluding insurance proceeds) for the Superior Refinery rebuild. We will continue to be disciplined with our capital. Our updated guidance dated July 28, 2021 is available on our website at cenovus.com.
Cenovus remains committed to the health and safety of its workforce and the public while providing essential services. Physical distancing measures continue to be in place to maintain the health and safety of our people and to help mitigate the risk of COVID-19 at our workplaces. We continue to monitor the changing COVID-19 situation and respond accordingly in a timely manner. Work-from-home measures remained in place for the quarter and continue to be in place for all non-essential staff at our combined offices and worksites in Alberta, Saskatchewan and Manitoba, pending further review. The full scope of our operations will continue to take direction from local health authorities regarding their COVID-19 workplace mandates. Staff levels at sites and offices have and will continue to follow guidance received from the applicable federal, provincial, state and local governments and public health officials.
| | |
| OPERATING AND FINANCIAL RESULTS |
Selected Operating Results
| | | | | | | | | | | | | | | | | | | | | | | | | | | | | | | | | | | | | | | | | | | | | | | | | | | | | |
| Three Months Ended
June 30, | | Six Months Ended
June 30, | |
|
| | | | Percent Change | | | | | | | | | Percent Change | | | | |
| 2021 | | | | | 2020 | | | 2021 | | | | | 2020 | |
| Upstream Production Volumes | | | | | | | | | | | | | | | | | |
Oil Sands (Mbbls/d) | | | | | | | | | | | | | | | | | |
| Foster Creek | 156.8 | | | (6) | | | | 166.0 | | | 159.9 | | | (3) | | | | 164.9 | |
| Christina Lake | 230.5 | | | 11 | | | | 207.2 | | | 226.7 | | | 5 | | | | 215.2 | |
Sunrise (1) | 22.4 | | | | | | — | | | 25.1 | | | | | | — | |
| Lloydminster Thermal | 97.7 | | | | | | — | | | 96.9 | | | | | | — | |
| Tucker | 21.2 | | | | | | — | | | 22.2 | | | | | | — | |
| Lloydminster Cold/EOR | 20.8 | | | | | | — | | | 20.7 | | | | | | — | |
Total Oil Sands Crude Oil | 549.4 | | | 47 | | | | 373.2 | | | 551.5 | | | 45 | | | | 380.1 | |
| | | | | | | | | | | | | | | | | |
Conventional (MBOE/d) | 141.3 | | | 53 | | | | 92.2 | | | 138.6 | | | 48 | | | | 93.9 | |
| | | | | | | | | | | | | | | | | |
Offshore (MBOE/d) | | | | | | | | | | | | | | | | | |
Asia Pacific (2) | 57.8 | | | | | | — | | | 59.3 | | | | | | — | |
| Atlantic | 15.2 | | | | | | — | | | 16.1 | | | | | | — | |
Offshore Total | 73.0 | | | | | | — | | | 75.4 | | | | | | — | |
| | | | | | | | | | | | | | | | | |
Total Production Volumes (MBOE/d) | 765.9 | | | 65 | | | | 465.4 | | | 767.6 | | | 62 | | | | 474.0 | |
| | | | | | | | | | | | | | | | | |
Total Upstream Sales Volumes (3) (MBOE/d) | 673.3 | | | 66 | | | | 406.5 | | | 681.8 | | | 62 | | | | 421.2 | |
| | | | | | | | | | | | | | | | | |
| Downstream Manufacturing Crude Throughput | | | | | | | | | | | | | | | | | |
Canadian Manufacturing (Mbbls/d) | | | | | | | | | | | | | | | | | |
Lloydminster Upgrader | 76.1 | | | | | | — | | | 77.2 | | | | | | — | |
Lloydminster Refinery | 27.4 | | | | | | — | | | 27.6 | | | | | | — | |
Canadian Manufacturing Total | 103.5 | | | | | | — | | | 104.8 | | | | | | — | |
U.S. Manufacturing (Mbbls/d) | | | | | | | | | | | | | | | | | |
Lima Refinery | 160.9 | | | | | | — | | | 142.9 | | | | | | — | |
Wood River and Borger refineries (1) | 208.9 | | | 29 | | | | 162.3 | | | 189.6 | | | (1) | | | | 191.7 | |
Toledo Refinery (1) | 65.7 | | | | | | — | | | 66.9 | | | | | | — | |
U.S. Manufacturing Total | 435.5 | | | 168 | | | | 162.3 | | | 399.4 | | | 108 | | | | 191.7 | |
| | | | | | | | | | | | | | | | | |
Total Throughput (Mbbls/d) | 539.0 | | | 232 | | | | 162.3 | | | 504.2 | | | 163 | | | | 191.7 | |
| | | | | | | | | | | | | | | | | |
Retail (millions of litres/d) | | | | | | | | | | | | | | | | | |
| Fuel sales, including wholesale | 6.7 | | | | | | — | | | 6.6 | | | | | | — | |
(1)Represents Cenovus’s 50 percent interest in Sunrise, Wood River, Borger and Toledo operations.
(2)Reported production volumes reflect Cenovus’s 40 percent interest in the Madura-BD gas project. Revenues and expenses related to the HCML joint venture are accounted for using the equity method for consolidated financial statement purposes.
(3)Has been reduced for natural gas volumes used for internal consumption by the Oil Sands segment of 510 MMcf/d and 515 MMcf/d for the three and six months ended June 30, 2021, respectively (334 MMcf/d and 340 MMcf/d for the three and six months ended June 30, 2020, respectively).
Upstream Production Volumes
Our Oil Sands assets continued their strong performance from the first quarter of 2021. Christina Lake production increased from the first quarter as wells came online. We had a planned turnaround and operational outages at Foster Creek which lowered production compared with the first quarter. Assets acquired in the Arrangement averaged 162.1 thousand barrels per day in the second quarter. Our Lloydminster thermal assets continue to perform well as we apply our operating strategy and production and well delivery techniques. We completed planned maintenance turnaround at Sunrise during the quarter, impacting production.
Conventional production increased compared with the first quarter of 2021 as new wells were brought online. Assets acquired in the Arrangement continued their strong performance, averaging 51.7 thousand BOE per day during the quarter.
In the second quarter, Offshore production declined marginally compared with the first quarter of 2021 averaging 73.0 thousand BOE per day. This was due to planned maintenance in China and Indonesia. Offshore production is entirely from assets acquired in the Arrangement.
Downstream Manufacturing
Crude Throughput by Segment
Crude throughput increased compared with the first quarter as the market continued to improve. During the second quarter, our U.S. refineries averaged a crude utilization rate of 87 percent driven by increased demand, partially offset by the impact of planned and unplanned outages. The Lloydminster Upgrader and Lloydminster Refinery ran at or near capacity throughout the first half of 2021.
At the Wood River and Borger refineries, throughput was impacted by planned maintenance turnarounds that began in the first quarter. The turnaround at Borger was completed in early April and the turnaround at Wood River was completed in mid-May. Throughput at the Wood River and Borger refineries was further impacted, temporarily, by unplanned outages during the second quarter. In addition, the Wood River refinery implemented crude rate reductions in line with market demand.
At the Lima Refinery, throughput was affected in the first quarter of 2021 by a temporary unplanned outage and the impact of winter storm Uri on a key pipeline supplying the Lima Refinery’s feedstock. Throughput ramped up in March as market crack spreads improved. In the second quarter, planned third-party maintenance at the Mid-Valley and West Texas Gulf pipelines reduced throughput, which ramped up upon completion of the maintenance.
At the Toledo Refinery, throughput was optimized in line with market demand in the first half of 2021.
Further information on the changes in our financial and operating results can be found in the Reportable Segments section of this MD&A. Information on our risk management activities can be found in the Risk Management and Risk Factors section of this MD&A and in the notes to the Consolidated Financial Statements.
Selected Consolidated Financial Results
Operating Margin
Operating Margin is an additional subtotal found in Note 1 of the interim Consolidated Financial Statements and is used to provide a consistent measure of the cash generating performance of our assets for comparability of our underlying financial performance between periods. Operating Margin is defined as revenues less purchased product, transportation and blending, operating expenses, plus realized gains less realized losses on risk management activities. Items within the Corporate and Eliminations segment are excluded from the calculation of Operating Margin.
| | | | | | | | | | | | | | | | | | | | | | | | | | | | | | | | | | | | | | | | | | | | | | | |
| | Three Months Ended
June 30, | | | | Six Months Ended
June 30, | |
| ($ millions) | | 2021 | | | | 2020 (1) | | | | 2021 | | | | 2020 (1) | |
| Gross Sales | | 12,386 | | | | | 2,286 | | | | | 23,058 | | | | | 6,524 | | |
| Less: Royalties | | 533 | | | | | 21 | | | | | 906 | | | | | 75 | | |
| Revenues | | 11,853 | | | | | 2,265 | | | | | 22,152 | | | | | 6,449 | | |
| Expenses | | | | | | | | | | | | | | | |
| Purchased Product | | 6,363 | | | | | 762 | | | | | 11,430 | | | | | 2,959 | | |
| Transportation and Blending | | 1,802 | | | | | 651 | | | | | 3,602 | | | | | 2,579 | | |
| Operating Expenses | | 1,306 | | | | | 502 | | | | | 2,608 | | | | | 1,126 | | |
| Realized (Gain) Loss on Risk Management Activities | | 198 | | | | | 59 | | | | | 449 | | | | | 83 | | |
| Operating Margin | | 2,184 | | | | | 291 | | | | | 4,063 | | | | | (298) | | |
(1)Inventory write-downs prior to January 1, 2021, have been reclassified to royalties, purchased product, transportation and blending or operating expenses to conform with the current presentation of inventory write-downs.
Operating Margin by Segment
Three Months Ended June 30, 2021
Operating Margin increased in the second quarter of 2021 compared with 2020 primarily due to:
•Higher average crude oil, NGLs and natural gas sales prices resulting from higher benchmark pricing.
•Increased upstream and refined products sales volumes from assets acquired in the Arrangement.
•Increased crude throughput and higher market crack spreads.
These increases in Operating Margin were partially offset by:
•Increased blending costs due to higher condensate prices.
•Product inventory write-downs recognized in the first quarter of 2020 of $345 million and $243 million related to our upstream and downstream assets, respectively, and mostly sold in the second quarter of 2020.
•Higher realized risk management losses due to the settlement of benchmark prices relative to our risk management contract prices.
Six Months Ended June 30, 2021
Operating Margin increased in the first half of 2021 compared with 2020 primarily due to:
•Higher average crude oil, NGLs and natural gas sales prices resulting from higher benchmark pricing.
•Increased upstream sales volumes from assets acquired in the Arrangement.
•Higher Operating Margin from our Canadian Manufacturing and U.S. Manufacturing segments primarily due to increased crude throughput and higher market crack spreads.
These increases in Operating Margin were partially offset by increased blending costs due to higher condensate prices, and higher realized risk management losses due to the settlement of benchmark prices relative to our risk management contract prices.
Cash From (Used in) Operating Activities and Adjusted Funds Flow
Adjusted Funds Flow is a non-GAAP measure commonly used in the oil and gas industry to assist in measuring a company’s ability to finance its capital programs and meet its financial obligations. Adjusted Funds Flow is defined as cash from (used in) operating activities excluding settlement of decommissioning liabilities and net change in non-cash working capital. Non-cash working capital is composed of accounts receivable, inventories (excluding non-cash inventory write-downs and reversals), income tax receivable, accounts payable and income tax payable.
| | | | | | | | | | | | | | | | | | | | | | | | | | | | | | | | | | | | | | | | | | | | | | | |
| | Three Months Ended
June 30, | | | | Six Months Ended
June 30, | |
| ($ millions) | | 2021 | | | | 2020 | | | | 2021 | | | | 2020 | |
| Cash From (Used in) Operating Activities | | 1,369 | | | | | (834) | | | | | 1,597 | | | | | (709) | | |
| (Add) Deduct: | | | | | | | | | | | | | | | |
Settlement of Decommissioning Liabilities | | (18) | | | | | (2) | | | | | (29) | | | | | (33) | | |
| Net Change in Non-Cash Working Capital | | (430) | | | | | (363) | | | | | (1,332) | | | | | (53) | | |
Adjusted Funds Flow (1) | | 1,817 | | | | | (469) | | | | | 2,958 | | | | | (623) | | |
(1)The comparative period has been restated to conform with the current period definition of Adjusted Funds Flow.
Cash From Operating Activities and Adjusted Funds Flow were higher in the three months ended June 30, 2021 compared with 2020 due to increased Operating Margin, as discussed above, combined with distributions received from equity-accounted affiliates. The increase was partially offset by higher finance costs and higher general and administrative expenses. The change in non-cash working capital in the second quarter of 2021 was primarily due to an increase in inventories and accounts receivable, partially offset by an increase in accounts payable on June 30, 2021 compared with March 31, 2021.
In the three months ended June 30, 2021, the increase in accounts receivable was primarily due to higher commodity prices partially offset by the receipt of insurance proceeds from the Superior Refinery rebuild project. The increase in inventory was primarily due to higher crude oil inventory related to Foster Creek and Christina Lake combined with higher crude oil and finished goods inventory at Lima. The increase in accounts payable relates to higher feedstock prices in the U.S. Manufacturing segment combined with higher risk management liabilities in the Oil Sands segment.
Cash From Operating Activities and Adjusted Funds Flow were higher in the six months ended June 30, 2021, compared with the first half of 2020 due to increased Operating Margin, as discussed above, combined with distributions received from equity-accounted affiliates. The increase was partially offset by integration costs of $257 million, and long-term incentives of $111 million paid related to the accelerated payout to our employees in connection with the Arrangement, higher finance costs and increased general and administrative expenses. The change in non-cash working capital in the first half of 2021 was primarily due to an increase in inventories and accounts receivable, partially offset by an increase in accounts payable on June 30, 2021 compared with December 31, 2020.
In the six months ended June 30, 2021 the increase in accounts receivable was primarily due to the higher crude oil and refined product pricing in the Oil Sands and U.S. Manufacturing segment, partially offset by lower sales volumes exiting the quarter at Foster Creek and Christina Lake compared with December 2020. The increase in inventory compared with 2020 was primarily due to higher commodity prices and refined product pricing, combined with higher Foster Creek and Christina Lake volumes held in inventory. The increase in accounts payable was primarily due to higher crude oil and feedstock prices combined with an increase in risk management liabilities, partially offset by the settlement of the integration costs, long-term incentive costs to Cenovus employees and the payment of long-term incentives liability assumed as part of the Arrangement.
Net Earnings (Loss)
| | | | | | | | | | | | | | | | | | | | | | | |
| ($ millions) | | Three Months Ended | | | | Six Months
Ended | |
| Net Earnings (Loss) for the Periods Ended June 30, 2020 | | (235) | | | | | (2,032) | | |
| Increase (Decrease) due to: | | | | | | | |
| Operating Margin | | 1,893 | | | | | 4,361 | | |
| Corporate and Eliminations: | | | | | | | |
| Unrealized Foreign Exchange Gain (Loss) | | (96) | | | | | 700 | | |
| Re-measurement of Contingent Payment | | (185) | | | | | (502) | | |
| Integration costs | | (34) | | | | | (257) | | |
| General and Administrative | | (74) | | | | | (260) | | |
| Finance costs | | (93) | | | | | (230) | | |
Other (1) | | 24 | | | | | 13 | | |
| Unrealized Risk Management Gain (Loss) | | (276) | | | | | (122) | | |
| Depreciation, Depletion and Amortization | | (456) | | | | | (558) | | |
| Exploration Expense | | — | | | | | (3) | | |
| Income Tax Recovery (Expense) | | (244) | | | | | (666) | | |
| Net Earnings (Loss) for the Periods Ended June 30, 2021 | | 224 | | | | | 444 | | |
(1)Includes interest income, realized foreign exchange (gains) losses, (gain) loss on divestiture of assets, other (income) loss, net, and share of income (loss) from equity-accounted affiliates, and Corporate and Eliminations revenues, purchased product, transportation and blending, operating expenses, and (gain) loss on risk management.
Net Earnings of $224 million in the second quarter of 2021 was significantly higher than the Net Loss of $235 million in 2020 due to higher Operating Margin, as discussed above. The increase was partially offset by higher unrealized risk management losses, lower unrealized foreign exchange gains, a loss on the re-measurement of the contingent payment of $249 million (2020 – $64 million), and increased finance expenses, depreciation, depletion and amortization (“DD&A”) expense and income tax expense as result of the Arrangement.
On a year-to-date basis, Net Earnings of $444 million was significantly higher than the Net Loss of $2,032 million in the first half of 2020 due to higher Operating Margin, as discussed above, an impairment loss of $315 million in the first quarter of 2020, and gains on unrealized foreign exchange compared with losses in 2020. This was partially offset by a loss on the re-measurement of the contingent payment of $436 million (2020 – $66 million gain), integration costs of $257 million, and higher general and administrative costs, finance costs, DD&A expense and income tax expense as a result of the Arrangement.
Net Debt
Net Debt is a non-GAAP measure used to monitor our capital structure. Net Debt is defined as short-term borrowings, and the current and long-term portions of long-term debt, net of cash and cash equivalents and short-term investments.
| | | | | | | | | | | | | | | | | | | | | | | |
($ millions) As at | | June 30,
2021 | | | | December 31,
2020 | |
| | | | | | | |
| Short-Term Borrowings | | 65 | | | | | 121 | | |
| Long-Term Debt, including current portion | | 13,380 | | | | | 7,441 | | |
| Less: Cash and Cash Equivalents | | (1,055) | | | | | (378) | | |
| Net Debt | | 12,390 | | | | | 7,184 | | |
Net Debt on January 1, 2021, was $13.1 billion, including the fair value of $5.9 billion assumed from the Arrangement. Since the Arrangement, we have reduced our net debt by $701 million, including nearly $1 billion during the second quarter of 2021.
Capital Investment (1) (2)
| | | | | | | | | | | | | | | | | | | | | | | | | | | | | | | | | | | | | | | | | | | | | | | |
| | Three Months Ended
June 30, | | | | Six Months Ended
June 30, | |
| ($ millions) | | 2021 | | | | 2020 | | | | 2021 | | | | 2020 | |
| Upstream | | | | | | | | | | | | | | | |
| Oil Sands | | 201 | | | | | 78 | | | | | 419 | | | | | 272 | | |
| Conventional | | 28 | | | | | 11 | | | | | 94 | | | | | 27 | | |
| Offshore | | 35 | | | | | — | | | | | 61 | | | | | — | | |
| | 264 | | | | | 89 | | | | | 574 | | | | | 299 | | |
| Downstream | | | | | | | | | | | | | | | |
| Canadian Manufacturing | | 10 | | | | | 7 | | | | | 14 | | | | | 17 | | |
| U.S. Manufacturing | | 237 | | | | | 39 | | | | | 442 | | | | | 90 | | |
| Retail | | 5 | | | | | — | | | | | 6 | | | | | — | | |
| | 252 | | | | | 46 | | | | | 462 | | | | | 107 | | |
| Corporate and Eliminations | | 18 | | | | | 12 | | | | | 45 | | | | | 45 | | |
| Capital Investment | | 534 | | | | | 147 | | | | | 1,081 | | | | | 451 | | |
(1)Includes expenditures on PP&E and E&E assets.
(2)Prior periods have been reclassified to conform with current period’s operating segments.
Oil Sands capital investment in the first six months of 2021 was primarily for sustaining production focused at Christina Lake, Foster Creek and the Lloydminster thermal assets.
Conventional capital investment focused on predictable short cycle, high return development wells which are expected to improve underlying cost structures through volume enhancement and offset natural declines.
Offshore capital investment in the first six months of 2021 was primarily preservation capital for the West White Rose project in the Atlantic. The West White Rose project was deferred in March of 2020 and remains deferred for 2021 while we continue to evaluate options with our partners.
U.S. Manufacturing capital investment focused primarily on the Superior Refinery rebuild, combined with refining reliability, maintenance and yield optimization projects at the Wood River and Borger refineries.
Drilling Activity
| | | | | | | | | | | | | | | | | | | | | | | | | | | | | | | | | | | | | | | | | | | | | | | |
| | Gross Stratigraphic Test Wells | | | Gross Production Wells (1) | |
| Six months ended June 30, | | 2021 | 2020 | | | | 2021 | 2020 | |
| Foster Creek | | 17 | | | | | 38 | | | | | — | | | | | — | | |
| Christina Lake | | 25 | | | | | 42 | | | | | 9 | | | | | — | | |
| Lloydminster Thermal | | — | | | | | — | | | | | 15 | | | | | — | | |
| Lloydminster Cold/EOR | | — | | | | | — | | | | | 2 | | | | | — | | |
Other (2) | | 17 | | | | | 75 | | | | | — | | | | | — | | |
| | 59 | | | | | 155 | | | | | 26 | | | | | — | | |
(1)Steam-assisted gravity drainage (“SAGD”) well pairs in the Oil Sands segment are counted as a single producing well.
(2)Includes Narrows Lake and new resource plays.
Stratigraphic test wells were drilled to help identify well pad locations for sustaining wells and to further progress the evaluation of other assets.
| | | | | | | | | | | | | | | | | | | | | | | |
| Six Months Ended June 30, 2021 | | Six Months Ended June 30, 2020 |
| (net wells, unless otherwise stated) | Drilled | Completed | Tied-in | | Drilled | Completed | Tied-in |
| | | | | | | |
| Conventional | 11 | | 13 | | 12 | | | — | | — | | 2 | |
There were no wells drilled, completed or tied-in during the first six months of 2021 in the Offshore segment.
Future Capital Investment
Upon further review of our capital program, we have updated our guidance estimates. The capital guidance range remains the same. However, our guidance now reflects an increase to Oil Sands capital investment by $100 million, offset by a reduction to U.S. Manufacturing, Canadian Manufacturing, and Retail totaling $100 million.
Our Oil Sands capital investment for 2021 is forecast to be between $950 million and $1,050 million, focused primarily on sustaining production at Christina Lake, Foster Creek and the Lloydminster thermal assets. Our Oil Sands production is expected to range between 540.0 thousand barrels per day and 596.0 thousand barrels per day.
Our Conventional capital investment for 2021 is forecast to be between $170 million and $210 million. This includes economic development in various plays to generate strong returns, improve underlying cost structures through volume enhancement and offset declines. Our Conventional production is expected to range between 131.0 thousand BOE per day and 140.0 thousand BOE per day.
Our Offshore capital investment for 2021 is expected to be between $200 million and $250 million. This capital spend includes a planned well in China as well as preservation capital for the West White Rose project. Production from our Offshore segment is expected to range between 66.0 thousand BOE per day and 74.0 thousand BOE per day.
In 2021, we plan to invest between $900 million and $1.1 billion in the U.S. Manufacturing, Canadian Manufacturing and Retail segments and will continue to focus on refining reliability and maintenance, safety projects and potentially high-return optimization opportunities. We also plan to invest between $520 million and $570 million for the Superior Refinery rebuild project. The rebuild project is expected to further enhance our heavy oil value chain integration while further reducing the Company’s exposure to WTI-WCS location differentials. Downstream throughput is expected to be in the range of 500.0 thousand barrels per day to 550.0 thousand barrels per day.
We expect to invest between $75 million and $100 million of corporate capital across the Company.
Our updated guidance dated July 28, 2021, is available on our website at cenovus.com.
| | |
| COMMODITY PRICES UNDERLYING OUR FINANCIAL RESULTS |
Key performance drivers for our financial results include commodity prices, quality and location price differentials, refining crack spreads as well as the U.S./Canadian dollar and Chinese Yuan (“RMB”)/Canadian dollar exchange rates. The following table shows selected market benchmark prices and the U.S./Canadian dollar and RMB/Canadian dollar average exchange rates to assist in understanding our financial results.
Selected Benchmark Prices and Exchange Rates (1)
| | | | | | | | | | | | | | | | | | | | | | | | | | | | | | | | | | | | | | | | | | | | | | | | | | | | | |
| Six months ended June 30, | | | | |
| (Average US$/bbl, unless otherwise indicated) | 2021 | | | Percent Change | 2020 | | | Q2 2021 | | | Q1 2021 | | | Q2 2020 | |
Brent (2) | 64.86 | | | | 63 | | | | 39.73 | | | | 68.83 | | | | 60.90 | | | | 29.20 | | |
| WTI | 61.96 | | | | 67 | | | | 37.01 | | | | 66.07 | | | | 57.84 | | | | 27.85 | | |
| Differential Brent-WTI | 2.90 | | | | 7 | | | | 2.72 | | | | 2.76 | | | | 3.06 | | | | 1.35 | | |
| WCS at Hardisty ("WCS") | 49.98 | | | | 138 | | | | 21.01 | | | | 54.58 | | | | 45.37 | | | | 16.38 | | |
| Differential WTI-WCS | 11.98 | | | | (25) | | | | 16.00 | | | | 11.49 | | | | 12.47 | | | | 11.47 | | |
WCS (C$/bbl) | 62.21 | | | | 120 | | | | 28.26 | | | | 66.99 | | | | 57.44 | | | | 22.42 | | |
| WCS at Nederland | 59.48 | | | | 85 | | | | 32.18 | | | | 63.03 | | | | 55.93 | | | | 22.55 | | |
| Differential WTI-WCS at Nederland | 2.48 | | | | (49) | | | | 4.83 | | | | 3.04 | | | | 1.91 | | | | 5.30 | | |
| Condensate (C5 @ Edmonton) | 62.22 | | | | 81 | | | | 34.29 | | | | 66.40 | | | | 58.04 | | | | 22.30 | | |
| Differential WTI-Condensate (Premium)/Discount | (0.26) | | | | (110) | | | | 2.72 | | | | (0.33) | | | | (0.20) | | | | 5.55 | | |
| Differential WCS-Condensate (Premium)/Discount | (12.24) | | | | (8) | | | | (13.28) | | | | (11.82) | | | | (12.67) | | | | (5.92) | | |
Average (C$/bbl) | 77.50 | | | | 68 | | | | 46.21 | | | | 81.51 | | | | 73.49 | | | | 30.70 | | |
| Synthetic @ Edmonton | 60.37 | | | | 80 | | | | 33.46 | | | | 66.41 | | | | 54.32 | | | | 23.44 | | |
| WTI-Synthetic (Premium)/Discount Differential | 1.59 | | | | (55) | | | | 3.55 | | | | (0.34) | | | | 3.52 | | | | 4.41 | | |
| Refined Product Prices | | | | | | | | | | | | | | | | | |
| Chicago Regular Unleaded Gasoline ("RUL") | 78.27 | | | | 84 | | | | 42.45 | | | | 87.03 | | | | 69.51 | | | | 32.91 | | |
| Chicago Ultra-low Sulphur Diesel ("ULSD") | 79.50 | | | | 64 | | | | 48.61 | | | | 85.73 | | | | 73.28 | | | | 36.89 | | |
Refining Margin: 3-2-1 Crack Spreads (3) | | | | | | | | | | | | | | | | | |
| Chicago | 16.72 | | | | 120 | | | | 7.61 | | | | 20.50 | | | | 12.93 | | | | 6.44 | | |
| Group 3 | 17.55 | | | | 86 | | | | 9.42 | | | | 19.44 | | | | 15.67 | | | | 7.92 | | |
| Renewable Identification Numbers ("RINs") | 6.80 | | | | 258 | | | | 1.90 | | | | 8.12 | | | | 5.49 | | | | 2.21 | | |
| Natural Gas Prices | | | | | | | | | | | | | | | | | |
AECO (4) (C$/Mcf) | 2.89 | | | | 42 | | | | 2.03 | | | | 2.85 | | | | 2.92 | | | | 1.91 | | |
NYMEX (US$/Mcf) | 2.76 | | | | 51 | | | | 1.83 | | | | 2.83 | | | | 2.69 | | | | 1.72 | | |
| Foreign Exchange Rate | | | | | | | | | | | | | | | | | |
| US$ per C$1 - Average | 0.802 | | | | 9 | | | | 0.733 | | | | 0.814 | | | | 0.790 | | | | 0.722 | | |
| US$ per C$1 - End of Period | 0.807 | | | | 10 | | | | 0.734 | | | | 0.807 | | | | 0.795 | | | | 0.734 | | |
| RMB per C$1 - Average | 5.190 | | | | 1 | | | | 5.156 | | | | 5.259 | | | | 5.120 | | | | 5.118 | | |
(1)These benchmark prices are not our realized sales prices and represent approximate values. For our average realized sales prices and realized risk management results, refer to the Netback tables in the Reportable Segments section of this MD&A.
(2)Calendar month average of settled prices for Dated Brent.
(3)The average 3-2-1 Crack Spread is an indicator of the refining margin and is valued on a last in, first out accounting basis.
(4)Alberta Energy Company (“AECO”) natural gas monthly index.
Crude Oil and Condensate Benchmarks
In the second quarter, Brent and WTI crude oil benchmarks improved due to rebounding global crude oil demand amid roll out efforts of COVID-19 vaccines, economic recovery and declines in crude oil inventories. The Organization of the Petroleum Exporting Countries ("OPEC") and a group of 10 non-OPEC members (collectively, "OPEC+") continued to support global prices despite the gradual easing of production quotas in the second quarter.
The price received for our Atlantic crude oil and Asia Pacific NGLs is primarily driven by the price of Brent.
WTI is an important benchmark for Canadian crude oil since it reflects inland North American crude oil prices and the Canadian dollar equivalent is the basis for determining royalty rates for a number of our crude oil properties. In the second quarter, the Brent-WTI differential remained narrow due to lower crude oil exports from North America and reduced U.S. crude oil supply. The differential was wider compared with the second quarter of 2020 when COVID-19 caused crude oil demand destruction and oversupply.
WCS is blended heavy oil which consists of both conventional heavy oil and unconventional diluted bitumen. In the second quarter, the average WTI-WCS differential narrowed slightly compared with the first quarter; and was consistent with the second quarter of 2020. Average differentials in the second quarter of 2021 were narrow due to supply reduction caused by planned maintenance of integrated oil sands mines; while narrow average differentials in the second quarter of 2020 were a function of volatility related to COVID-19.
WCS at Nederland is a heavy oil benchmark at the U.S. Gulf Coast (“USGC”) which is representative of pricing for our sales in the USGC. WCS at Nederland prices were strong in the second quarter of 2021, consistent with increasing crude oil prices globally, as refiners increased crude runs to adjust to increased demand for products. In the second quarter, WCS at Nederland benchmark prices relative to WTI narrowed compared with 2020, mainly attributed to strong coking demand and continued OPEC+ curtailment on supply of medium and heavy crude oil.
We upgrade heavy crude oil and bitumen into a sweet synthetic crude oil, the Husky Synthetic Blend ("HSB"), at the Lloydminster Upgrader. The price realized for HSB is primarily driven by the price of WTI and by the supply and demand of sweet synthetic crude oil from Western Canada, which influences the WTI-Synthetic differential.
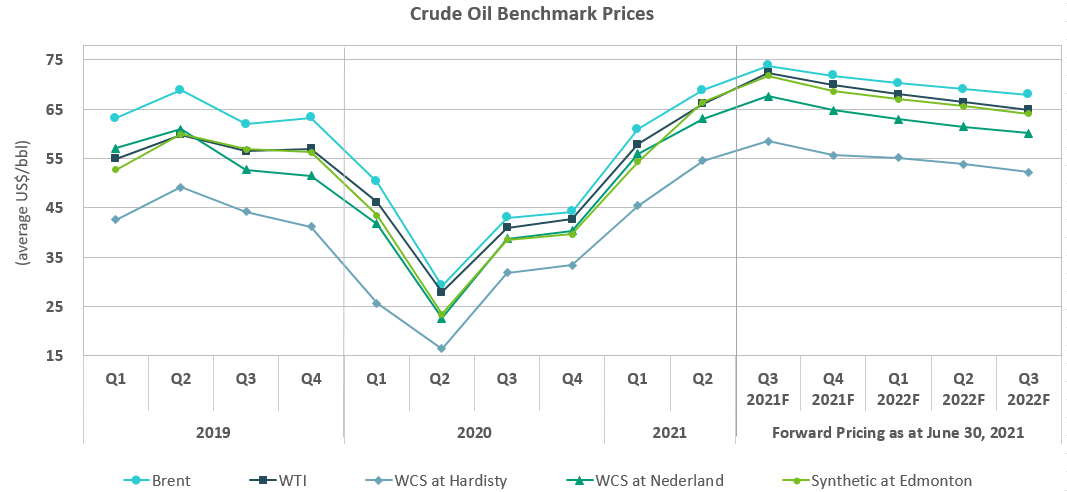
Blending condensate with bitumen enables our production to be transported through pipelines. Our blending ratios, diluent volumes as a percentage of total blended volumes, range from approximately 23 percent to 31 percent. The WCS-Condensate differential is an important benchmark as a wider differential generally results in a decrease in the recovery of condensate costs when selling a barrel of blended crude oil. When the supply of condensate in Alberta does not meet the demand, Edmonton condensate prices may be driven by USGC condensate prices plus the cost to transport the condensate to Edmonton. Our blending costs are also impacted by the timing of purchases and deliveries of condensate into inventory to be available for use in blending as well as timing of sales of blended product.
Average Edmonton condensate benchmark prices were at a slight premium relative to WTI in the second quarter as a result of strong oil sands demand.
Refining Benchmarks
RUL and ULSD benchmark prices are representative of inland refined product prices and are used to derive the Chicago 3-2-1 market crack spread. The 3-2-1 market crack spread is an indicator of the refining margin generated by converting three barrels of crude oil into two barrels of regular unleaded gasoline and one barrel of ultra-low sulphur diesel using current month WTI-based crude oil feedstock prices and valued on a last in, first out accounting basis.
The Chicago 3-2-1 market crack spread reflects the market for our Toledo, Lima and Wood River refineries. The Group 3 3-2-1 market crack spread reflects the market for our Borger Refinery.
Average Chicago refined product prices increased in the second quarter, due to a combination of the higher cost of RINs as a result of a tight biofuel market and uncertainty around policies that drive RINs demand, as well as higher refined product demand due to the deployment of COVID-19 vaccines and increasing economic activity. Recovering refined product demand resulted in lower inventory levels which increased market crack spreads. As North American refining crack spreads are expressed on a WTI basis, while refined products are generally set by global prices, the strength of refining market crack spreads in the U.S. Midwest and Midcontinent will reflect the differential between Brent and WTI benchmark prices.
Our realized crack spreads are affected by many other factors such as the variety of crude oil feedstock, refinery configuration and product output, the time lag between the purchase and delivery of crude oil feedstock, and the cost of feedstock, which is valued on a first in, first out (“FIFO”) accounting basis.
(1) RINs forward price information is unavailable at June 30, 2021.
Natural Gas Benchmarks
Average NYMEX natural gas prices increased compared with low prices in the second quarter of 2020 as lower associated gas production and a strong rebound in domestic demand and liquified natural gas exports supported the market. Average AECO prices improved alongside the NYMEX benchmark. The differential between AECO and NYMEX remained narrow as basin debottlenecking has allowed for ample access to domestic storage injections and lower pipeline utilization in the WCSB. The price received for our Asia Pacific natural gas production is largely based on long-term contracts.
Foreign Exchange Benchmarks
A substantial amount of our revenues are subject to foreign exchange exposure as the sales prices of our crude oil, NGLs, natural gas and refined products are determined by reference to U.S. benchmark prices. An increase in the value of the Canadian dollar compared with the U.S. dollar has a negative impact on our reported revenue. In addition to our revenues being denominated in U.S. dollars, a significant portion of our long-term debt is also U.S. dollar denominated. As the Canadian dollar weakens, our U.S. dollar debt gives rise to unrealized foreign exchange losses when translated to Canadian dollars. In addition, changes in foreign exchange rates impact the translation of U.S. and Asia Pacific operations.
The Canadian dollar on average strengthened relative to the U.S. dollar compared with 2020, resulting in a negative impact on our revenues. The strengthening of the Canadian dollar relative to the U.S. dollar as at June 30, 2021, compared with December 31, 2020, resulted in unrealized foreign exchange gains of $280 million on the translation of our U.S. dollar debt.
A portion of our long-term sales contracts in Asia Pacific are priced in RMB. An increase in the value of the Canadian dollar relative to the RMB will decrease the revenues received in Canadian dollars from the sale of natural gas commodities in the region.
UPSTREAM
OIL SANDS
On December 31, 2020, the Oil Sands segment included the Foster Creek, Christina Lake and Narrows Lake assets as well as other projects in the early stages of development.
On January 1, 2021, as part of the Arrangement, we acquired:
•Sunrise, a SAGD oil sands project located in the Athabasca region of northern Alberta. The Cenovus operated project is a 50 percent partnership with BP Canada.
•Tucker, an oil sands project located 30 kilometres northwest of Cold Lake, Alberta.
•Lloydminster thermal projects, consisting of bitumen production from 11 thermal plants, in the Lloydminster region of Saskatchewan.
•Lloydminster Cold/EOR, which produces heavy oil from the Lloydminster region of Alberta and Saskatchewan.
•A 35 percent interest in HMLP, which owns 2,200 kilometres of pipeline in the Lloydminster region and 5.9 million barrels of storage at Hardisty and Lloydminster. Financial results from HMLP are reported on an equity-accounted basis.
In the second quarter of 2021, we:
•Delivered safe and reliable operations.
•Completed scheduled maintenance turnarounds at Foster Creek and Sunrise.
•Completed scheduled maintenance at several of our thermal plants at our LLoydminster thermal assets.
•Increased production at our Lloydminster thermal assets compared with the first quarter of 2021.
•Generated Operating Margin of $1,411 million, an increase of $1,281 million compared with the second quarter of 2020 primarily due to higher average realized sales prices and added volumes from assets acquired as part of the Arrangement, partially offset by higher transportation and blending costs.
•Earned a Netback of $32.43 per BOE.
Three Months Ended June 30, 2021 Compared With Three Months Ended June 30, 2020
Financial Results
| | | | | | | | | | | | | | | | | | | | | | | |
| | Three Months Ended
June 30, | |
| ($ millions) | | 2021 | | | | 2020 (1) | |
| Gross Sales | | 5,015 | | | | | 1,247 | | |
| Less: Royalties | | 469 | | | | | 20 | | |
| Revenues | | 4,546 | | | | | 1,227 | | |
| Expenses | | | | | | | |
| Purchased Product | | 574 | | | | | 166 | | |
| Transportation and Blending | | 1,780 | | | | | 632 | | |
| Operating | | 592 | | | | | 233 | | |
| Realized (Gain) Loss on Risk Management | | 189 | | | | | 66 | | |
| Operating Margin | | 1,411 | | | | | 130 | | |
Unrealized (Gain) Loss on Risk Management (2) | | 374 | | | | | 121 | | |
| Depreciation, Depletion and Amortization | | 627 | | | | | 395 | | |
| Exploration Expense | | 2 | | | | | 4 | | |
| Share of (Income) Loss from Equity-Accounted Affiliates | | (5) | | | | | — | | |
| Segment Income (Loss) | | 413 | | | | | (390) | | |
(1)Prior periods have been reclassified to conform with current period’s operating segments.
(2)Unrealized gain and loss on risk management is recorded in the reportable segment to which the derivative instrument relates. Comparative periods have been reclassified as these amounts were recorded in the Corporate and Eliminations segment prior to January 1, 2021.
Operating Margin Variance (1)
(1)Other includes third party sourced volumes, construction and other activities not attributable to the production of crude oil, NGLs or natural gas.
(2)Prior periods have been reclassified to conform with current period’s operating segments.
(3)Revenues include the value of condensate sold as heavy oil blend. Condensate costs are recorded in transportation and blending expense. The crude oil price excludes the impact of condensate purchases.
(4)Inventory write-downs prior to January 1, 2021, have been reclassified to royalties, purchased product, transportation and blending or operating expenses to conform with the current presentation of inventory write-downs.
Operating Results
| | | | | | | | | | | | | | | | | | | | | | | |
| | Three Months Ended
June 30, | |
| | 2021 | | | | 2020 | |
Total Sales Volumes (MBOE/d) | | 544.0 | | | | | 370.1 | | |
| | | | | | | |
Total Realized Price per Unit Sold ($/BOE) | | 61.19 | | | | | 12.64 | | |
| | | | | | | |
Crude Oil Production (Mbbls/d) | | | | | | | |
| Foster Creek | | 156.8 | | | | | 166.0 | | |
| Christina Lake | | 230.5 | | | | | 207.2 | | |
Sunrise (1) | | 22.4 | | | | | — | | |
| Lloydminster Thermal | | 97.7 | | | | | — | | |
| Tucker | | 21.2 | | | | | — | | |
| Lloydminster Cold/EOR | | 20.8 | | | | | — | | |
Total Daily Crude Oil Production | | 549.4 | | | | | 373.2 | | |
| | | | | | | |
Effective Royalty Rate (percent) | | 17.7 | | | | | 17.3 | | |
| | | | | | | |
Per Unit Transportation and Blending Cost ($/BOE) | | 7.37 | | | | | 8.56 | | |
| | | | | | | |
Per Unit Operating Cost ($/BOE) | | 11.91 | | | | | 7.36 | | |
(1)Represents Cenovus’s 50 percent interest in Sunrise operations.
Revenues
Price
In the second quarter of 2021, our realized sales price was $61.19 per BOE compared with $12.64 per BOE in the second quarter of 2020. The increase in realized sales price was primarily due to higher WTI benchmark prices (US$66.07 per BOE compared with US$27.85 per BOE in the second quarter of 2020). Despite flat WTI-WCS differentials year-over-year, we further increased our realized sales price as we shipped and sold a higher percentage of our volumes to U.S. destinations.
In the second quarter of 2021, gross sales included $508 million (2020 – $182 million) from third-party sourced volumes which are not included in our per-unit pricing metrics or our Netbacks.
In the second quarter of 2021, gross sales included other amounts of $63 million (2020 – $1 million), which are not included in our per-unit pricing metrics or our Netbacks as it relates to construction, transportation and blending activities.
The heavy oil and bitumen produced by Cenovus must be blended with condensate to reduce its viscosity to transport it to market through pipelines. Our realized bitumen sales price does not include the sale of condensate; however, it is influenced by the price of condensate. As the cost of condensate increases relative to the price of blended crude oil, our realized heavy oil and bitumen sales price decreases. Up to three months may lapse from when we purchase condensate to when we sell our blended production.
Cenovus makes storage and transportation decisions using our marketing and transportation infrastructure, including storage and pipeline assets to optimize product mix, delivery points, transportation commitments and customer diversification. In order to price protect our inventories associated with the storage or transport decisions, Cenovus employs various price alignment and volatility management strategies, including through risk management contracts, to reduce volatility in future cash flows to improve cash flow stability while we are deleveraging our balance sheet. Transactions typically span across periods, as such, these transactions reside across both realized and unrealized risk management. As the financial contracts settle, they will flow from unrealized to realized risk management gains and losses.
In the second quarter of 2021, we incurred a realized risk management loss due to the settlement of benchmark prices relative to our risk management contract prices; the underlying physical inventory sold in the quarter recognized a gain due to rising benchmark prices. In the second quarter of 2021, unrealized losses were recorded on our crude oil financial instruments primarily due to forward benchmark pricing rising above our risk management contract prices that related to future periods and the realization of settled positions. In a rising commodity price environment, we would expect to realize losses on our risk management activities but recognize gains on the underlying physical inventory sold in the period and the opposite to occur in a falling commodity price environment.
Production Volumes
Oil Sands crude oil production was 549.4 thousand barrels per day in the second quarter of 2021 compared with 373.2 thousand barrels per day in the second quarter of 2020.
Production levels increased in year-over-year primarily due to 162.1 thousand barrels per day from assets acquired as part of the Arrangement. Lloydminster thermal production remains strong as we continue to apply our operating strategy and production and well delivery techniques. We had a planned maintenance turnaround at Sunrise during the quarter which impacted production. Tucker produced at stable rates.
Production at Foster Creek decreased 9.2 thousand barrels per day year-over-year due to a planned turnaround and operational outages in the second quarter of 2021, and the facility running at capacity in the second quarter of 2020.
Production at Christina Lake increased 23.3 thousand barrels per day year-over-year due to wells coming online in the second quarter of 2021 and our decision to operate at reduced levels in April 2020 in response to the low commodity price environment.
Royalties
Royalty calculations for our Oil Sands segment are based on government prescribed royalty regimes in Alberta and Saskatchewan.
Our Alberta oil sands royalty projects (Foster Creek, Christina Lake, Sunrise and Tucker) are based on government prescribed pre- and post-payout royalty rates which are determined on a sliding scale using the Canadian dollar equivalent WTI benchmark price.
Royalties for a pre-payout project are based on a monthly calculation that applies a royalty rate (ranging from one percent to nine percent, based on the Canadian dollar equivalent WTI benchmark price) to the gross revenues from the project.
Royalties for a post-payout project are based on an annualized calculation which uses the greater of: (1) the gross revenues multiplied by the applicable royalty rate (one percent to nine percent, based on the Canadian dollar equivalent WTI benchmark price); or (2) the net revenues of the project multiplied by the applicable royalty rate (25 percent to 40 percent, based on the Canadian dollar equivalent WTI benchmark price). Gross revenues are a function of sales revenues less diluent costs and transportation costs. Net revenues are a function of sales revenues less diluent costs, transportation costs, and allowed operating and capital costs.
Foster Creek, Christina Lake and Tucker are post-payout projects and Sunrise is a pre-payout project.
For our Saskatchewan properties, Lloydminster thermal and Lloydminster Cold/EOR, royalty calculations are based on an annual rate that is applied to each project, as well as each project's Crown and freehold split. For Crown royalties, the pre-payout calculation is based on a one percent rate and the post-payout calculation is based on a 20 percent rate. The freehold calculation is limited to post-payout projects and is based on an eight percent rate.
Effective royalty rates increased primarily due to higher realized pricing and higher Alberta oil sands sliding scale royalty rates, partially offset by lower rates on Saskatchewan production, all of which was acquired as part of the Arrangement.
Royalties increased by $449 million compared with the second quarter of 2020, mainly due to higher net revenue as a result of higher realized pricing, combined with increased production resulting from assets acquired under the Arrangement.
Expenses
Transportation and Blending
Blending costs increased $1,033 million compared with 2020. At Foster Creek and Christina Lake, blending costs increased due to higher condensate prices. In addition, the second quarter of 2020 reflects post-impairment blending costs after inventory impaired on March 31, 2020 was sold. Blending rates at Sunrise are comparable to Foster Creek and Christina Lake. The remaining assets at Tucker, Lloydminster thermal and Lloydminster Cold/EOR typically have lower blending rates due to lower crude oil density.
Transportation costs increased $115 million to $364 million in the second quarter of 2021 compared with 2020, primarily due to assets acquired in the Arrangement, increased volumes shipped and sold to U.S. destinations via pipeline to obtain higher sales prices, partially offset by lower volumes shipped to U.S. destinations via rail.
Per-unit Transportation Expenses
Per-unit transportation costs were $7.37 per BOE in the second quarter (2020 – $8.56 per barrel). The decrease was mainly a result of our ability to optimize combined pipeline capacity out of Alberta following the Arrangement, allowing heavy oil production from Foster Creek, Christina Lake and Sunrise to be shipped and sold to U.S. destinations with less reliance on rail, and more volumes via pipeline. Also contributing to the decrease were low per-unit transportation costs at Tucker, Lloydminster thermal, and Lloydminster Cold/EOR, compared with Foster Creek, Christina Lake and Sunrise. The decrease was partially offset by increased volumes shipped and sold to U.S. destinations.
At Foster Creek, per-unit transportation costs increased eight percent from 2020 to $12.25 per barrel as we shipped 40 percent (2020 – 30 percent) of our volumes to U.S. destinations to obtain higher realized prices. The increase was partially offset by less
than five percent of our volumes shipped to U.S. destinations via rail compared with 25 percent in 2020, and a higher percentage of volumes via pipeline.
At Christina Lake, per-unit transportation cost were $6.10 per barrel (2020 – $6.19 per barrel) as we shipped lower volumes to the USGC.
Operating
Primary drivers of our operating expenses in the second quarter of 2021 were fuel, workforce, chemical costs, repairs and maintenance, and workovers. Total operating costs increased primarily due to assets acquired from the Arrangement which have higher per barrel operating costs and planned turnarounds at Foster Creek and Sunrise in 2021.
| | | | | | | | | | | | | | | | | | | | | | | | | | | | | |
| Three Months Ended June 30, | |
| ($/bbl) | | 2021 | | | Percent
Change | | | 2020 | |
| Foster Creek | | | | | | | | | |
Fuel | | 3.95 | | | | 57 | | | | 2.51 | | |
Non-Fuel | | 8.23 | | | | 41 | | | | 5.82 | | |
Total | | 12.18 | | | | 46 | | | | 8.33 | | |
| Christina Lake | | | | | | | | | |
Fuel | | 3.06 | | | | 54 | | | | 1.99 | | |
Non-Fuel | | 4.89 | | | | 8 | | | | 4.53 | | |
Total | | 7.95 | | | | 22 | | | | 6.52 | | |
Other Oil Sands (1) | | | | | | | | | |
Fuel | | 3.92 | | | | — | | | | — | | |
Non-Fuel | | 13.29 | | | | — | | | | — | | |
Total | | 17.21 | | | | — | | | | — | | |
| Total | | 11.91 | | | | 62 | | | | 7.36 | | |
(1)Includes Sunrise, Tucker, Lloydminster thermal and Lloydminster Cold/EOR assets.
At both Foster Creek and Christina Lake, per-BOE fuel costs increased primarily due to higher natural gas prices. Non-fuel costs increased at Foster Creek primarily due to the planned turnaround in the second quarter of 2021. Non-fuel costs increased at Christina Lake primarily due to higher chemical costs. In addition, we had reduced repairs and maintenance activity at Foster Creek and Christina Lake in the second quarter of 2020 due to COVID-19 safety measures.
Total unit operating costs for all assets increased $4.55 per BOE to $11.91 per BOE in the second quarter of 2021 compared with the same period of 2020. The increase was due to higher per-unit operating costs of the assets acquired in the Arrangement, increased Foster Creek and Christina Lake per-unit costs as discussed above, and the planned maintenance turnaround at Sunrise during the second quarter of 2021.
Netbacks (1) (2)
Netback is a non-GAAP measure commonly used in the oil and gas industry to assist in measuring operating performance on a per-unit basis. Our Netback calculation is aligned with the definition found in the Canadian Oil and Gas Evaluation Handbook. Netbacks reflect our margin on a per-barrel of oil equivalent basis. Netback is defined as gross sales less royalties, transportation and blending and operating expenses divided by sales volumes. Netbacks do not reflect non-cash write-downs or reversals of product inventory until it is realized when the product is sold. The sales price, transportation and blending costs, and sales volumes exclude the impact of purchased condensate. Condensate is blended with the heavy oil to transport it to market. For a reconciliation of our Netbacks see the Advisory section of this MD&A.
| | | | | | | | | | | | | | | | | | | | | | | |
| Three Months Ended
June 30, | |
| ($/BOE) | | 2021 | | | | 2020 | |
| Sales Price | | 61.19 | | | | | 12.64 | | |
Royalties (1) | | 9.48 | | | | | 0.80 | | |
Transportation and Blending (1) (2) | | 7.37 | | | | | 8.56 | | |
Operating Expenses (1) | | 11.91 | | | | | 7.36 | | |
| Netback | | 32.43 | | | | | (4.08) | | |
| | | | | | | |
| | | | | | | |
| | | | | | | |
(1)Netbacks do not reflect non-cash write-downs of product inventory or reversals of product inventory until realized when the product is sold.
(2)Netbacks reflect our margin on a per-barrel basis of unblended crude oil.
Our average Netback increased in the second quarter of 2021 compared with 2020, primarily due to higher realized sales prices, partially offset by higher royalties and operating costs.
Six Months Ended June 30, 2021 Compared With Six Months Ended June 30, 2020
Financial Results
| | | | | | | | | | | | | | | | | | | | | | | |
| Six Months Ended
June 30, | |
| ($ millions) | | 2021 | | | | 2020 (1) | |
| Gross Sales | | 9,790 | | | | | 3,681 | | |
| Less: Royalties | | 793 | | | | | 71 | | |
| Revenues | | 8,997 | | | | | 3,610 | | |
| Expenses | | | | | | | |
| Purchased Product | | 1,292 | | | | | 571 | | |
| Transportation and Blending | | 3,558 | | | | | 2,537 | | |
| Operating | | 1,177 | | | | | 553 | | |
| Realized (Gain) Loss on Risk Management | | 418 | | | | | 91 | | |
| Operating Margin | | 2,552 | | | | | (142) | | |
Unrealized (Gain) Loss on Risk Management (2) | | 233 | | | | | 143 | | |
| Depreciation, Depletion and Amortization | | 1,239 | | | | | 806 | | |
| Exploration Expense | | 13 | | | | | 7 | | |
| Share of (Income) Loss from Equity-Accounted Affiliates | | (5) | | | | | — | | |
| Segment Income (Loss) | | 1,072 | | | | | (1,098) | | |
(1)Prior periods have been reclassified to conform with current period’s operating segments.
(2)Unrealized gain and loss on risk management is recorded in the reportable segment to which the derivative instrument relates. Comparative periods have been reclassified as these amounts were recorded in the Corporate and Eliminations segment prior to January 1, 2021.
Operating Margin Variance (1)
(1)Other includes third party sourced volumes, construction and other activities not attributable to the production of crude oil, NGLs or natural gas.
(2)Prior periods have been reclassified to conform with current period’s operating segments.
(3)Revenues include the value of condensate sold as heavy oil blend. Condensate costs are recorded in transportation and blending expense. The crude oil price excludes the impact of condensate purchases.
(4)Inventory write-downs prior to January 1, 2021, have been reclassified to royalties, purchased product, transportation and blending or operating expenses to conform with the current presentation of inventory write-downs.
Operating Results
| | | | | | | | | | | | | | | | | | | | | | | |
| | Six Months Ended
June 30, | |
| | 2021 | 2020 | |
Total Sales Volumes (MBOE/d) | | 554.6 | | | | | 384.0 | | |
| | | | | | | |
Total Realized Price per Unit Sold ($/BOE) | | 56.71 | | | | | 17.67 | | |
| | | | | | | |
Crude Oil Production (Mbbls/d) | | | | | | | |
| Foster Creek | | 159.9 | | | | | 164.9 | | |
| Christina Lake | | 226.7 | | | | | 215.2 | | |
Sunrise (1) | | 25.1 | | | | | — | | |
| Lloydminster Thermal | | 96.9 | | | | | — | | |
| Tucker | | 22.2 | | | | | — | | |
| Lloydminster Cold/EOR | | 20.7 | | | | | — | | |
Total Daily Crude Oil Production | | 551.5 | | | | | 380.1 | | |
| | | | | | | |
Effective Royalty Rate (percent) | | 16.2 | | | | | 12.4 | | |
| | | | | | | |
Per Unit Transportation and Blending Cost ($/BOE) | | 7.71 | | | | | 9.73 | | |
| | | | | | | |
Per Unit Operating Cost ($/BOE) | | 11.65 | | | | | 7.56 | | |
(1)Represents Cenovus’s 50 percent interest in Sunrise operations.
Revenues
Price
In the six months ended June 30, 2021, our realized sales price was $56.71 per BOE compared with $17.67 per BOE in the first half of 2020. The increase in realized sales price was primarily due to higher WTI benchmark prices and narrower WTI-WCS differentials.
In the first half of 2021, gross sales included $1,180 million (2020 – $587 million) from third-party sourced volumes which are not included in our per-unit pricing metrics or our Netbacks.
In the first half of 2021, gross sales included other amounts of $133 million (2020 – $7 million), which are not included in our per-unit pricing metrics or our Netbacks as it relates to transportation, blending and construction activities.
In the six months ended June 30, 2021, we incurred a realized risk management loss due to the settlement of benchmark prices relative to our risk management contract prices; the underlying physical inventory sold in the first half of the year recognized a gain due to rising benchmark prices. In the first six months of 2021, unrealized losses were recorded on our crude oil financial instruments primarily due to forward benchmark pricing rising above our risk management contract prices that related to future periods and the realization of settled positions.
Production Volumes
Oil Sands crude oil production was 551.5 thousand barrels per day in the first half of 2021 compared with 380.1 thousand barrels per day in 2020. Production levels increased primarily due to the addition of 164.9 thousand barrels per day from assets acquired as part of the Arrangement. Lloydminster thermal achieved record single day production rates and continued to produce at high rates through the end of the second quarter. We had a planned maintenance turnaround at Sunrise in the second quarter which impacted production. Tucker produced at stable rates.
Production at Foster Creek decreased 5.0 thousand barrels per day year-over-year due to a planned turnaround and operational outages in the second quarter of 2021, and the facility running at capacity in the second quarter of 2020.
Production at Christina Lake increased 11.5 thousand barrels per day year-over-year due to wells coming online in the second quarter of 2021 and our decision to operate at reduced levels in April 2020.
Royalties
Effective royalty rates increased primarily due to higher realized pricing and higher Alberta oil sands sliding scale royalty rates, partially offset by lower rates on Saskatchewan production, all of which was acquired as part of the Arrangement.
Royalties increased by $722 million compared with 2020, mainly due to higher revenue as a result of higher realized pricing, combined with increased production resulting from assets acquired under the Arrangement.
Expenses
Transportation and Blending
Blending costs increased $927 million compared with 2020. At Foster Creek and Christina Lake, blending costs increased from 2020 due to higher condensate prices.
Transportation costs increased $94 million to $774 million in the first half of 2021, primarily due to assets acquired in the Arrangement, increased volumes shipped and sold to U.S. destinations via pipeline to obtain higher sales prices, partially offset by lower volumes shipped to U.S. destinations via rail.
Per-unit Transportation Expenses
Per-unit transportation costs were $7.71 per BOE in the first half of 2021 (2020 – $9.73 per BOE). The decrease was mainly a result of heavy oil production from Foster Creek, Christina Lake and Sunrise shipped and sold to U.S. destinations with less reliance on rail. Also contributing to the decrease were low per-unit transportation costs at Tucker, Lloydminster thermal, and Lloydminster Cold/EOR, at Tucker, Lloydminster thermal, and Lloydminster Cold/EOR, compared with Foster Creek, Christina Lake and Sunrise.
At Foster Creek, per-unit transportation costs decreased 10 percent from 2020 to $11.55 per barrel as we shipped 25 percent (2020 – 50 percent) of our volumes to U.S. destinations via rail, and a higher percentage of volumes via pipeline.
At Christina Lake, per-unit transportation costs decreased 12 percent from 2020 to $6.36 per barrel as we shipped less than five percent (2020 – 30 percent) of our volumes to U.S. destinations via rail, and a higher percentage of volumes via pipeline.
Operating
Primary drivers of our operating expenses in the first six months of 2021 were fuel, workforce, chemical costs, repairs and maintenance, and workovers. Total operating costs increased primarily due to assets acquired from the Arrangement which have higher per barrel operating costs, and increased fuel costs due to higher natural gas prices, combined with the planned turnarounds at Foster Creek and Sunrise in the second quarter of 2021.
| | | | | | | | | | | | | | | | | | | | | | | | | | | | | |
| Six Months Ended June 30, | |
| ($/BOE) | | 2021 | | | Percent
Change | | | 2020 | |
| Foster Creek | | | | | | | | | |
Fuel | | 3.77 | | | | 45 | | | | 2.60 | | |
Non-Fuel | | 7.60 | | | | 23 | | | | 6.20 | | |
Total | | 11.37 | | | | 29 | | | | 8.80 | | |
| Christina Lake | | | | | | | | | |
Fuel | | 3.06 | | | | 51 | | | | 2.03 | | |
Non-Fuel | | 5.09 | | | | 12 | | | | 4.54 | | |
Total | | 8.15 | | | | 24 | | | | 6.57 | | |
Other Oil Sands (1) | | | | | | | | | |
Fuel | | 4.16 | | | | — | | | | — | | |
Non-Fuel | | 12.36 | | | | — | | | | — | | |
Total | | 16.52 | | | | — | | | | — | | |
| Total | | 11.65 | | | | 54 | | | | 7.56 | | |
(1)Includes Sunrise, Tucker, Lloydminster Thermal and Lloydminster Cold/EOR assets.
At both Foster Creek and Christina Lake, per-BOE fuel costs increased primarily due to higher natural gas prices. Non-fuel costs increased at Foster Creek primarily due to the planned turnaround in the second quarter of 2021. Non-fuel costs increased at Christina Lake primarily due to higher chemical costs. In addition, we had reduced repairs and maintenance activity at Foster Creek and Christina Lake in the second quarter of 2020 due to COVID-19 safety measures.
Total unit operating costs for all assets increased $4.09 per BOE to $11.65 per barrel in the first half of 2021 compared with the same period of 2020. The increase was due to higher per-unit operating costs of the assets acquired in the Arrangement, increased Foster Creek and Christina Lake per-unit costs as discussed above, and the planned maintenance turnaround at Sunrise during the second quarter of 2021.
DD&A
We deplete crude oil and natural gas properties on a unit-of-production basis over total proved reserves. The unit-of-production rate accounts for expenditures incurred to date, together with estimated future development expenditures required to develop those proved reserves. This rate, calculated at an area level, is then applied to our sales volume to determine DD&A
each period. We believe that this method of calculating DD&A charges each barrel of crude oil equivalent sold with its proportionate share of the cost of capital invested over the total estimated life of the related asset as represented by proved reserves.
In the three and six months ended June 30, 2021, DD&A increased $232 million and $433 million, respectively, compared with the same period in 2020 as a result of the Arrangement. The average depletion rate for the three and six months ended June 30, 2021 was $11.55 per BOE and $11.34 per BOE, respectively (2020 – $10.45 per BOE and $10.43 per BOE, respectively).
We depreciate our ROU assets on a straight-line or unit of production basis over the shorter of the estimated useful life or the lease term.
Netbacks (1) (2)
| | | | | | | | | | | | | | | | | | | | | | | |
| | Six Months Ended
June 30, | |
| ($/bbl) | | 2021 | 2020 | |
| Sales Price | | 56.71 | | | | | 17.67 | | |
Royalties (1) | | 7.90 | | | | | 1.01 | | |
Transportation and Blending (1) (2) | | 7.71 | | | | | 9.73 | | |
Operating Expenses (1) | | 11.65 | | | | | 7.56 | | |
| Netback | | 29.45 | | | | | (0.63) | | |
| | | | | | | |
| | | | | | | |
| | | | | | | |
(1)Netbacks do not reflect non-cash write-downs of product inventory or reversals of product inventory until realized when the product is sold.
(2)Netbacks reflect our margin on a per-barrel basis of unblended crude oil.
Our average Netback increased in the first six months of 2021 compared with 2020, primarily due to higher realized sales prices and lower transportation costs as a result of lower crude-by-rail volumes, partially offset by higher royalties and operating costs.
CONVENTIONAL
On December 31, 2020, the Conventional segment included assets primarily in the Elmworth-Wapiti, Kaybob-Edson, and Clearwater operating areas, rich in natural gas, and NGLs. The assets are in Alberta and British Columbia and include interests in numerous natural gas processing facilities.
On January 1, 2021, as part of the Arrangement, we acquired assets primarily in the same areas mentioned above, and the Rainbow Lake operating area located approximately 900 kilometres northwest of Edmonton. The acquired assets include interests in several natural gas processing facilities.
In the second quarter of 2021, we:
•Delivered safe and reliable operations.
•Generated Operating Margin of $142 million, an increase of $110 million compared with the second quarter of 2020 due to higher average realized sales prices, and increased volumes from assets acquired as part of the Arrangement, partially offset by higher per-unit operating expenses from assets acquired as part of the Arrangement.
•Sold our GORR interest in Marten Hills for gross cash proceeds of $102 million.
•Completed numerous turnarounds involving field maintenance activities and safely shutting-in and reactivating production.
•Achieved a Netback of $10.00 per BOE.
We entered into two separate definitive agreements in June and July to sell assets within our Conventional segment located in the East Clearwater area and Kaybob areas for combined gross proceeds of approximately $110 million. The Kaybob transaction closed in July and the East Clearwater transaction is expected to close in the third quarter of 2021.
Financial Results
| | | | | | | | | | | | | | | | | | | | | | | | | | | | | | | | | | | | | | | | | | | | | | | |
| | Three Months Ended
June 30, | | | | Six Months Ended
June 30, | |
| ($ millions) | | 2021 | 2020 (1) | | | | 2021 | | | | 2020 (1) | |
| Gross Sales | | 626 | | | | | 182 | | | | | 1,402 | | | | | 404 | | |
| Less: Royalties | | 39 | | | | | 1 | | | | | 63 | | | | | 4 | | |
| Revenues | | 587 | | | | | 181 | | | | | 1,339 | | | | | 400 | | |
| Expenses | | | | | | | | | | | | | | | |
| Purchased Product | | 287 | | | | | 47 | | | | | 668 | | | | | 108 | | |
Transportation and Blending (2) | | 19 | | | | | 19 | | | | | 37 | | | | | 42 | | |
| Operating | | 140 | | | | | 83 | | | | | 282 | | | | | 167 | | |
| Realized (Gain) Loss on Risk Management | | (1) | | | | | — | | | | | — | | | | | — | | |
| Operating Margin | | 142 | | | | | 32 | | | | | 352 | | | | | 83 | | |
Unrealized (Gain) Loss on Risk Management (3) | | 2 | | | | | — | | | | | 1 | | | | | — | | |
| Depreciation, Depletion and Amortization | | 102 | | | | | 80 | | | | | 210 | | | | | 488 | | |
| Exploration Expense | | 1 | | | | | — | | | | | (3) | | | | | — | | |
| | | | | | | | | | | | | | | |
| Segment Income (Loss) | | 37 | | | | | (48) | | | | | 144 | | | | | (405) | | |
(1)Prior periods have been reclassified to conform with current period’s operating segments.
(2)Netbacks do not reflect non-cash write-downs of product inventory or reversals of product inventory until realized when the product is sold.
(3)Unrealized gain and loss on risk management is recorded in the reportable segment to which the derivative instrument relates. Comparative periods have been reclassified as these amounts were recorded in the Corporate and Eliminations segment prior to January 1, 2021.
Revenues
The three and six months ended June 30, 2021, included gross sales of $287 million and $668 million, respectively (2020 –$49 million and $110 million, respectively) relating to third-party sourced volumes, which are not included in our per-unit pricing metrics or our Netbacks.
In the three and six months ended June 30, 2021, revenues included other amounts of $19 million and $43 million, respectively (2020 – $12 million and $23 million, respectively), which are not included in our per-unit pricing metrics or our Netbacks, as it relates to processing and transportation activities for third parties.
Operating Results
| | | | | | | | | | | | | | | | | | | | | | | | | | | | | | | | | | | | | | | | | | | | | | | |
| | Three Months Ended
June 30, | | | | Six Months Ended
June 30, | |
| | 2021 | | | | 2020 | | | | 2021 | | | | 2020 | |
Total Sales Volumes (MBOE/d) | | 141.3 | | | | | 92.0 | | | | | 138.6 | | | | | 93.8 | | |
Crude Oil (Mbbls/d) | | 9.2 | | | | | 6.3 | | | | | 8.9 | | | | | 7.5 | | |
NGLS (Mbbls/d) | | 29.0 | | | | | 20.3 | | | | | 28.6 | | | | | 20.7 | | |
Natural Gas (MMcf/d) | | 618.4 | | | | | 392.2 | | | | | 606.5 | | | | | 393.5 | | |
| | | | | | | | | | | | | | | |
Natural Gas Production (percentage of total) | | 73 | | | | | 71 | | | | | 73 | | | | | 70 | | |
Crude Oil and NGLs Production (percentage of total) | | 27 | | | | | 29 | | | | | 27 | | | | | 30 | | |
| | | | | | | | | | | | | | | |
Total Realized Price per Unit Sold ($/BOE) | | 24.90 | | | | | 14.48 | | | | | 27.54 | | | | | 15.88 | | |
Crude Oil ($/bbl) | | 67.91 | | | | | 23.78 | | | | | 64.86 | | | | | 33.47 | | |
NGLS ($/bbl) | | 35.48 | | | | | 18.75 | | | | | 36.73 | | | | | 19.77 | | |
Natural Gas ($/mcf) | | 3.02 | | | | | 2.04 | | | | | 3.61 | | | | | 2.11 | | |
| | | | | | | | | | | | | | | |
Effective Royalty Rate (percent) | | 12.7 | | | | | 0.9 | | | | | 9.5 | | | | | 1.8 | | |
Per Unit Transportation Cost ($/BOE) | | 1.51 | | | | | 2.38 | | | | | 1.49 | | | | | 2.46 | | |
Per Unit Operating Cost ($/BOE) | | 10.41 | | | | | 9.05 | | | | | 10.65 | | | | | 9.03 | | |
Revenues
Price
Our total realized sales price was $24.90 per BOE and $27.54 per BOE in the three and six months ended June 30, 2021, respectively (2020 – $14.48 per BOE and $15.88 per BOE, respectively) primarily due to higher crude oil and natural gas benchmark prices.
Production Volumes
Production volumes increased in the first half of 2021 primarily due to 51.7 thousand BOE per day from assets acquired as part of the Arrangement. In addition, we brought 12 new net wells on production during the six months ended June 30, 2021. The increase is partially offset by natural declines.
Royalties
The Conventional assets are subject to royalty regimes in both Alberta and British Columbia.
Effective royalty rates for the three and six months ended June 30, 2021, increased primarily due to higher realized prices and lower gas cost allowance credits.
Royalties increased $38 million and $59 million in the three and six months ended June 30, 2021, respectively, compared with the same periods in 2020. The increase is primarily due to higher realized prices combined with increased production resulting from assets acquired as part of the Arrangement.
Expenses
Transportation
Our transportation costs reflect charges for the movement of crude oil, NGLs and natural gas from the point of production to where the product is sold. Per-unit transportation costs averaged $1.51 per BOE and $1.49 per BOE in the three and six months ended June 30, 2021, respectively (2020 – $2.38 per BOE and $2.46 per BOE, respectively). The decrease is due to lower pipeline contract rates and higher sales volumes compared with the first half of 2020.
Transportation costs decreased by $nil and $5 million in the three and six months ended June 30, 2021, respectively, compared with the same periods in 2020. The decrease is primarily due to lower pipeline contract rates, partially offset by higher sales volumes.
Operating
Primary drivers of our operating expenses in the three and six months ended June 30, 2021, were workforce, repairs and maintenance, property tax and lease costs, and electricity. Total operating costs increased $57 million and $115 million in the three and six months ended June 30, 2021, respectively, primarily due to the assets acquired in the Arrangement.
Operating costs increased $1.36 per BOE and $1.62 per BOE in the three and six months ended June 30, 2021, respectively, compared with the same periods in 2020. The increase is primarily due to higher average operating costs on assets acquired as part of the Arrangement. Per-unit operating costs in the three and six months ended June 30, 2021, excluding assets acquired in the Arrangement, increased marginally year-over-year.
DD&A
We deplete crude oil and natural gas properties on a unit-of-production basis over total proved reserves. The unit-of-production rate accounts for expenditures incurred to date, together with estimated future development expenditures required to develop those proved reserves. This rate, calculated at an area level, is then applied to our sales volume to determine DD&A each period. We believe that this method of calculating DD&A charges each barrel of crude oil equivalent sold with its proportionate share of the cost of capital invested over total estimated life of the related asset as represented by proved reserves. The average depletion rate for the three and six months ended June 30, 2021, was $7.93 per BOE and $8.28 per BOE, respectively (2020 – $9.50 per BOE and $10.20 per BOE, respectively).
For the three and six months ended June 30, 2021, total Conventional DD&A was $102 million and $210 million, respectively (2020 – $80 million and $488 million, respectively). The increase during the quarter was due to assets acquired in the Arrangement, partially offset by a lower depletable base as a result of impairment write-downs during the year ended December 31, 2020.
On a year-to-date basis the decrease was due to an impairment write-down of $315 million in the first quarter of 2020; and a lower depletable base as a result of further impairment write-downs during the year ended December 31, 2020. The decrease is partially offset by assets acquired in the Arrangement.
Netbacks
| | | | | | | | | | | | | | | | | | | | | | | | | | | | | | | | | | | | | | | | | | | | | | | |
| Three Months Ended June 30, | | | Six Months Ended June 30, | |
| ($/BOE) | | 2021 | 2020 | | | | 2021 | | | | 2020 | |
| Sales Price | | 24.90 | | | | | 14.48 | | | | | 27.54 | | | | | 15.88 | | |
| Royalties | | 2.98 | | | | | 0.12 | | | | | 2.50 | | | | | 0.24 | | |
| Transportation and Blending | | 1.51 | | | | | 2.38 | | | | | 1.49 | | | | | 2.46 | | |
| Operating Expenses | | 10.41 | | | | | 9.05 | | | | | 10.65 | | | | | 9.03 | | |
| Netback | | 10.00 | | | | | 2.93 | | | | | 12.90 | | | | | 4.15 | | |
| | | | | | | | | | | | | | | |
| | | | | | | | | | | | | | | |
| | | | | | | | | | | | | | | |
Our average Netback increased in the three and six months ended June 30, 2021, compared with 2020, primarily due to higher realized sales prices and lower transportation and blending costs, partially offset by higher royalties and operating costs.
OFFSHORE
The Offshore segment was acquired as part of the Arrangement and includes offshore operations, exploration and development activities in offshore China, the equity-accounted investment in the HCML joint venture in Indonesia and offshore operations, exploration and development off the east coast of Canada.
In the second quarter of 2021, we:
•Delivered safe and reliable operations.
•Generated Operating Margin of $340 million.
•Achieved a Netback of $57.06 per BOE.
Offshore Consolidated
Financial Results
| | | | | | | | | | | | | | | | | | | | | | | |
| ($ millions) | | Three Months
Ended
June 30, 2021 | | | | Six Months Ended June 30, 2021 | |
| Gross Sales | | 427 | | | | | 858 | | |
| Less: Royalties | | 25 | | | | | 50 | | |
| Revenues | | 402 | | | | | 808 | | |
| Expenses | | | | | | | |
| Transportation and Blending | | 3 | | | | | 7 | | |
| Operating | | 59 | | | | | 117 | | |
| Operating Margin | | 340 | | | | | 684 | | |
| Depreciation, Depletion and Amortization | | 117 | | | | | 242 | | |
| Exploration Expense | | 1 | | | | | — | | |
| Share of (Income) Loss from Equity-Accounted Affiliates | | (12) | | | | | (24) | | |
| Segment Income (Loss) | | 234 | | | | | 466 | | |
DD&A
In the Offshore segment, we deplete crude oil and natural gas properties using the unit-of-production method based on estimated proved developed producing reserves or proved plus probable reserves determined using forward prices and costs. This rate, calculated at an area level, is then applied to our sales volume to determine DD&A each period. We believe that this method of calculating DD&A charges each barrel of crude oil equivalent sold with its proportionate share of the cost of capital invested over total estimated life of the related asset as represented by proved developed producing or proved plus probable reserves. The average depletion rate for the three and six months ended June 30, 2021, was $25.14 per BOE and $25.57 per BOE, respectively.
We depreciate our ROU assets on a straight-line basis over the shorter of the estimated useful life or the lease term.
Netbacks
| | | | | | | | | | | | | | | | | | | | | | | |
| Three Months Ended June 30, 2021 |
| ($/BOE) | China | Indonesia (1) | Atlantic | Total |
| | | | | | | |
| Sales Price | 69.04 | | | 61.79 | | | 86.07 | | | 71.70 | |
| Royalties | 3.71 | | | 5.81 | | | 6.56 | | | 4.56 | |
| Transportation and Blending | — | | | — | | | 2.10 | | | 0.44 | |
| Operating Expenses | 4.96 | | | 8.87 | | | 25.24 | | | 9.64 | |
| Netback | 60.37 | | | 47.11 | | | 52.17 | | | 57.06 | |
| | | | | | | |
Total Sales Volumes (MBOE/d) | 49.0 | | | 8.8 | | | 15.2 | | | 73.0 | |
| | | | | | | | | | | | | | | | | | | | | | | |
| Six Months Ended June 30, 2021 |
| ($/BOE) | China | Indonesia(1) | Atlantic | Total |
| | | | | | | |
| Sales Price | 69.25 | | | 61.22 | | | 83.75 | | | 71.20 | |
| Royalties | 3.71 | | | 7.07 | | | 6.13 | | | 4.61 | |
| Transportation and Blending | — | | | — | | | 2.46 | | | 0.50 | |
| Operating Expenses | 4.83 | | | 8.17 | | | 25.89 | | | 9.50 | |
| Netback | 60.71 | | | 45.98 | | | 49.27 | | | 56.59 | |
| | | | | | | |
Total Sales Volumes (MBOE/d) | 50.2 | | | 9.1 | | | 15.1 | | | 74.4 | |
(1) Reported sales volumes, associated per unit values and royalty rates reflect Cenovus’s 40 percent interest in the Madura-BD gas project. Revenues and expenses related to the HCML joint venture are accounted for using the equity method for consolidated financial statement purposes.
Revenues
Asia Pacific
In China, the Liwan gas project includes working interests of 49 percent in natural gas developments at the Liwan 3-1 and Liuhua 34-2 producing fields and 75 percent in the Liuhua 29-1 producing field. We also have petroleum contracts in Blocks 15/33, 16/25 and 23/07 which are in the exploration phase. We expect to drill an exploration well in Block 15/33 in the South China Sea before the end of this year. Block 15/33 contains an existing discovery that was drilled in 2018. We also plan to drill an exploration commitment well in Block 23/07 pending partner approval of location and timing.
We hold 40 percent joint control in HCML, which is a joint venture company that is accounted for using the equity method. HCML is engaged in the exploration for and production of crude oil and natural gas resources offshore Indonesia including the Madura Strait production sharing contract licence area. This licence area includes the operating BD field, and ongoing developments at the MDA, MBH and MDK fields. A final investment decision was made by HCML for development of the MAC field with production expected by mid-2023.
We also hold exploration rights in a block located southwest of the island of Taiwan in the South China Sea.
Financial Results
| | | | | | | | | | | | | | | | | | | | | | | |
| ($ millions) | | Three Months
Ended
June 30, 2021 | | | | Six Months Ended June 30, 2021 | |
| Gross Sales | | 308 | | | | | 629 | | |
| Less: Royalties | | 16 | | | | | 33 | | |
| Revenues | | 292 | | | | | 596 | | |
| Expenses | | | | | | | |
| Operating | | 24 | | | | | 46 | | |
| Operating Margin | | 268 | | | | | 550 | | |
Operating Results
| | | | | | | | | | | | | | | | | | | | | | | |
| | Three Months
Ended
June 30, 2021 | | | | Six Months
Ended
June 30, 2021 | |
Total Sales Volumes (1)(2)(3) (MBOE/d) | | 57.8 | | | | | 59.3 | | |
NGLs (1)(2)(3) (Mbbls/d) | | 12.1 | | | | | 12.5 | | |
Natural Gas (1)(2)(3) (MMcf/d) | | 274.1 | | | | | 280.7 | | |
| | | | | | | |
Total Realized Price per Unit Sold (3) ($/BOE) | | 67.93 | | | | | 68.01 | | |
NGLs (3) ($/bbl) | | 72.55 | | | | | 71.07 | | |
Natural Gas (3) ($/Mcf) | | 11.12 | | | | | 11.20 | | |
| | | | | | | |
Effective Royalty Rate (3) (percent) | | 5.9 | | | | | 6.2 | | |
| | | | | | | |
Per Unit Operating Cost (3) ($/BOE) | | 5.56 | | | | | 5.35 | | |
(1)Sales volumes approximates total daily production.
(2)Reported sales volumes include Cenovus’s working interest from the Liwan gas project.
(3) Reported sales volumes, associated per unit values and royalty rates reflect Cenovus’s 40 percent interest in the Madura-BD gas project. Revenues and expenses related to the HCML joint venture are accounted for using the equity method for consolidated financial statement purposes.
Revenues
Price
The price we receive for natural gas is set under long-term contracts. The price we receive for NGLs is primarily driven by the price of Brent.
Production Volumes
Asia Pacific operations performed well. We produced 57.8 thousand BOE per day in the three months ended June 30, 2021 and 59.3 thousand BOE per day in the six months ended June 30, 2021. In the second quarter, production declined marginally compared with the first quarter due to planned maintenance in both China and Indonesia.
Royalties
Royalty rates are governed by production sharing contracts in which production is shared with the Chinese and Indonesian governments.
Expenses
Operating
Primary drivers of our operating expenses in the three and six months ended June 30, 2021, were repairs and maintenance, insurance, and workforce.
Atlantic
Our Atlantic exploration and development program is focused in the Jeanne d’Arc Basin and the Flemish Pass located offshore Newfoundland and Labrador. The Jeanne d’Arc Basin contains the Hibernia, Terra Nova and Hebron fields, as well as the White Rose field and satellite extensions, including North Amethyst, West White Rose and South White Rose. In the Flemish Pass Basin, we hold a 35 percent non-operated working interest in each of the Bay du Nord, Bay de Verde, Baccalieu, Harpoon and Mizzen discoveries. We are the operator of the White Rose field and satellite extensions and hold an ownership interest in the Terra Nova field, as well as several smaller undeveloped fields. We also hold exploration acreage offshore Newfoundland and Labrador.
Our production in the first six months of 2021 is from the White Rose field and satellite extensions.
Production operations at the Terra Nova field have been suspended since December 2019. In the second quarter, the operator and partners reached an agreement in principle to restructure the project ownership and provide short-term funding towards continuing the Asset Life Extension ("ALE") Project for the Terra Nova floating production storage and offloading unit, which is being preserved quayside. An ALE sanction decision is anticipated in the second half of 2021.
The West White Rose Project remains deferred for 2021 while we continue to evaluate options with our partners.
Financial Results
| | | | | | | | | | | | | | | | | | | | | | | |
| ($ millions) | | Three Months
Ended
June 30, 2021 | | | | Six Months Ended June 30, 2021 | |
| Gross Sales | | 119 | | | | | 229 | | |
| Less: Royalties | | 9 | | | | | 17 | | |
| Revenues | | 110 | | | | | 212 | | |
| Expenses | | | | | | | |
| Transportation | | 3 | | | | | 7 | | |
| Operating | | 35 | | | | | 71 | | |
| Operating Margin | | 72 | | | | | 134 | | |
Operating Results
| | | | | | | | | | | | | | | | | | | | | | | |
| | Three Months
Ended
June 30, 2021 | | | | Six Months Ended June 30, 2021 | |
| Total Sales Volumes | | | | | | | |
Light Oil (Mbbls/d) | | 15.2 | | | | | 15.1 | | |
| | | | | | | |
Total Realized Price per Unit Sold ($/bbl) | | | | | | | |
Light Oil ($/bbl) | | 86.07 | | | | | 83.75 | | |
| | | | | | | |
| Total Daily Production | | | | | | | |
Light Oil (Mbbls/d) | | 15.2 | | | | | 16.1 | | |
| | | | | | | |
Effective Royalty Rate (percent) | | 7.6 | | | | | 7.3 | | |
| | | | | | | |
Per Unit Operating Cost ($/bbl) | | 25.24 | | | | | 25.89 | | |
Revenues
Price
The price we receive for light oil is primarily driven by the price of Brent.
Production and Sales Volumes
Atlantic operations performed well. We produced 15.2 thousand barrels per day and 16.1 thousand barrels per day in the three and six months ended June 30, 2021, respectively.
Light oil from production at the White Rose field is offloaded from the SeaRose floating production storage and offloading unit (“SeaRose FPSO”) to tankers and stored at an onshore terminal before shipment to buyers. The result is a timing difference between production and sales. Our sales volumes were 15.2 thousand barrels per day and 15.1 thousand barrels per day in the three and six months ended June 30, 2021, respectively.
Royalties
Royalties at the White Rose field are based on an agreement between our working interest partners and the Government of Newfoundland and Labrador. We currently pay a basic royalty of 7.5 percent of gross sales at the White Rose field and five percent of gross sales at the satellite extensions.
Expenses
Operating
Primary drivers of our operating expenses in the three and six months ended June 30, 2021, were repairs and maintenance, workforce, vessel costs, and helicopter costs.
Transportation
Transportation includes the cost of transporting oil from the SeaRose FPSO to onshore via tankers, as well as storage costs.
DOWNSTREAM
CANADIAN MANUFACTURING
On December 31, 2020, Canadian Manufacturing operations included the Bruderheim crude-by-rail terminal.
On January 1, 2021, as part of the Arrangement, we acquired:
•The Lloydminster Upgrader which is designed to process blended heavy crude oil feedstock, creating high quality, low-sulphur synthetic crude oil and ultra-low sulphur diesel. The Lloydminster Upgrader has crude oil throughput capacity of 81.5 thousand barrels per day.
•The Lloydminster Refinery, which processes heavy crude oil and bitumen into asphalt products used in road construction and maintenance. The refinery also produces straight run gasoline, bulk distillates and industrial products. The Lloydminster Refinery has crude oil throughput capacity of 29.0 thousand barrels per day.
•Two ethanol plants in Lloydminster, Saskatchewan and Minnedosa, Manitoba.
The Lloydminster Upgrader has the option to source crude oil feedstock from our Lloydminster thermal and Tucker production. The Lloydminster Refinery sources crude oil feedstock from our Lloydminster thermal production.
In the second quarter of 2021 we:
•Delivered safe and reliable operations.
•Achieved an average combined crude utilization of 94 percent at the Lloydminster Upgrader and Lloydminster Refinery.
•Generated Operating Margin of $189 million, an increase of $183 million compared with 2020 due to assets acquired in the Arrangement, combined with a customer settlement of a take-or-pay contract for revenue of approximately $55 million related to Bruderheim crude-by-rail terminal operations.
Financial Results
| | | | | | | | | | | | | | | | | | | | | | | | | | | | | | | | | | | | | | | | | | | | | | | |
| Three Months Ended June 30, | | | Six Month Ended June 30, | |
| ($ millions) | | 2021 | 2020 | | | | 2021 | | | | 2020 | |
| Revenues | | 1,088 | | | | | 16 | | | | | 1,894 | | | | | 43 | | |
| Purchased Product | | 807 | | | | | — | | | | | 1,438 | | | | | — | | |
| Gross Margin | | 281 | | | | | 16 | | | | | 456 | | | | | 43 | | |
| Expenses | | | | | | | | | | | | | | | |
| Operating | | 92 | | | | | 10 | | | | | 185 | | | | | 21 | | |
| Operating Margin | | 189 | | | | | 6 | | | | | 271 | | | | | 22 | | |
| Depreciation, Depletion and Amortization | | 43 | | | | | 2 | | | | | 86 | | | | | 4 | | |
| Segment Income (Loss) | | 146 | | | | | 4 | | | | | 185 | | | | | 18 | | |
Operating Results
| | | | | | | | | | | | | | | | | | | | | | | | | | | | | | | | | | | | | | | | | | | | | | | |
| Three Months Ended June 30, | | | Six Months Ended June 30, | |
| | 2021 | | | | 2020 | | | | 2021 | | | | 2020 | |
Crude Oil Throughput Capacity (Mbbls/d) | | 110.5 | | | | | — | | | | | 110.5 | | | | | — | | |
Lloydminster Upgrader (Mbbls/d) | | 81.5 | | | | | — | | | | | 81.5 | | | | | — | | |
Lloydminster Refinery (Mbbls/d) | | 29.0 | | | | | — | | | | | 29.0 | | | | | — | | |
| | | | | | | | | | | | | | | |
Crude Oil Throughput (Mbbls/d) | | 103.5 | | | | | — | | | | | 104.8 | | | | | — | | |
Lloydminster Upgrader (Mbbls/d) | | 76.1 | | | | | — | | | | | 77.2 | | | | | — | | |
Lloydminster Refinery (Mbbls/d) | | 27.4 | | | | | — | | | | | 27.6 | | | | | — | | |
| | | | | | | | | | | | | | | |
Crude Utilization (percent) (1) | | 94 | | | | | — | | | | | 95 | | | | | — | | |
| | | | | | | | | | | | | | | |
Refined Products Output (Mbbls/d) | | 105 | | | | | — | | | | | 106 | | | | | — | | |
| | | | | | | | | | | | | | | |
Upgrading Differential (2) | | 16.53 | | | | | — | | | | | 15.22 | | | | | — | | |
| | | | | | | | | | | | | | | |
Refining Margin ($/bbl) (1) | | 29.78 | | | | | — | | | | | 24.05 | | | | | — | | |
| | | | | | | | | | | | | | | |
Operating Expense ($/bbl) (1) | | 9.89 | | | | | — | | | | | 9.79 | | | | | — | | |
| | | | | | | | | | | | | | | |
| Crude-by-Rail Operations | | | | | | | | | | | | | | | |
Volumes Loaded (3) (Mbbls/d) | | 3.1 | | | | | 5.7 | | | | | 12.3 | | | | | 50.9 | | |
| | | | | | | | | | | | | | | |
Ethanol Production (thousands of litres/d) | | 649.0 | | | | | — | | | | | 523.5 | | | | | — | | |
(1)Based on crude throughput volumes and results of operations at the Lloydminster Upgrader and Refinery.
(2)Based on benchmark price differentials between heavy oil feedstock and synthetic crude.
(3)Volumes loaded and transported outside of Alberta.
Gross Margin
Upgrading operations process heavy crude oil into high value synthetic crude oil and low sulphur distillates. Upgrading profitability is primarily dependent on the differential between the sales price of synthetic crude oil and diesel, and the cost of heavy crude oil feedstock.
Lloydminster Refinery operations process heavy crude oil into asphalt and industrial products. The gross margin is primarily dependent on asphalt market prices and the cost of heavy crude oil feedstock.
Sales at the Lloydminster Refinery increase during paving season, which typically runs from May through October each year. Gross margin at the Lloydminster Refinery increased compared with the first quarter due to the commencement of paving season.
In the second quarter, gross margin at the Lloydminster Upgrader decreased slightly compared with the first quarter due to lower throughput, partially offset by a higher upgrading differential.
For the three and six months ended June 30, 2021, revenue includes approximately $55 million for a customer settlement of a take-or-pay contract related to Bruderheim crude-by-rail terminal operations.
Operating Expense
Primary drivers of operating expenses for the three and six months ended June 30, 2021, were workforce, repairs and maintenance, and energy costs. For the three and six months ended June 30, 2021, unit operating expenses were $9.89 per barrel of crude throughput and $9.79 per barrel of crude throughput, respectively.
DD&A
Canadian Manufacturing assets are depreciated on a straight-line basis over the estimated service life of each component of the facilities, which range from three to 60 years. The service lives of these assets are reviewed on an annual basis. ROU assets are depreciated on a straight-line basis over the shorter of the estimated useful life of the asset or the lease term. For the three and six months ended June 30, 2021, Canadian Manufacturing DD&A was $43 million and $86 million, respectively (2020 – $2 million and $4 million, respectively) as a result of assets acquired as part of the Arrangement.
U.S. MANUFACTURING
On December 31, 2020, U.S. Manufacturing operations included the Wood River and Borger refineries jointly owned with operator Phillips 66. We have a 50 percent interest in each refinery.
On January 1, 2021, as part of the Arrangement, we acquired:
•The Lima Refinery, which we own 100 percent, is located in Lima, Ohio. The refinery produces low sulphur gasoline, gasoline blend stocks, ultra-low sulphur diesel, aviation fuel, petrochemical feedstock and other by-products.
•The Toledo Refinery, of which our interest is 50 percent, is located near Toledo, Ohio. The refinery is jointly owned with operator BP. Products from the refinery include low sulphur gasoline, ultra-low sulphur diesel, aviation fuel, and other by-products.
•The Superior Refinery, of which we own 100 percent, is located in Superior, Wisconsin. On April 26, 2018, the refinery experienced an incident while preparing for a major turnaround and was taken out of operation. The refinery is being rebuilt and is expected to restart around the first quarter of 2023.
In the second quarter of 2021, we:
•Delivered safe and reliable operations.
•Increased throughput in response to rebounding global demand, averaging 87 percent crude utilization.
•Were impacted by temporary planned and unplanned outages at the Wood River, Borger, and Lima refineries, negatively affecting throughput.
•Completed planned maintenance turnarounds at the Wood River and Borger refineries.
Financial Results
| | | | | | | | | | | | | | | | | | | | | | | | | | | | | | | | | | | | | | | | | | | | | | | |
| Three Months Ended June 30, | | | Six Months Ended June 30, | |
| ($ millions) | | 2021 | | | | 2020 (1) | | | | 2021 | | | | 2020 (1) | |
| Revenues | | 4,729 | | | | | 841 | | | | | 8,166 | | | | | 2,396 | | |
| Purchased Product | | 4,229 | | | | | 549 | | | | | 7,149 | | | | | 2,280 | | |
| Gross Margin | | 500 | | | | | 292 | | | | | 1,017 | | | | | 116 | | |
| Expenses | | | | | | | | | | | | | | | |
| Operating | | 394 | | | | | 176 | | | | | 799 | | | | | 385 | | |
| Realized (Gain) Loss on Risk Management | | 10 | | | | | (7) | | | | | 31 | | | | | (8) | | |
| Operating Margin | | 96 | | | | | 123 | | | | | 187 | | | | | (261) | | |
Unrealized (Gain) Loss on Risk Management (2) | | 23 | | | | | 2 | | | | | 33 | | | | | 2 | | |
| Depreciation, Depletion and Amortization | | 103 | | | | | 71 | | | | | 217 | | | | | 148 | | |
| Segment Income (Loss) | | (30) | | | | | 50 | | | | | (63) | | | | | (411) | | |
(1)Prior periods have been reclassified to conform with current period’s operating segments.
(2)Unrealized gain and loss on risk management are recorded in the reportable segment to which the derivative instrument relates to. Comparative periods have been reclassified as these amounts were recorded in the Corporate and Eliminations segment prior to January 1, 2021.
Select Operating Results
| | | | | | | | | | | | | | | | | | | | | | | | | | | | | | | | | | | | | | | | | | | | | | | |
| | Three Months Ended June 30, | | | | Six Months Ended June 30, | |
| | 2021 | 2020 | | | | 2021 | | | | 2020 | |
Crude Oil Throughput Capacity (Mbbls/d) | | 502.5 | | | | | 247.5 | | | | | 502.5 | | | | | 247.5 | | |
Wood River and Borger Refineries (1) | | 247.5 | | | | | 247.5 | | | | | 247.5 | | | | | 247.5 | | |
| Lima Refinery | | 175.0 | | | | | — | | | | | 175.0 | | | | | — | | |
Toledo Refinery (1) | | 80.0 | | | | | — | | | | | 80.0 | | | | | — | | |
| | | | | | | | | | | | | | | |
Crude Oil Throughput (Mbbls/d) | | 435.5 | | | | | 162.3 | | | | | 399.4 | | | | | 191.7 | | |
Wood River and Borger Refineries (1) | | 208.9 | | | | | 162.3 | | | | | 189.6 | | | | | 191.7 | | |
| Lima Refinery | | 160.9 | | | | | — | | | | | 142.9 | | | | | — | | |
Toledo Refinery (1) | | 65.7 | | | | | — | | | | | 66.9 | | | | | — | | |
| | | | | | | | | | | | | | | |
Throughput by Product (Mbbls/d) | | | | | | | | | | | | | | | |
| Heavy Crude Oil | | 136.7 | | | | | 55.8 | | | | | 127.5 | | | | | 77.1 | | |
| Light/Medium | | 298.8 | | | | | 106.5 | | | | | 271.9 | | | | | 114.6 | | |
| | | | | | | | | | | | | | | |
Crude Utilization (percent) | | 87 | | | | | 66 | | | | | 79 | | | | | 78 | | |
| | | | | | | | | | | | | | | |
Refining Margin (2) ($/bbl) | | 12.59 | | | | | 19.77 | | | | | 14.06 | | | | | 3.33 | | |
| | | | | | | | | | | | | | | |
Operating Expense (2) ($/bbl) | | 9.96 | | | | | 11.91 | | | | | 11.06 | | | | | 11.04 | | |
(1) Represents Cenovus’s 50 percent interest in Wood River, Borger and Toledo refinery operations.
(2) Based on crude oil throughput volumes and operating results at Wood River, Borger, Lima and Toledo refineries.
All refineries continue to optimize throughput as market conditions dictate. Throughput ran at reduced rates early in the first quarter due to low market crack spreads and in the second quarter due to planned and unplanned outages.
At the Wood River and Borger refineries, throughput was impacted by planned maintenance turnarounds that began in the first quarter. The turnaround at Borger was completed in early April and the turnaround at Wood River was completed in mid-May. Throughput at the Wood River and Borger refineries were further impacted, temporarily, by unplanned outages during the second quarter. In addition, the Wood River refinery implemented crude rate reductions in line with market demand.
At the Lima Refinery, we had a temporary unplanned outage in the first quarter of 2021 due to an incident that shut down our fluid catalytic cracking unit. In addition, for two weeks in February, winter storm Uri disrupted the Mid-Valley pipeline which supplies the refinery’s feedstock, further impacting throughput. Throughput rates began ramping up in March as market conditions improved. In the second quarter, third-party maintenance at the Mid-Valley and West Texas Gulf pipelines which reduced throughput. Throughput rates increased in late May and June after completion of the maintenance.
At the Toledo Refinery, throughput was optimized in line with market demand in the first half of 2021.
Gross Margin
While market crack spreads are an indicator of margin from processing crude oil into refined products, the refining realized crack spread, which is the gross margin on a per-barrel basis, is affected by many factors, such as the variety of feedstock crude oil processed; refinery configuration and the proportion of gasoline, distillate and secondary product output; the time lag between the purchase of crude oil feedstock and the processing of that crude oil through the refineries; and the cost of feedstock. Processing less expensive crude relative to WTI creates a feedstock cost advantage. Our feedstock costs are valued on a FIFO accounting basis.
In the second quarter of 2021, gross margin increased $208 million compared with the second quarter of 2020, primarily due to higher crude throughput, market crack spreads, and crude advantage. The increase was partially offset by a non-cash inventory write-down of $243 million on March 31, 2020 which resulted in a lower purchased product expense in the second quarter of 2020. Also offsetting the increase was higher RINs costs and lower margins on fixed price products due to higher benchmark WTI.
In the first six months of 2021, gross margin increased $901 million compared with 2020 driven by improved market crack spreads combined with increased throughput, partially offset by higher RINs costs and lower margins on clean and fixed price products.
Gross margin further improved in the three and six months ended June 30, 2021 by additional crude throughput and sales volumes from assets acquired in the Arrangement.
In the three and six months ended June 30, 2021, the cost of RINs was $305 million and $485 million, respectively (2020 – $37 million and $69 million, respectively) due to higher RINs pricing and assets acquired in the Arrangement. RINs prices were US$8.12 per barrel and US$6.80 per barrel in the three and six months ended 2021, respectively (2020 - US$2.21 per barrel and US$1.90, respectively). RINs pricing was volatile in the first half of the year, ranging from slightly over US$4.00 per barrel to almost US$10.00 per barrel.
Operating Expenses
Primary drivers of operating expenses for the three and six months ended June 30, 2021, were repairs and maintenance, workforce costs, and utilities. In the second quarter of 2021, operating expenses increased $218 million compared with the second quarter of 2020 due to assets acquired in the Arrangement, combined with turnaround activities at the Wood River refinery. In the second quarter of 2021, per-unit operating expenses decreased $1.95 per barrel to $9.96 per barrel primarily due to higher crude throughput at the Wood River and Borger refineries, partially offset by turnaround activities at the Wood River refinery.
In the first six months of 2021, operating costs increased $414 million compared with the first half of 2020. The increase was due to assets acquired in the Arrangement, combined with turnaround activities at Wood River and Borger refineries and higher utility pricing at the Lima and Borger refineries associated with the impacts of winter storm Uri in the first quarter of 2021.
DD&A
U.S. Manufacturing assets are depreciated on a straight-line basis over the estimated service life of each component of the facilities, which range from three to 60 years. The service lives of these assets are reviewed on an annual basis. ROU assets are depreciated on a straight-line basis over the shorter of the estimated useful life of the asset or the lease term. U.S. Manufacturing DD&A was $103 million and $217 million in the three and six months ended June 30, 2021, respectively (2020 – $71 million and $148 million, respectively). The increase is a result of assets acquired in the Arrangement.
RETAIL
Retail operations were acquired on January 1, 2021, as part of the Arrangement.
For the three and six months ended June 30, 2021, our retail and commercial network averaged 535 and 538, respectively, independently operated Husky and Esso branded petroleum product outlets. Our retail and commercial operating model is balanced by corporate owned/dealer operated and branded dealer-owned-and-operated sites. The network consists of a variety of full- and self-serve retail stations, travel centres and cardlocks serving urban and rural markets across Canada, while our bulk distributors offer direct sales to commercial and agricultural markets in the prairie provinces.
Financial Results
| | | | | | | | | | | | | | | | | | | | | | | |
| ($ millions) | | Three Months
Ended
June 30, 2021 | | | | Six Months
Ended
June 30, 2021 | |
| Gross Sales | | 501 | | | | | 948 | | |
| Purchased Product | | 466 | | | | | 883 | | |
| Gross Margin | | 35 | | | | | 65 | | |
| Expenses | | | | | | | |
| Operating | | 29 | | | | | 48 | | |
| Operating Margin | | 6 | | | | | 17 | | |
| Depreciation, Depletion and Amortization | | 13 | | | | | 25 | | |
| Segment Income (Loss) | | (7) | | | | | (8) | | |
Select Operating Results
| | | | | | | | | | | | | | | | | | | | | | | |
| | Three Months
Ended
June 30, 2021 | | | | Six Months
Ended
June 30, 2021 | |
| Fuel Sales Volume, including wholesale | | | | | | | |
Fuel Sales (millions of litres/d) | | 6.7 | | | | | 6.6 | | |
Fuel Sales per Retail Outlet (thousands of litres/d) | | 12.5 | | | | | 12.3 | | |
Gross Margin
Gross margin is primarily driven by gasoline and diesel prices and retail pricing for motor fuels.
Operating expenses
Primary drivers of our operating expenses for the three and six months ended June 30, 2021, were repairs and maintenance, property tax, workforce, and utilities.
DD&A
Retail assets are depreciated on a straight-line basis over the estimated service life of each component of the facilities, which range from three to 60 years. The service lives of these assets are reviewed on an annual basis. ROU assets are depreciated on a straight-line basis over the shorter of the estimated useful life of the asset or the lease term. For the three and six months ended June 30, 2021, Retail DD&A was $13 million and $25 million, respectively, as a result of retail assets acquired in the Arrangement.
CORPORATE AND ELIMINATIONS
In the six months ended June 30, 2021, our risk management activities resulted in realized risk management losses of $92 million (2020 – losses of $5 million) primarily due to the realization, in the first quarter of 2021, of WTI put and call option contracts acquired as part of the Arrangement.
Expenses
| | | | | | | | | | | | | | | | | | | | | | | | | | | | | | | | | | | | | | | | | | | | | | | |
| Three Months Ended June 30, | | | Six Months Ended June 30, | |
| ($ millions) | | 2021 | 2020 | | | | 2021 | | | | 2020 | |
General and Administrative (1) | | 170 | | | | | 96 | | | | | 333 | | | | | 73 | | |
| Finance Costs | | 232 | | | | | 139 | | | | | 476 | | | | | 246 | | |
| Interest Income | | (3) | | | | | (1) | | | | | (7) | | | | | (2) | | |
| Integration Costs | | 34 | | | | | — | | | | | 257 | | | | | — | | |
| Foreign Exchange (Gain) Loss, Net | | (172) | | | | | (310) | | | | | (289) | | | | | 327 | | |
| Re-measurement of Contingent Payment | | 249 | | | | | 64 | | | | | 436 | | | | | (66) | | |
| (Gain) Loss on Divestiture of Assets | | (60) | | | | | — | | | | | (72) | | | | | 1 | | |
Other (Income) Loss, Net (2) | | (29) | | | | | (32) | | | | | (101) | | | | | (38) | | |
| | 421 | | | | | (44) | | | | | 1,033 | | | | | 541 | | |
(1)Onerous contract provisions of $1 million and $3 million in the three and six months ended June 30, 2020, respectively, have been reclassified to general and administrative expenses.
(2)Research costs of $2 million and $5 million in the three and six months ended June 30, 2020, respectively, have been reclassified to Other (Income) Loss, Net.
General and Administrative
Primary drivers of our general and administrative expenses were workforce costs, employee long-term incentive costs, information technology costs, and operating costs associated with our real estate portfolio. In the three and six months ended June 30, 2021, general and administrative expenses increased year-over-year due to a larger workforce resulting from the Arrangement. In addition, for the six months ended June 30, 2021 long-term incentive costs were higher than the same period in 2020 due to a year-to-date share price increase compared with a year-to-date share price decrease in 2020.
Finance Costs
In the three and six months ended June 30, 2021, finance costs increased by $93 million and $230 million, respectively, due to interest expense on short-term borrowings and long-term debt assumed as part of the Arrangement. In addition, an increase to the unwinding of the discount on decommissioning liabilities, and interest expense on lease liabilities as result of liabilities assumed as part of the Arrangement. Also contributing to the increase in the first half of 2021 was a net discount on the redemption of long-term debt in the first quarter of 2020.
The weighted average interest rate on outstanding debt for both the three and six months ended June 30, 2021, was 4.6 percent (three and six months ended June 30, 2020 – 4.6 percent and 4.8 percent, respectively).
Integration Costs
For the three and six months ended June 30, 2021, we incurred $34 million and $257 million, respectively, of costs as a result of the Arrangement, not including capital expenditures. Integration costs included $155 million of severance payments, $65 million of transaction costs, and $37 million in other integration related costs for the first half of 2021.
Foreign Exchange
| | | | | | | | | | | | | | | | | | | | | | | | | | | | | | | | | | | | | | | | | | | | | | | |
| Three Months Ended June 30, | | | Six Months Ended June 30, | |
| ($ millions) | | 2021 | 2020 | | | | 2021 | | | | 2020 | |
| Unrealized Foreign Exchange (Gain) Loss | | (192) | | | | | (288) | | | | | (331) | | | | | 369 | | |
| Realized Foreign Exchange (Gain) Loss | | 20 | | | | | (22) | | | | | 42 | | | | | (42) | | |
| | (172) | | | | | (310) | | | | | (289) | | | | | 327 | | |
In the second quarter of 2021 and on a year-to-date basis, unrealized foreign exchange gains of $192 million and $331 million, respectively, were mainly as a result of the translation of our U.S. dollar denominated debt.
Re-measurement of Contingent Payment
Related to Foster Creek and Christina Lake production, Cenovus agreed to make quarterly payments to ConocoPhillips Company and certain of its subsidiaries (“ConocoPhillips”) during the five years subsequent to the closing date of the acquisition from ConocoPhillips of its 50 percent interest in the FCCL Partnership on May 17, 2017, (the “Conoco Acquisition”), for quarters in which the average WCS crude oil price exceeds $52 per barrel during the quarter. The quarterly payment is $6 million for each dollar that the WCS price exceeds $52 per barrel. There are no maximum payment terms. The calculation includes an adjustment mechanism related to certain significant production outages at Foster Creek and Christina Lake, which may reduce the amount of a contingent payment.
The contingent payment is accounted for as a financial option. The fair value of $376 million as at June 30, 2021, was estimated by calculating the present value of the future expected cash flows using an option pricing model. The contingent payment is re-
measured at fair value at each reporting date with changes in fair value recognized in net earnings. For the three and six months ended June 30, 2021, non-cash re-measurement losses of $249 million and $436 million, respectively, were recorded. As at June 30, 2021, $90 million was payable under this agreement, of which a portion will be recognized in the third quarter as cash flow from operating activities and reduce adjusted funds flow when the payment is made. All payments thereafter will be recognized as cash flow from operating activities and included in adjusted funds flow.
Average WCS forward pricing for the remaining term of the contingent payment is $69.35 per barrel. Estimated quarterly WCS forward prices for the remaining term of the agreement range between approximately $66.94 per barrel and $72.08 per barrel.
Other (Income) Loss, Net
For the three and six months ended June 30, 2021, other (income) loss decreased by $3 million and increased by $63 million, respectively. For the three and six months ended June 30, 2021, business interruption insurance proceeds related to the Superior Refinery was $nil and $45 million, respectively. For the three and six months ended June 30, 2021, the Headwater Exploration Inc. warrants revaluation gain was $6 million and $25 million, respectively.
DD&A
Corporate and Eliminations DD&A includes provisions in respect of corporate assets, such as computer equipment, leasehold improvements, office furniture and certain ROU assets. Costs associated with corporate assets are depreciated on a straight-line basis over the estimated service life of the assets, which range from three to 25 years. ROU assets are depreciated on a straight-line basis over the estimated useful life of the asset or the lease term. DD&A in the three and six months ended June 30, 2021, was $31 million and $62 million, respectively (2020 – $32 million and $77 million, respectively). The decrease in DD&A for the six months ended June 30, 2021, was primarily due to an impairment loss of $8 million related to leasehold improvements in 2020.
Income Tax
| | | | | | | | | | | | | | | | | | | | | | | | | | | | | | | | | | | | | | | | | | | | | | | |
| Three Months Ended June 30, | | | Six Months Ended June 30, | |
| ($ millions) | | 2021 | 2020 | | | | 2021 | | | | 2020 | |
| Current Tax | | | | | | | | | | | | | | | |
| Canada | | 2 | | | | | (2) | | | | | 14 | | | | | (2) | | |
| United States | | — | | | | | 1 | | | | | — | | | | | 1 | | |
| Asia Pacific | | 47 | | | | | — | | | | | 81 | | | | | — | | |
| Other International | | — | | | | | — | | | | | 1 | | | | | — | | |
| Current Tax Expense (Recovery) | | 49 | | | | | (1) | | | | | 96 | | | | | (1) | | |
| Deferred Tax Expense (Recovery) | | 63 | | | | | (131) | | | | | 90 | | | | | (479) | | |
| Total Tax Expense (Recovery) | | 112 | | | | | (132) | | | | | 186 | | | | | (480) | | |
Tax interpretations, regulations and legislation in the various jurisdictions in which Cenovus and its subsidiaries operate are subject to change. We believe that our provision for income taxes is adequate. There are usually a number of tax matters under review and with consideration of the current economic environment, income taxes are subject to measurement uncertainty. The timing of the recognition of income and deductions for the purpose of current tax expense is determined by relevant tax legislation.
For the three and six months ended June 30, 2021, the Company recorded a current tax expense primarily related to Asia Pacific operations in China as well as provincial tax from Cenovus operations in Canada. The increase is due to Asia Pacific operations acquired in the Arrangement and higher earnings compared with the second quarter of 2020.
Our effective tax rate is a function of the relationship between total tax expense (recovery) and the amount of earnings (loss) before income taxes. The effective tax rate differs from the statutory tax rate as it reflects different tax rates in other jurisdictions, non-taxable foreign exchange (gains) losses, adjustments for changes in tax rates and other tax legislation, adjustments to the tax basis of the refining assets, variations in the estimate of reserves, differences between the provision and the actual amounts subsequently reported on the tax returns, and other permanent differences.
| | |
| LIQUIDITY AND CAPITAL RESOURCES |
| | | | | | | | | | | | | | | | | | | | | | | | | | | | | | | | | | | | | | | | | | | | | | | |
| Three Months Ended June 30, | | | Six Months Ended June 30, | |
| ($ millions) | | 2021 | 2020 | | | | 2021 | | | | 2020 | |
| Cash From (Used In) | | | | | | | | | | | | | | | |
| Operating Activities | | 1,369 | | | | | (834) | | | | | 1,597 | | | | | (709) | | |
| Investing Activities | | (424) | | | | | (206) | | | | | (220) | | | | | (527) | | |
| Net Cash Provided (Used) Before Financing Activities | | 945 | | | | | (1,040) | | | | | 1,377 | | | | | (1,236) | | |
| Financing Activities | | (717) | | | | | 1,041 | | | | | (678) | | | | | 1,223 | | |
| Foreign Exchange Gain (Loss) on Cash and Cash Equivalents Held in Foreign Currency | | (46) | | | | | (9) | | | | | (22) | | | | | (21) | | |
| Increase (Decrease) in Cash and Cash Equivalents | | 182 | | | | | (8) | | | | | 677 | | | | | (34) | | |
| | | | | | | | | | | | | | | |
| | | | | | | June 30,
2021 | December 31,
2020 | |
| Cash and Cash Equivalents | | | | | | | | | | 1,055 | | | | | 378 | | |
Debt (1) | | | | | | | | | | 13,445 | | | | | 7,562 | | |
(1)Includes long-term debt and short-term borrowings. On January 1, 2021, on the closing of the Arrangement, we acquired cash and cash equivalents of $735 million and debt of $6,642 million.
Cash From (Used in) Operating Activities
For the three months ended June 30, 2021, cash generated by operating activities increased compared with 2020 mainly due to higher Operating Margin and distributions received from equity-accounted affiliates, partially offset by higher finance costs and general and administrative expenses as discussed in the Corporate and Eliminations section of this MD&A.
For the six months ended June 30, 2021, cash generated by operating activities increased compared with 2020 mainly due to higher Operating Margin and distributions received from equity-accounted affiliates. The increase was partially offset by changes in non-cash working capital, and higher integration costs and finance costs as discussed in the Corporate and Eliminations section of this MD&A.
Excluding the current portion of the contingent payment, our working capital was $1,685 million at June 30, 2021, compared with $653 million at December 31, 2020. The increase in working capital is primarily due to increased inventories and accounts receivable and accrued revenues and was partially offset by increased accounts payable and accrued liabilities. These increases were due to the improved commodity price environment, higher crude oil and feedstock prices and the Arrangement as discussed in the Operating and Financial Results section of this MD&A.
We anticipate that we will continue to meet our payment obligations as they come due.
Cash From (Used in) Investing Activities
Cash used in investing activities was higher in the three months ended June 30, 2021, compared with 2020 primarily due to higher capital spending, partially offset by proceeds from divestitures.
Cash used in investing activities was lower in the six months ended June 30, 2021, compared with 2020 primarily due to cash acquired through the Arrangement and proceeds from divestitures, partially offset by higher capital spending mainly as result of our larger asset base acquired through the Arrangement.
Cash From (Used in) Financing Activities
During the second quarter, we repaid $196 million in short-term borrowings and $400 million of revolving long-term debt.
During the first six months of 2021, we repaid $89 million in short-term borrowings and $350 million of revolving long-term debt. In the first six months of 2020, we repurchased US$100 million of unsecured notes for cash of US$81 million.
Total Debt
Total debt, including short-term borrowings, as at June 30, 2021, was $13,445 million (December 31, 2020 – $7,562 million). The increase in total debt was mainly due to the assumption of debt at closing of the Arrangement on January 1, 2021, with a fair value of $6,642 million. The principal amount of debt assumed that is owed to lenders between 2022 and 2037 is $5,709 million. We have reduced our total debt by $759 million since the closing of the Arrangement.
As at June 30, 2021, we were in compliance with all of the terms of our debt agreements.
Common Share Dividends
In the second quarter of 2021, we paid dividends of $36 million or $0.0175 per common share (2020 – $nil).
In the first six months of 2021, we paid dividends of $71 million or $0.0350 per common share (2020 – $77 million or $0.0625 per commons share). The declaration of dividends is at the sole discretion of the Company’s Board of Directors and is considered quarterly.
Cumulative Redeemable Preferred Share Dividends
In the three and six months ended June 30, 2021, dividends of $8 million and $17 million, respectively, were paid on the Series 1, 2, 3, 5, and 7 preferred shares. The declaration of preferred share dividends is at the sole discretion of the Company’s Board of Directors and is considered quarterly.
Available Sources of Liquidity
The following sources of liquidity are available at June 30, 2021:
| | | | | | | | | | | | | | | | | | | | | | | |
| ($ millions) | | Term | | | | Amount Available | |
| Cash and Cash Equivalents | | Not applicable | | | | 1,055 | | |
| Committed Credit Facilities | | | | | | | |
| $2.0 Billion Revolving Credit Facility | | June 2022 | | | | 2,000 | | |
| $1.2 Billion Revolving Credit Facility – Tranche B | | November 2022 | | | | 1,200 | | |
| $3.3 Billion Revolving Credit Facility – Tranche A | | November 2023 | | | | 3,300 | | |
| $2.0 Billion Revolving Credit Facility | | March 2024 | | | | 2,000 | | |
| Uncommitted Demand Facilities | | | | | | | |
| Cenovus Energy Inc. | | Not applicable | | | | 2,003 | | |
| WRB Refining LP (Cenovus's proportionate share) | | Not applicable | | | | 121 | | |
| Sunrise Oil Sands Partnership (Cenovus's proportionate share) | | Not applicable | | | | 5 | |
We expect to fund our near-term cash requirements through cash from operating activities and prudent use of our balance sheet capacity including draws on our committed credit facilities and our uncommitted demand facilities and other corporate and financial opportunities that may be available to us. We remain committed to maintaining our investment grade credit ratings at S&P Global Ratings, Moody’s Investor Service and DBRS Limited and re-establishing investment grade ratings at Fitch Ratings. The cost and availability of borrowing, and access to sources of liquidity and capital is dependent on current credit ratings and market conditions.
Under the terms of our committed credit facilities, we are required to maintain a debt to capitalization ratio, as defined in the debt agreements, not to exceed 65 percent. We are well below this limit.
Committed Credit Facilities
We have total committed credit facilities of $8.5 billion. As at June 30, 2021, there were no amounts drawn on the committed credit facilities (December 31, 2020 – $nil).
Uncommitted Demand Facilities
We have uncommitted demand facilities of $2.5 billion in place, of which $1.5 billion may be drawn for general purposes or the full amount can be available to issue letters of credit. As at June 30, 2021, there were no amounts drawn on these facilities (December 31, 2020 – $nil) and there were outstanding letters of credit aggregating to $532 million (December 31, 2020 – $441 million).
WRB Refining LP has uncommitted demand facilities of US$300 million (our proportionate share – US$150 million) available to cover short-term working capital requirements. As at June 30, 2021, US$105 million was drawn on these facilities, of which US$53 million ($65 million) was our proportionate share (December 31, 2020 – $121 million).
Sunrise Oil Sands Partnership has an uncommitted demand credit facility of $10 million available for general purposes. Our proportionate share is $5 million. There were no amounts drawn on this demand credit facility at June 30, 2021 (December 31, 2020 – $nil).
Canadian Dollar Unsecured Notes and U.S. Dollar Denominated Unsecured Notes
Effective March 31, 2021, Cenovus Energy Inc., as a result of the Arrangement and subsequent amalgamation of Husky Energy Inc. into Cenovus Energy Inc., became the direct obligor under the existing US$500 million 3.95 percent notes due 2022, US$750 million 4.00 percent notes due 2024, $750 million 3.55 percent notes due 2025, $750 million 3.60 percent notes due 2027, $1,250 million 3.50 percent notes due 2028, US$750 million 4.40 percent notes due 2029, US$387 million 6.80 percent notes due 2037 and other direct obligations of Husky Energy Inc.
Base Shelf Prospectus
We have a base shelf prospectus in place that allows us to offer, from time to time, up to US$5.0 billion, or the equivalent in other currencies, of debt securities, common shares, preferred shares, subscription receipts, warrants, share purchase contracts and units in Canada, the U.S. and elsewhere where permitted by law. The base shelf prospectus will expire in October 2021. As at June 30, 2021, US$3.7 billion remained available under the base shelf prospectus for permitted offerings.
Financial Metrics
We monitor our capital structure and financing requirements using, among other things, non-GAAP financial metrics consisting of Net Debt to Adjusted EBITDA and Net Debt to Capitalization. We define our non-GAAP measure of Net Debt as short-term borrowings, and the current and long-term portions of long-term debt, net of cash and cash equivalents and short-term investments. We define Capitalization as Net Debt plus Equity. We define Adjusted EBITDA as net earnings before finance costs, interest income, income tax expense (recovery), DD&A, exploration expense, goodwill impairments, asset impairments and reversals, unrealized gains (losses) on risk management, foreign exchange gains (losses), revaluation gain, re-measurement of contingent payment, gains (losses) on divestiture of assets, other income (loss), net, and share of income (loss) from equity-accounted investees calculated on a trailing 12-month basis. These measures are used to steward our overall debt position and as measures of our overall financial strength.
| | | | | | | | | | | | | | | | | | | | | | | |
| | June 30, 2021 | | | | December 31, 2020 | |
Net Debt to Capitalization (1) (percent) | | 34 | | | | | 30 | | |
Net Debt to Adjusted EBITDA (times) | | 2.8x | | | | 11.9x | |
(1)Net Debt to Capitalization is defined as Net Debt divided by Net Debt plus Shareholders’ Equity.
We target a Net Debt to Adjusted EBITDA ratio of less than 2.0 times, and substantially lower, over the long-term. This ratio may periodically be above the target due to factors such as persistently low commodity prices. Our objective is to maintain a high level of capital discipline and manage our capital structure to help ensure we have sufficient liquidity through all stages of the economic cycle. To ensure financial resilience, we may, among other actions, adjust capital and operating spending, draw down on our credit facilities or repay existing debt, adjust dividends paid to shareholders, repurchase our common shares for cancellation, issue new debt, or issue new shares.
On December 31, 2020, before the Arrangement, our Net Debt to Capitalization was 30 percent. Our Net Debt to Capitalization increased to 36 percent on March 31, 2021, primarily due to Net Debt assumed from the Arrangement. In the three months ended June 30, 2021, we reduced our Net Debt to Capitalization by two percent to 34 percent as our Net Debt decreased.
As at June 30, 2021, our Net Debt to Adjusted EBITDA was 2.8 times. Net Debt to Adjusted EBITDA decreased compared with the fourth quarter of 2020 as a result of higher Operating Margin in the second quarter in 2021, offset by an increase in our Net Debt acquired as part of the Arrangement. See the Operating and Financial Results section of this MD&A for more information on Net Debt.
We are in compliance with all of the terms of our debt agreements. Under the terms of our committed credit facilities, we are required to maintain a total debt to capitalization ratio, as defined in the agreements, not to exceed 65 percent. We are well below this limit.
Additional information regarding our financial measures and capital structure can be found in the notes to the interim Consolidated Financial Statements.
Share Capital and Stock-Based Compensation Plans
Under the Arrangement, we acquired all the issued and outstanding Husky common shares in consideration for the issuance of 0.7845 Cenovus common shares plus 0.0651 Cenovus warrants. We issued 788.5 million Cenovus common shares with a fair value of $6.1 billion, based on the December 31, 2020, closing share price of $7.75, as reported on the TSX. In addition, 65.4 million common share purchase warrants were issued. Each whole warrant entitles the holder to acquire one Cenovus common share for a period of five years at an exercise price of $6.54 per share. The fair value of the warrants was estimated to be $216 million. We also acquired all the issued and outstanding Husky preferred shares in exchange for 36.0 million Cenovus first preferred shares with substantially identical terms and a fair value of $519 million.
We have a number of stock-based compensation plans which include stock options and associated net settlement rights, performance share units (“PSUs”), restricted share units (“RSUs”) and deferred share units (“DSUs”). In connection with the Arrangement, at the closing of the transaction on January 1, 2021, outstanding Husky stock options were replaced by Cenovus replacement stock options (“Cenovus Replacement Stock Options”). Each Cenovus Replacement Stock Option entitles the holder to acquire 0.7845 of a Cenovus common share at an exercise price per share of a Husky stock option divided by 0.7845. The fair value of the replacement stock options was estimated to be $9 million.
As at June 30, 2021, there were approximately 2,018 million common shares outstanding (December 31, 2020 – 1,229 million common shares). Refer to Note 22 of the interim Consolidated Financial Statements for more details.
Refer to Note 24 of the interim Consolidated Financial Statements for more details on our stock option plans and our PSU, RSU and DSU Plans.
Our outstanding share data is as follows:
| | | | | | | | | | | | | | | | | | | | | | | |
| As at July 22, 2021 | | Units Outstanding (thousands) | | | | Units Exercisable (thousands) | |
Common Shares (1) | | 2,017,612 | | | | | N/A | |
| Common Share Warrants | | 65,244 | | | | | N/A | |
| Preferred Shares Series 1 | | 10,740 | | | | | N/A | |
| Preferred Shares Series 2 | | 1,260 | | | | | N/A | |
| Preferred Shares Series 3 | | 10,000 | | | | | N/A | |
| Preferred Shares Series 5 | | 8,000 | | | | | N/A | |
| Preferred Shares Series 7 | | 6,000 | | | | | N/A | |
Stock Options (1) | | 40,667 | | | | | 26,514 | | |
| Other Stock-Based Compensation Plans | | 14,978 | | | | | 1,541 | | |
(1)Includes Cenovus Replacement Stock Options (defined above) issued pursuant to the Arrangement in replacement of all issued and outstanding Husky stock options.
Capital Investment Decisions
Our 2021 capital program is forecast to be between $2.3 billion and $2.7 billion. Our investment is focused on maintaining safe and reliable operations, while positioning the Company to drive enhanced shareholder value that includes sustaining capital of approximately $2.1 billion to deliver upstream production of approximately 770.0 thousand BOE per day and downstream throughput of approximately 525.0 thousand barrels per day.
| | | | | | | | | | | | | | | | | | | | | | | | | | | | | | | | | | | | | | | | | | | | | | | |
| Three Months Ended June 30, | | | Six Months Ended June 30, | |
| ($ millions) | | 2021 | | | | 2020 | | | | 2021 | | | | 2020 | |
| Adjusted Funds Flow | | 1,817 | | | | | (469) | | | | | 2,958 | | | | | (623) | | |
| Total Capital Investment | | 534 | | | | | 147 | | | | | 1,081 | | | | | 451 | | |
Free Funds Flow (1) | | 1,283 | | | | | (616) | | | | | 1,877 | | | | | (1,074) | | |
| Cash Dividends | | 44 | | | | | — | | | | | 88 | | | | | 77 | | |
| | 1,239 | | | | | (616) | | | | | 1,789 | | | | | (1,151) | | |
(1)Free Funds Flow is a non-GAAP measure defined as Adjusted Funds Flow less capital investment.
Our approach on the financial framework remains consistent with the parameters we have set for Cenovus in prior years. We will continue to evaluate all opportunities based on a US$45 per barrel WTI price with the objective of maintaining a prudent and flexible capital structure and strong balance sheet metrics. This approach positions us to be financially resilient in times of lower cash flows. Balance sheet strength continues to be a top priority and we plan to continue to direct our Free Funds Flow towards debt reduction. We continue to target a Net Debt to Adjusted EBITDA ratio of less than 2.0 times.
We remain committed to investment-grade credit ratings and strengthening our ratings from current levels. This includes our continued focus on allocating Free Funds Flow to reduce Net Debt to less than $10 billion and targeting a longer-term Net Debt level at or below $8 billion. The Adjusted Funds Flow is expected to fully fund sustaining capital and shareholder distributions going forward once one-time integration costs associated with the Arrangement are complete.
Contractual Obligations and Commitments
We have obligations for goods and services entered into in the normal course of business. Obligations are primarily related to transportation agreements, our risk management program and an obligation to fund our defined benefit pension and other post-employment benefit plans. Obligations that have original maturities of less than one year are excluded. For further information, see the notes to the June 30, 2021, interim Consolidated Financial Statements and December 31, 2020 Consolidated Financial Statements.
The Arrangement resulted in the assumption of non-cancellable contracts and other commercial commitments. On January 1, 2021, we assumed total commitments of $17.6 billion, of which $7.4 billion were for various transportation commitments. Transportation commitments include $1.7 billion that are subject to regulatory approval or have been approved but are not yet in service.
Our total commitments were $33.0 billion as at June 30, 2021, of which $29.4 billion are for various transportation and storage commitments. Terms are up to 20 years subsequent to the date of commencement and should help align with the Company’s future transportation requirements.
As at June 30, 2021, there were no amounts included in the transportation and storage commitments related to the Keystone XL pipeline due to the cancellation of our transportation services agreement related to the project (December 31, 2020 – $7.0 billion).
Our commitments with HMLP at June 30, 2021, include $2.8 billion related to transportation, storage and other long-term contracts.
We continue to focus on mid-term strategies to broaden market access for our crude oil production including supporting proposed pipeline projects to transport our production to new markets in the U.S. and globally, as well as moving our crude oil production to market by rail. We continue to assess all options to maximize the value of our crude oil.
As at June 30, 2021, outstanding letters of credit issued as security for performance under certain contracts totaled $532 million (December 31, 2020 – $441 million).
Legal Proceedings
We are involved in a limited number of legal claims associated with the normal course of operations. We believe that any liabilities that might arise from such matters, to the extent not provided for, are not likely to have a material effect on our Consolidated Financial Statements.
Contingent Payment
In connection with the Conoco Acquisition and related to a portion of our oil sands production, we agreed to make quarterly payments to ConocoPhillips during the five years subsequent to May 17, 2017 for quarters in which the average WCS crude oil price exceeds $52.00 per barrel during the quarter. As at June 30, 2021, the estimated fair value of the contingent payment was $376 million. As at June 30, 2021, $90 million was payable under the agreement. See the Corporate and Eliminations section of this MD&A for more details.
Transactions with Related Parties
Transactions with HMLP are related party transactions as we have a 35 percent ownership interest in HMLP.
As the operator of the assets held by HMLP, we provide management services for which we recover shared service costs.
We are also the contractor for HMLP and construct its assets on a cost recovery basis with certain restrictions. For the three months and six months ended June 30, 2021, we charged HMLP $32 million and $64 million, respectively, for construction and management services.
We pay an access fee to HMLP for the use of its pipeline systems that are used by our blending business. We also pay HMLP for transportation and storage services. For the three and six months ended June 30, 2021, we incurred costs of $73 million and $145 million, respectively, for the use of HMLP’s pipeline systems, as well as transportation and storage services.
| | |
| RISK MANAGEMENT AND RISK FACTORS |
For a full understanding of the risks that impact us, the following discussion should be read in conjunction with the Risk Management and Risk Factors section of our 2020 annual MD&A.
We are exposed to a number of risks through the pursuit of our strategic objectives. Some of these risks impact the energy industry as a whole and others are unique to our operations. The impact of any risk or a combination of risks may adversely affect, among other things, Cenovus’s business, reputation, financial condition, results of operations and cash flows, which may reduce or restrict our ability to pursue our strategic priorities, respond to changes in our operating environment, pay dividends to our shareholders and fulfill our obligations (including debt servicing requirements) and may materially affect the market price of our securities.
The following provides an update on our risks.
Obligor Under Husky's Existing Notes
Effective March 31, 2021, Cenovus Energy Inc. amalgamated with its wholly-owned subsidiary Husky Energy Inc. under the provisions of the Canada Business Corporations Act. As a result of the amalgamation, Cenovus Energy Inc. became the direct obligor under Husky's existing US$500 million 3.95 percent notes due in 2022, US$750 million 4.00 percent notes due in 2024, $750 million 3.55 percent notes due in 2025, $750 million 3.60 percent notes due in 2027, $1,250 million 3.50 percent notes due in 2028, US$750 million 4.40 percent notes due in 2029, US$387 million 6.80 percent notes due in 2037, and other direct obligations of Husky. See "Risk Management and Risk Factors – Other Risks – Risks Related to the Arrangement – Increased Indebtedness" in our 2020 annual MD&A.
Financial Risk
Commodity Prices
Fluctuations in commodity prices, associated price differentials and refining margins impact our financial condition, results of operations, cash flows, growth, access to capital and cost of borrowing. We partially mitigate our exposure to commodity price risk through the integration of our business, financial instruments, physical contracts, market access commitments and generally through our access to committed credit facilities. In certain instances, Cenovus will use derivative instruments to manage exposure to price volatility on a portion of its refined product, crude oil and natural gas production, inventory or volumes in long-distance transit. For details of our financial instruments, including classification, assumptions made in the calculation of fair value and additional discussion on exposure of risks and the management of those risks, see Notes 26 and 27 to the interim Consolidated Financial Statements.
Risks Associated with Derivative Financial Instruments
Financial instruments expose us to the risk that a counterparty will default on its contractual obligations. This risk is partially mitigated through credit exposure limits, frequent assessment of counterparty credit ratings and netting arrangements, as outlined in our Board-approved Credit Policy.
Financial instruments also expose us to the risk of a loss from adverse changes in the market value of financial instruments or if we are unable to fulfill our delivery obligations related to the underlying physical transaction. Financial instruments may limit the benefit to us if commodity prices, interest or foreign exchange rates change. These risks are managed through hedging limits authorized according to our Market Risk Management Policy.
Impact of Financial Risk Management Activities
Cenovus makes storage and transportation decisions using our marketing and transportation infrastructure, including storage and pipeline assets to optimize product mix, delivery points, transportation commitments and customer diversification. In order to price protect our inventories associated with the storage or transport decisions, Cenovus employs various price alignment and volatility management strategies, including through risk management contracts, to reduce volatility in future cash flows to improve cash flow stability while we are deleveraging our balance sheet.
Transactions typically span across periods, as such, these transactions reside across both realized and unrealized risk management. As the financial contracts settle, they will flow from unrealized to realized risk management gains and losses.
In the three and six months ended June 30, 2021, we incurred a realized risk management loss due to the settlement of benchmark prices relative to our risk management contract prices; the underlying physical inventory sold in the periods recognized a gain due to rising benchmark prices. In the three and six months ended June 30, 2021, unrealized losses were recorded on our crude oil financial instruments primarily due to forward benchmark pricing rising above our risk management contract prices that related to future periods and the realization of settled positions. In a rising commodity price environment, we would expect to realize losses on our risk management activities but recognize gains on the underlying physical inventory sold in the period and the opposite to occur in a falling commodity price environment.
| | |
| CRITICAL ACCOUNTING JUDGMENTS, ESTIMATION UNCERTAINTIES AND ACCOUNTING POLICIES |
Management is required to make estimates and assumptions, as well as use judgment in the application of accounting policies that could have a significant impact on our financial results. Actual results may differ from estimates and those differences may be material. The estimates and assumptions used are subject to updates based on experience and the application of new information. Our critical accounting policies and estimates are reviewed annually by the Audit Committee of the Board. Further details on the basis of preparation and our significant accounting policies can be found in the notes to the Consolidated Financial Statements.
Critical Judgments in Applying Accounting Policies and Key Sources of Estimation Uncertainty
Critical judgments are those judgments made by Management in the process of applying accounting policies that have the most significant effect on the amounts recorded in our annual and interim Consolidated Financial Statements. A full list of the key sources of estimation uncertainty can be found in our annual Consolidated Financial Statements for the year ended December 31, 2020. In 2021, the Company made updates to its critical judgments in applying accounting policies and key sources of estimation uncertainty including the assessment of joint arrangements, recoveries from insurance claims, functional currency for the Company’s subsidiaries and the fair value of related party transactions. Updates to critical judgments and key sources of estimation relate to changes in the operations of the Company as a result of the close of the Arrangement. Further information can be found in Note 3 to the interim Consolidated Financial Statements.
Changes in Accounting Policies
In 2021, as a result of the close of the Arrangement, the Company updated its significant accounting policies including those around principles of consolidation, revenue recognition, employee benefit plans, related party transactions, cash and cash equivalents, PP&E, share capital and warrants and stock based compensation. Further information can be found in Note 3 to the interim Consolidated Financial Statements.
New Accounting Standards and Interpretations not yet Adopted
There are new standards, amendments to accounting standards and interpretations that are effective for annual periods beginning on or after January 1, 2021. There were no new or amended accounting standards or interpretations issued during the six months ended June 30, 2021, that are expected to have a material impact on our interim Consolidated Financial Statements.
Management, including our President & Chief Executive Officer and Executive Vice-President & Chief Financial Officer, assessed the design and effectiveness of internal control over financial reporting (“ICFR”) and disclosure controls and procedures (“DC&P”) as at June 30, 2021. In making its assessment, Management used the Committee of Sponsoring Organizations of the Treadway Commission Framework in Internal Control – Integrated Framework (2013) to evaluate the design and effectiveness of internal control over financial reporting. Based on our evaluation, Management has concluded that both ICFR and DC&P were effective as at June 30, 2021.
On January 1, 2021, Cenovus and Husky closed the Arrangement to combine the two companies. As permitted by and in accordance with, National Instrument 52-109, “Certification of Disclosure in Issuers’ Annual and Interim Filings”, and guidance issued by the U.S. Securities and Exchange Commission, Management has limited the scope and design of ICFR and DC&P to exclude the controls, policies and procedures in respect of the business acquired from Husky. Such scope limitation is primarily due to the time required for Management to assess the ICFR and DC&P relating to Husky in a manner consistent with our other operations. Further integration will take place throughout the year as processes and systems align.
Assets attributable to Husky as at June 30, 2021, represented approximately 35 percent of Cenovus’s total assets, and revenues attributable to Husky for the period April 1 to June 30, 2021, represented approximately 45 percent of Cenovus’s total revenues for the quarter ended June 30, 2021. Revenues attributable to Husky for the period January 1 to June 30, 2021, represented approximately 50 percent of Cenovus’s total revenues for the six months ended June 30, 2021.
Internal control systems, no matter how well designed, have inherent limitations. Therefore, even those systems determined to be effective can provide only reasonable assurance with respect to financial statement preparation and presentation. Also, projections of any evaluation of effectiveness to future periods are subject to the risk that controls may become inadequate because of changes in conditions, or that the degree of compliance with the policies or procedures may deteriorate.
Energy markets have moved in a positive direction since 2020 but we believe that the remainder of 2021 will continue to face uncertainty. The global COVID-19 vaccine rollout is accelerating and economic growth is healthy. However, the scale of resurgence and variants of COVID-19 cases is unpredictable and likely to result in crude oil and refined products market volatility through the remainder of the year. Continued successful distribution of COVID-19 vaccines and the easing of restrictions will be supportive of demand. OPEC+ policy continues to support balancing the market and the group has indicated that supply will gradually be brought back through the year as demand improves. Government policy and stimulus measures are driving expectations of global economic recovery and improving energy consumption. There is optimism around the summer driving season and an increase in demand for refined products in the second half of 2021.
Our focus remains on maintaining the strength of our balance sheet. We have ample liquidity, high quality assets which we are able to effectively manage to respond to price signals, some of the lowest cost structures in the industry and have demonstrated our ability to reduce discretionary capital, all of which should allow us to continue to adapt to potential ongoing market volatility.
We continue to monitor the overall market dynamics to assess how we manage our upstream production levels. Our assets can respond to market signals and ramp production up or down accordingly. Our decisions around production levels and refinery crude run rates will be focused on maximizing the value we receive for our products. We expect our annual upstream production to average between 750.0 thousand BOE per day and 790.0 thousand BOE per day and total downstream throughput of 500.0 thousand barrels per day to 550.0 thousand barrels per day.
We continue to work towards achieving approximately $400 million of the estimated corporate and operating synergies and approximately $600 million of the estimated capital allocation synergies this year. Over the longer-term, we anticipate additional cost savings and margin enhancements based on further physical integration of upstream assets with downstream
assets, which is expected to shorten the value chain and reduce condensate costs associated with heavy oil transportation. We continue to look for additional opportunities to reduce operating, capital, and general and administrative spending and increase our margins through strong operating performance and cost leadership while focusing on safe and reliable operations.
The following outlook commentary is focused on the next 12 months.
Commodity Prices Underlying our Financial Results
Our commodity pricing outlook is influenced by the following:
•We expect the general outlook for crude oil and refined product prices will be volatile and tied primarily to the supply and demand response to the current uncertain price environment, the impact of oversupply, global demand impacts amid COVID-19 concerns, and effectiveness and successful distribution of COVID-19 vaccines.
•The degree to which OPEC+ members (including Russia) continue to maintain crude oil production cuts and the rate they decide to increase production.
•We expect that the WTI-WCS differential in Alberta will remain largely tied to the extent to which supply cuts are sustained, the potential start-up of Enbridge Inc.’s Line 3 Replacement Project, the completion of the Trans Mountain Expansion project, and the level of crude-by-rail activity.
•Refining market crack spreads are expected to be higher than 2020 as demand rebounds but are also increasing to offset the rising cost of RINs. Margins are likely to continue to fluctuate, adjusting for seasonal trends, and refining run cuts in North America.
(1) RINs forward price information is unavailable at June 30, 2021.
Natural gas prices have rebounded from the 2020 lows and the forward curve shows that the market expects AECO prices to maintain these levels. Production declines from both associated gas and dry gas, along with rebounding U.S. demand and liquified natural gas exports should continue to tighten North American gas fundamentals for the next 12 months and result in stronger prices than 2020 on an annual basis.
Natural gas and NGLs production associated with our Conventional assets provide improved upstream integration for the fuel, solvent and blending requirements at our Oil Sands operations.
We expect the Canadian dollar to continue to be tied to crude oil prices, the pace at which the U.S. Federal Reserve Board and the Bank of Canada raise or lower benchmark lending rates relative to each other, and emerging macro-economic factors.
Our upstream crude oil production and most of our downstream refined products are exposed to movements in the WTI crude oil price. With the closing of the Arrangement, our exposure has grown on both the upstream and downstream sides of our business.
Our refining capacity is now focused in the U.S. Midwest along with smaller exposures in the USGC and Alberta, exposing Cenovus to the market crack spread in all of these markets.
Our exposure to crude differentials includes light-heavy and light-medium price differentials. Light-medium price differential exposure is focused on light-medium crudes in the U.S. Midwest market region where we have refining capacity, and to a lesser degree in the USGC and Alberta. Our exposure to light-heavy crude oil price differentials is composed of a global light-heavy component, a regional component in markets we transport barrels to, as well as the Alberta differential, which is subject to transportation constraints. While we expect to see volatility in crude oil prices, we have the ability to partially mitigate the impact of crude oil and refined product prices and differentials through the following:
•Transportation commitments and arrangements – using our existing firm service commitments for takeaway capacity and supporting transportation projects that move crude oil from our production areas to consuming markets, including tidewater markets.
•Integration – having heavy oil refining capacity capable of processing Canadian heavy oil. From a value perspective, our refining business positions us to capture value from both the WTI-WCS differential for Canadian crude oil as well as from spreads on refined products.
•Marketing agreements – limiting the impact of fluctuations in upstream crude oil prices by entering into physical supply transactions with fixed price components directly with refiners.
•Dynamic storage – our ability to use the significant storage capacity in our oil sands reservoirs provides us flexibility on timing of production and sales of our inventory. We will continue to manage our production rates in response to pipeline capacity constraints, voluntary and mandated production curtailments and crude oil price differentials.
•Traditional crude oil storage tanks in various geographic locations.
•Financial hedge transactions – limiting the impact of fluctuations in crude oil and refined product prices by entering into financial transactions related to our inventory price exposures.
Key Priorities For 2021
In the current commodity price environment, we continue to focus on maintaining balance sheet strength and liquidity. Enhancing our financial resilience and flexibility while continuing to deliver safe and reliable operations will continue to be a top priority during these uncertain times. We remain focused on our key priority of reducing our Net Debt.
Our corporate strategy focuses on maximizing shareholder value through cost leadership and realizing the best margins for our products. We plan to remain focused on disciplined capital investment allocation across the full suite of assets for the Company, and continue to identify opportunities to improve our cost structure and enhance margins. Furthermore, the Company prioritizes ongoing ESG leadership and integration of sustainability considerations into our business decisions.
Safe and Reliable Operations
Safe and reliable operations are our number one priority. Safety continues to be a core value that informs all of the decisions we make. We will continue to promote a safety culture in all aspects of our work and use a variety of programs to keep safety top of mind at all times.
Ensure Smooth Integration
In addition to financial and operating synergies, our focus is to create stability for our workforce and advance the high-performing culture of the combined Company. We aim to build an industry-leading people experience and advance leadership, commercial capability and inclusion and diversity programs. We also aim to enable continuity of business performance through practical, effective systems integration and optimization. We will refresh our vision, mission and values to reflect the Company going forward.
Capture Synergies and Maintain Cost Leadership
Capturing the corporate and operating cost synergies of approximately $400 million is well underway for 2021. We are on target to reach our planned total of $1.2 billion annual run-rate synergies by the end of 2021. We expect to meet these targets through the consolidation of information technology systems, eliminating other service overlaps, and through reductions to combined workforce and corporate overhead costs.
Over the longer term, we anticipate additional cost savings and margin enhancements based on further physical integration. The integration of upstream assets with the downstream and transportation, storage and logistics portfolio is expected to shorten the value chain and reduce condensate costs associated with heavy oil transportation over the longer term. We continue to look for ways to improve efficiencies across Cenovus to drive incremental capital, operating and general and administrative cost reductions.
Disciplined Capital Investment
We updated our 2021 guidance on July 28, 2021. The capital guidance range remains the same. However, our guidance now reflects an increase to Oil Sands capital investment by $100 million, offset by a reduction to U.S. Manufacturing, Canadian Manufacturing, and Retail totaling $100 million. We anticipate our total capital expenditures to be between $2.3 billion and $2.7 billion, including sustaining capital of approximately $2.1 billion and costs of $520 million to $570 million (excluding insurance proceeds) for the Superior Refinery rebuild. We will continue to be disciplined with our capital. The guidance data July 28, 2021 is available on our website at cenovus.com.
Our upstream production is expected to range between 750.0 thousand BOE per day and 790.0 thousand BOE per day for 2021. Downstream throughput is expected to be in the range of 500.0 thousand barrels per day to 550.0 thousand barrels per day for 2021. Capturing the estimated $600 million in annual capital allocation synergies is underway across the Company by optimizing sustaining capital to the highest quality assets while maintaining safe and reliable operations across our portfolio.
As at June 30, 2021, our Net Debt position was $12.4 billion. Through a combination of cash on hand and available capacity on our committed credit facilities and demand facilities, we have approximately $11.7 billion of liquidity. We will continue to focus on allocating Free Funds Flow to reduce Net Debt to less than $10 billion and target a longer-term Net Debt level at or below $8 billion.
Maintaining Financial Resilience
We have top-tier assets, some of the lowest cost structures in our industry and a strong balance sheet, all of which position us to withstand the challenges of the current market environment. Our capital planning process is flexible, and spending can be reduced in response to commodity prices and other economic factors to maintain our financial resilience. Our financial framework and flexible business plan allow multiple options to manage our balance sheet. We will continue to assess our spending plans on a regular basis while closely monitoring crude oil prices.
The Company’s priority will be to maximize Free Funds Flow by focusing investments on sustaining capital expenditures which will position us to direct available Free Funds Flow to the balance sheet and allow us to achieve a Net Debt target of $10 billion which approximates a Net Debt to Adjusted EBITDA target of less than 2.0 times at the bottom of the cycle, which we see as approximately US$45 per barrel WTI.
The low funds flow volatility, breakeven prices and corporate sustaining costs supports an investment grade profile and lower cost of capital through the commodity price cycle. We remain committed to maintaining or re-establishing investment grade credit ratings.
Shareholder Returns
After achieving our balance sheet objectives, the Company’s free funds profile is expected to enable sustainable growth in shareholder distributions.
Environmental, Social and Governance
We are committed to demonstrating leading ESG performance. This includes setting and achieving ambitious ESG targets, maintaining robust management systems and continuing transparent performance reporting. We will continue working to earn our position as a global energy supplier of choice by advancing clean technology and reducing emissions intensity. This includes our ambition to achieve net zero emissions by 2050. One of the steps we have taken to achieve this goal is by co-founding the Oil Sands Pathways to Net Zero initiative as described in the Quarterly Results Overview section of this MD&A. We will also continue building upon our strong local community relationships, with a focus on Indigenous reconciliation.
We recently completed a robust ESG materiality assessment to identify the ESG topics that are most impactful to our new portfolio and highest priority for our stakeholders. Based on feedback from both internal and external stakeholders, climate and GHG emissions, water stewardship, biodiversity, Indigenous reconciliation and inclusion and diversity were established as our ESG focus areas. In addition, delivering safe and reliable operations and demonstrating strong governance remain foundational to how we manage our business.
In June 2021, we released our 2020 ESG data report which includes performance metrics for both Cenovus and Husky for 2020, as well as historical data for Cenovus from 2016 to 2019. Our reporting structure aligns with the Sustainability Accounting Standards Board and IPIECA, formerly known as the International Petroleum Industry Environmental Conservation Association, reporting frameworks.
As we update long-term business plans we are also working to set meaningful ESG targets, further building on the announcement of our ESG focus areas. That work is expected to be completed later this year. Once it is approved by the Board, the new targets and proposed plans to achieve them will be disclosed. Concurrently with the disclosure of our ESG targets, we plan to publish a more comprehensive 2020 ESG report, which will include the pro-forma metrics that underpin the ESG targets. This report will align with the Task Force on Climate-related Financial Disclosures as in previous years.
Oil and Gas Information
Barrels of Oil Equivalent – natural gas volumes have been converted to barrels of oil equivalent (BOE) on the basis of six Mcf to one barrel (bbl). BOE may be misleading, particularly if used in isolation. A conversion ratio of one bbl to six Mcf is based on an energy equivalency conversion method primarily applicable at the burner tip and does not represent value equivalency at the wellhead. Given that the value ratio based on the current price of crude oil compared with natural gas is significantly different from the energy equivalency conversion ratio of 6:1, utilizing a conversion on a 6:1 basis is not an accurate reflection of value.
Forward-looking Information
This document contains certain forward-looking statements and forward-looking information (collectively referred to as “forward-looking information”) within the meaning of applicable securities legislation, including the U.S. Private Securities Litigation Reform Act of 1995, about our current expectations, estimates and projections about the future, based on certain assumptions made by us in light of our experience and perception of historical trends. Although we believe that the expectations represented by such forward-looking information are reasonable, there can be no assurance that such expectations will prove to be correct. Readers are cautioned not to place undue reliance on forward-looking information as our actual results may differ materially from those expressed or implied.
Forward-looking information in this document is identified by words such as “achieve”, “aim”, “anticipate”, “believe”, “can be”, “capacity”, “committed”, “commitment”, “continue”, “could”, “deliver”, “drive”, “enhance”, “ensure”, “estimate”, “expect”, “focus”, “forecast”, “forward”, “future”, “guidance”, “maintain”, “may”, “objective”, “outlook”, “plan”, “position”, “potential”, “priority”, “re-establishing”, “seek”, “strategy”, “should”, “target”, “will”, or similar expressions and includes suggestions of future outcomes, including, but not limited to, statements about: strategy, priorities and related milestones; schedules and plans; anticipated benefits of the Arrangement, including achieving corporate, operating and capital allocation synergies and efficiencies, longer term cost savings, debt reduction and enhanced margins; growth in shareholder distributions; actions taken in response to COVID-19 in our workplaces; statements and expectations relating to our 2021 budget; our ability to partially mitigate the impact of crude oil and refined product differentials; maintaining and re-establishing investment grade credit ratings; achieving Net Debt of less than $10 billion and $8 billion or lower longer-term; achieving our Net Debt to Adjusted EBITDA target; maximizing shareholder value; maintaining liquidity; delivering a stable cash flow through price cycles and commodity price volatility and preserving a resilient balance sheet; expected production and throughput levels; becoming a global energy supplier of choice by advancing clean technology and reducing emissions intensity; ambitions to achieve net zero emissions by 2050; plans to strengthen local community relationships, with a focus on Indigenous reconciliation; plans to set and achieve new ESG targets; evaluating disciplined investments in our portfolio against dividends, share repurchases and managing to optimal debt level while maintaining investment grade status; forecast operating and financial results, including forecast sales prices, costs and cash flows; planned capital expenditures and investments, including the amount, timing and funding sources thereof; all statements with respect to our guidance dated July 28, 2021; our ability to take steps to partially
mitigate against wider WTI and WCS price differentials; funding our capital investment and near-term cash requirements through cash from operating activities and prudent use of our balance sheet capacity; focus on mid-term strategies to broaden market access for our crude oil production; preserving financial resilience; future impact of regulatory measures; forecast commodity prices, differentials and trends and expected impact; exchange and interest rates; potential impacts of various risks, including those related to commodity prices and climate change; the potential effectiveness of our risk management strategies; new accounting standards, the timing for the adoption thereof, and anticipated impact on the Consolidated Financial Statements; the immateriality of the effects of any liabilities that may arise out of legal claims associated with the normal course of our operations; the availability and repayment of our credit facilities; and expected impacts of the contingent payment to ConocoPhillips.
Developing forward-looking information involves reliance on a number of assumptions and consideration of certain risks and uncertainties, some of which are specific to Cenovus and others that apply to the industry generally. The factors or assumptions on which our forward-looking information is based include, but are not limited to: forecast oil and natural gas, NGLs, condensate and refined products prices, light-heavy crude oil price differentials; our ability to realize the benefits and anticipated cost synergies associated with the Arrangement; Cenovus’s ability to successfully integrate the business of Husky, including new business activities, assets, operating areas, regulatory jurisdictions, personnel and business partners for Cenovus; the accuracy of any assessments undertaken in connection with the Arrangement and any resulting pro forma information; forecast production volumes are subject to change based on business and market conditions; projected capital investment levels, the flexibility of capital spending plans and associated sources of funding; the absence of significant adverse changes to legislation and regulations, Indigenous relations, interest rates, foreign exchange rates, competitive conditions and the supply and demand for crude oil and natural gas, NGLs, condensate and refined products; the political, economic and social stability of jurisdictions in which Cenovus operates; the absence of significant disruption of operations, including as a result of harsh weather, natural disaster, accident, civil unrest or other similar events; the prevailing climatic conditions impacting Cenovus's operating locations; achievement of further cost reductions and sustainability thereof; applicable royalty regimes, including expected royalty rates; future improvements in availability of product transportation capacity; increase to our share price and market capitalization over the long term; cash flows, cash balances on hand and access to credit and demand facilities being sufficient to fund capital investments; our ability to reduce our 2021 production, including without negative impacts to our assets; realization of expected capacity to store within our oil sands reservoirs barrels not yet produced, including that we will be able to time production and sales of our inventory at later dates when demand has increased, pipeline and/or storage capacity has improved and crude oil differentials have narrowed; the WTI-WCS differential in Alberta remains largely tied to the extent to which voluntary economically driven supply cuts are made, the potential start-up of the Enbridge Inc.’s Line 3 Replacement Program, the completion of Trans Mountain Expansion project, and the level of crude-by-rail activity; the ability of our refining capacity, dynamic storage, existing pipeline commitments and financial hedge transactions to partially mitigate a portion of our WCS crude oil volumes against wider differentials; production declines from both associated gas and dry gas, along with rebounding U.S. demand and liquified natural gas exports should tighten North American gas fundamentals for the next 12 months and result in stronger prices than 2020 on an annual basis; estimates of quantities of oil, bitumen, natural gas and liquids from properties and other sources not currently classified as proved; the accuracy of accounting estimates and judgments; future use and development of technology and associated expected future results; our ability to obtain necessary regulatory and partner approvals; the successful, timely and cost effective implementation of capital projects or stages thereof; our ability to generate sufficient cash flow to meet our current and future obligations; the sufficiency of existing cash balances, internally generated cash flows, existing credit facilities, management of the Corporation’s asset portfolio and access to capital markets to fund future development costs and dividends, including any increase thereto; estimated abandonment and reclamation costs, including associated levies and regulations applicable thereto; our ability to obtain and retain qualified staff and equipment in a timely and cost-efficient manner; our ability to access sufficient capital to pursue our development plans; our ability to complete asset sales, including with desired transaction metrics and within the timelines we expect; the stability of general domestic and global economic, market and business conditions; forecast inflation and other assumptions inherent in Cenovus’s guidance dated July 28, 2021 available on cenovus.com; our future results relative to the guidance dated July 28, 2021 based on current production volumes and operating expenses; expected impacts of, and calculation of, the contingent payment to ConocoPhillips; our ability to access and implement all technology and equipment necessary to achieve expected future results and that such results are realized; our ability to implement capital projects or stages thereof in a successful and timely manner; and other assumptions, risks and uncertainties described from time to time in the filings we make with securities regulatory authorities including the assumptions inherent in Cenovus’s 2021 guidance available on cenovus.com.
The risk factors and uncertainties that could cause our actual results to differ materially from the forward-looking information, include, but are not limited to: the effect of the COVID-19 pandemic on our business, including any related restrictions, containment, and treatment measures taken by varying levels of government in the jurisdictions in which we operate; the success of our new COVID-19 workplace policies and the return of our people to our workplace; our ability to achieve the benefits and anticipated cost synergies anticipated with the Arrangement in a timely manner or at all; Cenovus’s ability to successfully integrate Husky’s business with its own in a timely and cost effective manner or at all; the effects of entering new business activities; unforeseen or undisclosed liabilities associated with the Arrangement; the inaccuracy of any assessments undertaken in connection with the Arrangement and any resulting pro forma information; the inaccuracy of any information
provided by Husky; our ability to access or implement some or all of the technology necessary to efficiently and effectively operate our assets and achieve expected future results; the effect of Cenovus’s increased indebtedness; the effect of new significant shareholders; volatility of and other assumptions regarding commodity prices; foreign exchange risk; a prolonged market downturn; changes in commodity price differentials; the effectiveness of our risk management program; the accuracy of cost estimates regarding commodity prices, currency and interest rates; lack of alignment of realized WCS prices and WCS prices used to calculate the contingent payment to ConocoPhillips; product supply and demand; the accuracy of our share price and market capitalization assumptions; market competition, including from alternative energy sources; risks inherent in our marketing operations, including credit risks, exposure to counterparties and partners, including the ability and willingness of such parties to satisfy contractual obligations in a timely manner; risks inherent in the operation of our crude-by-rail terminal, including health, safety and environmental risks; our ability to maintain desirable ratios of Net Debt to Adjusted EBITDA as well as Net Debt to Capitalization; our ability to access various sources of debt and equity capital, generally, and on terms acceptable to us; our ability to finance growth and sustaining capital expenditures; changes in credit ratings applicable to us or any of our securities; changes to our dividend plans; our ability to utilize tax losses in the future; the accuracy of our reserves, future production and future net revenue estimates; the accuracy of our accounting estimates and judgments; our ability to replace and expand oil and gas reserves; the costs to acquire exploration rights, undertake geological studies, appraisal drilling and project developments; potential requirements under applicable accounting standards for impairment or reversal of estimated recoverable amounts of some or all of our assets or goodwill from time to time; our ability to maintain our relationships with our partners and to successfully manage and operate our integrated operations and business; reliability of our assets including in order to meet production targets; potential disruption or unexpected technical difficulties in developing new products and manufacturing processes; the occurrence of unexpected events resulting in operational interruptions, including blowouts, fires, explosions, railcar incidents or derailments, aviation incidents, gaseous leaks, migration of harmful substances, loss of containment, releases or spills, including releases or spills from offshore facilities and shipping vessels at terminals or hubs and as a result of pipeline or other leaks, corrosion, epidemics or pandemics, and catastrophic events, including, but not limited to, war, extreme weather events, natural disasters, iceberg incidents, acts of vandalism and terrorism, and other accidents or hazards that may occur at or during transport to or from commercial or industrial sites and other accidents or similar events; refining and marketing margins; cost escalations, including inflationary pressures on operating costs, such as labour, materials, natural gas and other energy sources used in oil sands processes and increased insurance deductibles or premiums; the cost and availability of equipment necessary to our operations; potential failure of products to achieve or maintain acceptance in the market; risks associated with the energy industry’s and Cenovus’s reputation, social license to operate and litigation related thereto; unexpected cost increases or technical difficulties in operating, constructing or modifying manufacturing or refining facilities; unexpected difficulties in producing, transporting or refining bitumen and/or crude oil into petroleum and chemical products; risks associated with technology and equipment and its application to our business, including potential cyberattacks; geo-political and other risks associated with our international operations; risks associated with climate change and our assumptions relating thereto; the timing and the costs of well and pipeline construction; our ability to access markets and to secure adequate and cost effective product transportation including sufficient pipeline, crude-by-rail, marine or alternate transportation, including to address any gaps caused by constraints in the pipeline system or storage capacity; availability of, and our ability to attract and retain, critical talent; possible failure to obtain and retain qualified leadership and personnel, and equipment in a timely and cost efficient manner; changes in labour demographics and relationships, including with any unionized workforces; unexpected abandonment and reclamation costs; changes in the regulatory frameworks, permits and approvals in any of the locations in which we operate or to any of the infrastructure upon which we rely; government actions or regulatory initiatives to curtail energy operations or pursue broader climate change agendas; changes to regulatory approval processes and land-use designations, royalty, tax, environmental, greenhouse gas, carbon, climate change and other laws or regulations, or changes to the interpretation of such laws and regulations, as adopted or proposed, the impact thereof and the costs associated with compliance; the expected impact and timing of various accounting pronouncements, rule changes and standards on our business, our financial results and our Consolidated Financial Statements; changes in general economic, market and business conditions; the impact of production agreements among OPEC and non-OPEC members; the political, social and economic conditions in the jurisdictions in which we operate or supply; the status of our relationships with the communities in which we operate, including with Indigenous communities; the occurrence of unexpected events such as protests, pandemics, war, terrorist threats and the instability resulting therefrom; and risks associated with existing and potential future lawsuits, shareholder proposals and regulatory actions against us.
Readers are cautioned that the foregoing lists are not exhaustive and are made as at the date hereof. Events or circumstances could cause our actual results to differ materially from those estimated or projected and expressed in, or implied by, the forward-looking information. For a full discussion of our material risk factors, see Risk Management and Risk Factors in this MD&A, and to the risk factors described in other documents Cenovus files from time to time with securities regulatory authorities in Canada, available on SEDAR at sedar.com, and with the U.S. Securities and Exchange Commission on EDGAR at sec.gov, and on the Corporation’s website at cenovus.com. Additional information concerning Husky’s business and assets as of December 31, 2020 may be found in the Husky Annual Information Form and Husky MD&A, each of which is filed and available on SEDAR under Husky's profile at sedar.com.
Information on or connected to Cenovus on Cenovus’s website at cenovus.com or Husky’s website at huskyenergy.com does not form part of this MD&A unless expressly incorporated by reference herein.
ABBREVIATIONS
The following abbreviations have been used in this document:
| | | | | | | | | | | |
| Crude Oil | Natural Gas |
| | | |
| bbl | barrel | Mcf | thousand cubic feet |
| Mbbls/d | thousand barrels per day | MMcf | million cubic feet |
| MMbbls | million barrels | Bcf | billion cubic feet |
| BOE | barrel of oil equivalent | MMBtu | million British thermal units |
| MMBOE | Million barrels of oil equivalent | GJ | gigajoule |
| WTI | West Texas Intermediate | AECO | Alberta Energy Company |
| WCS | Western Canadian Select | NYMEX | New York Mercantile Exchange |
| CDB | Christina Dilbit Blend | WCSB | Western Canadian Sedimentary Basin |
| MSW | Mixed Sweet Blend | | |
| HSB | Husky Synthetic Blend | | |
| WTS | West Texas Sour | | |
NETBACK RECONCILIATIONS
The following tables provide a reconciliation of the items comprising Netbacks to Operating Margin found in our interim Consolidated Financial Statements.
Total Production
Upstream Financial Results
| | | | | | | | | | | | | | | | | | | | | | | | | | | | | | | | | | | | | | | | | | | | | | | |
| Per Interim Consolidated Financial Statements | |
Three Months Ended June 30, 2021 ($ millions) | Oil Sands (1) | | | Conventional (1) | | | Offshore (1) | | | Total Upstream | |
| Gross Sales | | 5,015 | | | | | 626 | | | | | 427 | | | | | 6,068 | | |
| Royalties | | 469 | | | | | 39 | | | | | 25 | | | | | 533 | | |
| Purchased Product | | 574 | | | | | 287 | | | | | — | | | | | 861 | | |
| Transportation and Blending | | 1,780 | | | | | 19 | | | | | 3 | | | | | 1,802 | | |
| Operating | | 592 | | | | | 140 | | | | | 59 | | | | | 791 | | |
| Netback | | 1,600 | | | | | 141 | | | | | 340 | | | | | 2,081 | | |
| Realized (Gain) Loss on Risk Management | | 189 | | | | | (1) | | | | | — | | | | | 188 | | |
| Operating Margin | | 1,411 | | | | | 142 | | | | | 340 | | | | | 1,893 | | |
| | | | | | | | | | | | | | | |
| | | | | | | | | | | | | | | | | | | | | | | | | | | | | | | | | | | | | | |
| Per Interim Consolidated Financial Statements | | Adjustments | | Basis of Netback Calculation | |
Three Months Ended June 30, 2021 ($ millions) | Total Upstream | | Condensate | Third-Party Sourced | Internal Consumption (2) | Equity Adjustment (3) | Other (4) | | Total Upstream | |
| Gross Sales | | 6,068 | | | (1,416) | | (795) | | (145) | | 50 | | (82) | | | | 3,680 | | |
| Royalties | | 533 | | | — | | — | | — | | 5 | | — | | | | 538 | | |
| Purchased Product | | 861 | | | — | | (795) | | — | | — | | (66) | | | | — | | |
| Transportation and Blending | | 1,802 | | | (1,416) | | — | | — | | — | | — | | | | 386 | | |
| Operating | | 791 | | | — | | — | | (145) | | 7 | | (9) | | | | 644 | | |
| Netback | | 2,081 | | | — | | — | | — | | 38 | | (7) | | | | 2,112 | | |
| Realized (Gain) Loss on Risk Management | | 188 | | | — | | — | | — | | — | | — | | | | 188 | | |
| Operating Margin | | 1,893 | | | — | | — | | — | | 38 | | (7) | | | | 1,924 | | |
| | | | | | | | | | | | |
| | | | | | | | | | | | | | | | | | | | | | | | | | | | | | | | | | | | | | | | | | | | | | | |
| Per Interim Consolidated Financial Statements | |
Three Months Ended June 30, 2020 ($ millions) (5) | Oil Sands(1) | | | Conventional (1) | | | Offshore (1) | | | Total Upstream | |
| Gross Sales | | 1,247 | | | | | 182 | | | | | — | | | | | 1,429 | | |
| Royalties | | 20 | | | | | 1 | | | | | — | | | | | 21 | | |
| Purchased Product | | 166 | | | | | 47 | | | | | — | | | | | 213 | | |
| Transportation and Blending | | 632 | | | | | 19 | | | | | — | | | | | 651 | | |
| Operating | | 233 | | | | | 83 | | | | | — | | | | | 316 | | |
| Netback | | 196 | | | | | 32 | | | | | — | | | | | 228 | | |
| Realized (Gain) Loss on Risk Management | | 66 | | | | | — | | | | | — | | | | | 66 | | |
| Operating Margin | | 130 | | | | | 32 | | | | | — | | | | | 162 | | |
| | | | | | | | | | | | | | | |
| | | | | | | | | | | | | | | | | | | | | | | | | | | | | | | | | | | | | | |
| Per Interim Consolidated Financial Statements | | Adjustments | | Basis of Netback Calculation | |
Three Months Ended June 30, 2020 ($ millions) (5) | Total Upstream | | Condensate | Third-party Sourced | Inventory Write-Down (6) | Internal Consumption (2) | Other (4) | | Total Upstream | |
| Gross Sales | | 1,429 | | | (639) | | (231) | | — | | (65) | | (13) | | | | 481 | | |
| Royalties | | 21 | | | — | | — | | 6 | | — | | — | | | | 27 | | |
| Purchased Product | | 213 | | | — | | (231) | | — | | — | | 18 | | | | — | | |
| Transportation and Blending | | 651 | | | (639) | | — | | 296 | | — | | 1 | | | | 309 | | |
| Operating | | 316 | | | — | | — | | 27 | | (65) | | (19) | | | | 259 | | |
| Netback | | 228 | | | — | | — | | (329) | | — | | (13) | | | | (114) | | |
| Realized (Gain) Loss on Risk Management | | 66 | | | — | | — | | — | | — | | — | | | | 66 | | |
| Operating Margin | | 162 | | | — | | — | | (329) | | — | | (13) | | | | (180) | | |
| | | | | | | | | | | | |
(1)Found in Note 1 of the Interim Consolidated Financial Statements.
(2)Represents natural gas volumes produced by the Conventional segment used for internal consumption by the Oil Sands segment.
(3)Revenues and expenses related to the HCML joint venture are accounted for using the equity method for consolidated financial statement purposes.
(4)Other includes construction, transportation and blending and third-party processing margin.
(5)Prior periods have been reclassified to conform with current period’s operating segments.
(6)Realization of prior period inventory write-down in reversals.
| | | | | | | | | | | | | | | | | | | | | | | | | | | | | | | | | | | | | | | | | | | | | | | |
| Per Interim Consolidated Financial Statements | |
Six Months Ended June 30, 2021 ($ millions) |
Oil Sands (1) | | | Conventional (1) | | | Offshore (1) | | | Total Upstream | |
| Gross Sales | | 9,790 | | | | | 1,402 | | | | | 858 | | | | | 12,050 | | |
| Royalties | | 793 | | | | | 63 | | | | | 50 | | | | | 906 | | |
| Purchased Product | | 1,292 | | | | | 668 | | | | | — | | | | | 1,960 | | |
| Transportation and Blending | | 3,558 | | | | | 37 | | | | | 7 | | | | | 3,602 | | |
| Operating | | 1,177 | | | | | 282 | | | | | 117 | | | | | 1,576 | | |
| Netback | | 2,970 | | | | | 352 | | | | | 684 | | | | | 4,006 | | |
| Realized (Gain) Loss on Risk Management | | 418 | | | | | — | | | | | — | | | | | 418 | | |
| Operating Margin | | 2,552 | | | | | 352 | | | | | 684 | | | | | 3,588 | | |
| | | | | | | | | | | | | | | |
| | | | | | | | | | | | | | | | | | | | | | | | | | | | | | | | | | | | | | |
| Per Interim Consolidated Financial Statements | | Adjustments | | Basis of Netback Calculation | |
Six Months Ended June 30, 2021 ($ millions) | Total Upstream | | Condensate | Third-party Sourced | Internal Consumption (2) | Equity Adjustment (3) | Other (4) | | Total Upstream | |
| Gross Sales | | 12,050 | | | (2,784) | | (1,848) | | (294) | | 102 | | (176) | | | | 7,050 | | |
| Royalties | | 906 | | | — | | — | | — | | 12 | | — | | | | 918 | | |
| Purchased Product | | 1,960 | | | — | | (1,848) | | — | | — | | (112) | | | | — | | |
| Transportation and Blending | | 3,602 | | | (2,784) | | — | | — | | — | | — | | | | 818 | | |
| Operating | | 1,576 | | | — | | — | | (294) | | 12 | | (21) | | | | 1,273 | | |
| Netback | | 4,006 | | | — | | — | | — | | 78 | | (43) | | | | 4,041 | | |
| Realized (Gain) Loss on Risk Management | | 418 | | | — | | — | | — | | — | | — | | | | 418 | | |
| Operating Margin | | 3,588 | | | — | | — | | — | | 78 | | (43) | | | | 3,623 | | |
| | | | | | | | | | | | |
| | | | | | | | | | | | | | | | | | | | | | | | | | | | | | | | | | | | | | | | | | | | | | | | | | | | | | | | | | | | | | | | | | | | | | | | | | | | | | | | | | | | | | |
| Per Interim Consolidated Financial Statements | | | | | | | | | | | | | | |
Six Months Ended June 30, 2020 ($ millions) (5) | Oil Sands (1) | | | Conventional (1) | | | Offshore (1) | | | Total Upstream | | | | | | | | | | | | | | |
| Gross Sales | | 3,681 | | | | | 404 | | | | | — | | | | | 4,085 | | | | | | | | | | | | | | | |
| Royalties | | 71 | | | | | 4 | | | | | — | | | | | 75 | | | | | | | | | | | | | | | |
| Purchased Product | | 571 | | | | | 108 | | | | | — | | | | | 679 | | | | | | | | | | | | | | | |
| Transportation and Blending | | 2,537 | | | | | 42 | | | | | — | | | | | 2,579 | | | | | | | | | | | | | | | |
| Operating | | 553 | | | | | 167 | | | | | — | | | | | 720 | | | | | | | | | | | | | | | |
| Netback | | (51) | | | | | 83 | | | | | — | | | | | 32 | | | | | | | | | | | | | | | |
| Realized (Gain) Loss on Risk Management | | 91 | | | | | — | | | | | — | | | | | 91 | | | | | | | | | | | | | | | |
| Operating Margin | | (142) | | | | | 83 | | | | | — | | | | | (59) | | | | | | | | | | | | | | | |
| | | | | | | | | | | | | | | | | | | | | | | | | | | | |
| | | | | | | | | | | | | | | | | | | | | | | | | | | | | | | | | | | | | | | | | | | | | | | | | | | | | | | | | | | | | | | | | | | | | | | | | | | | | | | | | | | |
| Per Interim Consolidated Financial Statements | | | Adjustments | | | Basis of Netback Calculation | |
Six Months Ended June 30, 2020 ($ millions) (5) | Total Upstream | | | | Condensate | | | | Third-party Sourced | | | Inventory Write-Down (6) | | | Internal Consumption (2) | | | Other(4) | | | Total Upstream | |
| Gross Sales | | 4,085 | | | | | (1,852) | | | | | (697) | | | | | — | | | | | (133) | | | | | (30) | | | | | 1,373 | | |
| Royalties | | 75 | | | | | — | | | | | — | | | | | (1) | | | | | — | | | | | — | | | | | 74 | | |
| Purchased Product | | 679 | | | | | — | | | | | (697) | | | | | — | | | | | — | | | | | 18 | | | | | — | | |
| Transportation and Blending | | 2,579 | | | | | (1,852) | | | | | — | | | | | (5) | | | | | — | | | | | — | | | | | 722 | | |
| Operating | | 720 | | | | | — | | | | | — | | | | | — | | | | | (133) | | | | | (37) | | | | | 550 | | |
| Netback | | 32 | | | | | — | | | | | — | | | | | 6 | | | | | — | | | | | (11) | | | | | 27 | | |
| Realized (Gain) Loss on Risk Management | | 91 | | | | | — | | | | | — | | | | | — | | | | | — | | | | | — | | | | | 91 | | |
| Operating Margin | | (59) | | | | | — | | | | | — | | | | | 6 | | | | | — | | | | | (11) | | | | | (64) | | |
| | | | | | | | | | | | | | | | | | | | | | | | | | | |
(1)Found in Note 1 of the Interim Consolidated Financial Statements.
(2)Represents natural gas volumes produced by the Conventional segment used for internal consumption by the Oil Sands segment.
(3)Revenues and expenses related to the HCML joint venture are accounted for using the equity method for consolidated financial statement purposes.
(4)Other includes construction, transportation and blending and third-party processing margin.
(5)Prior periods have been reclassified to conform with current period’s operating segments.
(6)Netbacks do not reflect non-cash write-downs or reversals of product inventory until it is realized when the product is sold. These amount are net of inventory write-down reversals.
Oil Sands
| | | | | | | | | | | | | | | | | | | | | | | | | | | | | | | | | | | |
| Basis of Netback Calculation |
Three Months Ended June 30, 2021 ($ millions) | | Foster Creek | Christina Lake | Sunrise | Other Oil Sands (2) | | Total Bitumen and Heavy Oil | | Natural Gas and Medium Oil | | Total Oil sands |
| Gross Sales | | 860 | | 1,274 | | 156 | | 730 | | | 3,020 | | | 8 | | | 3,028 | |
| Royalties | | 142 | | 242 | | 4 | | 80 | | | 468 | | | 1 | | | 469 | |
| Purchased Product | | — | | — | | — | | — | | | — | | | — | | | — | |
| Transportation and Blending | | 155 | | 131 | | 43 | | 35 | | | 364 | | | — | | | 364 | |
| Operating | | 154 | | 171 | | 54 | | 203 | | | 582 | | | 9 | | | 591 | |
| Netback | | 409 | | 730 | | 55 | | 412 | | | 1,606 | | | (2) | | | 1,604 | |
| Realized (Gain) Loss on Risk Management | | | | | | | | | | | 189 | |
| Operating Margin | | | | | | | | | | | 1,415 | |
| | | | | | | | | | | |
| | | | | | | | | | | | | | | | | | | | | | | | | | |
| | Basis of Netback Calculation | Adjustments | | Per Interim Consolidated Financial Statements (1) |
Three Months Ended June 30, 2021 ($ millions) | | Total Oil Sands | | Condensate | Third-party Sourced | Other (3) | | Total Oil Sands |
| Gross Sales | | 3,028 | | | 1,416 | | 508 | | 63 | | | 5,015 | |
| Royalties | | 469 | | | — | | — | | — | | | 469 | |
| Purchased Product | | — | | | — | | 508 | | 66 | | | 574 | |
| Transportation and Blending | | 364 | | | 1,416 | | — | | — | | | 1,780 | |
| Operating | | 591 | | | — | | — | | 1 | | | 592 | |
| Netback | | 1,604 | | | — | | — | | (4) | | | 1,600 | |
| Realized (Gain) Loss on Risk Management | | 189 | | | — | | — | | — | | | 189 | |
| Operating Margin | | 1,415 | | | — | | — | | (4) | | | 1,411 | |
| | | | | | | | |
| | | | | | | | | | | | | | | | | | | | | | | | | | | | | | | | | | | |
| Basis of Netback Calculation |
Three Months Ended June 30, 2020 ($ millions) (4) | | Foster Creek | Christina Lake | Sunrise | Other Oil Sands (2) | | Total Bitumen and Heavy Oil | | Natural Gas and Medium Oil | | Total Oil Sands |
| Gross Sales | | 222 | | 203 | | — | | — | | | 425 | | | — | | | 425 | |
| Royalties | | 8 | | 18 | | — | | — | | | 26 | | | — | | | 26 | |
| Purchased Product | | — | | — | | — | | — | | | — | | | — | | | — | |
| Transportation and Blending | | 177 | | 112 | | — | | — | | | 289 | | | — | | | 289 | |
| Operating | | 130 | | 118 | | — | | — | | | 248 | | | — | | | 248 | |
| Netback | | (93) | | (45) | | — | | — | | | (138) | | | — | | | (138) | |
| Realized (Gain) Loss on Risk Management | | | | | | | | | | | 66 | |
| Operating Margin | | | | | | | | | | | (204) | |
| | | | | | | | | | | |
| | | | | | | | | | | | | | | | | | | | | | | | | | | | | |
| | Basis of Netback Calculation | Adjustments | | Per Interim Consolidated Financial Statements (1) |
Three Months Ended June 30, 2020 ($ millions) (3) | | Total Oil Sands | | Condensate | Third-party Sourced | Inventory Write-down (5) | Other | | Total Oil Sands |
| Gross Sales | | 425 | | | 639 | | 182 | | — | | 1 | | | 1,247 | |
| Royalties | | 26 | | | — | | — | | (6) | | — | | | 20 | |
| Purchased Product | | — | | | — | | 182 | | — | | (16) | | | 166 | |
| Transportation and Blending | | 289 | | | 639 | | — | | (296) | | — | | | 632 | |
| Operating | | 248 | | | — | | — | | (27) | | 12 | | | 233 | |
| Netback | | (138) | | | — | | — | | 329 | | 5 | | | 196 | |
| Realized (Gain) Loss on Risk Management | | 66 | | | — | | — | | — | | — | | | 66 | |
| Operating Margin | | (204) | | | — | | — | | 329 | | 5 | | | 130 | |
| | | | | | | | | |
(1)Found in Note 1 of the Interim Consolidated Financial Statements.
(2)Includes Tucker, Lloydminster Thermal and Lloydminster Cold/EOR assets.
(3)Other includes construction, transportation and blending margin.
(4)Prior periods have been reclassified to conform with current period’s operating segments.
(5)Netbacks do not reflect non-cash write-downs or reversals of product inventory until it is realized when the product is sold. These amount are net of inventory write-down reversals.
| | | | | | | | | | | | | | | | | | | | | | | | | | | | | | | | | | | |
| Basis of Netback Calculation |
Six Months Ended June 30, 2021 ($ millions) | Foster Creek | Christina Lake | Sunrise | Other Oil Sands (2) | | Total Bitumen and Heavy Oil | | Natural Gas and Medium Oil | | Total Oil sands |
| Gross Sales | | 1,712 | | 2,269 | | 274 | | 1,421 | | | 5,676 | | | 17 | | | 5,693 | |
| Royalties | | 249 | | 409 | | 6 | | 128 | | | 792 | | | 1 | | | 793 | |
| Purchased Product | | — | | — | | — | | — | | | — | | | — | | | — | |
| Transportation and Blending | | 328 | | 261 | | 70 | | 115 | | | 774 | | | — | | | 774 | |
| Operating | | 323 | | 335 | | 85 | | 410 | | | 1,153 | | | 17 | | | 1,170 | |
| Netback | | 812 | | 1,264 | | 113 | | 768 | | | 2,957 | | | (1) | | | 2,956 | |
| Realized (Gain) Loss on Risk Management | | | | | | | | | | | 418 | |
| Operating Margin | | | | | | | | | | | 2,538 | |
| | | | | | | | | | | |
| | | | | | | | | | | | | | | | | | | | | | | | | | |
| Basis of Netback Calculation | Adjustments | | Per Interim Consolidated Financial Statements (1) |
Six Months Ended June 30, 2021 ($ millions) | | Total Oil Sands | | Condensate | Third-party Sourced | Other (3) | | Total Oil Sands |
| Gross Sales | | 5,693 | | | 2,784 | | 1,180 | | 133 | | | 9,790 | |
| Royalties | | 793 | | | — | | — | | — | | | 793 | |
| Purchased Product | | — | | | — | | 1,180 | | 112 | | | 1,292 | |
| Transportation and Blending | | 774 | | | 2,784 | | — | | — | | | 3,558 | |
| Operating | | 1,170 | | | — | | — | | 7 | | | 1,177 | |
| Netback | | 2,956 | | | — | | — | | 14 | | | 2,970 | |
| Realized (Gain) Loss on Risk Management | | 418 | | | — | | — | | — | | | 418 | |
| Operating Margin | | 2,538 | | | — | | — | | 14 | | | 2,552 | |
| | | | | | | | |
| | | | | | | | | | | | | | | | | | | | | | | | | | | | | | | | | | | |
| Basis of Netback Calculation |
Six Months Ended June 30, 2020 ($ millions) | | Foster Creek | Christina Lake | Sunrise | Other Oil Sands (2) | | Total Bitumen and Heavy Oil | | Natural Gas and Medium Oil | | Total Oil sands |
| Gross Sales | | 639 | | 596 | | — | | — | | | 1,235 | | | — | | | 1,235 | |
| Royalties | | 31 | | 39 | | — | | — | | | 70 | | | — | | | 70 | |
| Purchased Product | | — | | — | | — | | — | | | — | | | — | | | — | |
| Transportation and Blending | | 398 | | 282 | | — | | — | | | 680 | | | — | | | 680 | |
| Operating | | 273 | | 256 | | — | | — | | | 529 | | | — | | | 529 | |
| Netback | | (63) | | 19 | | — | | — | | | (44) | | | — | | | (44) | |
| Realized (Gain) Loss on Risk Management | | | | | | | | | | | 91 | |
| Operating Margin | | | | | | | | | | | (135) | |
| | | | | | | | | | | |
| | | | | | | | | | | | | | | | | | | | | | | | | | | | | |
| Basis of Netback Calculation | | Adjustments | Per Interim Consolidated Financial Statements (1) |
Six Months Ended June 30, 2020 ($ millions) (3) | | Total Oil Sands | | Condensate | Third-party Sourced | Inventory Write-down (5) | Other | | Total Oil Sands |
| Gross Sales | | 1,235 | | | 1,852 | | 587 | | — | | 7 | | | 3,681 | |
| Royalties | | 70 | | | — | | — | | 1 | | — | | | 71 | |
| Purchased Product | | — | | | — | | 587 | | — | | (16) | | | 571 | |
| Transportation and Blending | | 680 | | | 1,852 | | — | | 5 | | — | | | 2,537 | |
| Operating | | 529 | | | — | | — | | — | | 24 | | | 553 | |
| Netback | | (44) | | | — | | — | | (6) | | (1) | | | (51) | |
| Realized (Gain) Loss on Risk Management | | 91 | | | — | | — | | — | | — | | | 91 | |
| Operating Margin | | (135) | | | — | | — | | (6) | | (1) | | | (142) | |
| | | | | | | | | |
(1)Found in Note 1 of the Interim Consolidated Financial Statements.
(2)Includes Tucker, Lloydminster Thermal and Lloydminster cold/EOR assets.
(3)Other includes construction, transportation and blending margin.
(4)Prior periods have been reclassified to conform with current period’s operating segments.
(5)Netbacks do not reflect non-cash write-downs or reversals of product inventory until it is realized when the product is sold. These amount are net of inventory write-down reversals.
Conventional
| | | | | | | | | | | | | | | | | | | | | | | |
| | Basis of Netback Calculation | | Adjustments | | Per Interim Consolidated Financial Statements (1) |
Three Months Ended June 30, 2021 ($ millions) | | Conventional | | Third-party Sourced | Other (2) | | Conventional |
| Gross Sales | | 320 | | | 287 | | 19 | | | 626 | |
| Royalties | | 39 | | | — | | — | | | 39 | |
| Purchased Product | | — | | | 287 | | — | | | 287 | |
| Transportation and Blending | | 19 | | | — | | — | | | 19 | |
| Operating | | 132 | | | — | | 8 | | | 140 | |
| Netback | | 130 | | | — | | 11 | | | 141 | |
| Realized (Gain) Loss on Risk Management | | (1) | | | — | | — | | | (1) | |
| Operating Margin | | 131 | | | — | | 11 | | | 142 | |
| | | | | | | |
| | | | | | | | | | | | | | | | | | | | | | | | | | |
| Basis of Netback Calculation | | Adjustments | | Per Interim Consolidated Financial Statements (1) |
Three Months Ended June 30, 2020 ($ millions) | Conventional | | Third-party Sourced | Other (2) | | Conventional |
| Gross Sales | | 121 | | | 49 | | 12 | | | | 182 | |
| Royalties | | 1 | | | — | | — | | | | 1 | |
| Purchased Product | | — | | | 49 | | (2) | | | | 47 | |
| Transportation and Blending | | 20 | | | — | | (1) | | | | 19 | |
| Operating | | 76 | | | — | | 7 | | | | 83 | |
| Netback | | 24 | | | — | | 8 | | | | 32 | |
| Realized (Gain) Loss on Risk Management | | — | | | — | | — | | | | — | |
| Operating Margin | | 24 | | | — | | 8 | | | | 32 | |
| | | | | | | | |
| | | | | | | | | | | | | | | | | | | | | | | | | | |
| Basis of Netback Calculation | Adjustments | | Per Interim Consolidated Financial Statements (1) |
Six Months Ended June 30, 2021 ($ millions) | Conventional | | Third-party Sourced | Other (2) | | Conventional |
| Gross Sales | | 691 | | | 668 | | 43 | | | | 1,402 | |
| Royalties | | 63 | | | — | | — | | | | 63 | |
| Purchased Product | | — | | | 668 | | — | | | | 668 | |
| Transportation and Blending | | 37 | | | — | | — | | | | 37 | |
| Operating | | 268 | | | — | | 14 | | | | 282 | |
| Netback | | 323 | | | — | | 29 | | | | 352 | |
| Realized (Gain) Loss on Risk Management | | — | | | — | | — | | | | — | |
| Operating Margin | | 323 | | | — | | 29 | | | | 352 | |
| | | | | | | | |
| | | | | | | | | | | | | | | | | | | | | | | | | | |
| Basis of Netback Calculation | Adjustments | | Per Interim Consolidated Financial Statements (1) |
Six Months Ended June 30, 2020 ($ millions) | Conventional | | Third-party Sourced | Other (2) | | Conventional |
| Gross Sales | | 271 | | | 110 | | 23 | | | | 404 | |
| Royalties | | 4 | | | — | | — | | | | 4 | |
| Purchased Product | | — | | | 110 | | (2) | | | | 108 | |
| Transportation and Blending | | 42 | | | — | | — | | | | 42 | |
| Operating | | 154 | | | — | | 13 | | | | 167 | |
| Netback | | 71 | | | — | | 12 | | | | 83 | |
| Realized (Gain) Loss on Risk Management | | — | | | — | | — | | | | — | |
| Operating Margin | | 71 | | | — | | 12 | | | | 83 | |
| | | | | | | | |
(1)Found in Note 1 of the Interim Consolidated Financial Statements.
(2)Reflects operating margin from processing facility.
(3)Prior periods have been reclassified to conform with current period’s operating segments.
Offshore
| | | | | | | | | | | | | | | | | | | | | | | | | | | | | | | | | | | |
| Basis of Netback Calculation | | Adjustment | | Per Interim Consolidated Financial Statements (2) |
Three Months Ended June 30, 2021 ($ millions) | | China | Indonesia (1) | Atlantic | | Total Offshore | | Equity Adjustment (1) | | Total Offshore |
| Gross Sales | | 308 | | 50 | | 119 | | | 477 | | | (50) | | | | 427 | |
| Royalties | | 16 | | 5 | | 9 | | | 30 | | | (5) | | | | 25 | |
| Purchased Product | | — | | — | | — | | | — | | | — | | | | — | |
| Transportation and Blending | | — | | — | | 3 | | | 3 | | | — | | | | 3 | |
| Operating | | 23 | | 8 | | 35 | | | 66 | | | (7) | | | | 59 | |
| Netback | | 269 | | 37 | | 72 | | | 378 | | | (38) | | | | 340 | |
| Realized (Gain) Loss on Risk Management | | | | | | — | | | — | | | | — | |
| Operating Margin | | | | | | 378 | | | (38) | | | | 340 | |
| | | | | | | | | | | |
| | | | | | | | | | | | | | | | | | | | | | | | | | | | | | | | | | | |
| Basis of Netback Calculation | | Adjustment | | Per Interim Consolidated Financial Statements (2) |
Six Months Ended June 30, 2021 ($ millions) | | China | Indonesia (1) | Atlantic | | Total Offshore | | Equity Adjustment (1) | | Total Offshore |
| Gross Sales | | 629 | | 102 | | 229 | | | 960 | | | (102) | | | | 858 | |
| Royalties | | 33 | | 12 | | 17 | | | 62 | | | (12) | | | | 50 | |
| Purchased Product | | — | | — | | — | | | — | | | — | | | | — | |
| Transportation and Blending | | — | | — | | 7 | | | 7 | | | — | | | | 7 | |
| Operating | | 44 | | 14 | | 71 | | | 129 | | | (12) | | | | 117 | |
| Netback | | 552 | | 76 | | 134 | | | 762 | | | (78) | | | | 684 | |
| Realized (Gain) Loss on Risk Management | | | | | | — | | | — | | | | — | |
| Operating Margin | | | | | | 762 | | | (78) | | | | 684 | |
| | | | | | | | | | | |
(1)Revenues and expenses related to the HCML joint venture are accounted for using the equity method for consolidated financial statement purposes.
(2)Found in Note 1 of the Interim Consolidated Financial Statements.
Sales Volumes (1)
The following table provides the sales volumes used to calculate Netback:
| | | | | | | | | | | | | | | | | | | | | | | | | | | | | | | | | | | | | | | | | | | | | | | |
| Three Months Ended June 30, | | | | Six Month Ended June 30, | |
| (BOE/d, unless otherwise stated) | 2021 | | | 2020 | | | | 2021 | | | | 2020 | |
| Oil Sands | | | | | | | | | | | | | | | |
| Foster Creek | | 139.0 | | | | | 171.1 | | | | | 156.9 | | | | | 170.2 | | |
| Christina Lake | | 235.8 | | | | | 199.0 | | | | | 226.7 | | | | | 213.9 | | |
| Sunrise | | 25.0 | | | | | — | | | | | 26.9 | | | | | — | | |
| Other Oil Sands | | 144.2 | | | | | — | | | | | 144.1 | | | | | — | | |
| Total Oil Sands | | 544.0 | | | | | 370.1 | | | | | 554.6 | | | | | 384.0 | | |
| | | | | | | | | | | | | | | |
| Conventional | | 141.3 | | | | | 92.0 | | | | | 138.6 | | | | | 93.8 | | |
| | | | | | | | | | | | | | | |
| Sales before Internal Consumption | | 685.3 | | | | | 462.1 | | | | | 693.2 | | | | | 477.8 | | |
Less: Internal Consumption (2) | | (85.0) | | | | | (55.6) | | | | | (85.8) | | | | | (56.6) | | |
| | | | | | | | | | | | | | | |
| Offshore | | | | | | | | | | | | | | | |
| Asia Pacific - China | | 49.0 | | | | | — | | | | | 50.2 | | | | | — | | |
| Asia Pacific - Indonesia | | 8.8 | | | | | — | | | | | 9.1 | | | | | — | | |
| Atlantic | | 15.2 | | | | | — | | | | | 15.1 | | | | | — | | |
| Total Offshore | | 73.0 | | | | | — | | | | | 74.4 | | | | | — | | |
| | | | | | | | | | | | | | | |
| Total Sales | | 673.3 | | | | | 406.5 | | | | | 681.8 | | | | | 421.2 | | |
(1)Presented on dry bitumen basis.
(2)Less natural gas volumes used for internal consumption by the Oil Sands segment.
Cenovus Energy Inc.
Interim Consolidated Financial Statements (unaudited)
For the Periods Ended June 30, 2021
(Canadian Dollars)
CONSOLIDATED FINANCIAL STATEMENTS (unaudited)
For the periods ended June 30, 2021
| | | | | |
| Cenovus Energy Inc. – Q2 2021 Interim Consolidated Financial Statements | 2 |
CONSOLIDATED STATEMENTS OF EARNINGS (LOSS) (unaudited)
For the periods ended June 30,
($ millions, except per share amounts)
| | | | | | | | | | | | | | | | | | | | | | | | | | | | | | | | | | | | | | | | | | | | | | | | | | | | | |
| | | Three Months Ended | | | Six Months Ended | |
| Notes | | | 2021 | | | | 2020 | | | | 2021 | | | | 2020 | |
| | | | | | | | | | | | | | | | | |
| Revenues | 1 | | | | | | | | | | | | | | | | |
| Gross Sales | | | | 11,110 | | | | 2,195 | | | | 20,633 | | | | 6,210 | |
| Less: Royalties | | | | 533 | | | | 21 | | | | 906 | | | | 75 | |
| | | | 10,577 | | | | 2,174 | | | | 19,727 | | | | 6,135 | |
| Expenses | 1 | | | | | | | | | | | | | | | | |
| Purchased Product | | | | 5,253 | | | | 741 | | | | 9,347 | | | | 2,799 | |
| Transportation and Blending | | | | 1,796 | | | | 646 | | | | 3,581 | | | | 2,558 | |
| Operating | | | | 1,144 | | | | 435 | | | | 2,278 | | | | 989 | |
| (Gain) Loss on Risk Management | 26 | | | 600 | | | | 179 | | | | 794 | | | | 230 | |
| Depreciation, Depletion and Amortization | 9,13,14 | | | 1,036 | | | | 580 | | | | 2,081 | | | | 1,523 | |
| Exploration Expense | 12 | | | 4 | | | | 4 | | | | 10 | | | | 7 | |
| General and Administrative | 5 | | | 170 | | | | 96 | | | | 333 | | | | 73 | |
| Finance Costs | 6 | | | 232 | | | | 139 | | | | 476 | | | | 246 | |
| Interest Income | | | | (3) | | | | (1) | | | | (7) | | | | (2) | |
| Integration Costs | 4 | | | 34 | | | | — | | | | 257 | | | | — | |
| Foreign Exchange (Gain) Loss, Net | 7 | | | (172) | | | | (310) | | | | (289) | | | | 327 | |
| Re-measurement of Contingent Payment | 17 | | | 249 | | | | 64 | | | | 436 | | | | (66) | |
| (Gain) Loss on Divestiture of Assets | 8 | | | (60) | | | | — | | | | (72) | | | | 1 | |
| Other (Income) Loss, Net | | | | (29) | | | | (32) | | | | (101) | | | | (38) | |
| Share of (Income) Loss From Equity-Accounted Affiliates | 15 | | | (13) | | | | — | | | | (27) | | | | — | |
| Earnings (Loss) Before Income Tax | | | | 336 | | | | (367) | | | | 630 | | | | (2,512) | |
| Income Tax Expense (Recovery) | 10 | | | 112 | | | | (132) | | | | 186 | | | | (480) | |
| Net Earnings (Loss) | | | | 224 | | | | (235) | | | | 444 | | | | (2,032) | |
| | | | | | | | | | | | | | | | | |
Net Earnings (Loss) Per Share ($) | 11 | | | | | | | | | | | | | | | | |
| Basic and Diluted | | | | 0.11 | | | | (0.19) | | | | 0.21 | | | | (1.65) | |
| | | | | | | | | | | | | | | | | |
| | | | | | | | | | | | | | | | | |
See accompanying Notes to Consolidated Financial Statements (unaudited).
| | | | | |
| Cenovus Energy Inc. – Q2 2021 Interim Consolidated Financial Statements | 3 |
CONSOLIDATED STATEMENTS OF COMPREHENSIVE INCOME (LOSS) (unaudited)
For the periods ended June 30,
($ millions)
| | | | | | | | | | | | | | | | | | | | | | | | | | | | | | | | | | | | | | | | | | | | | | | | | | | | | |
| | | Three Months Ended | | | Six Months Ended | |
| Notes | | | 2021 | | | | 2020 | | | | 2021 | | | | 2020 | |
| | | | | | | | | | | | | | | | | |
| Net Earnings (Loss) | | | | 224 | | | | (235) | | | | 444 | | | | (2,032) | |
| Other Comprehensive Income (Loss), Net of Tax | 23 | | | | | | | | | | | | | | | | |
| Items That Will not be Reclassified to Profit or Loss: | | | | | | | | | | | | | | | | | |
Actuarial Gain (Loss) Relating to Pension and Other Post-Retirement Benefits | | | | 6 | | | | (14) | | | | 22 | | | | (12) | |
Change in the Fair Value of Equity Instruments at FVOCI (1) | | | | (1) | | | | (1) | | | | (1) | | | | 1 | |
| Items That may be Reclassified to Profit or Loss: | | | | | | | | | | | | | | | | | |
| Foreign Currency Translation Adjustment | | | | (178) | | | | (176) | | | | (311) | | | | 223 | |
| Total Other Comprehensive Income (Loss), Net of Tax | | | | (173) | | | | (191) | | | | (290) | | | | 212 | |
| Comprehensive Income (Loss) | | | | 51 | | | | (426) | | | | 154 | | | | (1,820) | |
| | | | | | | | | | | | | | | | | |
(1)Fair value through other comprehensive income (loss) (“FVOCI”).
See accompanying Notes to Consolidated Financial Statements (unaudited).
| | | | | |
| Cenovus Energy Inc. – Q2 2021 Interim Consolidated Financial Statements | 4 |
CONSOLIDATED BALANCE SHEETS (unaudited)
As at
($ millions)
| | | | | | | | | | | | | | | | | | | | | | | | | | |
| Notes | | June 30,
2021 | | | December 31, 2020 | |
| | | | | | | | |
| Assets | | | | | | | | |
| Current Assets | | | | | | | | |
| Cash and Cash Equivalents | | | 1,055 | | | | 378 | |
| Accounts Receivable and Accrued Revenues | | | 3,632 | | | | 1,488 | |
| Income Tax Receivable | | | 7 | | | | 21 | |
| Inventories | | | 3,211 | | | | 1,089 | |
| Total Current Assets | | | 7,905 | | | | 2,976 | |
| Restricted Cash | | | 170 | | | | — | |
| Exploration and Evaluation Assets, Net | 1,12 | | 639 | | | | 623 | |
| Property, Plant and Equipment, Net | 1,13 | | 37,900 | | | | 25,411 | |
| Right-of-Use Assets, Net | 1,14 | | 2,160 | | | | 1,139 | |
| Income Tax Receivable | | | 202 | | | | — | |
| Investment in Equity-Accounted Affiliates | 15 | | 505 | | | | 97 | |
| Other Assets | 16 | | 463 | | | | 216 | |
| Deferred Income Taxes | | | 107 | | | | 36 | |
| Goodwill | 1 | | 2,984 | | | | 2,272 | |
| Total Assets | | | 53,035 | | | | 32,770 | |
| | | | | | | | |
| Liabilities and Shareholders’ Equity | | | | | | | | |
| Current Liabilities | | | | | | | | |
| Accounts Payable and Accrued Liabilities | | | 5,188 | | | | 2,018 | |
| Short-Term Borrowings | 18 | | 65 | | | | 121 | |
| Current Portion of Long-Term Debt | 18 | | 632 | | | | — | |
| Lease Liabilities | 19 | | 280 | | | | 184 | |
| Contingent Payment | 17 | | 376 | | | | 36 | |
| Income Tax Payable | | | 55 | | | | — | |
| Total Current Liabilities | | | 6,596 | | | | 2,359 | |
| Long-Term Debt | 18 | | 12,748 | | | | 7,441 | |
| Lease Liabilities | 19 | | 2,807 | | | | 1,573 | |
| Contingent Payment | 17 | | — | | | | 27 | |
| Decommissioning Liabilities | 20 | | 3,859 | | | | 1,248 | |
| Other Liabilities | 21 | | 932 | | | | 181 | |
| Deferred Income Taxes | | | 2,453 | | | | 3,234 | |
| Total Liabilities | | | 29,395 | | | | 16,063 | |
| Shareholders’ Equity | | | 23,629 | | | | 16,707 | |
| Non-Controlling Interest | | | 11 | | | | — | |
| Total Liabilities and Shareholders’ Equity | | | 53,035 | | | | 32,770 | |
| | | | | | | | |
| Commitments and Contingencies | 29 | | | | | | | |
| | | | | | | | |
See accompanying Notes to Consolidated Financial Statements (unaudited).
| | | | | |
| Cenovus Energy Inc. – Q2 2021 Interim Consolidated Financial Statements | 5 |
CONSOLIDATED STATEMENTS OF EQUITY (unaudited)
($ millions)
| | | | | | | | | | | | | | | | | | | | | | | | | | | | | | | | | | | | | | | | | | | | | | | | | | | | | | | | | | | | | | | | | | | | | | | | | | | | | | | | | | | | | | | | | | | | | | | |
| Shareholders' Equity | | | | | |
| Common Shares | | Preferred Shares | | Warrants | | Paid in Surplus | | Retained Earnings | | AOCI (1) | | | Total | | | Non-Controlling Interest |
| (Note 22) | | (Note 22) | | (Note 22) | | | | | | | | | | (Note 23) | | | | | | (Note 4) |
| | | | | | | | | | | | | | | | | | | | | | | | | | | | | | | |
| As at December 31, 2019 | | 11,040 | | | | — | | | | — | | | | 4,377 | | | | 2,957 | | | | 827 | | | | 19,201 | | | | — | |
| Net Earnings (Loss) | | — | | | | — | | | | — | | | | — | | | | (2,032) | | | | — | | | | (2,032) | | | | — | |
Other Comprehensive Income
(Loss) | | — | | | | — | | | | — | | | | — | | | | — | | | | 212 | | | | 212 | | | | — | |
| Total Comprehensive Income (Loss) | | — | | | | — | | | | — | | | | — | | | | (2,032) | | | | 212 | | | | (1,820) | | | | — | |
Stock-Based Compensation
Expense | | — | | | | — | | | | — | | | | 7 | | | | — | | | | — | | | | 7 | | | | — | |
| Dividends on Common Shares | | — | | | | — | | | | — | | | | — | | | | (77) | | | | — | | | | (77) | | | | — | |
| As at June 30, 2020 | | 11,040 | | | | — | | | | — | | | | 4,384 | | | | 848 | | | | 1,039 | | | | 17,311 | | | | — | |
| | | | | | | | | | | | | | | | | | | | | | | | | | | | | | | |
| As at December 31, 2020 | | 11,040 | | | | — | | | | — | | | | 4,391 | | | | 501 | | | | 775 | | | | 16,707 | | | | — | |
| Net Earnings (Loss) | | — | | | | — | | | | — | | | | — | | | | 444 | | | | — | | | | 444 | | | | — | |
Other Comprehensive Income
(Loss) | | — | | | | — | | | | — | | | | — | | | | — | | | | (290) | | | | (290) | | | | — | |
| Total Comprehensive Income (Loss) | | — | | | | — | | | | — | | | | — | | | | 444 | | | | (290) | | | | 154 | | | | — | |
| Common Shares Issued (Note 4) | | 6,111 | | | | — | | | | — | | | | — | | | | — | | | | — | | | | 6,111 | | | | — | |
| Preferred Shares Issued (Note 4) | | — | | | | 519 | | | | — | | | | — | | | | — | | | | — | | | | 519 | | | | — | |
| Warrants Issued (Note 4) | | — | | | | — | | | | 216 | | | | — | | | | — | | | | — | | | | 216 | | | | — | |
| Warrants Exercised | | 2 | | | | — | | | | — | | | | — | | | | — | | | | — | | | | 2 | | | | — | |
| Stock-Based Compensation Expense | | — | | | | — | | | | — | | | | 8 | | | | — | | | | — | | | | 8 | | | | — | |
| Dividends on Common Shares | | — | | | | — | | | | — | | | | — | | | | (71) | | | | — | | | | (71) | | | | — | |
| Dividends on Preferred Shares | | — | | | | — | | | | — | | | | — | | | | (17) | | | | — | | | | (17) | | | | — | |
| Non-Controlling Interest | | — | | | | — | | | | — | | | | — | | | | — | | | | — | | | | — | | | | 11 | |
| As at June 30, 2021 | | 17,153 | | | | 519 | | | | 216 | | | | 4,399 | | | | 857 | | | | 485 | | | | 23,629 | | | | 11 | |
| | | | | | | | | | | | | | | | | | | | | | | | | | | | | | | |
(1) Accumulated other comprehensive income (loss) (“AOCI”).
See accompanying Notes to Consolidated Financial Statements (unaudited).
| | | | | |
| Cenovus Energy Inc. – Q2 2021 Interim Consolidated Financial Statements | 6 |
CONSOLIDATED STATEMENTS OF CASH FLOWS (unaudited)
For the periods ended June 30,
($ millions)
| | | | | | | | | | | | | | | | | | | | | | | | | | | | | | | | | | | | | | | | | | | | | | | | | | | | | | | | |
| | | | Three Months Ended | | | Six Months Ended | |
| | Notes | | | 2021 | | | | 2020 | | | | 2021 | | | | 2020 | |
| | | | | | | | | | | | | | | | | | |
| Operating Activities | | | | | | | | | | | | | | | | | | |
| Net Earnings (Loss) | | | | | 224 | | | | (235) | | | | 444 | | | | (2,032) | |
| Depreciation, Depletion and Amortization | 9,13,14 | | | 1,036 | | | | 580 | | | | 2,081 | | | | 1,523 | |
| Exploration Expense | 12 | | | 1 | | | | 4 | | | | 11 | | | | 7 | |
| Inventory Write-Down (Reversal) | | | | | — | | | | (39) | | | | 16 | | | | 549 | |
| Deferred Income Tax Expense (Recovery) | | 10 | | | 63 | | | | (131) | | | | 90 | | | | (479) | |
| Unrealized (Gain) Loss on Risk Management | | 26 | | | 401 | | | | 120 | | | | 253 | | | | 142 | |
| Unrealized Foreign Exchange (Gain) Loss | | 7 | | | (192) | | | | (288) | | | | (331) | | | | 369 | |
| Re-measurement of Contingent Payment | | 17 | | | 249 | | | | 64 | | | | 436 | | | | (66) | |
| (Gain) Loss on Divestiture of Assets | | 8 | | | (60) | | | | — | | | | (72) | | | | 1 | |
| Unwinding of Discount on Decommissioning Liabilities | 20 | | | 46 | | | | 14 | | | | 94 | | | | 29 | |
| Realized Inventory Write-Down | | | | | (16) | | | | (529) | | | | (31) | | | | (554) | |
| Realized Foreign Exchange (Gain) Loss on Non-Operating Items | | | — | | | | (22) | | | | (2) | | | | (3) | |
| (Income) Loss From Equity-Accounted Affiliates | | 15 | | | (13) | | | | — | | | | (27) | | | | — | |
| Distribution Received From Equity-Accounted Affiliates | 15 | | | 61 | | | | — | | | | 89 | | | | — | |
| Other | | | | | 17 | | | | (7) | | | | (93) | | | | (109) | |
| Settlement of Decommissioning Liabilities | | | | | (18) | | | | (2) | | | | (29) | | | | (33) | |
| Net Change in Non-Cash Working Capital | | 28 | | | (430) | | | | (363) | | | | (1,332) | | | | (53) | |
| Cash From (Used in) Operating Activities | | | | | 1,369 | | | | (834) | | | | 1,597 | | | | (709) | |
| | | | | | | | | | | | | | | | | | |
| Investing Activities | | | | | | | | | | | | | | | | | | |
| Capital Expenditures – Exploration and Evaluation Assets | 12 | | | (3) | | | | (6) | | | | (21) | | | | (41) | |
| Capital Expenditures – Property, Plant and Equipment | 13 | | | (531) | | | | (141) | | | | (1,060) | | | | (416) | |
| Proceeds From Divestitures | | 8 | | | 100 | | | | 1 | | | | 105 | | | | 1 | |
| Cash Acquired Through Business Combination | | 4 | | | — | | | | — | | | | 735 | | | | — | |
| Net Change in Investments and Other | | | | | (31) | | | | — | | | | (31) | | | | (4) | |
| Net Change in Non-Cash Working Capital | | 28 | | | 41 | | | | (60) | | | | 52 | | | | (67) | |
| Cash From (Used in) Investing Activities | | | | | (424) | | | | (206) | | | | (220) | | | | (527) | |
| | | | | | | | | | | | | | | | | | |
| Net Cash Provided (Used) Before Financing Activities | | | | | 945 | | | | (1,040) | | | | 1,377 | | | | (1,236) | |
| | | | | | | | | | | | | | | | | | |
| Financing Activities | | 28 | | | | | | | | | | | | | | | | |
| Issuance (Repayment) of Short-Term Borrowings | | | | | (196) | | | | (300) | | | | (89) | | | | 292 | |
| (Repayment) of Long-Term Debt | | | | | — | | | | — | | | | — | | | | (112) | |
| Net Issuance (Repayment) of Revolving Long-Term Debt | | | | (400) | | | | 1,397 | | | | (350) | | | | 1,224 | |
| Principal Repayment of Leases | | 19 | | | (77) | | | | (56) | | | | (152) | | | | (104) | |
| Proceeds From Exercise of Warrants | | | | | — | | | | — | | | | 1 | | | | — | |
| Dividends Paid on Common Shares | | 11 | | | (36) | | | | — | | | | (71) | | | | (77) | |
| Dividends Paid on Preferred Shares | | 11 | | | (8) | | | | — | | | | (17) | | | | — | |
| | | | | | | | | | | | | | | | | | |
| Cash From (Used in) Financing Activities | | | | | (717) | | | | 1,041 | | | | (678) | | | | 1,223 | |
| | | | | | | | | | | | | | | | | | |
Effect of Foreign Exchange on Cash and Cash Equivalents | | | | | (46) | | | | (9) | | | | (22) | | | | (21) | |
| Increase (Decrease) in Cash and Cash Equivalents | | | | | 182 | | | | (8) | | | | 677 | | | | (34) | |
| Cash and Cash Equivalents, Beginning of Period | | | | | 873 | | | | 160 | | | | 378 | | | | 186 | |
| Cash and Cash Equivalents, End of Period | | | | | 1,055 | | | | 152 | | | | 1,055 | | | | 152 | |
| | | | | | | | | | | | | | | | | | |
See accompanying Notes to Consolidated Financial Statements (unaudited).
| | | | | |
| Cenovus Energy Inc. – Q2 2021 Interim Consolidated Financial Statements | 7 |
NOTES TO CONSOLIDATED FINANCIAL STATEMENTS (unaudited)
All amounts in $ millions, unless otherwise indicated
For the periods ended June 30, 2021
| | |
| 1. DESCRIPTION OF BUSINESS AND SEGMENTED DISCLOSURES |
Cenovus Energy Inc. and its subsidiaries, (together “Cenovus” or the “Company”) is an integrated energy company with crude oil and natural gas production operations in Canada and the Asia Pacific region, and upgrading, refining and marketing operations in Canada and the United States (“U.S.”).
Cenovus is incorporated under the Canada Business Corporations Act and its common shares and warrants are listed on the Toronto (“TSX”) and New York (“NYSE”) stock exchanges. Cenovus's cumulative redeemable preferred shares series 1, 2, 3, 5 and 7 are listed on the TSX. The executive and registered office is located at 4100, 225 6 Avenue S.W., Calgary, Alberta, Canada, T2P 1N2. Information on the Company’s basis of preparation for these interim Consolidated Financial Statements is found in Note 2.
On January 1, 2021, Cenovus and Husky Energy Inc. (“Husky”) closed the transaction to combine the two companies through a plan of arrangement (the "Arrangement”) (see Note 4). The transaction includes Husky’s oil sands, heavy oil and offshore assets and retail segment. The transaction also includes extensive transportation, storage and logistics and downstream infrastructure. Comparative figures include Cenovus results prior to the closing of the Arrangement on January 1, 2021, and does not reflect any historical data from Husky.
Management has determined the operating segments based on information regularly reviewed for the purposes of decision making, allocating resources and assessing operational performance by Cenovus’s chief operating decision makers. The Company evaluates the financial performance of its operating segments primarily based on operating margin. The Company operates through the following reportable segments:
Upstream Segments
•Oil Sands, includes the development and production of bitumen and heavy oil in northern Alberta and Saskatchewan. Cenovus’s oil sands assets include Foster Creek, Christina Lake, Sunrise (jointly owned with BP Canada Energy Group ULC (“BP Canada”) and operated by Cenovus) and Tucker oil sands projects, as well as Lloydminster Thermal and Cold and Enhanced Oil Recovery assets. Cenovus jointly owns and operates pipeline gathering systems and terminals through the equity-accounted investment in Husky Midstream Limited Partnership (“HMLP”). The sale and transportation of Cenovus’s production and third-party commodity trading volumes are managed and marketed through access to capacity on third-party pipelines and storage facilities in both Canada and the U.S. to optimize product mix, delivery points, transportation commitments and customer diversification.
•Conventional, includes assets rich in natural gas liquids (“NGLs”) and natural gas within the Elmworth-Wapiti, Kaybob‑Edson, Clearwater and Rainbow Lake operating areas in Alberta and British Columbia and interests in numerous natural gas processing facilities. Cenovus’s NGLs and natural gas production is marketed and transported with other third-party commodity trading volumes through access to capacity on third-party pipelines, export terminals and storage facilities which provides flexibility for market access to optimize product mix, delivery points, transportation commitments and customer diversification.
•Offshore, includes offshore operations, exploration and development activities in China and the east coast of Canada, as well as the equity-accounted investment in the Husky-CNOOC Madura Ltd. (“HCML”) joint venture in Indonesia.
Downstream Segments
•Canadian Manufacturing, includes the owned and operated Lloydminster upgrading and asphalt refining complex which upgrades heavy oil into synthetic crude oil, diesel fuel and asphalt. Cenovus seeks to maximize the value per barrel from its heavy oil production through its integrated network of assets. In addition, Cenovus owns and operates the Bruderheim crude-by-rail terminal and two ethanol plants. Cenovus also markets its production and third-party commodity trading volumes of synthetic crude oil, asphalt and ancillary products.
•U.S. Manufacturing, includes the refining of crude oil to produce diesel fuel, gasoline, jet fuel, asphalt and other products at the wholly-owned Lima Refinery and Superior Refinery, the Wood River and Borger refineries (jointly owned with operator Phillips 66) and the Toledo Refinery (jointly owned with operator BP Products North America Inc. (“BP”)). Cenovus also markets its own and third-party volumes of refined petroleum products including gasoline, diesel and jet fuel.
•Retail, includes the marketing of its own and third-party volumes of refined petroleum products, including gasoline and diesel, through retail, commercial and bulk petroleum outlets, as well as wholesale channels in Canada.
Corporate and Eliminations, primarily includes Cenovus-wide costs for general and administrative, financing activities, foreign exchange gain and loss and gain and loss on risk management on corporate related derivative instruments. Eliminations include adjustments for internal usage of natural gas production between segments, transloading services provided to the Oil Sands segment by the Company’s crude-by-rail terminal and crude oil production used as feedstock by the Canadian Manufacturing and U.S. Manufacturing segments. Eliminations are recorded at transfer prices based on current market prices.
| | | | | |
| Cenovus Energy Inc. – Q2 2021 Interim Consolidated Financial Statements | 8 |
NOTES TO CONSOLIDATED FINANCIAL STATEMENTS (unaudited)
All amounts in $ millions, unless otherwise indicated
For the periods ended June 30, 2021
To conform to the presentation adopted for the current period’s operating segments, the following comparatives prior to January 1, 2021, have been reclassified:
•The Company’s market optimization activities, previously reported in the Refining and Marketing segment, have been reclassified to the Oil Sands and Conventional segments.
•The Bruderheim crude-by-rail terminal results, previously reported under the Refining and Marketing segment, have been reclassified to the Canadian Manufacturing segment.
•The refining activities in the U.S. with operator Phillips 66, previously reported in the Refining and Marketing segment, have been reclassified to the U.S. Manufacturing segment.
•The Company’s unrealized gain and loss on risk management, previously reported in the Corporate and Eliminations segment, have been reclassified to the reportable segment to which the derivative instrument relates.
The following tabular financial information presents the segmented information first by segment, then by product and geographic location. Prior year comparatives have been represented (see Note 30).
A) Results of Operations – Segment and Operational Information
i) Results for the Three Months Ended June 30
| | | | | | | | | | | | | | | | | | | | | | | | | | | | | | | | | | | | | | | | | | | | | | | | | | | | | | | | | | | | | | | | | | | | | | | |
| Upstream | |
| Oil Sands | | | Conventional | | | Offshore | |
| For the three months ended June 30, | 2021 | | | 2020 | | | 2021 | | | 2020 | | | 2021 | | | 2020 | |
| Revenues | | | | | | | | | | | | | | | | | | | | | | | |
| Gross Sales | | 5,015 | | | | 1,247 | | | | 626 | | | | 182 | | | | 427 | | | | — | |
Less: Royalties (1) | | 469 | | | | 20 | | | | 39 | | | | 1 | | | | 25 | | | | — | |
| | 4,546 | | | | 1,227 | | | | 587 | | | | 181 | | | | 402 | | | | — | |
| Expenses | | | | | | | | | | | | | | | | | | | | | | | |
Purchased Product (1) | | 574 | | | | 166 | | | | 287 | | | | 47 | | | | — | | | | — | |
Transportation and Blending (1) | | 1,780 | | | | 632 | | | | 19 | | | | 19 | | | | 3 | | | | — | |
Operating (1) | | 592 | | | | 233 | | | | 140 | | | | 83 | | | | 59 | | | | — | |
| Realized (Gain) Loss on Risk Management | | 189 | | | | 66 | | | | (1) | | | | — | | | | — | | | | — | |
| Operating Margin | | 1,411 | | | | 130 | | | | 142 | | | | 32 | | | | 340 | | | | — | |
Unrealized (Gain) Loss on Risk Management | | 374 | | | | 121 | | | | 2 | | | | — | | | | — | | | | — | |
| Depreciation, Depletion and Amortization | | 627 | | | | 395 | | | | 102 | | | | 80 | | | | 117 | | | | — | |
| Exploration Expense | | 2 | | | | 4 | | | | 1 | | | | — | | | | 1 | | | | — | |
Share of (Income) Loss From Equity-
Accounted Affiliates | | (5) | | | | — | | | | — | | | | — | | | | (12) | | | | — | |
| Segment Income (Loss) | | 413 | | | | (390) | | | | 37 | | | | (48) | | | | 234 | | | | — | |
(1)Inventory write-downs prior to January 1, 2021, have been reclassified to royalties, purchased product, transportation and blending or operating expenses to conform with the current presentation of inventory write-downs.
| | | | | |
| Cenovus Energy Inc. – Q2 2021 Interim Consolidated Financial Statements | 9 |
NOTES TO CONSOLIDATED FINANCIAL STATEMENTS (unaudited)
All amounts in $ millions, unless otherwise indicated
For the periods ended June 30, 2021
| | | | | | | | | | | | | | | | | | | | | | | | | | | | | | | | | | | | | | | | | | | | | | | | | | | | | | | | | | | | | | | | | | | | | | | |
| Downstream | |
| Canadian Manufacturing | | | U.S. Manufacturing | | | Retail | |
| For the three months ended June 30, | 2021 | | | 2020 | | | 2021 | | | 2020 | | | 2021 | | | 2020 | |
| Revenues | | | | | | | | | | | | | | | | | | | | | | | |
| Gross Sales | | 1,088 | | | | 16 | | | | 4,729 | | | | 841 | | | | 501 | | | | — | |
Less: Royalties (1) | | — | | | | — | | | | — | | | | — | | | | — | | | | — | |
| | 1,088 | | | | 16 | | | | 4,729 | | | | 841 | | | | 501 | | | | — | |
| Expenses | | | | | | | | | | | | | | | | | | | | | | — | |
Purchased Product (1) | | 807 | | | | — | | | | 4,229 | | | | 549 | | | | 466 | | | | — | |
Transportation and Blending (1) | | — | | | | — | | | | — | | | | — | | | | — | | | | — | |
Operating (1) | | 92 | | | | 10 | | | | 394 | | | | 176 | | | | 29 | | | | — | |
| Realized (Gain) Loss on Risk Management | | — | | | | — | | | | 10 | | | | (7) | | | | — | | | | — | |
| Operating Margin | | 189 | | | | 6 | | | | 96 | | | | 123 | | | | 6 | | | | — | |
Unrealized (Gain) Loss on Risk Management | | — | | | | — | | | | 23 | | | | 2 | | | | — | | | | — | |
| Depreciation, Depletion and Amortization | | 43 | | | | 2 | | | | 103 | | | | 71 | | | | 13 | | | | — | |
| Exploration Expense | | — | | | | — | | | | — | | | | — | | | | — | | | | — | |
Share of (Income) Loss From Equity-
Accounted Affiliates | | — | | | | — | | | | — | | | | — | | | | — | | | | — | |
| Segment Income (Loss) | | 146 | | | | 4 | | | | (30) | | | | 50 | | | | (7) | | | | — | |
| | | | | | | | | | | | | | | | | | | | | | | |
| | | | | | | | | | | | | | | | | | | | | | | | | | | | | | | | | | | | | | | | | | | | | | | | | | | | | | | | | | | |
| | | | | Corporate and Eliminations | | | Consolidated | |
| For the three months ended June 30, | | | | | 2021 | | | 2020 | | | 2021 | | | 2020 | |
| Revenues | | | | | | | | | | | | | | | | | | | |
| Gross Sales | | | | | | (1,276) | | | | (91) | | | | 11,110 | | | | 2,195 | |
Less: Royalties (1) | | | | | | — | | | | — | | | | 533 | | | | 21 | |
| | | | | | (1,276) | | | | (91) | | | | 10,577 | | | | 2,174 | |
| Expenses | | | | | | | | | | | | | | | | | | | |
Purchased Product (1) | | | | | | (1,110) | | | | (21) | | | | 5,253 | | | | 741 | |
Transportation and Blending (1) | | | | | | (6) | | | | (5) | | | | 1,796 | | | | 646 | |
Operating (1) | | | | | | (162) | | | | (67) | | | | 1,144 | | | | 435 | |
| Realized (Gain) Loss on Risk Management | | | | | | 1 | | | | — | | | | 199 | | | | 59 | |
Unrealized (Gain) Loss on Risk Management | | | | | | 2 | | | | (3) | | | | 401 | | | | 120 | |
| Depreciation, Depletion and Amortization | | | | | | 31 | | | | 32 | | | | 1,036 | | | | 580 | |
| Exploration Expense | | | | | | — | | | | — | | | | 4 | | | | 4 | |
Share of (Income) Loss From Equity-
Accounted Affiliates | | | | | | 4 | | | | — | | | | (13) | | | | — | |
| Segment Income (Loss) | | | | | | (36) | | | | (27) | | | | 757 | | | | (411) | |
| General and Administrative | | | | | | 170 | | | | 96 | | | | 170 | | | | 96 | |
| Finance Costs | | | | | | 232 | | | | 139 | | | | 232 | | | | 139 | |
| Interest Income | | | | | | (3) | | | | (1) | | | | (3) | | | | (1) | |
| Integration Costs | | | | | | 34 | | | | — | | | | 34 | | | | — | |
| Foreign Exchange (Gain) Loss, Net | | | | | | (172) | | | | (310) | | | | (172) | | | | (310) | |
| Re-measurement of Contingent Payment | | | | | | 249 | | | | 64 | | | | 249 | | | | 64 | |
| (Gain) Loss on Divestiture of Assets | | | | | | (60) | | | | — | | | | (60) | | | | — | |
| Other (Income) Loss, Net | | | | | | (29) | | | | (32) | | | | (29) | | | | (32) | |
| | | | | | 421 | | | | (44) | | | | 421 | | | | (44) | |
| Earnings (Loss) Before Income Tax | | | | | | | | | | | | | | 336 | | | | (367) | |
| Income Tax Expense (Recovery) | | | | | | | | | | | | | | 112 | | | | (132) | |
| Net Earnings (Loss) | | | | | | | | | | | | | | 224 | | | | (235) | |
(1)Inventory write-downs prior to January 1, 2021, have been reclassified to royalties, purchased product, transportation and blending or operating expenses to conform with the current presentation of inventory write-downs.
| | | | | |
| Cenovus Energy Inc. – Q2 2021 Interim Consolidated Financial Statements | 10 |
NOTES TO CONSOLIDATED FINANCIAL STATEMENTS (unaudited)
All amounts in $ millions, unless otherwise indicated
For the periods ended June 30, 2021
ii) Results for the Six Months Ended June 30
| | | | | | | | | | | | | | | | | | | | | | | | | | | | | | | | | | | | | | | | | | | | | | | | | | | | | | | | | | | | | | | | | | | | | | | |
| Upstream | |
| Oil Sands | | | Conventional | | | Offshore | |
| For the six months ended June 30, | 2021 | | | 2020 | | | 2021 | | | 2020 | | | 2021 | | | 2020 | |
| Revenues | | | | | | | | | | | | | | | | | | | | | | | |
| Gross Sales | | 9,790 | | | | 3,681 | | | | 1,402 | | | | 404 | | | | 858 | | | | — | |
Less: Royalties (1) | | 793 | | | | 71 | | | | 63 | | | | 4 | | | | 50 | | | | — | |
| | 8,997 | | | | 3,610 | | | | 1,339 | | | | 400 | | | | 808 | | | | — | |
| Expenses | | | | | | | | | | | | | | | | | | | | | | | |
Purchased Product (1) | | 1,292 | | | | 571 | | | | 668 | | | | 108 | | | | — | | | | — | |
Transportation and Blending (1) | | 3,558 | | | | 2,537 | | | | 37 | | | | 42 | | | | 7 | | | | — | |
Operating (1) | | 1,177 | | | | 553 | | | | 282 | | | | 167 | | | | 117 | | | | — | |
| Realized (Gain) Loss on Risk Management | | 418 | | | | 91 | | | | — | | | | — | | | | — | | | | — | |
| Operating Margin | | 2,552 | | | | (142) | | | | 352 | | | | 83 | | | | 684 | | | | — | |
Unrealized (Gain) Loss on Risk Management | | 233 | | | | 143 | | | | 1 | | | | — | | | | — | | | | — | |
| Depreciation, Depletion and Amortization | | 1,239 | | | | 806 | | | | 210 | | | | 488 | | | | 242 | | | | — | |
| Exploration Expense | | 13 | | | | 7 | | | | (3) | | | | — | | | | — | | | | — | |
Share of (Income) Loss From Equity-
Accounted Affiliates | | (5) | | | | — | | | | — | | | | — | | | | (24) | | | | — | |
| Segment Income (Loss) | | 1,072 | | | | (1,098) | | | | 144 | | | | (405) | | | | 466 | | | | — | |
| | | | | | | | | | | | | | | | | | | | | | | |
| | | | | | | | | | | | | | | | | | | | | | | | | | | | | | | | | | | | | | | | | | | | | | | | | | | | | | | | | | | | | | | | | | | | | | | |
| Downstream | |
| Canadian Manufacturing | | | U.S. Manufacturing | | | Retail | |
| For the six months ended June 30, | 2021 | | | 2020 | | | 2021 | | | 2020 | | | 2021 | | | 2020 | |
| Revenues | | | | | | | | | | | | | | | | | | | | | | | |
| Gross Sales | | 1,894 | | | | 43 | | | | 8,166 | | | | 2,396 | | | | 948 | | | | — | |
Less: Royalties (1) | | — | | | | — | | | | — | | | | — | | | | — | | | | — | |
| | 1,894 | | | | 43 | | | | 8,166 | | | | 2,396 | | | | 948 | | | | — | |
| Expenses | | | | | | | | | | | | | | | | | | | | | | — | |
Purchased Product (1) | | 1,438 | | | | — | | | | 7,149 | | | | 2,280 | | | | 883 | | | | — | |
Transportation and Blending (1) | | — | | | | — | | | | — | | | | — | | | | — | | | | — | |
Operating (1) | | 185 | | | | 21 | | | | 799 | | | | 385 | | | | 48 | | | | — | |
| Realized (Gain) Loss on Risk Management | | — | | | | — | | | | 31 | | | | (8) | | | | — | | | | — | |
| Operating Margin | | 271 | | | | 22 | | | | 187 | | | | (261) | | | | 17 | | | | — | |
Unrealized (Gain) Loss on Risk Management | | — | | | | — | | | | 33 | | | | 2 | | | | — | | | | — | |
| Depreciation, Depletion and Amortization | | 86 | | | | 4 | | | | 217 | | | | 148 | | | | 25 | | | | — | |
| Exploration Expense | | — | | | | — | | | | — | | | | — | | | | — | | | | — | |
Share of (Income) Loss From Equity-
Accounted Affiliates | | — | | | | — | | | | — | | | | — | | | | — | | | | — | |
| Segment Income (Loss) | | 185 | | | | 18 | | | | (63) | | | | (411) | | | | (8) | | | | — | |
(1)Inventory write-downs prior to January 1, 2021, have been reclassified to royalties, purchased product, transportation and blending or operating expenses to conform with the current presentation of inventory write-downs.
| | | | | |
| Cenovus Energy Inc. – Q2 2021 Interim Consolidated Financial Statements | 11 |
NOTES TO CONSOLIDATED FINANCIAL STATEMENTS (unaudited)
All amounts in $ millions, unless otherwise indicated
For the periods ended June 30, 2021
| | | | | | | | | | | | | | | | | | | | | | | | | | | | | | | | | | | | | | | | | | | | | | | | | | | | | | | | | | | | | | | | | | | | | | | |
| | | | | | | | | Corporate and Eliminations | | | Consolidated | |
| For the six months ended June 30, | | | | | | | | | 2021 | | | 2020 | | | 2021 | | | 2020 | |
| Revenues | | | | | | | | | | | | | | | | | | | | | | | |
| Gross Sales | | | | | | | | | | (2,425) | | | | (314) | | | | 20,633 | | | | 6,210 | |
Less: Royalties (1) | | | | | | | | | | — | | | | — | | | | 906 | | | | 75 | |
| | | | | | | | | | (2,425) | | | | (314) | | | | 19,727 | | | | 6,135 | |
| Expenses | | | | | | | | | | | | | | | | | | | | | | | |
Purchased Product (1) | | | | | | | | | | (2,083) | | | | (160) | | | | 9,347 | | | | 2,799 | |
Transportation and Blending (1) | | | | | | | | | | (21) | | | | (21) | | | | 3,581 | | | | 2,558 | |
Operating (1) | | | | | | | | | | (330) | | | | (137) | | | | 2,278 | | | | 989 | |
| Realized (Gain) Loss on Risk Management | | | | | | | | | | 92 | | | | 5 | | | | 541 | | | | 88 | |
Unrealized (Gain) Loss on Risk Management | | | | | | | | | | (14) | | | | (3) | | | | 253 | | | | 142 | |
| Depreciation, Depletion and Amortization | | | | | | | | | | 62 | | | | 77 | | | | 2,081 | | | | 1,523 | |
| Exploration Expense | | | | | | | | | | — | | | | — | | | | 10 | | | | 7 | |
Share of (Income) Loss From Equity-
Accounted Affiliates | | | | | | | | | | 2 | | | | — | | | | (27) | | | | — | |
| Segment Income (Loss) | | | | | | | | | | (133) | | | | (75) | | | | 1,663 | | | | (1,971) | |
| General and Administrative | | | | | | | | | | 333 | | | | 73 | | | | 333 | | | | 73 | |
| Finance Costs | | | | | | | | | | 476 | | | | 246 | | | | 476 | | | | 246 | |
| Interest Income | | | | | | | | | | (7) | | | | (2) | | | | (7) | | | | (2) | |
| Integration Costs | | | | | | | | | | 257 | | | | — | | | | 257 | | | | — | |
| Foreign Exchange (Gain) Loss, Net | | | | | | | | | | (289) | | | | 327 | | | | (289) | | | | 327 | |
| Re-measurement of Contingent Payment | | | | | | | | | | 436 | | | | (66) | | | | 436 | | | | (66) | |
| (Gain) Loss on Divestiture of Assets | | | | | | | | | | (72) | | | | 1 | | | | (72) | | | | 1 | |
| Other (Income) Loss, Net | | | | | | | | | | (101) | | | | (38) | | | | (101) | | | | (38) | |
| | | | | | | | | | 1,033 | | | | 541 | | | | 1,033 | | | | 541 | |
| Earnings (Loss) Before Income Tax | | | | | | | | | | | | | | | | | | 630 | | | | (2,512) | |
| Income Tax Expense (Recovery) | | | | | | | | | | | | | | | | | | 186 | | | | (480) | |
| Net Earnings (Loss) | | | | | | | | | | | | | | | | | | 444 | | | | (2,032) | |
(1)Inventory write-downs prior to January 1, 2021, have been reclassified to royalties, purchased product, transportation and blending or operating expenses to conform with the current presentation of inventory write-downs.
| | | | | |
| Cenovus Energy Inc. – Q2 2021 Interim Consolidated Financial Statements | 12 |
NOTES TO CONSOLIDATED FINANCIAL STATEMENTS (unaudited)
All amounts in $ millions, unless otherwise indicated
For the periods ended June 30, 2021
B) Revenues by Product (1)
| | | | | | | | | | | | | | | | | | | | | | | | | | | | | | | | | | | | | | | | | | | | | | | |
| Three Months Ended | | | Six Months Ended | |
| For the periods ended June 30, | | 2021 | | | | 2020 | | | | 2021 | | | | 2020 | |
| Upstream | | | | | | | | | | | | | | | |
| Crude Oil | | 4,125 | | | | 1,230 | | | | 8,228 | | | | 3,638 | |
| NGLs | | 549 | | | | 40 | | | | 1,167 | | | | 90 | |
| Natural Gas | | 724 | | | | 125 | | | | 1,500 | | | | 253 | |
| Other | | 137 | | | | 13 | | | | 249 | | | | 29 | |
| Downstream | | | | | | | | | | | | | | | |
| Canadian Manufacturing | | | | | | | | | | | | | | | |
| Synthetic Crude Oil | | 451 | | | | — | | | | 797 | | | | — | |
| Diesel and Distillate | | 91 | | | | — | | | | 176 | | | | — | |
| Asphalt | | 116 | | | | — | | | | 181 | | | | — | |
| Other Products and Services | | 430 | | | | 16 | | | | 740 | | | | 43 | |
| U.S. Manufacturing | | | | | | | | | | | | | | | |
| Gasoline | | 2,535 | | | | 358 | | | | 4,303 | | | | 1,140 | |
| Diesel and Distillate | | 1,547 | | | | 286 | | | | 2,778 | | | | 864 | |
| Other Products | | 647 | | | | 197 | | | | 1,085 | | | | 392 | |
| Retail | | 501 | | | | — | | | | 948 | | | | — | |
| Corporate and Eliminations | | (1,276) | | | | (91) | | | | (2,425) | | | | (314) | |
| Consolidated | | 10,577 | | | | 2,174 | | | | 19,727 | | | | 6,135 | |
(1) The results of the Company’s market optimization activities have been reclassified to revenues, by product, in the Upstream segment.
C) Geographical Information
| | | | | | | | | | | | | | | | | | | | | | | | | | | | | | | | | | | | | | | | | | | | | | | |
| | Revenues | |
| | Three Months Ended | | Six Months Ended | |
| For the periods ended June 30, | | 2021 | | | | 2020 | | | | 2021 | | | | 2020 | |
| Canada | | 5,162 | | | | 1,272 | | | | 10,531 | | | | 3,664 | |
| United States | | 5,124 | | | | 902 | | | | 8,601 | | | | 2,471 | |
| China | | 291 | | | | — | | | | 595 | | | | — | |
| Consolidated | | 10,577 | | | | 2,174 | | | | 19,727 | | | | 6,135 | |
| | | | | | | | | | | | | | | | | | | | | | | | | | | | | | | | | | | |
| | | | | | | | | | | |
| | | | | Non-Current Assets (1) | |
| As at | | | | | June 30,
2021 | | | December 31, 2020 | |
| Canada | | | | | | 35,292 | | | | 26,041 | |
| United States | | | | | | 6,015 | | | | 3,590 | |
| China | | | | | | 2,644 | | | | — | |
| Indonesia | | | | | | 411 | | | | — | |
| Consolidated | | | | | | 44,362 | | | | 29,631 | |
(1)Includes exploration and evaluation (“E&E”) assets, property, plant and equipment (“PP&E”), right-of-use (“ROU”) assets, investment in equity-accounted affiliates, precious metals, intangible assets and goodwill.
| | | | | |
| Cenovus Energy Inc. – Q2 2021 Interim Consolidated Financial Statements | 13 |
NOTES TO CONSOLIDATED FINANCIAL STATEMENTS (unaudited)
All amounts in $ millions, unless otherwise indicated
For the periods ended June 30, 2021
D) Assets by Segment (1)
| | | | | | | | | | | | | | | | | | | | | | | | | | | | | | | | | | | | | | | | | | | | | | | | | | | | | | | | | | | | | | | | | | | | | | | |
| E&E Assets | | | PP&E | | | ROU Assets | |
| As at | June 30,
2021 | | | December 31, 2020 | | | June 30,
2021 | | | December 31, 2020 | | | June 30,
2021 | | | December 31, 2020 | |
| Oil Sands | | 633 | | | | 617 | | | | 24,120 | | | | 19,748 | | | | 785 | | | | 196 | |
| Conventional | | 6 | | | | 6 | | | | 2,178 | | | | 1,758 | | | | 3 | | | | 3 | |
| Offshore | | — | | | | — | | | | 2,718 | | | | — | | | | 166 | | | | — | |
| Canadian Manufacturing | | — | | | | — | | | | 2,396 | | | | 176 | | | | 392 | | | | 392 | |
| U.S. Manufacturing | | — | | | | — | | | | 5,678 | | | | 3,476 | | | | 235 | | | | 114 | |
| Retail | | — | | | | — | | | | 414 | | | | — | | | | 112 | | | | — | |
| Corporate and Eliminations | | — | | | | — | | | | 396 | | | | 253 | | | | 467 | | | | 434 | |
| Consolidated | | 639 | | | | 623 | | | | 37,900 | | | | 25,411 | | | | 2,160 | | | | 1,139 | |
| | | | | | | | | | | | | | | | | | | | | | | | | | | | | | | | | | | | | | | | | | | | | | | | | | | | | | | | | | | | | | |
| | | | | | | | | | | | | | | | | | | | |
| | | | Goodwill | | | Total Assets | |
| As at | | | | | | June 30,
2021 | | | December 31, 2020 | | | June 30,
2021 | | | December 31, 2020 | |
| Oil Sands | | | | | | | 2,984 | | | | 2,272 | | | | 31,109 | | | | 24,641 | |
| Conventional | | | | | | | — | | | | — | | | | 2,961 | | | | 1,978 | |
| Offshore | | | | | | | — | | | | — | | | | 3,500 | | | | — | |
| Canadian Manufacturing | | | | | | | — | | | | — | | | | 3,037 | | | | 578 | |
| U.S. Manufacturing | | | | | | | — | | | | — | | | | 9,212 | | | | 4,363 | |
| Retail | | | | | | | — | | | | — | | | | 652 | | | | — | |
| Corporate and Eliminations | | | | | | | — | | | | — | | | | 2,564 | | | | 1,210 | |
| Consolidated | | | | | | | 2,984 | | | | 2,272 | | | | 53,035 | | | | 32,770 | |
(1) Prior periods have been reclassified to conform with the current period’s operating segments.
E) Capital Expenditures (1) (2)
| | | | | | | | | | | | | | | | | | | | | | | | | | | | | | | | | | | | | | | | | | | | | | | |
| Three Months Ended | | | Six Months Ended | |
| For the periods ended June 30, | | 2021 | | | | 2020 | | | | 2021 | | | | 2020 | |
| Capital Investment | | | | | | | | | | | | | | | |
| Oil Sands | | 201 | | | | 78 | | | | 419 | | | | 272 | |
| Conventional | | 28 | | | | 11 | | | | 94 | | | | 27 | |
| Offshore | | 35 | | | | — | | | | 61 | | | | — | |
| Canadian Manufacturing | | 10 | | | | 7 | | | | 14 | | | | 17 | |
| U.S. Manufacturing | | 237 | | | | 39 | | | | 442 | | | | 90 | |
| Retail | | 5 | | | | — | | | | 6 | | | | — | |
| Corporate and Eliminations | | 18 | | | | 12 | | | | 45 | | | | 45 | |
| | 534 | | | | 147 | | | | 1,081 | | | | 451 | |
| Acquisition Capital | | | | | | | | | | | | | | | |
| Oil Sands | | — | | | | — | | | | 3 | | | | 5 | |
| Conventional | | — | | | | — | | | | 4 | | | | 1 | |
| | — | | | | — | | | | 7 | | | | 6 | |
| Husky Acquisition (Note 4) | | | | | | | | | | | | | | | |
| Oil Sands | | — | | | | — | | | | 5,119 | | | | — | |
| Conventional | | — | | | | — | | | | 565 | | | | — | |
| Offshore | | — | | | | — | | | | 2,977 | | | | — | |
| Canadian Manufacturing | | — | | | | — | | | | 2,283 | | | | — | |
| U.S. Manufacturing | | — | | | | — | | | | 2,140 | | | | — | |
| Retail | | — | | | | — | | | | 422 | | | | — | |
| Corporate and Eliminations | | — | | | | — | | | | 155 | | | | — | |
| Total Capital Expenditures | | 534 | | | | 147 | | | | 14,749 | | | | 457 | |
(1)Includes expenditures on PP&E and E&E assets.
(2)Prior periods have been reclassified to conform with the current period’s operating segments.
| | | | | |
| Cenovus Energy Inc. – Q2 2021 Interim Consolidated Financial Statements | 14 |
NOTES TO CONSOLIDATED FINANCIAL STATEMENTS (unaudited)
All amounts in $ millions, unless otherwise indicated
For the periods ended June 30, 2021
| | |
| 2. BASIS OF PREPARATION AND STATEMENT OF COMPLIANCE |
In these interim Consolidated Financial Statements, unless otherwise indicated, all dollars are expressed in Canadian dollars. All references to C$ or $ are to Canadian dollars and references to US$ are to U.S. dollars.
These interim Consolidated Financial Statements have been prepared in accordance with International Financial Reporting Standards (“IFRS”) as issued by the International Accounting Standards Board (“IASB”) applicable to the preparation of interim financial statements, including International Accounting Standard 34, “Interim Financial Reporting” (“IAS 34”), and have been prepared following the same accounting policies and methods of computation as the annual Consolidated Financial Statements for the year ended December 31, 2020, except for income taxes and updates to significant accounting policies as disclosed in Note 3. Income taxes on earnings or loss in the interim periods are accrued using the income tax rate that would be applicable to the expected total annual earnings or loss.
Certain information provided for the prior year has been reclassified to conform to the presentation adopted for the periods ended June 30, 2021. Certain information and disclosures normally included in the notes to the annual Consolidated Financial Statements have been condensed or have been disclosed on an annual basis only. Accordingly, these interim Consolidated Financial Statements should be read in conjunction with the annual Consolidated Financial Statements for the year ended December 31, 2020, which have been prepared in accordance with IFRS as issued by the IASB.
These interim Consolidated Financial Statements were approved by the Board of Directors effective July 28, 2021.
| | |
|
| 3. UPDATE TO SIGNIFICANT ACCOUNTING POLICIES, CRITICAL ACCOUNTING JUDGMENTS AND KEY SOURCES OF ESTIMATION UNCERTAINTY |
As a result of the Arrangement, the Company updated its significant accounting policies, critical accounting judgments and key sources of estimation uncertainty on January 1, 2021. There were no additional changes made in the second quarter of 2021.
Accounting policies, in addition to those noted below, can be found in the Company’s annual Consolidated Financial Statements for the year ended December 31, 2020.
A) Principles of Consolidation
The Consolidated Financial Statements include the accounts of Cenovus and its subsidiaries. Subsidiaries are entities over which the Company has control. Subsidiaries are consolidated from the date of acquisition of control and continue to be consolidated until the date that there is a loss of control. All intercompany transactions, balances, and unrealized gains and losses from intercompany transactions are eliminated on consolidation.
Interests in joint arrangements are classified as either joint operations or joint ventures, depending on the rights and obligations of the parties to the arrangement. Joint operations arise when the Company has rights to the assets and obligations for the liabilities of the arrangement. The Company’s accounts reflect its share of the assets, liabilities, revenues and expenses from the Company’s activities that are conducted through joint operations with third parties. A portion of the Company’s activities relates to joint ventures, which are accounted for using the equity method of accounting.
An associate is an entity for which the Company has significant influence over but does not control or jointly control the affiliate. Investments in associates are accounted for using the equity method of accounting and are recognized at cost and adjusted thereafter to recognize the Company’s share of the affiliate’s profit or loss and other comprehensive income (“OCI”).
B) Revenue Recognition
Revenue is measured based on the consideration specified in a contract with a customer and excludes amounts collected on behalf of third parties. Cenovus recognizes revenue when it transfers control of the product or service to a customer, which is generally when title passes from the Company to its customer.
Purchases and sales of products that are entered into in contemplation of each other with the same counterparty are recorded on a net basis. Revenues associated with services provided as agent are recorded as the services are provided.
Cenovus recognizes revenue from the following major products and services:
•Sale of crude oil, NGLs and natural gas.
•Sale of petroleum and refined products.
•Crude oil and natural gas processing services.
•Pipeline transportation, the blending of crude oil and natural gas and storage of crude oil, diluent and natural gas.
•Fee-for-service hydrocarbon trans-loading services.
•Construction services.
| | | | | |
| Cenovus Energy Inc. – Q2 2021 Interim Consolidated Financial Statements | 15 |
NOTES TO CONSOLIDATED FINANCIAL STATEMENTS (unaudited)
All amounts in $ millions, unless otherwise indicated
For the periods ended June 30, 2021
The Company satisfies its performance obligations in contracts with customers upon the delivery of crude oil, NGLs, natural gas, and petroleum and refined products, which is generally at a point in time. Performance obligations for crude oil and natural gas processing revenue, transportation services and trans-loading services are satisfied over time as the service is provided. Cenovus sells its production of crude oil, NGLs, natural gas, and petroleum and refined products generally pursuant to variable price contracts. The transaction price for variable price contracts is based on the commodity price, adjusted for quality, location and other factors. Revenue associated with natural gas processing, transportation services and trans-loading services are generally based on fixed price contracts.
Construction revenue is recognized for general contractor services that the Company provides to HMLP and includes fixed price and cost-plus contracts. Revenue from fixed price construction contracts is recognized as performance obligations are met and revenue from cost-plus contracts are recognized as services are performed.
The Company has take-or-pay contracts where Cenovus has long-term supply commitments in return for purchasers to pay for minimum quantities, whether or not the customer takes the delivery. If a purchaser has a right to defer delivery to a later date, the performance obligation has not been satisfied and revenue is deferred and recognized only when the product is delivered or the deferral provision can no longer be extended.
Cenovus’s revenue transactions do not contain significant financing components and payments are typically due within 30 days of revenue recognition. The Company does not adjust transaction prices for the effects of a significant financing component when the period between the transfer of the promised goods or services to the customer and payment by the customer is less than one year. The Company does not disclose or quantify information about remaining performance obligations that have an original expected duration of one year or less and it does not have any long-term contracts with the exception of certain construction contracts with HMLP and take-or-pay contracts with unfulfilled performance obligations.
C) Employee Benefit Plans
The Company provides employees with a pension plan that includes either a defined contribution or defined benefit component.
Other post-employment benefit plans (“OPEB”) are also provided to qualifying employees. In some cases, the benefits are provided through medical care plans to which the Company, the employees, the retirees and covered family members contribute. In some plans there is no funding of the benefits before retirement.
Pension expense for the defined contribution pension is recorded as the benefits are earned.
The cost of the defined benefit pension and OPEB plans are actuarially determined using the projected unit credit method. The amount recognized in other liabilities on the Consolidated Balance Sheets for the defined benefit pension and OPEB plans is the present value of the defined benefit obligation less the fair value of plan assets. Any surplus resulting from this calculation is limited to the present value of any economic benefits available in the form of refunds from the plans or reductions in future contributions to the plans.
Changes in the defined benefit obligation from service costs, net interest and remeasurements are recognized as follows:
•Service costs, including current service costs, past service costs, gains and losses on curtailments, and settlements, are recorded with pension benefit costs.
•Net interest is calculated by applying the same discount rate used to measure the defined benefit obligation at the beginning of the annual period to the net defined benefit asset or liability measured. Interest expense and interest income on net post-employment benefit liabilities and assets are recorded with pension benefit costs in operating, and general and administrative expenses, as well as PP&E and E&E assets.
•Remeasurements, composed of actuarial gains and losses, the effect of changes to the asset ceiling (excluding interest) and the return on plan assets (excluding interest income), are charged or credited to equity in OCI in the period in which they arise. Remeasurements are not reclassified to net earnings in subsequent periods.
Pension benefit costs are recorded in operating, and general and administrative expenses, as well as PP&E and E&E assets, corresponding to where the associated salaries of the employees rendering the service are recorded.
From time-to-time, the Company may provide certain other long-term incentive benefits to employees. In 2019, a one-time incentive program was introduced whereby a cash award equivalent to the employee’s base salary was payable if Cenovus achieved, prior to February 12, 2024, a target share price of $20 per share for a period of 20 consecutive trading days on the TSX (the “Plan”). In conjunction with the close of the Arrangement, the Plan was terminated and replaced with a synergy-focused incentive plan (the “Incentive Plan”). All employees, except for Executive Officers and unionized employees are eligible. Under the Incentive Plan, a cash award of 15 percent to 30 percent of the employee’s base salary is payable if Cenovus achieves greater than $1.0 billion in identified run-rate synergies prior to the end of 2022. The payout is calculated on a sliding scale and includes a performance multiplier for early achievement of synergy targets. The obligation related to the Incentive Plan is estimated as the probability of the payout being achieved multiplied by the expected payout amount. The obligation is recognized as general and administrative expense over the estimated time until payout is achieved.
| | | | | |
| Cenovus Energy Inc. – Q2 2021 Interim Consolidated Financial Statements | 16 |
NOTES TO CONSOLIDATED FINANCIAL STATEMENTS (unaudited)
All amounts in $ millions, unless otherwise indicated
For the periods ended June 30, 2021
D) Related Party Transactions
The Company enters into transactions and agreements in the normal course of business with certain related parties, joint arrangements and associates. Proceeds from the disposition of assets to related parties are recognized at fair value, based on discounted cash flows forecast from those assets. Independent opinions of fair value may be obtained to confirm the estimated fair value of proceeds.
E) Cash and Cash Equivalents
Cash and cash equivalents include short-term investments, such as money market deposits or similar type instruments with a maturity of three months or less. When outstanding cheques are in excess of cash on hand and short-term deposits, and the Company has the ability to net settle, the excess is reported in bank operating loans.
Cash and cash equivalents that are not available for use are classified as restricted cash. When restricted cash is not expected to be used within twelve months, it is classified as a non-current asset.
F) Property, Plant and Equipment
General
PP&E is stated at cost less accumulated depreciation, depletion and amortization (“DD&A”), and net of any impairment losses. Expenditures related to renewals or betterments that improve the productive capacity or extend the life of an asset are capitalized. Maintenance and repairs are expensed as incurred. Land is not depreciated.
Any gains or losses from the divestiture of PP&E are recognized in net earnings.
Oil and Gas Properties
Development and production assets are capitalized on an area-by-area basis and include all costs associated with the development and production of crude oil and natural gas properties and related infrastructure facilities, as well as any E&E expenditures incurred in finding reserves of crude oil, NGLs or natural gas transferred from E&E assets. Capitalized costs include directly attributable internal costs, decommissioning liabilities and, for qualifying assets, borrowing costs directly associated with the acquisition of, the exploration for, and the development of crude oil and natural gas reserves.
For onshore assets, which includes assets from the Oil Sands and Conventional segments, costs accumulated within each area are depleted using the unit-of-production method based on estimated proved reserves determined using forward prices and costs. Offshore assets are depleted using the unit-of-production method based on estimated proved developed producing reserves or proved plus probable reserves determined using forward prices and costs. For the purpose of these calculations, natural gas is converted to crude oil on an energy equivalent basis. The unit-of-production method based on total proved reserves or proved plus probable reserves takes into account any expenditures incurred to date together with future development costs to be incurred in developing those reserves.
Exchanges of development and production assets are measured at fair value unless the transaction lacks commercial substance or the fair value of either the asset received, or the asset given up, cannot be reliably measured. When fair value is not used, the carrying amount of the asset given up is used as the cost of the asset acquired.
Included in oil and gas properties are information technology assets used to support the upstream business and are depreciated on a straight-line basis over their useful lives of three years. Gross overriding royalty interests (“GORRs”) in certain oil and gas properties are depleted using a unit-of-production method.
Manufacturing Assets
The initial costs of refining and upgrading PP&E are capitalized when incurred. Costs include the cost of constructing or otherwise acquiring the equipment or facilities, the cost of installing the asset and making it ready for its intended use, the associated decommissioning costs and, for qualifying assets, borrowing costs.
Refining assets are depreciated on a straight-line basis over the estimated service life of each component of the refinery. The major components are depreciated as follows:
| | | | | | | | |
| Land improvements and buildings | 15 to 40 years |
| Office equipment and vehicles | 3 to 15 years |
| Refining equipment | 10 to 60 years |
The residual value, the method of amortization and the useful life of each component are reviewed annually and adjusted on a prospective basis, if appropriate.
| | | | | |
| Cenovus Energy Inc. – Q2 2021 Interim Consolidated Financial Statements | 17 |
NOTES TO CONSOLIDATED FINANCIAL STATEMENTS (unaudited)
All amounts in $ millions, unless otherwise indicated
For the periods ended June 30, 2021
Processing, Transportation and Storage Assets, Retail and Other
Depreciation for substantially all other PP&E is provided using the straight-line method based on the estimated useful lives of assets, which range from three years to 60 years. The useful lives are estimated based upon the period the asset is expected to be available for use by the Company.
The residual value, the method of amortization and the useful lives of the assets are reviewed annually and adjusted on a prospective basis, if appropriate.
G) Share Capital and Warrants
Common shares and preferred shares are classified as equity. Preferred shares are cancellable and redeemable only at the Company’s option and dividends are discretionary and payable only if declared by Cenovus’s Board of Directors. Transaction costs directly attributable to the issue of common shares and preferred shares are recognized as a deduction from equity, net of any income taxes. Dividends on common shares and preferred shares are recognized within equity.
Warrants issued in the Arrangement are financial instruments classified as equity and were measured at fair value upon issuance. On exercise, the cash consideration received by the Company and the associated carrying value of the warrants are recorded as share capital.
H) Stock-Based Compensation
Cenovus has a number of stock-based compensation plans which include stock options with associated net settlement rights (“NSRs”), Cenovus replacement stock options, performance share units (“PSUs”), restricted share units (“RSUs”) and deferred share units (“DSUs”). Stock-based compensation costs are recorded in general and administrative expenses, or recorded to PP&E or E&E assets when directly related to exploration or development activities.
Stock Options With Associated Net Settlement Rights
NSRs are accounted for as equity instruments, which are measured at fair value on the grant date using the Black-Scholes-Merton valuation model and are not revalued at each reporting date. The fair value is recognized as stock-based compensation over the vesting period, with a corresponding increase recorded as paid in surplus in shareholders’ equity. On exercise, the cash consideration received by the Company and the associated paid in surplus are recorded as share capital.
Cenovus Replacement Stock Options
Cenovus replacement stock options are accounted for as liability instruments, which are measured at fair value at each period end using the Black-Scholes-Merton valuation model. The fair value is recognized as stock-based compensation over the vesting period. When options are settled for cash, the liability is reduced by the cash settlement paid. When options are settled for common shares, the cash consideration received by the Company and the previously recorded liability associated with the option are recorded as share capital.
Performance, Restricted and Deferred Share Units
PSUs, RSUs and DSUs are accounted for as liability instruments and are measured at fair value based on the market value of Cenovus’s common shares at each period end. The fair value is recognized as stock-based compensation over the vesting period. Fluctuations in the fair values are recognized as stock-based compensation in the period they occur. Costs related to stock-based compensation are recorded to PP&E or E&E assets when directly related to exploration or development activities.
I) Update to Critical Accounting Judgments and Key Sources of Estimation Uncertainty
A full list of critical accounting judgments and key sources of estimation uncertainty can be found in the Company’s annual Consolidated Financial Statements for the year ended December 31, 2020.
Joint Arrangements
The classification of a joint arrangement as either a joint operation or a joint venture requires judgment. The joint operations held by the Company are as follows:
•50 percent interest in WRB Refining LP (“WRB”).
•50 percent interest in Sunrise Oil Sands Partnership (“Sunrise”).
•50 percent interest in BP-Husky Refining LLC (“Toledo”).
It was determined that Cenovus has the rights to the assets and obligations for the liabilities of WRB, Sunrise and Toledo. As a result, the joint arrangements are classified as joint operations and the Company’s share of the assets, liabilities, revenues and expenses are recorded in the Consolidated Financial Statements.
| | | | | |
| Cenovus Energy Inc. – Q2 2021 Interim Consolidated Financial Statements | 18 |
NOTES TO CONSOLIDATED FINANCIAL STATEMENTS (unaudited)
All amounts in $ millions, unless otherwise indicated
For the periods ended June 30, 2021
In determining the classification of its joint arrangements under IFRS 11, “Joint Arrangements”, the Company considered the following:
•The original intention of the joint arrangements was to form an integrated North American heavy oil business. Partnerships are “flow-through” entities.
•The partnership agreements require the partners to make contributions if funds are insufficient to meet the obligations or liabilities of the partnerships. The past and future development of WRB, Sunrise and Toledo is dependent on funding from the partners by way of capital contribution commitments, partnership notes payable and loans.
•WRB and Toledo have third-party debt facilities to cover short-term working capital requirements.
•Sunrise is operated like most typical western Canadian working interest relationships where the operating partner takes product on behalf of the participants in accordance with the partnership agreement. WRB and Toledo have very similar structures modified to account for the operating environment of the refining business.
•Cenovus, Phillips 66 and BP, as operators, either directly or through wholly-owned subsidiaries, provide marketing services, purchase necessary feedstock, and arrange for transportation and storage, on the partners' behalf as the agreements prohibit the partnerships from undertaking these roles themselves. In addition, the partnerships do not have employees and, as such, are not capable of performing these roles.
•In each arrangement, output is taken by one of the partners, indicating that the partners have rights to the economic benefits of the assets and the obligation for funding the liabilities of the arrangements.
Recoveries from Insurance Claims
The Company uses estimates and assumptions on the amount recorded for insurance proceeds expected to be received. Accordingly, actual results may differ from these estimated recoveries.
Functional Currency
The functional currency for each of the Company’s subsidiaries is a management judgement based on the currency of the primary economic environment in which the subsidiary operates.
Fair Value of Related Party Transactions
The Company transacts with certain related parties, joint arrangements and associates in the normal course of business. Such relationships can have an effect on the financial results of the Company and may lead to differences in the transactions between related parties compared to transactions between unrelated parties. Independent opinions of the fair values may be obtained to confirm the estimated fair value of proceeds.
A) Summary of the Acquisition
On October 25, 2020, Cenovus announced that it had entered into a definitive agreement to combine with Husky. The transaction was accomplished through the Arrangement pursuant to which Cenovus acquired all the issued and outstanding common shares of Husky in exchange for common shares and common share purchase warrants of Cenovus. In addition, all of the issued and outstanding Husky preferred shares were exchanged for Cenovus preferred shares with substantially identical terms. The Arrangement closed on January 1, 2021.
The Arrangement combines oil sands and heavy oil assets with extensive transportation, storage and logistics and downstream infrastructure, creating opportunities to optimize the margin captured across the heavy oil value chain. The combined company is largely integrated, reducing exposure to Alberta heavy oil price differentials while maintaining exposure to global commodity prices.
The Arrangement was accounted for using the acquisition method pursuant to IFRS 3, “Business Combinations”. Under the acquisition method, assets and liabilities are measured at their estimated fair value on the date of acquisition with the exception of income tax, stock-based compensation, lease liabilities and ROU assets. The total consideration was allocated to the tangible and intangible assets acquired and liabilities assumed.
B) Purchase Price Allocation
Cenovus acquired all the issued and outstanding Husky common shares in consideration for the issuance of 0.7845 Cenovus common shares plus 0.0651 Cenovus warrants for each Husky common share. Cenovus issued 788.5 million Cenovus common shares with a fair value of $6.1 billion, based on the December 31, 2020, closing share price of $7.75, as reported on the TSX. In addition, 65.4 million common share purchase warrants were issued. Each whole warrant entitles the holder to acquire one Cenovus common share for a period of five years at an exercise price of $6.54 per share. The fair value of the warrants was estimated to be $216 million. Cenovus also acquired all the issued and outstanding Husky preferred shares in exchange for
| | | | | |
| Cenovus Energy Inc. – Q2 2021 Interim Consolidated Financial Statements | 19 |
NOTES TO CONSOLIDATED FINANCIAL STATEMENTS (unaudited)
All amounts in $ millions, unless otherwise indicated
For the periods ended June 30, 2021
36.0 million Cenovus first preferred shares with substantially identical terms and a fair value of $519 million. The outstanding Husky stock options were also exchanged for Cenovus replacement stock options. Each replacement stock option entitles the holder to acquire 0.7845 of a Cenovus common share at an exercise price per share of a Husky stock option divided by 0.7845. The fair value of the replacement stock options was estimated to be $9 million.
The preliminary purchase price allocation is based on Management’s best estimate of the assets acquired and liabilities assumed. The Company will finalize the value of net assets acquired by December 31, 2021, and adjustments to initial estimates, including goodwill, may be required. No significant adjustments were made to the preliminary purchase price allocation as at June 30, 2021.
The following table summarizes the details of the consideration and the recognized amounts of assets acquired and liabilities assumed at the date of the acquisition.
| | | | | | | | | | | |
| As at | January 1, 2021 | |
| | | |
| Consideration | | | |
| Common Shares | | 6,111 | |
| Preferred Shares | | 519 | |
| Share Purchase Warrants | | 216 | |
| Replacement Stock Options | | 9 | |
| Non-Controlling Interest | | 11 | |
| Total Consideration and Non-Controlling Interest | | 6,866 | |
| | | |
| Identifiable Assets Acquired and Liabilities Assumed | | | |
| Cash | | 735 | |
| Restricted Cash | | 164 | |
| Accounts Receivable and Accrued Revenues | | 1,283 | |
| Inventories | | 1,133 | |
| Property, Plant and Equipment | | 13,661 | |
| Right-of-Use Assets | | 1,132 | |
| Long-Term Income Tax Receivable | | 202 | |
| Other Assets | | 198 | |
| Investment in Equity-Accounted Affiliates | | 457 | |
| Deferred Income Tax Assets, Net | | 942 | |
| Accounts Payable and Accrued Liabilities | | (2,265) | |
| Income Tax Payable | | (100) | |
| Short-Term Borrowings | | (40) | |
| Long-Term Debt | | (6,602) | |
| Lease Liabilities | | (1,441) | |
| Decommissioning Liabilities | | (2,560) | |
| Other Liabilities | | (745) | |
| Total Identifiable Net Assets | | 6,154 | |
| Goodwill | | 712 | |
The fair value of trade and other receivables acquired as part of the acquisition was $1.1 billion, with a gross contractual amount of $1.2 billion. As of the acquisition date, the best estimate of the contractual cash flows not expected to be collected was $36 million.
Goodwill was recognized due to the appreciation of Cenovus’s share price at the close of the acquisition and is attributable to the Oil Sands segment where significant operating synergies are expected to be achieved. Goodwill is not deductible for tax purposes.
| | | | | |
| Cenovus Energy Inc. – Q2 2021 Interim Consolidated Financial Statements | 20 |
NOTES TO CONSOLIDATED FINANCIAL STATEMENTS (unaudited)
All amounts in $ millions, unless otherwise indicated
For the periods ended June 30, 2021
C) Integration Costs
Transaction costs from the Arrangement exclude share issuance costs related to common shares, preferred shares and warrants. Integration costs recognized in the Consolidated Statements of Earnings (Loss) include the following:
| | | | | | | | | | | | | | | | | | | | | | | |
| Three Months Ended | | | Six Months Ended | |
| For the periods ended June 30, | | 2021 | | | | 2021 | |
| Transaction Costs | | — | | | | 65 | |
| Integration Related Costs | | 24 | | | | 37 | |
| Severance Payments | | 10 | | | | 155 | |
| | 34 | | | | 257 | |
D) Revenue and Profit Contribution
The acquired business contributed revenues of $4.5 billion and $9.2 billion, as well as segment income of $557 million and $1.1 billion for the three and six months ended June 30, 2021, respectively.
| | |
|
5. GENERAL AND ADMINISTRATIVE |
| | | | | | | | | | | | | | | | | | | | | | | | | | | | | | | | | | | | | | | | | | | | | | | |
| Three Months Ended | | | Six Months Ended | |
| For the periods ended June 30, | | 2021 | | | | 2020 | | | | 2021 | | | | 2020 | |
| Salaries and Benefits | | 79 | | | | 41 | | | | 149 | | | | 70 | |
| Administrative and Other | | 50 | | | | 20 | | | | 108 | | | | 46 | |
| Stock-Based Compensation Expense (Recovery) (Note 24) | | 34 | | | | 35 | | | | 69 | | | | (12) | |
| Other Long-Term Incentive Benefits Expense (Recovery) | | 7 | | | | — | | | | 7 | | | | (31) | |
| | 170 | | | | 96 | | | | 333 | | | | 73 | |
| | | | | | | | | | | | | | | | | | | | | | | | | | | | | | | | | | | | | | | | | | | | | | | |
| Three Months Ended | | | Six Months Ended | |
| For the periods ended June 30, | | 2021 | | | | 2020 | | | | 2021 | | | | 2020 | |
| Interest Expense – Short-Term Borrowings and Long-Term Debt | | 136 | | | | 95 | | | | 278 | | | | 185 | |
| Net (Discount) Premium on Redemption of Long-Term Debt | | — | | | | — | | | | — | | | | (25) | |
| Interest Expense – Lease Liabilities (Note 19) | | 42 | | | | 22 | | | | 86 | | | | 44 | |
| Unwinding of Discount on Decommissioning Liabilities (Note 20) | | 46 | | | | 14 | | | | 94 | | | | 29 | |
| Other | | 8 | | | | 8 | | | | 18 | | | | 13 | |
| | 232 | | | | 139 | | | | 476 | | | | 246 | |
| | | | | |
| Cenovus Energy Inc. – Q2 2021 Interim Consolidated Financial Statements | 21 |
NOTES TO CONSOLIDATED FINANCIAL STATEMENTS (unaudited)
All amounts in $ millions, unless otherwise indicated
For the periods ended June 30, 2021
| | |
| 7. FOREIGN EXCHANGE (GAIN) LOSS, NET |
| | | | | | | | | | | | | | | | | | | | | | | | | | | | | | | | | | | | | | | | | | | | | | | |
| Three Months Ended | | | Six Months Ended | |
| For the periods ended June 30, | | 2021 | | | | 2020 | | | | 2021 | | | | 2020 | |
| Unrealized Foreign Exchange (Gain) Loss on Translation of: | | | | | | | | | | | | | | | |
| U.S. Dollar Debt Issued From Canada | | (150) | | | | (273) | | | | (280) | | | | 316 | |
| Other | | (42) | | | | (15) | | | | (51) | | | | 53 | |
| Unrealized Foreign Exchange (Gain) Loss | | (192) | | | | (288) | | | | (331) | | | | 369 | |
| Realized Foreign Exchange (Gain) Loss | | 20 | | | | (22) | | | | 42 | | | | (42) | |
| | (172) | | | | (310) | | | | (289) | | | | 327 | |
Effective May 1, 2021, the Company sold its GORR in the Marten Hills area of Alberta relating to the Conventional segment. Cenovus received cash proceeds of $102 million and recorded a before-tax gain of $60 million (after-tax gain – $47 million).
The Company entered into definitive agreements to sell assets within its Conventional segment located in the East Clearwater area and the Kaybob areas for combined gross proceeds of approximately $110 million. The Kaybob transaction closed in July and the East Clearwater transaction is expected to close in the third quarter of 2021.
On a quarterly basis, the Company assesses its cash-generating units (“CGUs”) for indicators of impairment or when facts and circumstances suggest the carrying amount may exceed its recoverable amount. Goodwill is tested for impairment at least annually.
2021 Impairments
As at June 30, 2021, there were no indicators of impairment or reversals of impairment for the Company’s upstream or downstream CGUs. As at June 30, 2021, there were no indicators of impairment of goodwill.
2020 Upstream Impairments
As at June 30, 2020, there were no indicators of impairment or reversals. As at March 31, 2020, the decline in forward commodity prices was identified as an indicator of impairment and the Company tested its upstream CGUs and CGUs with associated goodwill for impairment. As a result, the Company determined that the carrying amount was greater than the recoverable amount of certain CGUs and recorded an impairment loss of $315 million as additional DD&A in the Conventional segment. Future cash flows for the CGUs declined primarily due to lower forward commodity prices.
The following table summarizes the impairment losses for the three months ended March 31, 2020, and estimated recoverable amounts as at March 31, 2020, by CGU:
| | | | | | | | | | | | | | | | | | | | | | | |
| Cash-Generating Unit | Impairment Amount | | | Recoverable Amount | |
| Clearwater | | 140 | | | | 306 | |
| Kaybob-Edson | | 175 | | | | 414 | |
As at June 30, 2020, there were no indicators of impairment of goodwill.
| | | | | |
| Cenovus Energy Inc. – Q2 2021 Interim Consolidated Financial Statements | 22 |
NOTES TO CONSOLIDATED FINANCIAL STATEMENTS (unaudited)
All amounts in $ millions, unless otherwise indicated
For the periods ended June 30, 2021
The provision for income taxes is:
| | | | | | | | | | | | | | | | | | | | | | | | | | | | | | | | | | | | | | | | | | | | | | | |
| Three Months Ended | | | Six Months Ended | |
| For the periods ended June 30, | | 2021 | | | | 2020 | | | | 2021 | | | | 2020 | |
| Current Tax | | | | | | | | | | | | | | | |
| Canada | | 2 | | | | (2) | | | | 14 | | | | (2) | |
| United States | | — | | | | 1 | | | | — | | | | 1 | |
| Asia Pacific | | 47 | | | | — | | | | 81 | | | | — | |
| Other International | | — | | | | — | | | | 1 | | | | — | |
| Total Current Tax Expense (Recovery) | | 49 | | | | (1) | | | | 96 | | | | (1) | |
| Deferred Tax Expense (Recovery) | | 63 | | | | (131) | | | | 90 | | | | (479) | |
| | 112 | | | | (132) | | | | 186 | | | | (480) | |
For the three and six months ended June 30, 2021, the Company recorded a current tax expense primarily related to Asia Pacific operations in China.
The preliminary purchase price allocation includes a net deferred tax asset of $942 million as at January 1, 2021. The net deferred tax asset consists of $862 million related to the Company’s operations in the Canadian jurisdiction, $58 million related to U.S. operations and $22 million related to Asia Pacific activities. The Canadian deferred tax asset has been offset against the Canadian deferred tax liability.
For the three and six months ended June 30, 2020, the Company recorded a deferred tax recovery due to losses, excluding unrealized foreign exchange gains and losses on long-term debt.
A) Net Earnings (Loss) Per Share – Basic and Diluted
| | | | | | | | | | | | | | | | | | | | | | | | | | | | | | | | | | | | | | | | | | | | | | | |
| Three Months Ended | | | Six Months Ended | |
| For the periods ended June 30, | | 2021 | | | | 2020 | | | | 2021 | | | | 2020 | |
| Net Earnings (Loss) | | 224 | | | | (235) | | | | 444 | | | | (2,032) | |
| Effect of Cumulative Dividends on Preferred Shares | | (8) | | | | — | | | | (17) | | | | — | |
| Net Earnings (Loss) – Basic and Diluted | | 216 | | | | (235) | | | | 427 | | | | (2,032) | |
| | | | | | | | | | | | | | | |
| Basic – Weighted Average Number of Shares | | 2,017.5 | | | | 1,228.9 | | | | 2,017.5 | | | | 1,228.9 | |
| Dilutive Effect of Warrants | | 24.3 | | | | — | | | | 21.1 | | | | — | |
| Dilutive Effect of Net Settlement Rights | | 0.3 | | | | — | | | | — | | | | — | |
| Diluted – Weighted Average Number of Shares | | 2,042.1 | | | | 1,228.9 | | | | 2,038.6 | | | | 1,228.9 | |
| | | | | | | | | | | | | | | |
| | | | | | | | | | | | | | | |
Net Earnings (Loss) Per Share – Basic and Diluted (1) ($) | | 0.11 | | | | (0.19) | | | | 0.21 | | | | (1.65) | |
(1)Excluded from the calculation of the three and six months ended diluted net earnings (loss) per share were $6 million and $12 million, respectively, of net earnings and 1.9 million and 1.8 million, respectively, of potential ordinary shares related to the assumed exercise of Cenovus replacement stock options as the impact was anti-dilutive.
B) Common Share Dividends
For the six months ended June 30, 2021, the Company paid dividends of $71 million or $0.035 per common share (six months ended June 30, 2020 – $77 million or $0.0625 per common share). The declaration of common share dividends is at the sole discretion of the Company’s Board of Directors and is considered quarterly. On July 28, 2021, the Company’s Board of Directors declared third quarter dividends of $0.0175 per common share, payable on September 30, 2021, to common shareholders of record as at September 15, 2021.
| | | | | |
| Cenovus Energy Inc. – Q2 2021 Interim Consolidated Financial Statements | 23 |
NOTES TO CONSOLIDATED FINANCIAL STATEMENTS (unaudited)
All amounts in $ millions, unless otherwise indicated
For the periods ended June 30, 2021
C) Preferred Share Dividends
| | | | | | | | | | | | | | | | | | | | | | | |
| Three Months Ended | | | Six Months Ended | |
| For the periods ended June 30, | | 2021 | | | | 2021 | |
| Series 1 First Preferred Shares | | 2 | | | | 4 | |
| Series 2 First Preferred Shares | | — | | | | — | |
| Series 3 First Preferred Shares | | 3 | | | | 6 | |
| Series 5 First Preferred Shares | | 2 | | | | 4 | |
| Series 7 First Preferred Shares | | 1 | | | | 3 | |
| Total Declared and Paid Preferred Share Dividends | | 8 | | | | 17 | |
The declaration of preferred share dividends is at the sole discretion of the Company’s Board of Directors and is considered quarterly. On July 28, 2021, the Company’s Board of Directors declared third quarter dividends for its Cenovus series 1, 2, 3, 5, and 7 first preferred shares, payable on September 30, 2021, in the amount of $9 million, to preferred shareholders of record as at September 15, 2021.
| | |
|
| 12. EXPLORATION AND EVALUATION ASSETS, NET |
| | | | | | | | | | | |
| Total | |
| As at December 31, 2020 | | 623 | |
| Additions | | 21 | |
| Exploration Expense | | (11) | |
| Change in Decommissioning Liabilities | | 7 | |
| Exchange Rate Movements and Other | | (1) | |
| As at June 30, 2021 | | 639 | |
| | |
|
| 13. PROPERTY, PLANT AND EQUIPMENT, NET |
| | | | | | | | | | | | | | | | | | | | | | | | | | | | | | | | | | | | | | | | | | | | | | | | | | | | | | | | | | | |
| Oil and Gas Properties | | | Processing, Transportation and Storage Assets | | | Manufacturing Assets | | | Retail and Other (1) | | | Total | |
| COST | | | | | | | | | | | | | | | | | | | |
As at December 31, 2020 (2) | | 29,867 | | | | 218 | | | | 5,671 | | | | 1,290 | | | | 37,046 | |
| Acquisition (Note 4) | | 8,661 | | | | — | | | | 4,423 | | | | 577 | | | | 13,661 | |
| Additions | | 560 | | | | 5 | | | | 451 | | | | 51 | | | | 1,067 | |
| Change in Decommissioning Liabilities | | 2 | | | | 1 | | | | 5 | | | | 3 | | | | 11 | |
| Exchange Rate Movements and Other | | (61) | | | | 14 | | | | (294) | | | | (15) | | | | (356) | |
| Divestitures | | (90) | | | | — | | | | — | | | | — | | | | (90) | |
| As at June 30, 2021 | | 38,939 | | | | 238 | | | | 10,256 | | | | 1,906 | | | | 51,339 | |
| | | | | | | | | | | | | | | | | | | |
| ACCUMULATED DEPRECIATION, DEPLETION AND AMORTIZATION | | | | | | | | | | | | | | | | | | | |
As at December 31, 2020 (2) | | 8,361 | | | | 42 | | | | 2,195 | | | | 1,037 | | | | 11,635 | |
| Depreciation, Depletion and Amortization | | 1,592 | | | | 4 | | | | 263 | | | | 60 | | | | 1,919 | |
| Exchange Rate Movements and Other | | 6 | | | | 8 | | | | (92) | | | | (1) | | | | (79) | |
| Divestitures | | (36) | | | | — | | | | — | | | | — | | | | (36) | |
| As at June 30, 2021 | | 9,923 | | | | 54 | | | | 2,366 | | | | 1,096 | | | | 13,439 | |
| | | | | | | | | | | | | | | | | | | |
| CARRYING VALUE | | | | | | | | | | | | | | | | | | | |
As at December 31, 2020 (2) | | 21,506 | | | | 176 | | | | 3,476 | | | | 253 | | | | 25,411 | |
| As at June 30, 2021 | | 29,016 | | | | 184 | | | | 7,890 | | | | 810 | | | | 37,900 | |
(1)Includes retail assets, office furniture, fixtures, leasehold improvements, information technology and aircraft.
(2)Balances for periods prior to January 1, 2021, have been reclassified to conform with the current period’s presentation of asset classes.
| | | | | |
| Cenovus Energy Inc. – Q2 2021 Interim Consolidated Financial Statements | 24 |
NOTES TO CONSOLIDATED FINANCIAL STATEMENTS (unaudited)
All amounts in $ millions, unless otherwise indicated
For the periods ended June 30, 2021
| | |
|
| 14. RIGHT-OF-USE ASSETS, NET |
| | | | | | | | | | | | | | | | | | | | | | | | | | | | | | | | | | | | | | | | | | | | | | | | | | | | | | | | | | | |
| Real Estate | | | Transportation and Storage Assets (1) | | | Manufacturing Assets | | | Retail and Other | | | Total | |
| COST | | | | | | | | | | | | | | | | | | | |
As at December 31, 2020 (2) | | 495 | | | | 977 | | | | 15 | | | | 15 | | | | 1,502 | |
| Acquisition (Note 4) | | 99 | | | | 765 | | | | 138 | | | | 130 | | | | 1,132 | |
| Additions | | 4 | | | | 44 | | | | 7 | | | | 3 | | | | 58 | |
| Modifications | | 1 | | | | 6 | | | | — | | | | (1) | | | | 6 | |
| Re-measurement | | (2) | | | | — | | | | — | | | | (1) | | | | (3) | |
| Exchange Rate Movements and Other | | 1 | | | | (15) | | | | (4) | | | | (9) | | | | (27) | |
| As at June 30, 2021 | | 598 | | | | 1,777 | | | | 156 | | | | 137 | | | | 2,668 | |
| | | | | | | | | | | | | | | | | | | |
| ACCUMULATED DEPRECIATION | | | | | | | | | | | | | | | | | | | |
As at December 31, 2020 (2) | | 58 | | | | 293 | | | | 5 | | | | 7 | | | | 363 | |
| Depreciation | | 19 | | | | 120 | | | | 11 | | | | 12 | | | | 162 | |
| Exchange Rate Movements and Other | | — | | | | (11) | | | | (1) | | | | (5) | | | | (17) | |
| As at June 30, 2021 | | 77 | | | | 402 | | | | 15 | | | | 14 | | | | 508 | |
| | | | | | | | | | | | | | | | | | | |
| CARRYING VALUE | | | | | | | | | | | | | | | | | | | |
As at December 31, 2020 (2) | | 437 | | | | 684 | | | | 10 | | | | 8 | | | | 1,139 | |
| As at June 30, 2021 | | 521 | | | | 1,375 | | | | 141 | | | | 123 | | | | 2,160 | |
(1)Transportation and storage assets include railcars, barges, vessels, pipelines, caverns and storage tanks.
(2)Balances for periods prior to January 1, 2021, have been reclassified to conform with the current period’s presentation of asset classes.
| | |
|
15. JOINT ARRANGEMENTS AND ASSOCIATE |
A) Joint Operations
BP-Husky Refining LLC
Cenovus holds a 50 percent interest in Toledo with BP, who owns and operates the Toledo Refinery in Ohio.
Sunrise Oil Sands Partnership
Cenovus, as the operator, holds a 50 percent interest in Sunrise, an oil sands project in northern Alberta, with BP Canada.
WRB Refining LP
Cenovus holds a 50 percent interest in WRB with Phillips 66, who owns and operates the Wood River Refinery in Illinois and the Borger Refinery in Texas.
B) Joint Ventures
Husky-CNOOC Madura Ltd.
The Company holds a 40 percent interest in the jointly controlled entity, HCML, which is engaged in the exploration for and production of natural gas resources in offshore Indonesia. The Company’s share of equity investment income (loss) related to the joint venture is included in the Consolidated Statements of Earnings (Loss) in the Offshore segment.
Summarized below is the financial information for HCML accounted for using the equity method.
Results of Operations
| | | | | | | | | | | | | | | | | | | | | | | |
| Three Months Ended | | | Six Months Ended | |
| For the periods ended June 30, | | 2021 | | | | 2021 | |
| Revenue | | 110 | | | | 229 | |
| Expenses | | 128 | | | | 255 | |
| Net Earnings (Loss) | | (18) | | | | (26) | |
| | | | | |
| Cenovus Energy Inc. – Q2 2021 Interim Consolidated Financial Statements | 25 |
NOTES TO CONSOLIDATED FINANCIAL STATEMENTS (unaudited)
All amounts in $ millions, unless otherwise indicated
For the periods ended June 30, 2021
Balance Sheet
| | | | | | | | | | | |
| As at | June 30, 2021 | |
Current Assets (1) | | 203 | |
| Non-Current Assets | | 1,463 | |
| Current Liabilities | | 65 | |
Non-Current Liabilities | | 1,043 | |
| Net Assets | | 558 | |
(1)Includes cash and cash equivalents of $36 million.
For the six months ended June 30, 2021, the Company’s share of income from the equity-accounted affiliate was $24 million. As at June 30, 2021, the carrying amount of the Company's share of net assets was $410 million. These amounts do not equal the 40 percent joint control of the revenues, expenses and net assets of HCML due to differences in the values attributed to the investment and accounting policies between the joint venture and the Company.
For the six months ended June 30, 2021, the Company received $52 million of distributions from HCML.
Husky Midstream Limited Partnership
The Company holds a 35 percent interest in HMLP, which owns midstream assets, including pipeline, storage and other ancillary infrastructure assets in Alberta and Saskatchewan. Power Assets Holdings Ltd. holds a 49 percent interest and CK Infrastructure Holdings Ltd. holds a 16 percent interest in HMLP.
For the six months ended June 30, 2021, HMLP had net earnings of $50 million. The Company’s share of income (loss) from the equity-accounted affiliate does not equal the 35 percent of the net earnings of HMLP due to the nature of the profit-sharing arrangement as defined in the partnership agreement. The Company’s share of earnings will fluctuate depending on certain income thresholds. For the six months ended June 30, 2021, the Company did not record its pre-tax net loss relating to HMLP of $12 million as the carrying value of the Company’s interest is $nil.
Due to the decline in forecasted distributions from the partnership profit structure, as at June 30, 2021, the Company had $7 million in cumulative unrecognized losses and OCI, net of tax. The Company records its share of equity investment income related to the joint venture only in excess of the cumulated unrecognized loss and is included in the Consolidated Statements of Earnings (Loss) in the Oil Sands segment.
For the six months ended June 30, 2021, the Company received $37 million in distributions from HMLP.
For the six months ended June 30, 2021, the Company recorded $5 million related to HMLP’s distributions, net of the Company’s contributions to HMLP. This was recorded in the share of (income) loss from equity-accounted affiliates related to the joint venture.
C) Associate
Headwater Exploration Inc.
The Company holds a 26 percent interest in Headwater Exploration Inc. (“Headwater”), a publicly traded exploration and production company, which is engaged in the development of the Marten Hills assets in northern Alberta. The Company’s share of equity investment income (loss) related to the associate is included in the Consolidated Statements of Earnings (Loss) in the Corporate and Eliminations segment.
Summarized below is the financial information for Headwater accounted for using the equity method.
| | | | | | | | | | | | | | | | | | | | | | | |
| Three Months Ended | | | Six Months Ended | |
| For the periods ended June 30, | | 2021 | | | | 2021 | |
Net Earnings (Loss) (1) | | (13) | | | | (7) | |
| Share of Equity Investment | | 26 | % | | | | 26 | % | |
| Proportionate Share of Equity Investment | | (4) | | | | (2) | |
(1)Represents the three and six month periods based on the prior quarter's release results due to the timing of reporting dates.
| | | | | |
| Cenovus Energy Inc. – Q2 2021 Interim Consolidated Financial Statements | 26 |
NOTES TO CONSOLIDATED FINANCIAL STATEMENTS (unaudited)
All amounts in $ millions, unless otherwise indicated
For the periods ended June 30, 2021
| | | | | | | | | | | | | | | | | | | | | | | |
| As at | June 30,
2021 | | | December 31, 2020 | |
| Intangible Assets | | 83 | | | | 89 | |
| Private Equity Investments (Note 26) | | 52 | | | | 52 | |
| Net Investment in Finance Leases | | 62 | | | | 52 | |
Long-Term Receivables and Prepaids (1) | | 136 | | | | 11 | |
| Precious Metals | | 91 | | | | — | |
| Other | | 39 | | | | 12 | |
| | 463 | | | | 216 | |
(1)Includes insurance proceeds of $95 million, acquired through the Arrangement, related to an incident at the Superior Refinery in 2018.
| | | | | | | | | | | |
| Total | |
| As at December 31, 2020 | | 63 | |
Re-measurement (1) | | 436 | |
| Liabilities Settled or Payable | | (123) | |
| As at June 30, 2021 | | 376 | |
(1) Contingent payment is carried at fair value. Changes in fair value are recorded in net earnings.
In connection with the acquisition (the “Acquisition in 2017”) from ConocoPhillips Company and certain of its subsidiaries (collectively, “ConocoPhillips”), Cenovus agreed to make quarterly payments to ConocoPhillips during the five years ending May 17, 2022, for quarters in which the average Western Canadian Select (“WCS”) crude oil price exceeds $52.00 per barrel during the quarter. The quarterly payment will be $6 million for each dollar that the WCS price exceeds $52.00 per barrel. The calculation includes an adjustment mechanism related to certain significant production outages at Foster Creek and Christina Lake, which may reduce the amount of a contingent payment. There are no maximum payment terms. As at June 30, 2021, $90 million is payable under this agreement (December 31, 2020 – $nil).
| | |
|
| 18. DEBT AND CAPITAL STRUCTURE |
A) Short-Term Borrowings
| | | | | | | | | | | | | | | | | | | | | | | | | | | | | | | | | | | |
| As at | | | Notes | | June 30,
2021 | | | December 31, 2020 | |
| Uncommitted Demand Facilities | | | i | | | — | | | | — | |
| WRB Uncommitted Demand Facilities | | | ii | | | 65 | | | | 121 | |
| Sunrise Uncommitted Demand Credit Facility | | iii | | | — | | | | — | |
| Total Debt Principal | | | | | | 65 | | | | 121 | |
i) Uncommitted Demand Facilities
At closing of the Arrangement on January 1, 2021, the Company assumed Husky’s uncommitted demand facilities of $975 million, of which $850 million may be drawn for general purposes, or the full amount can be available to issue letters of credit. As at January 1, 2021, $40 million was outstanding. In addition, there were outstanding letters of credit as at January 1, 2021, aggregating to $427 million.
As at June 30, 2021, the Company has uncommitted demand facilities of $2.5 billion (December 31, 2020 – $1.6 billion) in place, of which $1.5 billion (December 31, 2020 – $600 million) may be drawn for general purposes, or the full amount can be available to issue letters of credit. As at June 30, 2021, there were outstanding letters of credit aggregating to $532 million (December 31, 2020 – $441 million).
ii) WRB Uncommitted Demand Facilities
WRB has uncommitted demand facilities of US$300 million (the Company’s proportionate share – US$150 million) available to cover short-term working capital requirements.
| | | | | |
| Cenovus Energy Inc. – Q2 2021 Interim Consolidated Financial Statements | 27 |
NOTES TO CONSOLIDATED FINANCIAL STATEMENTS (unaudited)
All amounts in $ millions, unless otherwise indicated
For the periods ended June 30, 2021
iii) Sunrise Uncommitted Demand Credit Facility
Sunrise has an uncommitted demand credit facility of $10 million (the Company’s proportionate share – $5 million) available for general purposes.
B) Long-Term Debt
| | | | | | | | | | | | | | | | | | | | | | | | | | | | | | | | | | | |
| As at | | | Notes | | June 30, 2021 | | | December 31, 2020 | |
Revolving Term Debt (1) | | | i | | | — | | | | — | |
| Canadian Dollar Unsecured Notes | | | ii | | | 2,750 | | | | — | |
| U.S. Dollar Denominated Unsecured Notes | | | ii | | | 10,269 | | | | 7,510 | |
| Total Debt Principal | | | | | | 13,019 | | | | 7,510 | |
Net Debt Premiums (Discounts) and Transaction Costs (2) | | | | | | 361 | | | | (69) | |
| Long-Term Debt | | | | | | 13,380 | | | | 7,441 | |
| Less: Current Portion | | | | | | 632 | | | | — | |
| Long-Term Portion | | | | | | 12,748 | | | | 7,441 | |
(1)Revolving term debt may include Bankers’ Acceptances, London Interbank Offered Rate based loans, prime rate loans and U.S. base rate loans.
(2)Includes $426 million net debt premiums related to the Canadian and U.S. dollar denominated unsecured notes assumed at fair value in the Arrangement.
On March 31, 2021, Cenovus Energy Inc. and Husky Energy Inc. amalgamated and Cenovus Energy Inc. became the direct obligor on all of Husky's unsecured notes.
On June 7, 2021, pledges of certain intercompany obligations owing to Cenovus Energy Inc. and made in favour of holders of its 4.00 percent notes due in 2024, 3.55 percent notes due in 2025, 3.60 percent notes due in 2027, 3.50 percent notes due in 2028, 4.40 percent notes due in 2029 and 6.80 percent notes due in 2037 (the “Notes”) were terminated in accordance with their respective terms. The Notes were previously issued by Husky Energy Inc. and became the direct obligation of Cenovus Energy Inc. upon the amalgamation of Cenovus Energy Inc. and Husky Energy Inc. on March 31, 2021. Upon each original issuance of the Notes, the proceeds of the Notes were advanced to Husky Oil Operations Limited (“HOOL”), a subsidiary of Husky Energy Inc. HOOL issued to Husky Energy Inc. a promissory note in the amount of such proceeds, the payment thereunder guaranteed by Husky Oil Limited Partnership (“HOLP”). Each of the HOOL notes and HOLP guarantees were then pledged by Husky in favour of the holders of the respective Notes. The pledges were released in accordance with the mechanics outlined in their respective Trust Indentures and pledge documents. These notes continue to be unsecured and unsubordinated obligations, and rank equally and ratably in right of payment with all of Cenovus’s other unsecured and unsubordinated indebtedness.
As at June 30, 2021, the Company is in compliance with all of the terms of its debt agreements. Under the terms of Cenovus’s committed credit facilities, the Company is required to maintain a total debt to capitalization ratio, as defined in the agreements, not to exceed 65 percent. The Company is well below this limit.
i) Committed Credit Facilities
At closing of the Arrangement on January 1, 2021, the Company assumed Husky’s committed credit facilities of $4.0 billion. As at January 1, 2021, $350 million was outstanding.
As at June 30, 2021, the Company had in place committed credit facilities of $8.5 billion, including those assumed in the Arrangement, as follows:
•$2.0 billion committed credit facility with a maturity date of June 19, 2022.
•$4.5 billion committed credit facility with a $1.2 billion tranche with a maturity date of November 30, 2022 and a $3.3 billion tranche with a maturity date of November 30, 2023.
•$2.0 billion committed credit facility with a maturity date of March 9, 2024.
ii) Canadian Dollar Unsecured Notes and U.S. Dollar Denominated Unsecured Notes
At closing of the Arrangement on January 1, 2021, the Company assumed Husky’s Canadian dollar unsecured notes with a fair value of $2.9 billion (notional value – $2.8 billion) and U.S. dollar denominated unsecured notes with a fair value of $3.4 billion (notional value – US$2.4 billion or C$3.0 billion).
| | | | | |
| Cenovus Energy Inc. – Q2 2021 Interim Consolidated Financial Statements | 28 |
NOTES TO CONSOLIDATED FINANCIAL STATEMENTS (unaudited)
All amounts in $ millions, unless otherwise indicated
For the periods ended June 30, 2021
The principal amounts of the Company’s Canadian dollar unsecured notes are:
| | | | | | | | | | | | | | | | | | | | | | | |
| As at | June 30,
2021 | | | December 31, 2020 | |
| 3.55% due March 12, 2025 | | 750 | | | | — | |
| 3.60% due March 10, 2027 | | 750 | | | | — | |
| 3.50% due February 7, 2028 | | 1,250 | | | | — | |
| | 2,750 | | | | — | |
The principal amounts of the Company’s U.S. dollar denominated unsecured notes are: | | | | | | | | | | | | | | | | | | | | | | | | | | | | | | | | | | | | | | | | | | | | | | | |
| June 30, 2021 | | | December 31, 2020 | |
| As at | US$ Principal Amount | | | Total C$ Equivalent | | | US$ Principal Amount | | | Total C$ Equivalent | |
| 3.95% due April 15, 2022 | | 500 | | | | 620 | | | | — | | | | — | |
| 3.00% due August 15, 2022 | | 500 | | | | 620 | | | | 500 | | | | 637 | |
| 3.80% due September 15, 2023 | | 450 | | | | 558 | | | | 450 | | | | 573 | |
| 4.00% due April 15, 2024 | | 750 | | | | 930 | | | | — | | | | — | |
| 5.38% due July 15, 2025 | | 1,000 | | | | 1,239 | | | | 1,000 | | | | 1,273 | |
| 4.25% due April 15, 2027 | | 962 | | | | 1,192 | | | | 962 | | | | 1,225 | |
| 4.40% due April 15, 2029 | | 750 | | | | 930 | | | | — | | | | — | |
| 5.25% due June 15, 2037 | | 583 | | | | 723 | | | | 583 | | | | 742 | |
| 6.80% due September 15, 2037 | | 387 | | | | 479 | | | | — | | | | — | |
| 6.75% due November 15, 2039 | | 1,390 | | | | 1,723 | | | | 1,390 | | | | 1,770 | |
| 4.45% due September 15, 2042 | | 155 | | | | 192 | | | | 155 | | | | 198 | |
| 5.20% due September 15, 2043 | | 58 | | | | 72 | | | | 58 | | | | 74 | |
| 5.40% due June 15, 2047 | | 800 | | | | 991 | | | | 800 | | | | 1,018 | |
| | 8,285 | | | | 10,269 | | | | 5,898 | | | | 7,510 | |
C) Capital Structure
Cenovus’s capital structure objectives remain unchanged from previous periods. Cenovus’s capital structure consists of shareholders’ equity plus Net Debt. Net Debt includes the Company’s short-term borrowings, and the current and long-term portions of long-term debt, net of cash and cash equivalents and short-term investments. The Company’s objectives when managing its capital structure are to maintain financial flexibility, preserve access to capital markets, ensure its ability to finance internally generated growth and to fund potential acquisitions while maintaining the ability to meet the Company’s financial obligations as they come due. To ensure financial resilience, Cenovus may, among other actions, adjust capital and operating spending, draw down on its credit facilities or repay existing debt, adjust dividends paid to shareholders, purchase the Company’s common shares or preferred shares for cancellation, issue new debt, or issue new shares.
Cenovus monitors its capital structure and financing requirements using, among other things, non-GAAP financial metrics consisting of Net Debt to Adjusted Earnings Before Interest, Taxes and DD&A (“Adjusted EBITDA”) and Net Debt to Capitalization. These metrics are used to steward Cenovus’s overall debt position as measures of Cenovus’s overall financial strength.
Cenovus targets a Net Debt to Adjusted EBITDA ratio of less than 2.0 times over the long-term. This ratio may periodically rise above the target due to factors such as persistently low commodity prices.
| | | | | |
| Cenovus Energy Inc. – Q2 2021 Interim Consolidated Financial Statements | 29 |
NOTES TO CONSOLIDATED FINANCIAL STATEMENTS (unaudited)
All amounts in $ millions, unless otherwise indicated
For the periods ended June 30, 2021
Net Debt to Adjusted EBITDA
| | | | | | | | | | | | | | | | | | | | | | | |
| As at | June 30,
2021 | | | December 31, 2020 (1) | |
| Short-Term Borrowings | | 65 | | | | 121 | |
| Current Portion of Long-Term Debt | | 632 | | | | — | |
| Long-Term Portion of Long-Term Debt | | 12,748 | | | | 7,441 | |
| Less: Cash and Cash Equivalents | | (1,055) | | | | (378) | |
| Net Debt | | 12,390 | | | | 7,184 | |
| | | | | | | |
| Net Earnings (Loss) | | 97 | | | | (2,379) | |
| Add (Deduct): | | | | | | | |
| Finance Costs | | 766 | | | | 536 | |
| Interest Income | | (14) | | | | (9) | |
| Income Tax Expense (Recovery) | | (185) | | | | (851) | |
| Depreciation, Depletion and Amortization | | 4,022 | | | | 3,464 | |
| Exploration Expense | | 95 | | | | 91 | |
| Unrealized (Gain) Loss on Risk Management | | 167 | | | | 56 | |
| Foreign Exchange (Gain) Loss, Net | | (797) | | | | (181) | |
| Re-measurement of Contingent Payment | | 422 | | | | (80) | |
| (Gain) Loss on Divestitures of Assets | | (154) | | | | (81) | |
| Other (Income) Loss, Net | | (23) | | | | 40 | |
| Share of (Income) Loss From Equity-Accounted Affiliates | | (27) | | | | — | |
Adjusted EBITDA (2) | | 4,369 | | | | 606 | |
| | | | | | | |
| Net Debt to Adjusted EBITDA | | 2.8x | | | | 11.9x | |
(1) Comparative figures include Cenovus results prior to the closing of the Arrangement on January 1, 2021, and does not reflect any historical data from Husky.
(2) Calculated on a trailing twelve-month basis.
Net Debt to Capitalization
| | | | | | | | | | | | | | | | | | | | | | | |
| As at | June 30,
2021 | | | December 31, 2020 (1) | |
| Net Debt | | 12,390 | | | | 7,184 | |
| Shareholders’ Equity | | 23,629 | | | | 16,707 | |
| | 36,019 | | | | 23,891 | |
| | | | | | | |
| Net Debt to Capitalization | | 34 | % | | | | 30 | % | |
(1) Comparative figures include Cenovus results prior to the closing of the Arrangement on January 1, 2021, and does not reflect any historical data from Husky.
| | | | | | | | | | | |
| Total | |
| As at December 31, 2020 | | 1,757 | |
| Acquisition (Note 4) | | 1,441 | |
| Additions | | 58 | |
| Interest Expense (Note 6) | | 86 | |
| Lease Payments | | (238) | |
| Modifications | | 6 | |
| Re-measurement | | (3) | |
| Exchange Rate Movements and Other | | (20) | |
| As at June 30, 2021 | | 3,087 | |
| Less: Current Portion | | 280 | |
| Long-Term Portion | | 2,807 | |
| | | | | |
| Cenovus Energy Inc. – Q2 2021 Interim Consolidated Financial Statements | 30 |
NOTES TO CONSOLIDATED FINANCIAL STATEMENTS (unaudited)
All amounts in $ millions, unless otherwise indicated
For the periods ended June 30, 2021
The Company has lease liabilities for contracts related to office space, transportation and storage assets, which includes barges, vessels, pipelines, caverns, railcars and storage tanks, retail assets and other refining and field equipment. Lease terms are negotiated on an individual basis and contain a wide range of different terms and conditions.
The Company has variable lease payments related to property taxes for real estate contracts. Short-term leases are leases with terms of twelve months or less.
The Company has included extension options in the calculation of lease liabilities where the Company has the right to extend a lease term at its discretion and is reasonably certain to exercise the extension option. The Company does not have any significant termination options and the residual amounts are not material.
| | |
|
| 20. DECOMMISSIONING LIABILITIES |
The decommissioning provision represents the present value of the expected future costs associated with the retirement of producing well sites, upstream processing facilities, surface and subsea plant and equipment, manufacturing facilities, retail and the crude-by-rail terminal.
The aggregate carrying amount of the obligation is:
| | | | | | | | | | | |
| Total | |
| As at December 31, 2020 | | 1,248 | |
| Acquisition (Note 4) | | 2,560 | |
| Liabilities Incurred | | 12 | |
| Liabilities Acquired | | 2 | |
| Liabilities Settled | | (46) | |
| Liabilities Disposed | | (11) | |
| Change in Estimated Future Cash Flows | | 4 | |
| Unwinding of Discount on Decommissioning Liabilities (Note 6) | | 94 | |
| Foreign Currency Translation | | (4) | |
| As at June 30, 2021 | | 3,859 | |
The undiscounted amount of estimated future cash flows required to settle the obligation has been discounted using a credit-adjusted risk-free rate of 5.0 percent as at June 30, 2021 (December 31, 2020 – 5.0 percent). The Company expects to settle approximately $150 million of decommissioning liabilities in 2021.
The Company deposits cash into restricted accounts that will be used to fund decommissioning liabilities in offshore China in accordance with the provisions of the regulations of the People’s Republic of China.
| | | | | | | | | | | | | | | | | | | | | | | |
| As at | June 30,
2021 | | | December 31, 2020 | |
| Pension and Other Post-Employment Benefit Plan | | 303 | | | | 91 | |
Provision for West White Rose Expansion Project | | 259 | | | | — | |
| Provisions for Onerous Contracts | | 117 | | | | 39 | |
| Employee Long-Term Incentives | | 68 | | | | 33 | |
| Drilling Provisions | | 56 | | | | — | |
| Deferred Revenue | | 41 | | | | — | |
| Other | | 88 | | | | 18 | |
| | 932 | | | | 181 | |
| | | | | |
| Cenovus Energy Inc. – Q2 2021 Interim Consolidated Financial Statements | 31 |
NOTES TO CONSOLIDATED FINANCIAL STATEMENTS (unaudited)
All amounts in $ millions, unless otherwise indicated
For the periods ended June 30, 2021
| | |
|
| 22. SHARE CAPITAL AND WARRANTS |
A) Authorized
Cenovus is authorized to issue an unlimited number of common shares, and first and second preferred shares not exceeding, in aggregate, 20 percent of the number of issued and outstanding common shares. The first and second preferred shares may be issued in one or more series with rights and conditions to be determined by the Company’s Board of Directors prior to issuance and subject to the Company’s articles. Prior to the close of the Arrangement, Cenovus’s articles were amended to create the Cenovus series 1, 2, 3, 4, 5, 6, 7 and 8 first preferred shares.
B) Issued and Outstanding – Common Shares
| | | | | | | | | | | | | | | | | | | | | | | | | | | | | | | | | | | | | | | | | | | | | | | |
| June 30, 2021 | | | December 31, 2020 | |
| As at | Number of Common Shares (thousands) | | | Amount | | | Number of Common Shares (thousands) | | | Amount | |
| Outstanding, Beginning of Year | | 1,228,870 | | | | 11,040 | | | | 1,228,828 | | | | 11,040 | |
| Issued Under the Arrangement (Note 4) | | 788,518 | | | | 6,111 | | | | — | | | | — | |
| Issued Upon Exercise of Warrants (Note 22D) | | 183 | | | | 2 | | | | — | | | | — | |
| Issued Under Stock Option Plans (Note 24) | | 34 | | | | — | | | | 42 | | | | — | |
| Outstanding, End of Period | | 2,017,605 | | | | 17,153 | | | | 1,228,870 | | | | 11,040 | |
As at June 30, 2021, there were 30 million (December 31, 2020 – 27 million) common shares available for future issuance under the stock option plan.
C) Issued and Outstanding – Preferred Shares
| | | | | | | | | | | | | | | | | | | | | | | |
| June 30, 2021 | |
| As at | Number of Preferred Shares (thousands) | | | Amount | |
| Outstanding, Beginning of Year | | — | | | | — | |
| Issued Under the Arrangement (Note 4) | | 36,000 | | | | 519 | |
| Outstanding, End of Period | | 36,000 | | | | 519 | |
| | | | | | | | | | | | | | | | | | | | | | | | | | | | | |
| June 30, 2021 | |
| As at | Dividend Reset Date | | Dividend Rate | | | Number of Preferred Shares (thousands) | |
| Series 1 First Preferred Shares | March 31, 2026 | | | 2.58 | % | | | | 10,740 | |
| Series 2 First Preferred Shares | March 31, 2026 | | | 1.84 | % | | | | 1,260 | |
| Series 3 First Preferred Shares | December 31, 2024 | | | 4.69 | % | | | | 10,000 | |
| Series 5 First Preferred Shares | March 31, 2025 | | | 4.59 | % | | | | 8,000 | |
| Series 7 First Preferred Shares | June 30, 2025 | | | 3.94 | % | | | | 6,000 | |
Cenovus Series 1 First Preferred Shares
In March 2021, 274 thousand series 1 first preferred shares were tendered for conversion into series 2 first preferred shares. The new annual fixed-rate dividend applicable to the series 1 first preferred shares for the five-year period commencing March 31, 2021 to March 30, 2026, is 2.58 percent, being equal to the sum of the Government of Canada five-year bond yield of 0.85 percent plus 1.73 percent in accordance with the terms of the series 1 first preferred shares. The annual fixed-rate dividend was 2.40 percent for the previous period ending March 30, 2021.
| | | | | |
| Cenovus Energy Inc. – Q2 2021 Interim Consolidated Financial Statements | 32 |
NOTES TO CONSOLIDATED FINANCIAL STATEMENTS (unaudited)
All amounts in $ millions, unless otherwise indicated
For the periods ended June 30, 2021
Cenovus Series 2 First Preferred Shares
In March 2021, 578 thousand series 2 first preferred shares were tendered for conversion into series 1 first preferred shares. Holders of the series 2 first preferred shares will be entitled to receive cumulative quarterly floating dividends, reset every quarter, at a rate equal to the 90-day Government of Canada Treasury Bill yield plus 1.73 percent. The floating-rate dividend was 1.80 percent for the previous period ending June 29, 2021. The new quarterly floating-rate dividend applicable for the period commencing June 30, 2021 to September 29, 2021 is 1.84 percent.
Cenovus Series 3 First Preferred Shares
The dividend rate will be reset every five years at the rate equal to the five-year Government of Canada bond yield plus 3.13 percent. Holders of series 3 first preferred shares will have the right, at their option, to convert their shares into series 4 first preferred shares, subject to certain conditions, on December 31, 2024, and on December 31 every five years thereafter. Holders of the series 4 first preferred shares will be entitled to receive cumulative quarterly floating dividends, reset every quarter, at a rate equal to the 90-day Government of Canada Treasury Bill yield plus 3.13 percent.
Cenovus Series 5 First Preferred Shares
The dividend rate will be reset every five years at the rate equal to the five-year Government of Canada bond yield plus 3.57 percent. Holders of series 5 first preferred shares will have the right, at their option, to convert their shares into series 6 first preferred shares, subject to certain conditions, on March 31, 2025, and on March 31 every five years thereafter. Holders of the series 6 first preferred shares will be entitled to receive cumulative quarterly floating dividends, reset every quarter, at a rate equal to the 90-day Government of Canada Treasury Bill yield plus 3.57 percent.
Cenovus Series 7 First Preferred Shares
The dividend rate will be reset every five years at the rate equal to the five-year Government of Canada bond yield plus 3.52 percent. Holders of series 7 first preferred shares will have the right, at their option, to convert their shares into series 8 first preferred shares, subject to certain conditions, on June 30, 2025, and on June 30 every five years thereafter. Holders of the series 8 first preferred shares will be entitled to receive cumulative quarterly floating dividends, reset every quarter, at a rate equal to the 90-day Government of Canada Treasury Bill yield plus 3.52 percent.
Cenovus Second Preferred Shares
There were no second preferred shares outstanding as at June 30, 2021 (December 31, 2020 – nil).
D) Issued and Outstanding – Warrants
| | | | | | | | | | | | | | | | | | | | | | | |
| June 30, 2021 | |
| As at | Number of Warrants (thousands) | | | Amount | |
| Outstanding, Beginning of Year | | — | | | | — | |
| Issued Under the Arrangement (Note 4) | | 65,433 | | | | 216 | |
| Exercised and Common Shares Issued (Note 22B) | | (183) | | | | — | |
| Outstanding, End of Period | | 65,250 | | | | 216 | |
The exercise price of the warrants issued under the Arrangement was $6.54.
| | | | | |
| Cenovus Energy Inc. – Q2 2021 Interim Consolidated Financial Statements | 33 |
NOTES TO CONSOLIDATED FINANCIAL STATEMENTS (unaudited)
All amounts in $ millions, unless otherwise indicated
For the periods ended June 30, 2021
| | |
|
| 23. ACCUMULATED OTHER COMPREHENSIVE INCOME (LOSS) |
| | | | | | | | | | | | | | | | | | | | | | | | | | | | | | | | | | | | | | | | | | | | | | | |
| Defined Benefit Pension Plan | | | Private Equity Instruments | | | Foreign Currency Translation Adjustment | | | Total | |
| As at December 31, 2019 | | (2) | | | | 27 | | | | 802 | | | | 827 | |
| Other Comprehensive Income (Loss), Before Tax | | (15) | | | | 1 | | | | 223 | | | | 209 | |
| Income Tax Expense | | 3 | | | | — | | | | — | | | | 3 | |
| As at June 30, 2020 | | (14) | | | | 28 | | | | 1,025 | | | | 1,039 | |
| | | | | | | | | | | | | | | |
| As at December 31, 2020 | | (10) | | | | 27 | | | | 758 | | | | 775 | |
| Other Comprehensive Income (Loss), Before Tax | | 28 | | | | (1) | | | | (311) | | | | (284) | |
| Income Tax Expense | | (6) | | | | — | | | | — | | | | (6) | |
| As at June 30, 2021 | | 12 | | | | 26 | | | | 447 | | | | 485 | |
| | |
|
| 24. STOCK-BASED COMPENSATION PLANS |
Cenovus has a number of stock-based compensation plans which include NSRs, Cenovus replacement stock options, PSUs, RSUs and DSUs. In connection with the Arrangement, at the closing of the transaction on January 1, 2021, outstanding Husky stock options were replaced by Cenovus replacement stock options. Each Cenovus replacement stock option entitles the holder to acquire 0.7845 of a Cenovus common share at an exercise price per share of a Husky stock option divided by 0.7845.
The following tables summarize information related to the Company’s stock-based compensation plans:
| | | | | | | | | | | | | | | | | | | | | | | |
| | Units Outstanding | | | | Units Exercisable | |
| As at June 30, 2021 | | (thousands) | | | | (thousands) | |
| Stock Options With Associated Net Settlement Rights | | 27,620 | | | | 17,709 | | |
| Cenovus Replacement Stock Options | | 13,161 | | | | 8,901 | | |
| Performance Share Units | | 7,208 | | | | — | | |
| Restricted Share Units | | 6,282 | | | | — | | |
| Deferred Share Units | | 1,541 | | | | 1,541 | | |
The weighted average exercise price of NSRs and Cenovus replacement stock options outstanding as at June 30, 2021, was $13.19 and $15.00, respectively.
| | | | | | | | | | | | | | | | | | | | | | | |
| | Units Granted | | | | Units Vested and Exercised/ Paid Out | |
| For the six months ended June 30, 2021 | | (thousands) | | | | (thousands) | |
| Stock Options With Associated Net Settlement Rights | | 5,930 | | | | 32 | |
| Cenovus Replacement Stock Options | | 18,882 | | | | 511 | |
| Performance Share Units | | 6,075 | | | | 8,086 | |
| Restricted Share Units | | 6,385 | | | | 8,342 | |
| Deferred Share Units | | 329 | | | | 126 | |
In the six months ended June 30, 2021, 32 thousand NSRs, with a weighted average exercise price of $9.48, were exercised and net settled for cash (see Note 22).
In the six months ended June 30, 2021, two thousand Cenovus replacement stock options were exercised and settled for common shares (see Note 22) and 509 thousand Cenovus replacement stock options, with a weighted average exercise price of $3.54, were exercised and net settled for cash.
| | | | | |
| Cenovus Energy Inc. – Q2 2021 Interim Consolidated Financial Statements | 34 |
NOTES TO CONSOLIDATED FINANCIAL STATEMENTS (unaudited)
All amounts in $ millions, unless otherwise indicated
For the periods ended June 30, 2021
The following table summarizes the stock-based compensation expense (recovery) recorded for all plans:
| | | | | | | | | | | | | | | | | | | | | | | | | | | | | | | | | | | | | | | | | | | | | | | |
| Three Months Ended | | | Six Months Ended | |
| For the periods ended June 30, | | 2021 | | | | 2020 | | | | 2021 | | | | 2020 | |
| Stock Options With Associated Net Settlement Rights | | 3 | | | | 2 | | | | 8 | | | | 6 | |
| Cenovus Replacement Stock Options | | 7 | | | | — | | | | 14 | | | | — | |
| Performance Share Units | | 9 | | | | 15 | | | | 21 | | | | (7) | |
| Restricted Share Units | | 11 | | | | 12 | | | | 17 | | | | (5) | |
| Deferred Share Units | | 4 | | | | 6 | | | | 9 | | | | (6) | |
| Stock-Based Compensation Expense (Recovery) | | 34 | | | | 35 | | | | 69 | | | | (12) | |
| Stock-Based Compensation Costs Capitalized | | 2 | | | | 9 | | | | 3 | | | | (5) | |
| Total Stock-Based Compensation | | 36 | | | | 44 | | | | 72 | | | | (17) | |
| | |
|
| 25. RELATED PARTY TRANSACTIONS |
Transactions with HMLP are related party transactions as the Company has a 35 percent ownership interest in HMLP (see Note 15).
As the operator of the assets held by HMLP, Cenovus provides management services for which it recovers shared service costs.
The Company is also the contractor for HMLP and constructs its assets based on fixed price contracts or a cost recovery basis with certain restrictions. For the six months ended June 30, 2021, the Company charged HMLP $64 million for construction and management services.
The Company pays an access fee to HMLP for pipeline systems that are used by Cenovus’s blending business. Cenovus also pays HMLP for transportation and storage services. For the six months ended June 30, 2021, the Company incurred costs of $145 million for the use of HMLP’s pipeline systems, as well as transportation and storage services.
| | |
|
| 26. FINANCIAL INSTRUMENTS |
Cenovus’s financial assets and financial liabilities consist of cash and cash equivalents, accounts receivable and accrued revenues, restricted cash, net investment in finance leases, accounts payable and accrued liabilities, risk management assets and liabilities, investments in the equity of private companies, long-term receivables, lease liabilities, contingent payment, short-term borrowings and long-term debt. Risk management assets and liabilities arise from the use of derivative financial instruments.
A) Fair Value of Non-Derivative Financial Instruments
The fair values of cash and cash equivalents, accounts receivable and accrued revenues, accounts payable and accrued liabilities, and short-term borrowings approximate their carrying amount due to the short-term maturity of these instruments.
The fair values of restricted cash, long-term receivables and net investment in finance leases approximate their carrying amount due to the specific non-tradeable nature of these instruments.
Long-term debt is carried at amortized cost. The estimated fair value of long-term borrowings has been determined based on period-end trading prices of long-term borrowings on the secondary market (Level 2). As at June 30, 2021, the carrying value of Cenovus’s long-term debt was $13,380 million and the fair value was $14,871 million (December 31, 2020 carrying value – $7,441 million, fair value – $8,608 million).
Equity investments classified as FVOCI comprise equity investments in private companies. The Company classifies certain private equity instruments at FVOCI as they are not held for trading and fair value changes are not reflective of the Company’s operations. These assets are carried at fair value on the Consolidated Balance Sheets in other assets. Fair value is determined based on recent private placement transactions (Level 3) when available.
| | | | | |
| Cenovus Energy Inc. – Q2 2021 Interim Consolidated Financial Statements | 35 |
NOTES TO CONSOLIDATED FINANCIAL STATEMENTS (unaudited)
All amounts in $ millions, unless otherwise indicated
For the periods ended June 30, 2021
The following table provides a reconciliation of changes in the fair value of private equity instruments classified at FVOCI:
| | | | | | | | | | | |
| Total | |
| As at December 31, 2020 | | 52 | |
| Acquisition | | 1 | |
Change in Fair Value (1) | | (1) | |
| As at June 30, 2021 | | 52 | |
(1) Changes in fair value are recorded in OCI.
B) Fair Value of Risk Management Assets and Liabilities
The Company’s risk management assets and liabilities consist of crude oil, natural gas and refined product swaps, futures, forwards and, if entered into, options, as well as condensate futures and swaps, foreign exchange and interest rate swaps. Crude oil, condensate, natural gas and refined product contracts are recorded at their estimated fair value based on the difference between the contracted price and the period-end forward price for the same commodity, using quoted market prices or the period-end forward price for the same commodity extrapolated to the end of the term of the contract (Level 2). The fair value of foreign exchange swaps are calculated using external valuation models which incorporate observable market data, including foreign exchange forward curves (Level 2) and the fair value of interest rate swaps are calculated using external valuation models which incorporate observable market data, including interest rate yield curves (Level 2). The fair value of cross currency interest rate swaps are calculated using external valuation models which incorporate observable market data, including foreign exchange forward curves (Level 2) and interest rate yield curves (Level 2).
Summary of Unrealized Risk Management Positions
| | | | | | | | | | | | | | | | | | | | | | | | | | | | | | | | | | | | | | | | | | | | | | | | | | | | | | | | | | | | | | | | | | | | | | | |
| June 30, 2021 | | | December 31, 2020 | |
| Risk Management | | | Risk Management | |
| As at | Asset | | Liability | | Net | | | Asset | | | Liability | | | Net | |
| Crude Oil, Natural Gas, Condensate and Refined Products | | 21 | | | | 336 | | | | (315) | | | | 5 | | | | 58 | | | | (53) | |
| Exchange Rate Contracts | | — | | | | 3 | | | | (3) | | | | — | | | | — | | | | — | |
| Total Fair Value | | 21 | | | | 339 | | | | (318) | | | | 5 | | | | 58 | | | | (53) | |
The following table presents the Company’s fair value hierarchy for risk management assets and liabilities carried at fair value:
| | | | | | | | | | | | | | | | | | | | | | | |
| As at | | June 30, 2021 | | | December 31, 2020 | |
| Level 2 – Prices Sourced From Observable Data or Market Corroboration | | (318) | | | | (53) | |
Prices sourced from observable data or market corroboration refers to the fair value of contracts valued in part using active quotes and in part using observable, market-corroborated data.
The following table provides a reconciliation of changes in the fair value of Cenovus’s risk management assets and liabilities from January 1 to June 30:
| | | | | | | | | | | |
| 2021 | |
| Fair Value of Contracts, Beginning of Year | | (53) | |
| Acquisition | | (14) | |
| Fair Value of Contracts Realized During the Period | | 541 | |
| Change in Fair Value of Contracts in Place at Beginning of Year and Contracts Entered Into During the Period | | (794) | |
| Unrealized Foreign Exchange Gain (Loss) on U.S. Dollar Contracts | | 2 | |
| Fair Value of Contracts, End of Period | | (318) | |
| | | | | |
| Cenovus Energy Inc. – Q2 2021 Interim Consolidated Financial Statements | 36 |
NOTES TO CONSOLIDATED FINANCIAL STATEMENTS (unaudited)
All amounts in $ millions, unless otherwise indicated
For the periods ended June 30, 2021
C) Fair Value of Contingent Payment
The contingent payment is carried at fair value on the Consolidated Balance Sheets. Fair value is estimated by calculating the present value of the expected future cash flows using an option pricing model (Level 3), which assumes the probability distribution for WCS is based on the volatility of West Texas Intermediate (“WTI”) options, volatility of Canadian-U.S. foreign exchange rate options and both WTI and WCS futures pricing, and discounted at a credit-adjusted risk-free rate of 2.2 percent. Fair value of the contingent payment has been calculated by Cenovus’s internal valuation team that consists of individuals who are knowledgeable and have experience in fair value techniques. As at June 30, 2021, the fair value of the contingent payment was estimated to be $376 million (December 31, 2020 – $63 million).
As at June 30, 2021, average WCS forward pricing for the remaining term of the contingent payment is $69.35 per barrel. The average implied volatility of WTI options and the Canadian-U.S. dollar foreign exchange rate options used to value the contingent payment were 31.9 percent and 6.4 percent, respectively.
Changes in the following inputs to the option pricing model, with fluctuations in all other variables held constant, could have resulted in unrealized gains (losses) impacting earnings before income tax as follows:
| | | | | | | | | | | | | | | | | | | | | | | | | | | | | |
| As at June 30, 2021 | Sensitivity Range | | | Increase | | | | Decrease | |
| WCS Forward Prices | ± $5.00 per barrel | | | (101) | | | | 97 | |
| WTI Option Implied Volatility | ± five percent | | | (5) | | | | 4 | |
| Canadian to U.S. Dollar Foreign Exchange Rate Option Implied Volatility | ± five percent | | | — | | | | (1) | |
D) Earnings Impact of (Gains) Losses From Risk Management Positions
| | | | | | | | | | | | | | | | | | | | | | | | | | | | | | | | | | | | | | | | | | | | | | | |
| Three Months Ended | | | Six Months Ended | |
| For the periods ended June 30, | | 2021 | | | | 2020 | | | | 2021 | | | | 2020 | |
| Realized (Gain) Loss | | 199 | | | | 59 | | | | 541 | | | | 88 | |
| Unrealized (Gain) Loss | | 401 | | | | 120 | | | | 253 | | | | 142 | |
(Gain) Loss on Risk Management | | 600 | | | | 179 | | | | 794 | | | | 230 | |
Realized and unrealized gains and losses on risk management are recorded in the reportable segment to which the derivative instrument relates.
Cenovus is exposed to financial risks, including market risk related to commodity prices, foreign exchange rates, interest rates as well as credit risk and liquidity risk.
A) Commodity Price, Interest Rate and Foreign Currency Risk
To manage exposure to interest rate volatility, the Company may periodically enter into interest rate swap contracts. To mitigate the Company’s exposure to foreign exchange rate fluctuations, the Company periodically enters into foreign exchange contracts. To manage interest costs on short-term borrowings, the Company periodically enters into cross currency interest rate swaps. As at June 30, 2021, there were foreign exchange contracts with a notional value of US$216 million outstanding. As at June 30, 2021, there were no interest rate or cross currency interest rate swap contracts outstanding.
To manage exposure to commodity price movements between when products are produced or purchased and when sold to the customer or used by Cenovus, the Company may periodically enter into financial positions as a part of ongoing operations to market the Company’s production and physical inventory positions of crude oil and condensate volumes. The Company has entered into risk management positions to both help capture incremental margin expected to be received in future periods at the time products will be sold and to mitigate overall exposure to fluctuations in commodity prices related to inventories and physical sales. Mitigation of commodity price volatility may utilize financial positions to protect both near-term and future cash flows. As at June 30, 2021, the fair value of financial positions was a net liability of $318 million and primarily consisted of crude oil, condensate, natural gas and foreign exchange rate instruments.
| | | | | |
| Cenovus Energy Inc. – Q2 2021 Interim Consolidated Financial Statements | 37 |
NOTES TO CONSOLIDATED FINANCIAL STATEMENTS (unaudited)
All amounts in $ millions, unless otherwise indicated
For the periods ended June 30, 2021
Net Fair Value of Risk Management Positions
| | | | | | | | | | | | | | | | | | | | | | | | | | | | | | | | | | | | | | |
| As at June 30, 2021 | Notional Volumes (1) (2) | | Terms (3) | | Weighted Average Price (1) | | Fair Value Asset (Liability) | |
| Crude Oil and Condensate Contracts | | | | | | | | | | | | |
| WTI Fixed - Sell | 55.5 MMbbls | | | July 2021 - September 2022 | | | US$65.21/bbl | | | | (493) | |
| WTI Fixed - Buy | 19.4 MMbbls | | | July 2021 - September 2022 | | | US$66.08/bbl | | | | 156 | |
Other Financial Positions (4) | | | | | | | | | | | 22 | |
| Foreign Exchange Contracts | | | | | | | | | | | (3) | |
| Total Fair Value | | | | | | | | | | | (318) | |
(1) Million barrels (“MMbbls”). Barrel (“bbl”).
(2) Notional volumes and weighted average price represent various contracts over the respective terms. The notional volumes and weighted average price may fluctuate from month to month as it represents the averages for various individual contracts with different terms.
(3) Contract terms represents averages for various individual contracts with different terms and range from one to eighteen months.
(4) Other financial positions consist of risk management positions related to WCS and condensate differential contracts, Belvieu fixed contracts, reformulated blendstock for oxygenate blending gasoline contracts, heating oil and natural gas fixed price contracts, the Company’s U.S. Manufacturing segment and marketing activities.
Sensitivities
The following table summarizes the sensitivity of the fair value of Cenovus’s risk management positions to independent fluctuations in commodity prices and foreign exchange rates, with all other variables held constant. Management believes the fluctuations identified in the table below are a reasonable measure of volatility. The impact of fluctuating commodity prices on the Company’s open risk management positions could have resulted in an unrealized gain (loss) impacting earnings before income tax as follows:
| | | | | | | | | | | | | | | | | | | | | | | | | | | | | |
| As at June 30, 2021 | Sensitivity Range | | | Increase | | | | Decrease | |
| Crude Oil Commodity Price | ± US$5.00/bbl Applied to WTI, Condensate and Related Hedges | | | (205) | | | | 205 | |
| WCS and Condensate Differential Price | ± US$2.50/bbl Applied to WCS and Differential Hedges Tied to Production | | | 12 | | | | (12) | |
| Refined Products Commodity Price | ± US$5.00/bbl Applied to Heating Oil and Gasoline Hedges | | | (1) | | | | 1 | |
| U.S. to Canadian Dollar Exchange Rate | ± 0.05 in the U.S. to Canadian Dollar Exchange Rate | | | 11 | | | | (11) | |
B) Credit Risk
Credit risk arises from the potential that the Company may incur a financial loss if a counterparty to a financial instrument fails to meet its financial or performance obligations in accordance with agreed terms. Cenovus has in place a Credit Policy approved by the Audit Committee and the Board of Directors designed to ensure that its credit exposures are within an acceptable risk level. The Credit Policy outlines the roles and responsibilities related to credit risk, sets a framework for how credit exposures will be measured, monitored and mitigated, and sets parameters around credit concentration limits.
Cenovus assesses the credit risk of new counterparties and continues risk-based monitoring of all counterparties on an ongoing basis. A substantial portion of Cenovus’s accounts receivable are with customers in the oil and gas industry and are subject to normal industry credit risks. Cenovus’s exposure to its counterparties is within credit policy tolerances. The maximum credit risk exposure associated with accounts receivable and accrued revenues, net investment in finance leases, risk management assets and long-term receivables is the total carrying value.
As at June 30, 2021, approximately 89 percent of the Company’s accruals, joint ventures and joint operations, trade receivables and net investment in finance leases were investment grade, and substantially all of the Company’s accounts receivable were outstanding for less than 60 days. The average expected credit loss on the Company’s accruals, joint ventures and joint operations, trade receivables and net investment in finance leases was 1.7 percent as at June 30, 2021 (December 31, 2020 – 0.5 percent).
C) Liquidity Risk
Liquidity risk is the risk that the Company will not be able to meet all of its financial obligations as they become due. Liquidity risk also includes the risk of not being able to liquidate assets in a timely manner at a reasonable price. Cenovus manages its liquidity risk through the active management of cash and debt and by maintaining appropriate access to credit, which may be impacted by the Company’s credit ratings. As disclosed in Note 18, over the long term, Cenovus targets a Net Debt to Adjusted EBITDA of less than 2.0 times to manage the Company’s overall debt position.
| | | | | |
| Cenovus Energy Inc. – Q2 2021 Interim Consolidated Financial Statements | 38 |
NOTES TO CONSOLIDATED FINANCIAL STATEMENTS (unaudited)
All amounts in $ millions, unless otherwise indicated
For the periods ended June 30, 2021
Undiscounted cash outflows relating to financial liabilities are:
| | | | | | | | | | | | | | | | | | | | | | | | | | | | | | | | | | | | | | | | | | | | | | | | | | | | | | | | | | | |
| As at June 30, 2021 | Less Than 1 Year | | | Years 2 and 3 | | | | Years 4 and 5 | | Thereafter | | | Total | |
| Accounts Payable and Accrued Liabilities | | 5,188 | | | | — | | | | — | | | | — | | | | 5,188 | |
Short-Term Borrowings (1) | | 65 | | | | — | | | | — | | | | — | | | | 65 | |
Long-Term Debt (1) | | 1,229 | | | | 3,239 | | | | 2,946 | | | | 12,284 | | | | 19,698 | |
| Contingent Payment | | 380 | | | | — | | | | — | | | | — | | | | 380 | |
| Lease Liabilities | | 447 | | | | 771 | | | | 647 | | | | 3,292 | | | | 5,157 | |
| | | | | | | | | | | | | | | | | | | |
| As at December 31, 2020 | Less Than 1 Year | | | Years 2 and 3 | | | | Years 4 and 5 | | Thereafter | | | Total | |
| Accounts Payable and Accrued Liabilities | | 2,018 | | | | — | | | | — | | | | — | | | | 2,018 | |
Short-Term Borrowings (1) | | 121 | | | | — | | | | — | | | | — | | | | 121 | |
Long-Term Debt (1) | | 385 | | | | 1,965 | | | | 1,966 | | | | 8,627 | | | | 12,943 | |
| Contingent Payment | | 36 | | | | 28 | | | | — | | | | — | | | | 64 | |
| Lease Liabilities | | 254 | | | | 445 | | | | 365 | | | | 1,412 | | | | 2,476 | |
(1) Principal and interest, including current portion if applicable.
| | |
|
| 28. SUPPLEMENTARY CASH FLOW INFORMATION |
A) Non-Cash Working Capital
Changes in non-cash working capital is as follows:
| | | | | | | | | | | | | | | | | | | | | | | | | | | | | | | | | | | | | | | | | | | | | | | |
| Three Months Ended | | | Six Months Ended | |
| For the periods ended June 30, | | 2021 | | | | 2020 | | | | 2021 | | | | 2020 | |
| Accounts Receivable and Accrued Revenues | | (221) | | | | (572) | | | | (874) | | | | 174 | |
| Income Tax Receivable | | 4 | | | | 2 | | | | 13 | | | | — | |
| Inventories | | (406) | | | | 113 | | | | (1,014) | | | | 481 | |
| Accounts Payable and Accrued Liabilities | | 237 | | | | 35 | | | | 640 | | | | (770) | |
| Income Tax Payable | | (3) | | | | (1) | | | | (45) | | | | (5) | |
| Total Non-Cash Working Capital | | (389) | | | | (423) | | | | (1,280) | | | | (120) | |
| | | | | | | | | | | | | | | |
| Cash From (Used in) Operating | | (430) | | | | (363) | | | | (1,332) | | | | (53) | |
| Cash From (Used in) Investing | | 41 | | | | (60) | | | | 52 | | | | (67) | |
| Total Non-Cash Working Capital | | (389) | | | | (423) | | | | (1,280) | | | | (120) | |
| | | | | |
| Cenovus Energy Inc. – Q2 2021 Interim Consolidated Financial Statements | 39 |
NOTES TO CONSOLIDATED FINANCIAL STATEMENTS (unaudited)
All amounts in $ millions, unless otherwise indicated
For the periods ended June 30, 2021
B) Reconciliation of Liabilities
The following table provides a reconciliation of liabilities to cash flows arising from financing activities:
| | | | | | | | | | | | | | | | | | | | | | | | | | | | | | | | | | | | | | | | | | | | | | | |
| Dividends Payable | | | Short-Term Borrowings | | | Long-Term Debt | | | Lease Liabilities | |
| As at December 31, 2019 | | — | | | | — | | | | 6,699 | | | | 1,916 | |
| Changes From Financing Cash Flows: | | | | | | | | | | | | | | | |
| Common Share Dividends Paid | | (77) | | | | — | | | | — | | | | — | |
| Net Issuance (Repayment) of Short-Term Borrowings | | — | | | | 292 | | | | — | | | | — | |
| Net Issuance (Repayment) of Long-Term Debt | | — | | | | — | | | | (112) | | | | — | |
Net Issuance (Repayment) of Revolving Long-Term
Debt | | — | | | | — | | | | 1,224 | | | | — | |
| Principal Repayment of Leases | | — | | | | — | | | | — | | | | (104) | |
| Non-Cash Changes: | | | | | | | | | | | | | | | |
| Common Share Dividends Declared | | 77 | | | | — | | | | — | | | | — | |
| Foreign Exchange (Gain) Loss, Net | | — | | | | 7 | | | | 306 | | | | 30 | |
Gain on Repurchase of Debt and Amortization of
Debt Issuance Costs | | — | | | | — | | | | (22) | | | | — | |
| Lease Additions | | — | | | | — | | | | — | | | | 42 | |
| Lease Modifications | | — | | | | — | | | | — | | | | (4) | |
| Lease Re-Measurements | | — | | | | — | | | | — | | | | (17) | |
| Other | | — | | | | — | | | | (10) | | | | — | |
| As at June 30, 2020 | | — | | | | 299 | | | | 8,085 | | | | 1,863 | |
| | | | | | | | | | | | | | | |
| As at December 31, 2020 | | — | | | | 121 | | | | 7,441 | | | | 1,757 | |
| Acquisition (see Note 4) | | — | | | | 40 | | | | 6,602 | | | | 1,441 | |
| Changes From Financing Cash Flows: | | | | | | | | | | | | | | | |
| Common Share Dividends Paid | | (71) | | | | — | | | | — | | | | — | |
| Preferred Share Dividends Paid | | (17) | | | | — | | | | — | | | | — | |
| Net Issuance (Repayment) of Short-Term Borrowings | | — | | | | (89) | | | | (350) | | | | — | |
| | | | | | | | | | | | | | | |
| Principal Repayment of Leases | | — | | | | — | | | | — | | | | (152) | |
| Non-Cash Changes: | | | | | | | | | | | | | | | |
| Common Share Dividends Declared | | 71 | | | | — | | | | — | | | | — | |
| Preferred Share Dividends Declared | | 17 | | | | — | | | | — | | | | — | |
| Foreign Exchange (Gain) Loss, Net | | — | | | | (7) | | | | (280) | | | | (20) | |
| Finance Costs | | — | | | | — | | | | (33) | | | | — | |
| Lease Additions | | — | | | | — | | | | — | | | | 58 | |
| Lease Modifications | | — | | | | — | | | | — | | | | 6 | |
| Lease Re-Measurements | | — | | | | — | | | | — | | | | (3) | |
| As at June 30, 2021 | | — | | | | 65 | | | | 13,380 | | | | 3,087 | |
| | | | | |
| Cenovus Energy Inc. – Q2 2021 Interim Consolidated Financial Statements | 40 |
NOTES TO CONSOLIDATED FINANCIAL STATEMENTS (unaudited)
All amounts in $ millions, unless otherwise indicated
For the periods ended June 30, 2021
| | |
|
| 29. COMMITMENTS AND CONTINGENCIES |
A) Commitments
Cenovus has entered into various commitments in the normal course of operations primarily related to demand charges on firm transportation agreements. In addition, the Company has commitments related to its risk management program and an obligation to fund its defined benefit pension and other post-employment benefit plans.
Future payments for the Company’s commitments are below:
| | | | | | | | | | | | | | | | | | | | | | | | | | | | | | | | | | | | | | | | | | | | | | | | | | | | | | | | | | | | | | | | | | | | | | | | | | | | | | | | | | | |
| As at June 30, 2021 | Remainder of Year | | | 2 Years | | | 3 Years | | | 4 Years | | | 5 Years | | | Thereafter | | | Total | |
Transportation and Storage (1) | | 1,736 | | | | 2,708 | | | | 2,973 | | | | 2,785 | | | | 2,014 | | | | 17,221 | | | | 29,437 | |
| | | | | | | | | | | | | | | | | | | | | | | | | | | |
Real Estate (2) | | 25 | | | | 45 | | | | 46 | | | | 54 | | | | 56 | | | | 714 | | | | 940 | |
Obligation to Fund Equity-Accounted Affiliate (3) | | 26 | | | | 66 | | | | 76 | | | | 77 | | | | 77 | | | | 261 | | | | 583 | |
| | | | | | | | | | | | | | | | | | | | | | | | | | | |
| Other Long-Term Commitments | | 398 | | | | 175 | | | | 159 | | | | 122 | | | | 129 | | | | 1,071 | | | | 2,054 | |
Total Payments (4) | | 2,185 | | | | 2,994 | | | | 3,254 | | | | 3,038 | | | | 2,276 | | | | 19,267 | | | | 33,014 | |
(1) Includes transportation commitments of $8.2 billion (December 31, 2020 – $14.0 billion) that are subject to regulatory approval or have been approved, but are not yet in service. Terms are up to 20 years subsequent to the date of commencement.
(2) Relates to the non-lease components of lease liabilities consisting of operating costs and unreserved parking for office space. Excludes committed payments for which a provision has been provided.
(3) Relates to funding obligations to HCML.
(4) Contracts undertaken on behalf of WRB, Sunrise and Toledo are reflected at Cenovus’s 50 percent interest.
The Arrangement resulted in the assumption of Husky’s non-cancellable contracts and other commercial commitments. As at January 1, 2021, total commitments assumed by Cenovus were $17.6 billion, of which $7.4 billion were for various transportation and storage commitments. Transportation commitments include $1.7 billion that are subject to regulatory approval or have been approved, but are not yet in service.
As at June 30, 2021, the transportation and storage commitments did not include any amounts related to the Keystone XL pipeline due to the cancellation of the Company’s transportation services agreement (December 31, 2020 – $7.0 billion).
As at June 30, 2021, the Company had commitments with HMLP that include $2.8 billion related to transportation, storage and other long-term commitments.
As at June 30, 2021, there were outstanding letters of credit aggregating to $532 million (December 31, 2020 – $441 million) issued as security for financial and performance conditions under certain contracts.
B) Contingencies
Legal Proceedings
Cenovus is involved in a limited number of legal claims associated with the normal course of operations. Cenovus believes that any liabilities that might arise from such matters, to the extent not provided for, are not likely to have a material effect on its Consolidated Financial Statements.
Contingent Payment
In connection with the Acquisition in 2017, Cenovus agreed to make quarterly payments to ConocoPhillips during the five years subsequent to May 17, 2017, for quarters in which the average WCS crude oil price exceeds $52.00 per barrel during the quarter. As at June 30, 2021, the estimated fair value of the contingent payment was $376 million (see Note 17).
| | |
|
| 30. PRIOR YEAR SEGMENTED AND OPERATIONAL INFORMATION |
Segmented information for the year ended December 31, 2020, December 31, 2019, and December 31, 2018, have been re-presented below to reflect the presentation adopted on January 1, 2021, as described in Note 1.
| | | | | |
| Cenovus Energy Inc. – Q2 2021 Interim Consolidated Financial Statements | 41 |
NOTES TO CONSOLIDATED FINANCIAL STATEMENTS (unaudited)
All amounts in $ millions, unless otherwise indicated
For the periods ended June 30, 2021
A) Segmented and Operational Information for 2020
| | | | | | | | | | | | | | | | | | | | | | | | | | | | | | | | | | | | | | | | | | | | | | | | | | | | | | | | | | | | | | | | | | | | | | | |
| Upstream | | | Downstream | |
| For the year ended December 31, 2020 | Oil Sands | | Conventional | | Offshore | | Canadian Manufacturing | | U.S. Manufacturing | | Retail |
| Revenues | | | | | | | | | | | | | | | | | | | | | | | |
| Gross Sales | | 8,481 | | | | 904 | | | | — | | | | 82 | | | | 4,733 | | | | — | |
Less: Royalties (1) | | 331 | | | | 40 | | | | — | | | | — | | | | — | | | | — | |
| | 8,150 | | | | 864 | | | | — | | | | 82 | | | | 4,733 | | | | — | |
| Expenses | | | | | | | | | | | | | | | | | | | | | | | |
Purchased Product (1) | | 939 | | | | 268 | | | | — | | | | — | | | | 4,429 | | | | — | |
Transportation and Blending (1) | | 4,683 | | | | 81 | | | | — | | | | — | | | | — | | | | — | |
Operating (1) | | 1,156 | | | | 320 | | | | — | | | | 37 | | | | 748 | | | | — | |
| Realized (Gain) Loss on Risk Management | | 268 | | | | — | | | | — | | | | — | | | | (21) | | | | — | |
| Operating Margin | | 1,104 | | | | 195 | | | | — | | | | 45 | | | | (423) | | | | — | |
Unrealized (Gain) Loss on Risk Management (2) | | 57 | | | | — | | | | — | | | | — | | | | (1) | | | | — | |
| Depreciation, Depletion and Amortization | | 1,687 | | | | 880 | | | | — | | | | 8 | | | | 728 | | | | — | |
| Exploration Expense | | 9 | | | | 82 | | | | — | | | | — | | | | — | | | | — | |
| Segment Income (Loss) | | (649) | | | | (767) | | | | — | | | | 37 | | | | (1,150) | | | | — | |
| | | | | | | | | | | | | | | | | | | | | | | |
| For the year ended December 31, 2020 | | | | | | | | | | | | | | | | | Corporate and Eliminations | | Consolidated |
| Revenues | | | | | | | | | | | | | | | | | | | | | | | |
| Gross Sales | | | | | | | | | | | | | | | | | | (609) | | | | 13,591 | |
Less: Royalties (1) | | | | | | | | | | | | | | | | | | — | | | | 371 | |
| | | | | | | | | | | | | | | | | | (609) | | | | 13,220 | |
| Expenses | | | | | | | | | | | | | | | | | | | | | | | |
Purchased Product (1) | | | | | | | | | | | | | | | | | | (278) | | | | 5,358 | |
Transportation and Blending (1) | | | | | | | | | | | | | | | | | | (36) | | | | 4,728 | |
Operating (1) | | | | | | | | | | | | | | | | | | (306) | | | | 1,955 | |
| Realized (Gain) Loss on Risk Management | | | | | | | | | | | | | | | | | | 5 | | | | 252 | |
Unrealized (Gain) Loss on Risk Management (2) | | | | | | | | | | | | | | | | | | — | | | | 56 | |
| Depreciation, Depletion and Amortization | | | | | | | | | | | | | | | | | | 161 | | | | 3,464 | |
| Exploration Expense | | | | | | | | | | | | | | | | | | — | | | | 91 | |
| Segment Income (Loss) | | | | | | | | | | | | | | | | | | (155) | | | | (2,684) | |
| General and Administrative | | | | | | | | | | | | | | | | | | 292 | | | | 292 | |
| Finance Costs | | | | | | | | | | | | | | | | | | 536 | | | | 536 | |
| Interest Income | | | | | | | | | | | | | | | | | | (9) | | | | (9) | |
| Integration Costs | | | | | | | | | | | | | | | | | | 29 | | | | 29 | |
| Foreign Exchange (Gain) Loss, Net | | | | | | | | | | | | | | | | | | (181) | | | | (181) | |
| Re-measurement of Contingent Payment | | | | | | | | | | | | | | | | | | (80) | | | | (80) | |
| (Gain) Loss on Divestiture of Assets | | | | | | | | | | | | | | | | | | (81) | | | | (81) | |
| Other (Income) Loss, Net | | | | | | | | | | | | | | | | | | 40 | | | | 40 | |
| | | | | | | | | | | | | | | | | | 546 | | | | 546 | |
| Earnings (Loss) Before Income Tax | | | | | | | | | | | | | | | | | | | | | | (3,230) | |
| Income Tax Expense (Recovery) | | | | | | | | | | | | | | | | | | | | | | (851) | |
| Net Earnings (Loss) | | | | | | | | | | | | | | | | | | | | | | (2,379) | |
(1)Inventory write-downs and reversals prior to January 1, 2021, have been reclassified to royalties, purchased product, transportation and blending or operating expenses to conform with the current presentation of inventory write-downs and reversals.
(2)Unrealized gain and loss on risk management are recorded in the reportable segment to which the derivative instrument relates. Comparative periods have been reclassified as these amounts were recorded in the Corporate and Eliminations segment prior to January 1, 2021.
| | | | | |
| Cenovus Energy Inc. – Q2 2021 Interim Consolidated Financial Statements | 42 |
NOTES TO CONSOLIDATED FINANCIAL STATEMENTS (unaudited)
All amounts in $ millions, unless otherwise indicated
For the periods ended June 30, 2021
B) Segmented and Operational Information for 2019
| | | | | | | | | | | | | | | | | | | | | | | | | | | | | | | | | | | | | | | | | | | | | | | | | | | | | | | | | | | | | | | | | | | | | | | | |
| Upstream | | | Downstream | | |
| For the year ended December 31, 2019 | Oil Sands | | Conventional | | Offshore | | Canadian Manufacturing | | U.S. Manufacturing | | Retail | |
| Revenues | | | | | | | | | | | | | | | | | | | | | | | | |
| Gross Sales | | 12,739 | | | | 935 | | | | — | | | | 77 | | | | 8,291 | | | | — | | |
| Less: Royalties | | 1,143 | | | | 30 | | | | — | | | | — | | | | — | | | | — | | |
| | 11,596 | | | | 905 | | | | — | | | | 77 | | | | 8,291 | | | | — | | |
| Expenses | | | | | | | | | | | | | | | | | | | | | | | | |
Purchased Product (1) | | 1,869 | | | | 240 | | | | — | | | | — | | | | 6,735 | | | | — | | |
| Transportation and Blending | | 5,152 | | | | 82 | | | | — | | | | — | | | | — | | | | — | | |
| Operating | | 1,067 | | | | 339 | | | | — | | | | 41 | | | | 877 | | | | — | | |
| Realized (Gain) Loss on Risk Management | | 23 | | | | — | | | | — | | | | — | | | | (16) | | | | — | | |
| Operating Margin | | 3,485 | | | | 244 | | | | — | | | | 36 | | | | 695 | | | | — | | |
Unrealized (Gain) Loss on Risk Management (2) | | 92 | | | | — | | | | — | | | | — | | | | 1 | | | | — | | |
| Depreciation, Depletion and Amortization | | 1,543 | | | | 319 | | | | — | | | | 7 | | | | 273 | | | | — | | |
| Exploration Expense | | 18 | | | | 64 | | | | — | | | | — | | | | — | | | | — | | |
| Segment Income (Loss) | | 1,832 | | | | (139) | | | | — | | | | 29 | | | | 421 | | | | — | | |
| | | | | | | | | | | | | | | | | | | | | | | | |
| For the year ended December 31, 2019 | | | | | | | | | | | | | | | | | Corporate and Eliminations | | Consolidated | |
| Revenues | | | | | | | | | | | | | | | | | | | | | | | | |
| Gross Sales | | | | | | | | | | | | | | | | | | (689) | | | | 21,353 | | |
| Less: Royalties | | | | | | | | | | | | | | | | | | — | | | | 1,173 | | |
| | | | | | | | | | | | | | | | | | (689) | | | | 20,180 | | |
| Expenses | | | | | | | | | | | | | | | | | | | | | | | | |
Purchased Product (1) | | | | | | | | | | | | | | | | | | (417) | | | | 8,427 | | |
| Transportation and Blending | | | | | | | | | | | | | | | | | | (50) | | | | 5,184 | | |
| Operating | | | | | | | | | | | | | | | | | | (236) | | | | 2,088 | | |
| Realized (Gain) Loss on Risk Management | | | | | | | | | | | | | | | | | | — | | | | 7 | | |
Unrealized (Gain) Loss on Risk Management (2) | | | | | | | | | | | | | | | | | | 56 | | | | 149 | | |
| Depreciation, Depletion and Amortization | | | | | | | | | | | | | | | | | | 107 | | | | 2,249 | | |
| Exploration Expense | | | | | | | | | | | | | | | | | | — | | | | 82 | | |
| Segment Income (Loss) | | | | | | | | | | | | | | | | | | (149) | | | | 1,994 | | |
| General and Administrative | | | | | | | | | | | | | | | | | | 331 | | | | 331 | | |
| Finance Costs | | | | | | | | | | | | | | | | | | 511 | | | | 511 | | |
| Interest Income | | | | | | | | | | | | | | | | | | (12) | | | | (12) | | |
| Foreign Exchange (Gain) Loss, Net | | | | | | | | | | | | | | | | | | (404) | | | | (404) | | |
| Re-measurement of Contingent Payment | | | | | | | | | | | | | | | | | | 164 | | | | 164 | | |
| (Gain) Loss on Divestiture of Assets | | | | | | | | | | | | | | | | | | (2) | | | | (2) | | |
| Other (Income) Loss, Net | | | | | | | | | | | | | | | | | | 9 | | | | 9 | | |
| | | | | | | | | | | | | | | | | | 597 | | | | 597 | | |
| Earnings (Loss) Before Income Tax | | | | | | | | | | | | | | | | | | | | | | 1,397 | | |
| Income Tax Expense (Recovery) | | | | | | | | | | | | | | | | | | | | | | (797) | | |
| Net Earnings (Loss) | | | | | | | | | | | | | | | | | | | | | | 2,194 | | |
(1)Inventory write-downs have been reclassified to purchased product to conform with the current presentation of inventory write-downs.
(2)Unrealized gain and loss on risk management are recorded in the reportable segment to which the derivative instrument relates. Comparative periods have been reclassified as these amounts were recorded in the Corporate and Eliminations segment prior to January 1, 2021.
| | | | | |
| Cenovus Energy Inc. – Q2 2021 Interim Consolidated Financial Statements | 43 |
NOTES TO CONSOLIDATED FINANCIAL STATEMENTS (unaudited)
All amounts in $ millions, unless otherwise indicated
For the periods ended June 30, 2021
C) Segmented and Operational Information for 2018
| | | | | | | | | | | | | | | | | | | | | | | | | | | | | | | | | | | | | | | | | | | | | | | | | | | | | | | | | | | | | | | | | | | | | | | |
| Upstream | | | Downstream | |
| For the year ended December 31, 2018 | Oil Sands | | Conventional | | Offshore | | Canadian Manufacturing | | U.S. Manufacturing | | Retail |
| Revenues | | | | | | | | | | | | | | | | | | | | | | | |
| Gross Sales | | 11,975 | | | | 1,071 | | | | — | | | | 36 | | | | 9,031 | | | | — | |
| Less: Royalties | | 473 | | | | 73 | | | | — | | | | — | | | | — | | | | — | |
| | 11,502 | | | | 998 | | | | — | | | | 36 | | | | 9,031 | | | | — | |
| Expenses | | | | | | | | | | | | | | | | | | | | | | | |
Purchased Product (1) | | 1,933 | | | | 168 | | | | — | | | | — | | | | 7,160 | | | | — | |
| Transportation and Blending | | 5,879 | | | | 90 | | | | — | | | | — | | | | — | | | | — | |
| Operating | | 1,056 | | | | 404 | | | | — | | | | 37 | | | | 870 | | | | — | |
| Realized (Gain) Loss on Risk Management | | 1,551 | | | | 26 | | | | — | | | | — | | | | (1) | | | | — | |
| Operating Margin | | 1,083 | | | | 310 | | | | — | | | | (1) | | | | 1,002 | | | | — | |
Unrealized (Gain) Loss on Risk Management (2) | | (169) | | | | — | | | | — | | | | — | | | | (5) | | | | — | |
| Depreciation, Depletion and Amortization | | 1,439 | | | | 412 | | | | — | | | | 7 | | | | 215 | | | | — | |
| Exploration Expense | | 6 | | | | 2,117 | | | | — | | | | — | | | | — | | | | — | |
| Segment Income (Loss) | | (193) | | | | (2,219) | | | | — | | | | (8) | | | | 792 | | | | — | |
| | | | | | | | | | | | | | | | | | | | | | | |
| For the year ended December 31, 2018 | | | | | | | | | | | | | | | | | Corporate and Eliminations | | Consolidated |
| Revenues | | | | | | | | | | | | | | | | | | | | | | | |
| Gross Sales | | | | | | | | | | | | | | | | | | (724) | | | | 21,389 | |
| Less: Royalties | | | | | | | | | | | | | | | | | | — | | | | 546 | |
| | | | | | | | | | | | | | | | | | (724) | | | | 20,843 | |
| Expenses | | | | | | | | | | | | | | | | | | | | | | | |
Purchased Product (1) | | | | | | | | | | | | | | | | | | (517) | | | | 8,744 | |
| Transportation and Blending | | | | | | | | | | | | | | | | | | (27) | | | | 5,942 | |
| Operating | | | | | | | | | | | | | | | | | | (183) | | | | 2,184 | |
| Realized (Gain) Loss on Risk Management | | | | | | | | | | | | | | | | | | (22) | | | | 1,554 | |
Unrealized (Gain) Loss on Risk Management (2) | | | | | | | | | | | | | | | | | | (1,075) | | | | (1,249) | |
| Depreciation, Depletion and Amortization | | | | | | | | | | | | | | | | | | 58 | | | | 2,131 | |
| Exploration Expense | | | | | | | | | | | | | | | | | | — | | | | 2,123 | |
| Segment Income (Loss) | | | | | | | | | | | | | | | | | | 1,042 | | | | (586) | |
| General and Administrative | | | | | | | | | | | | | | | | | | 1,020 | | | | 1,020 | |
| Finance Costs | | | | | | | | | | | | | | | | | | 627 | | | | 627 | |
| Interest Income | | | | | | | | | | | | | | | | | | (19) | | | | (19) | |
| Foreign Exchange (Gain) Loss, Net | | | | | | | | | | | | | | | | | | 854 | | | | 854 | |
| Re-measurement of Contingent Payment | | | | | | | | | | | | | | | | | | 50 | | | | 50 | |
| (Gain) Loss on Divestiture of Assets | | | | | | | | | | | | | | | | | | 795 | | | | 795 | |
| Other (Income) Loss, Net | | | | | | | | | | | | | | | | | | 13 | | | | 13 | |
| | | | | | | | | | | | | | | | | | 3,340 | | | | 3,340 | |
| Earnings (Loss) Before Income Tax | | | | | | | | | | | | | | | | | | | | | | (3,926) | |
| Income Tax Expense (Recovery) | | | | | | | | | | | | | | | | | | | | | | (1,010) | |
| Net Earnings (Loss) | | | | | | | | | | | | | | | | | | | | | | (2,916) | |
(1)Inventory write-downs have been reclassified to purchased product to conform with the current presentation of inventory write-downs.
(2)Unrealized gain and loss on risk management are recorded in the reportable segment to which the derivative instrument relates. Comparative periods have been reclassified as these amounts were recorded in the Corporate and Eliminations segment prior to January 1, 2021.
| | | | | |
| Cenovus Energy Inc. – Q2 2021 Interim Consolidated Financial Statements | 44 |
CENOVUS ENERGY INC.
Supplemental Financial Information (unaudited)
Exhibit to the June 30, 2021 Interim Consolidated Financial Statements
Consolidated Interest Coverage Ratios
The following financial ratios are provided by Cenovus Energy Inc. (the “Company”) in connection with the offering of common shares, debt securities, preferred shares, subscription receipts, warrants, share purchase contracts and/or units of the Company by way of base shelf prospectus dated September 19, 2019. These ratios are based on the Company's consolidated financial statements that are prepared in accordance with International Financial Reporting Standards, which are generally accepted in Canada.
Interest coverage ratios for the twelve months ended June 30, 2021 (1)
| | | | | |
| (times) |
Net earnings available for all interest bearing financial liabilities (2) | 0.8x |
Net earnings available for all interest bearing financial liabilities before unrealized (gains) and losses on risk management activities (3) | 1.1x |
(1)As a result of the Company's acquisition of Husky Energy Inc. ("Husky"), financial information from January 1, 2021 to June 30, 2021 include results from the combined company. Financial information prior to the acquisition from July 1, 2020 to December 31, 2020 does not reflect financial information from Husky.
(2)Calculated as net earnings plus income tax and borrowing costs on all interest bearing financial liabilities; divided by borrowing costs on all interest bearing financial liabilities, as well as declared and undeclared cumulative preferred share dividends.
(3)Calculated as net earnings plus income tax and borrowing costs on all interest bearing financial liabilities before unrealized (gains) and losses on risk management activities; divided by borrowing costs on all interest bearing financial liabilities, as well as declared and undeclared cumulative preferred share dividends.
The Company believes the interest coverage ratio based on net earnings available for all interest bearing financial liabilities before unrealized (gains) and losses on risk management activities is a relevant measure for investors as the realization of unrealized (gains) and losses are yet to be determined and will be realized in future periods.
FORM 52-109F2
CERTIFICATION OF INTERIM FILINGS
FULL CERTIFICATE
I, Alex J. Pourbaix, President & Chief Executive Officer of Cenovus Energy Inc., certify the following:
1.Review: I have reviewed the interim financial report and interim MD&A (together, the “interim filings”) of Cenovus Energy Inc. (the “issuer”) for the interim period ended June 30, 2021.
2.No misrepresentations: Based on my knowledge, having exercised reasonable diligence, the interim filings do not contain any untrue statement of a material fact or omit to state a material fact required to be stated or that is necessary to make a statement not misleading in light of the circumstances under which it was made, with respect to the period covered by the interim filings.
3.Fair presentation: Based on my knowledge, having exercised reasonable diligence, the interim financial report together with the other financial information included in the interim filings fairly present in all material respects the financial condition, financial performance and cash flows of the issuer, as of the date of and for the periods presented in the interim filings.
4.Responsibility: The issuer’s other certifying officer(s) and I are responsible for establishing and maintaining disclosure controls and procedures (“DC&P”) and internal control over financial reporting (“ICFR”), as those terms are defined in National Instrument 52-109 Certification of Disclosure in Issuers’ Annual and Interim Filings, for the issuer.
5.Design: Subject to the limitations, if any, described in paragraphs 5.2 and 5.3, the issuer’s other certifying officer(s) and I have, as at the end of the period covered by the interim filings
(a)designed DC&P, or caused it to be designed under our supervision, to provide reasonable assurance that
(i)material information relating to the issuer is made known to us by others, particularly during the period in which the interim filings are being prepared; and
(ii)information required to be disclosed by the issuer in its annual filings, interim filings or other reports filed or submitted by it under securities legislation is recorded, processed, summarized and reported within the time periods specified in securities legislation; and
(b)designed ICFR, or caused it to be designed under our supervision, to provide reasonable assurance regarding the reliability of financial reporting and the preparation of financial statements for external purposes in accordance with the issuer’s GAAP.
5.1 Control framework: The control framework the issuer’s other certifying officer(s) and I used to design the issuer’s ICFR is the Committee of Sponsoring Organizations of the Treadway Commission (“COSO”) framework in Internal Control – Integrated Framework.
5.2 ICFR - material weakness relating to design: N/A
5.3 Limitation on scope of design: The issuer has disclosed in its interim MD&A
(a)the fact that the issuer's other certifying officer(s) and I have limited the scope of our design of DC&P and ICFR to exclude controls, policies and procedures of a business that the issuer acquired not more than 365 days before the last day of the period covered by the interim filings; and
(b)summary financial information about the business that the issuer acquired that has been proportionately consolidated or consolidated in the issuer's financial statements.
6.Reporting changes in ICFR: The issuer has disclosed in its interim MD&A any change in the issuer’s ICFR that occurred during the period beginning on April 1, 2021 and ended on June 30, 2021 that has materially affected, or is reasonably likely to materially affect, the issuer’s ICFR.
Date: July 29, 2021
/s/ Alex J. Pourbaix
Alex J. Pourbaix
President & Chief Executive Officer
FORM 52-109F2
CERTIFICATION OF INTERIM FILINGS
FULL CERTIFICATE
I, Jeffrey R. Hart, Executive Vice-President & Chief Financial Officer of Cenovus Energy Inc., certify the following:
1.Review: I have reviewed the interim financial report and interim MD&A (together, the “interim filings”) of Cenovus Energy Inc. (the “issuer”) for the interim period ended June 30, 2021.
2.No misrepresentations: Based on my knowledge, having exercised reasonable diligence, the interim filings do not contain any untrue statement of a material fact or omit to state a material fact required to be stated or that is necessary to make a statement not misleading in light of the circumstances under which it was made, with respect to the period covered by the interim filings.
3.Fair presentation: Based on my knowledge, having exercised reasonable diligence, the interim financial report together with the other financial information included in the interim filings fairly present in all material respects the financial condition, financial performance and cash flows of the issuer, as of the date of and for the periods presented in the interim filings.
4.Responsibility: The issuer’s other certifying officer(s) and I are responsible for establishing and maintaining disclosure controls and procedures (“DC&P”) and internal control over financial reporting (“ICFR”), as those terms are defined in National Instrument 52-109 Certification of Disclosure in Issuers’ Annual and Interim Filings, for the issuer.
5.Design: Subject to the limitations, if any, described in paragraphs 5.2 and 5.3, the issuer’s other certifying officer(s) and I have, as at the end of the period covered by the interim filings
(a)designed DC&P, or caused it to be designed under our supervision, to provide reasonable assurance that
(i)material information relating to the issuer is made known to us by others, particularly during the period in which the interim filings are being prepared; and
(ii)information required to be disclosed by the issuer in its annual filings, interim filings or other reports filed or submitted by it under securities legislation is recorded, processed, summarized and reported within the time periods specified in securities legislation; and
(b)designed ICFR, or caused it to be designed under our supervision, to provide reasonable assurance regarding the reliability of financial reporting and the preparation of financial statements for external purposes in accordance with the issuer’s GAAP.
5.1 Control framework: The control framework the issuer’s other certifying officer(s) and I used to design the issuer’s ICFR is the Committee of Sponsoring Organizations of the Treadway Commission (“COSO”) framework in Internal Control – Integrated Framework.
5.2 ICFR - material weakness relating to design: N/A
5.3 Limitation on scope of design: The issuer has disclosed in its interim MD&A
(a)the fact that the issuer's other certifying officer(s) and I have limited the scope of our design of DC&P and ICFR to exclude controls, policies and procedures of a business that the issuer acquired not more than 365 days before the last day of the period covered by the interim filings; and
(b)summary financial information about the business that the issuer acquired that has been proportionately consolidated or consolidated in the issuer's financial statements.
6.Reporting changes in ICFR: The issuer has disclosed in its interim MD&A any change in the issuer’s ICFR that occurred during the period beginning on April 1, 2021 and ended on June 30, 2021 that has materially affected, or is reasonably likely to materially affect, the issuer’s ICFR.
Date: July 29, 2021
/s/ Jeffrey R. Hart
Jeffrey R. Hart
Executive Vice-President & Chief Financial Officer
This regulatory filing also includes additional resources:
ex992courtesy.pdf
ex993courtesy.pdf
Cenovus Energy (NYSE:CVE)
Historical Stock Chart
From Mar 2024 to Apr 2024

Cenovus Energy (NYSE:CVE)
Historical Stock Chart
From Apr 2023 to Apr 2024
