Allstate Corporation’s (ALL) second quarter
operating loss of $1.23 per share came in modestly lower than the
Zacks Consensus Estimate of a loss of $1.53 but lagged the year-ago
quarter’s earnings of 81 cents per share.
Results for the quarter reflected higher catastrophe (CAT)
losses that also led to increased claims expenses coupled with
lower average premiums and policies-in-force in Property-Liability
insurance unit and lower investment income. However, prudent
capital management and strong liquidity were quite impressive
during the reported quarter. This is reflected from growth in book
value per share and improved combined ratio, excluding the effect
of catastrophes.
Allstate’s net loss for the reported quarter came in at $620
million or $1.19 per share, compared to net income of $145 million
or 27 cents per share in the prior-year quarter, reflecting a
substantial decline. Operating loss, which excludes realized net
capital gains and losses from the sale of investments as well as
accruals on unhedged derivative instruments, plunged to $642
million compared to operating income of $441 million.
Allstate reported total net revenue growth of 5.6% year over
year to $8.08 billion and also exceeded the Zacks Consensus
Estimate of $6.91 billion. Besides, property-liability insurance
claims and claims expenses spiked 34.8% year over year to $6.36
billion while operating costs and expenses inched up 1.6% year over
year to $802 million.
Additionally, catastrophe losses for the reported quarter
escalated to $2.34 billion, contributing 36.2 point to the combined
ratio but were substantially higher than $636 million in the
year-ago period. During the reported quarter, Allstate experienced
33 catastrophe loss events including five tornadoes, three
wildfires and 25 hailstorms.
Quarter in Detail
Property-Liability net written
premiums were $6.61 billion, inching down 0.4% from prior-year
quarter. The segment’s combined ratio was 123.3% against 96.8% in
the year-ago quarter, reflecting increased catastrophe losses.
However, the underlying combined ratio, which excludes
catastrophes and prior-year reserve estimates, was 87.5% in the
reported quarter, lower than 88.1% recorded in the year-ago
quarter. This was also within management’s outlook of underlying
combined ratio of 88 to 91 for 2011.
Besides, Allstate brand standard auto premiums written for the
reported quarter declined 0.9% from the prior-year quarter as a
result of a 0.6% fall in policies in force along with a 5.2%
decline in new issued applications. Average gross premium also
dipped 0.5% from the year-ago period, reflecting rate decreases and
customers’ choice of lower coverage.
As a result, the combined ratio increased 3.7 points year over
year to 98.2%, primarily owing to increased catastrophe losses.
However, underlying combined ratio improved to 93.6% from 94.1% in
the year-ago quarter.
Allstate-branded homeowners’ written premiums for the quarter
increased 2.6% year over year, reflecting a 6.0% climb in average
gross premium that was partially offset by a 3.9% decline in
policies in force. Higher catastrophe losses resulted in
Allstate-branded homeowners combined ratio of 123.3%, although
underlying combine ratio moderated marginally to 69.5% against
69.8% in the prior-year quarter.
Property-Liability net loss surged to $738 million from net
income of $299 million in the year-ago quarter. Operating loss for
this segment was $733 million, decreasing from operating loss of
$368 million in the year-ago quarter. The Property-Liability
expense ratio for the reported quarter was 24.9 compared with 24.4
in the prior-year quarter.
However, operating income for Allstate
Financial increased 12.8% year over year to $141
million. The increase reflected lower investment income and higher
amortization of deferred acquisition costs (DAC), offset by lower
operating costs and tax expenses.
Meanwhile, net income came in at $166 million compared to net
loss of $107 million in the year-ago quarter, primarily driven by
realized capital gains in the reported quarter against losses in
the comparable period.
Corporate & Other segment reported
a net loss of $620 million, deteriorating from a net income of $145
million in the prior-year quarter. Total operating cost and
expenses stood at $98 million, marginally down from $101 million in
the year-ago quarter.
Investment and Capital Position
As of June 30, 2011, Allstate’s total investments decreased $1.2
billion from 2010-end to $99.3 billion, reflecting reductions in
the Allstate Financial portfolio more than offset by strong
investment returns. However, the pre-tax net unrealized capital
gains jumped to $2.5 billion as on June 30, 2011 from $1.4 billion
at the end of 2010.
Meanwhile, net realized capital gains totaled $57 million
compared to a loss of $451 million in the year-ago period,
primarily due to reduced derivative losses, lower impairment
write-downs, and increased valuation gains on limited
partnerships.
Allstate’s net investment income came in at $1.02 billion, down
2.8% from the year-ago quarter, although portfolio yields showed
improvement. As on June 31, 2011, reported book value per share
increased 8.2 % year over year to $35.95. Book value per
share, excluding the impact of unrealized net capital gains and
losses on fixed income securities, increased 4.3% year over year to
$33.91.
Operating cash flow totaled $1.26 billion at the end of the
reported quarter, significantly down from $2.09 billion at the end
of the prior-year quarter. Long-term debt stood at $5.9 billion
while total assets were recorded at $129.02 billion at the end of
June 30, 2011.
Outlook
Management expects to maintain the profitability of the auto
business and improve homeowners’ profitability, resulting in an
underlying combined ratio outlook of 88% to 91% for 2011.
Allstate is taking strategic actions to reduce losses for
Allstate business from catastrophes through enhanced property
catastrophe reinsurance program, non-renewals, stricter
underwriting guidelines, increased deductibles and discontinuance
of selected lines of coverage, including earthquake.
We anticipate continued benefits from Allstate’s
diversification, superior financial strength rating and proactive
approach to investment. These factors have helped Allstate gain the
second-largest personal lines writer position in the US, which also
reflects its competitive strength against arch rivals such as
Berkshire Hathaway-A (BRK) and The
Travelers Companies (TRV).
However, Allstate’s exposure to catastrophe risks, capital
losses and volatility in pricing, interest and loss costs will
continue to impact the premiums and investment portfolio in the
upcoming quarters.
ALLSTATE CORP (ALL): Free Stock Analysis Report
BERKSHIRE HTH-B (BRK.B): Free Stock Analysis Report
TRAVELERS COS (TRV): Free Stock Analysis Report
Zacks Investment Research
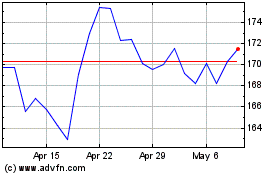
Allstate (NYSE:ALL)
Historical Stock Chart
From May 2024 to Jun 2024

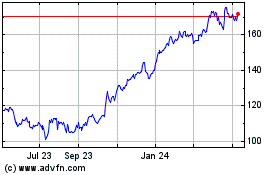
Allstate (NYSE:ALL)
Historical Stock Chart
From Jun 2023 to Jun 2024
