Aflac Inc.’s (AFL) fourth-quarter 2011
operating earnings per share of $1.48 came in triple pennies below
the Zacks Consensus Estimate of $1.51 but were comfortably higher
than $1.33 reported in the year-ago quarter. Operating earnings
escalated 10.0% year over year to $691 million. A stronger
yen/dollar exchange rate helped increase operating earnings per
share by 6 cents.
Operating earnings in the reported quarter excluded after-tax
negative impact of realized investment losses from securities
transactions and impairments of $168 million or 36 cents per share
compared with $235 million or 51 cents per share in the year-ago
quarter. This was partially offset by the positive impact of
derivative and hedging activities worth $23 million or 5 cents per
share in the reported quarter, as opposed to $44 million or 10
cents per share recorded in the year-ago period.
Including one-time items, Aflac’s GAAP net income for the
reported quarter came in at $546 million or $1.17 per share
compared with $437 million or 92 cents per share in the year-ago
period. Total acquisition and operating expenses spurted 5.9% year
over year to $1.45 billion, while benefits and claims climbed 13.4%
year over year to about $3.70 billion.
However, total revenue for the reported quarter rose 12.9% year
over year to $5.98 billion, although it was lower than the Zacks
Consensus Estimate of $6.2 billion. Despite the ongoing derisking
activities, total revenue benefited from strengthening of yen
against the dollar along with consistent improvement in the U.S.
and better-than-expected performance in Japan. While Aflac Japan
contributed 82% to the total revenue, Aflac U.S. contributed the
remaining 18%.
Total revenue in Japan increased 13.1% year over year to $4.9
billion. Reflecting the stronger average yen, premium income from
the Japanese operations in terms of dollars was up 13.5% year over
year to $4.1 billion in the reported quarter. Net investment income
from the Japanese operations increased 10.2% year over year to $708
million primarily due to a stronger yen/dollar exchange rate, which
was 77.35, or 6.8% stronger than the average rate of 82.58 in the
year-ago quarter.
Besides, Aflac U.S. generated revenue of $1.3 billion, up 4.0%
over the prior-year quarter. Net investment income from the U.S.
operation saw an uptick of 3.4% year over year to $149 million.
Premiums from the U.S. operations were up 4.1% year over year to
$1.2 billion. Despite the lingering weakness in the U.S., total new
annualized sales rose 9.3% year over year to $441 million as
targeted product and field force recruiting initiatives showed some
improvement, thereby outperforming for the fourth consecutive
quarter.
Full-Year 2011 Highlights
For full year 2011, Aflac reported operating net income of $2.97
billion or $6.33 per share as compared with $2.62 billion or $5.53
per share in 2010. However, operating earnings per share lagged the
Zacks Consensus Estimate of $6.36. A stronger yen/dollar exchange
rate helped increase operating earnings per share by 36 cents.
Operating earnings in the reported quarter excluded after-tax
negative impact of realized investment losses, which included
securities transactions and impairments along with derivative and
hedging activities, of $1.01 billion or $2.15 per share against
$274 million or 58 cents per share in 2010. Including one-time
items, Aflac’s GAAP net income for the reported quarter declined to
$1.96 billion or $4.18 per share from $2.34 billion or $4.95 per
share in 2010.
Total revenue increased 6.9% year over year to $22.17 billion,
but lagged behind the Zacks Consensus Estimate of $23.2 billion.
Aflac Japan revenues were up 14.9% to $18.4 billion, accounting for
83% of the total revenues in 2011. Besides, Aflac US’ revenue
increased 3.8% over 2010 to $5.3 billion, accounting for the
remaining 17% of the total revenue.
Additionally, total acquisition and operating expenses increased
7.7% year over year to $5.43 billion, while benefits and claims
climbed 13.6% year over year to about $13.75 billion.
Financial Update
As of December 31, 2011, total investment and cash were $103.46
billion compared with $88.23 billion at 2010-end, while
shareholders' equity totaled $13.50 billion against $11.06 billion
at the end of 2010. Shareholders' equity per share was $28.96 at
the end of 2011, up from $27.25 per share reported at the end of
prior quarter.
At the end of 2011, Aflac projected its risk-based capital ratio
in the range of 480–520%, compared with more than 580% estimated at
2010-end. During the reported quarter, net unrealized gain on
investment securities and derivatives were $1.2 billion as compared
with $708 million at the end of prior quarter.
Annualized return on average shareholders’ equity for the
reported quarter was 16.6% against 24.1% in the prior quarter. On
an operating basis (excluding realized investment losses and the
impact of ASC 815 on net earnings, and unrealized investment
gains/losses in shareholders' equity) Aflac’s return on average
shareholders’ equity came in at 22.7%, down from 26.8% in the
previous quarter.
Guidance
Concurrent with the fourth quarter’s result release, Aflac
generated its outlook for 2012. The company expects Aflac U.S.
revenue to grow by 3–8%, although revenue projection in Aflac Japan
ranges from a negative 2% to 5% in 2012.
Besides, management also maintained its earnings guidance for
2012 in the range of 2–5% over 2011, reflecting the impact of
portfolio derisking and investment of significant cash flows at low
interest rates. However, the company anticipates the earnings
growth to improve in 2013.
Dividend Update
Concurrently, the board of Aflac announced a regular cash
dividend of 33 cents per share to be payable on March 1, 2012 to
its shareholders of record as on February 15, 2012.
In October 2011, Aflac had hiked its dividend by 10% to 33
cents, which was paid on December 1, 2011 to its stockholders of
record as on November 16, 2011.
Share Repurchase Update
In an effort to retain shareholders’ confidence, Aflac announced
the resumption of its buyback program, which authorized 32.4
million shares available for repurchase as of June 30, 2010. The
stock repurchase program had been shelved in 2008 owing to the
global market downturn.
Accordingly, the company bought back 0.9 million shares during
the reported quarter, repurchasing a total of 6.0 million shares in
2011. This came in at lower end of Aflac’s projection to repurchase
6–12 million shares in 2011. At the end of the 2011, Aflac had 24.4
million shares available for repurchase.
Our Take
Over the years, Aflac has been significantly focusing on
strengthening its insurance operations through successful product
launches and the expansion of its distribution system, which has
been significantly contributing to its strong sales results. This
has also enabled the company to generate healthy capital ratios and
cash position, other than raising dividends. However, higher
operating expenses continue to be a deterrent for desired
advancement.
Although the near-term outlook remains cautious, given the
effect of portfolio derisking activities and the continued
low-interest-rate environment in Japan that is also reflected in
the company’s guidance, we believe that a stable economy in the
long term will gather momentum and negate interest and currency
risk, thereby providing more profitable investment opportunities to
Aflac. Going ahead, the company’s strong capital and surplus cash
position is expected to mitigate balance sheet risks and provide
liquidity cushion in the long run, as well as return value to
shareholders consistently. Hence, we continue to retain our Neutral
stance on the stock, with a Zacks Rank #3, implying a short-term
Hold rating.
Meanwhile, Aflac’s peer Unum Group (UNM) is
slated to release its results after the market closes on February
6, 2012, although Catalyst Health Solutions Inc.
(CHSI) is yet to declare its earnings schedule for the fourth
quarter.
AFLAC INC (AFL): Free Stock Analysis Report
CATALYST HEALTH (CHSI): Free Stock Analysis Report
UNUM GROUP (UNM): Free Stock Analysis Report
To read this article on Zacks.com click here.
Zacks Investment Research
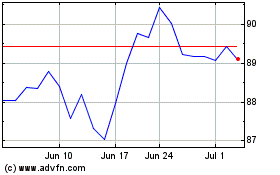
AFLAC (NYSE:AFL)
Historical Stock Chart
From May 2024 to Jun 2024

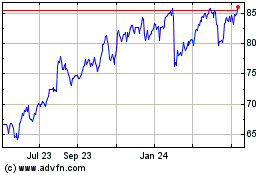
AFLAC (NYSE:AFL)
Historical Stock Chart
From Jun 2023 to Jun 2024
