J & J Snack Foods Corp. (NASDAQ:JJSF) today announced record
sales and earnings for its third quarter and nine months ended June
27, 2009.
Sales for the third quarter increased 2% to $179.8 million from
$176.8 million in last year's third quarter. Net earnings increased
38% to $14.9 million from $10.8 million last year. Earnings per
diluted share were $.80 for the June quarter compared to $.57 last
year. Operating income increased 40% to $24.4 million this year
from $17.5 million in the year ago period.
For the nine months ended June 27, 2009, sales increased 4% to
$470.3 million from $452.0 million in last year's nine months. Net
earnings increased 58% to $26.5 million in the nine months from
$16.7 million last year. Earnings per diluted share were $1.42 for
the nine months compared to $.88 last year. Operating income
increased 69% to $43.1 million from $25.5 million in the year ago
period.
Gerald B. Shreiber, J & J�s President and Chief Executive
Officer, commented; �We had strong performances from our food
service and retail grocery groups during the quarter. Although we
continue to be challenged with issues facing the overall economy,
we are confident of our abilities to overcome these issues.�
J & J Snack Foods Corp.�s principal products include
SUPERPRETZEL, PRETZEL FILLERS and other soft pretzels, ICEE, SLUSH
PUPPIE and ARCTIC BLAST frozen beverages, LUIGI�S, MAMA TISH�S,
SHAPE UPS, MINUTE MAID* and BARQ�S** frozen juice bars and ices,
WHOLE FRUIT sorbet, FRUIT-A-FREEZE frozen fruit bars, MARY B�S
biscuits and dumplings, DADDY RAY�S fig and fruit bars, TIO PEPE�S
churros, THE FUNNEL CAKE FACTORY funnel cakes, and MRS. GOODCOOKIE,
CAMDEN CREEK, COUNTRY HOME and READI-BAKE cookies. J & J has
manufacturing facilities in Pennsauken, Bridgeport and Bellmawr,
New Jersey; Scranton, Hatfield and Chambersburg, Pennsylvania;
Carrollton, Texas; Atlanta, Georgia; Moscow Mills, Missouri;
Pensacola, Florida and Vernon and Newport, California.
*MINUTE MAID is a registered trademark of The Coca-Cola
Company.
**BARQ�S is a registered trademark of Barq�s Inc.
� �
Unaudited Consolidated Statement of
Operations
Three Months Ended
�
Nine Months Ended
June 27, � June 28, June 27, � June 28,
2009
2008
2009
2008
(in thousands) Net sales $ 179,761 $ 176,839 $ 470,255 $ 451,966
Cost of goods sold � 118,727 � 121,087 � 323,162 � 320,427 Gross
profit 61,034 55,752 147,093 131,539 Operating expenses � 36,654 �
38,298 � 104,002 � 106,069 Operating income 24,380 17,454 43,091
25,470 Other income � 263 � 532 � 965 � 1,969
Earnings before income taxes
24,643 17,986 44,056 27,439 Income taxes � 9,714 � 7,166 � 17,564 �
10,724 Net earnings $ 14,929 $ 10,820 $ 26,492 $ 16,715 � Earnings
per diluted share $ .80 $ .57 $ 1.42 $ .88 Earnings per basic share
$ .81 $ .58 $ 1.43 $ .89
Weighted average number of diluted
shares
18,698 18,981 18,697 19,013
Weighted average number of basic
shares
18,480 18,762 18,507 18,772 � � �
Consolidated Balance Sheets
June 27, 2009 �
September 27, 2008
(Unaudited)
(in thousands) Cash & cash equivalents $ 59,116 $ 44,265
Current marketable securities held to maturity 22,047 2,470 Current
auction market preferred stock - 14,000 Other current assets
118,167 116,465 Property, plant & equipment, net 93,521 93,064
Goodwill 60,314 60,314 Other intangible assets, net 50,252 53,633
Long-term auction market preferred stock - 21,200 Long-term
marketable securities held to maturity 20,402 - Other � 2,342 �
2,997 Total $ 426,161 $ 408,408 � Current liabilities 73,977 66,194
Long-term obligations under capital leases 309 381 Deferred income
taxes 23,056 23,056 Other long-term obligations 1,999 1,999
Stockholders� equity � 326,820 � 316,778 Total $ 426,161 $ 408,408
�
The forward-looking statements contained herein are subject to
certain risks and uncertainties that could cause actual results to
differ materially from those projected in the forward-looking
statements. Readers are cautioned not to place undue reliance on
these forward-looking statements, which reflect management�s
analysis only as of the date hereof. The Company undertakes no
obligation to publicly revise or update these forward-looking
statements to reflect events or circumstances that arise after the
date hereof.
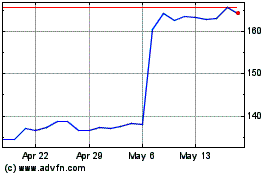
J and J Snack Foods (NASDAQ:JJSF)
Historical Stock Chart
From Jun 2024 to Jul 2024

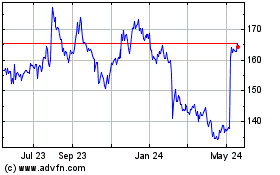
J and J Snack Foods (NASDAQ:JJSF)
Historical Stock Chart
From Jul 2023 to Jul 2024
