Flexsteel Industries, Inc. (NASDAQ:FLXS) today reported results
of operations for its first fiscal quarter ended September 30,
2009.
The Company reported net sales for the quarter ended September
30, 2009 of $75.9 million compared to the prior year quarter of
$91.4 million, a decrease of 16.9%. The Company reported net income
for the current quarter of $1.4 million or $0.21 per share compared
to a net loss of $0.7 million or $0.11 per share in the prior year
quarter. The prior year quarter included approximately $1.3 million
of facility consolidation costs.
For the quarter ended September 30, 2009, residential net sales
were $56.2 million, a decrease of 9.4% from the prior year quarter
net residential sales of $62.0 million. Commercial net sales were
$19.7 million compared to $29.4 million in the prior year quarter,
a decrease of 32.9%. Commercial net sales for both periods now
include vehicle seating product sales. Due to operational
realignment related to shrinking markets and poor business
conditions, and the changing nature of vehicle seating product
applications, we will include these sales with commercial products
on a go-forward basis.
Gross margin for the quarter ended September 30, 2009 was 21.8%
compared to 18.7% in the prior year quarter. The improvement in
gross margin percentage is primarily due to changes implemented
during the prior fiscal year to better utilize capacity and control
costs. In addition, we benefited from modest relief from some of
the prior year cost increases for materials and freight.
Selling, general and administrative expenses were $14.1 million
or 18.6% of sales and $16.8 million or 18.3% for the quarters ended
September 30, 2009 and 2008, respectively, representing a reduction
of approximately $2.7 million due to lower variable expenses on
lower sales volume and control of fixed general and administrative
expenses.
Working capital (current assets less current liabilities) at
September 30, 2009 was $79.4 million. Net cash provided by
operating activities was $3.0 million during the first quarter
ended September 30, 2009 due to net income of $1.4 million,
depreciation of $0.8 million and changes in net current assets of
$0.8 million. Net cash provided by operating activities was $2.2
million at September 30, 2008.
Capital expenditures were $0.6 million for the quarter ended
September 30, 2009. Depreciation and amortization expense was $0.8
million and $1.1 million for the fiscal quarters ended September
30, 2009 and 2008, respectively. The Company expects that capital
expenditures will be approximately $1.5 million for the remainder
of the 2010 fiscal year.
All earnings per share amounts are on a diluted basis.
OutlookBased upon current
business conditions, we believe sales have stabilized at current
levels and do not anticipate significant further declines. However,
at this time we are not seeing a significant improvement in
near-term business conditions. The consolidation of manufacturing
operations and workforce reductions that the Company completed
during the prior fiscal year has brought production capacity and
fixed overhead in line with current and expected demand for our
products. Company wide employment, which was reduced approximately
30% in the prior fiscal year through plant closures and workforce
reductions, remains at these reduced levels.
We believe that our residential product category has performed
reasonably well in relation to our competition. However,
residential furniture continues to be a highly deferrable purchase
item and is adversely impacted by low levels of consumer
confidence, a depressed market for new housing, limited consumer
credit and high unemployment. The commercial product category fell
considerably as the U. S. economy contracted and credit tightened
further during the fourth quarter of the prior fiscal year. We do
not foresee any immediate improvement in these conditions and
continue to operate on that basis.
While we expect that current business conditions will persist
for the remainder of fiscal year 2010, we remain optimistic that
our strategy, which includes a wide range of quality product
offerings and price points to the residential and commercial
markets, combined with our conservative approach to business, will
be rewarded when business conditions improve. We will maintain our
focus on a strong balance sheet during these challenging economic
times through emphasis on cash flow and improving
profitability.
Analysts Conference CallWe
will host a conference call for analysts on October 21, 2009, at
10:30 a.m. Central Time. To access the call, please dial
1-866-830-5279 and provide the operator with ID# 28505576. A replay
will be available for two weeks beginning approximately two hours
after the conclusion of the call by dialing 1-800-642-1687 and
entering ID# 28505576.
Forward-Looking
StatementsStatements, including those in this release, which
are not historical or current facts, are “forward-looking
statements” made pursuant to the safe harbor provisions of the
Private Securities Litigation Reform Act of 1995. There are certain
important factors that could cause our results to differ materially
from those anticipated by some of the statements made in this press
release. Investors are cautioned that all forward-looking
statements involve risk and uncertainty. Some of the factors that
could affect results are the cyclical nature of the furniture
industry, the effectiveness of new product introductions and
distribution channels, the product mix of sales, pricing pressures,
the cost of raw materials and fuel, foreign currency valuations,
actions by governments including taxes and tariffs, the amount of
sales generated and the profit margins thereon, competition (both
foreign and domestic), changes in interest rates, credit exposure
with customers and general economic conditions. Any forward-looking
statement speaks only as of the date of this press release. We
specifically decline to undertake any obligation to publicly revise
any forward-looking statements that have been made to reflect
events or circumstances after the date of such statements or to
reflect the occurrence of anticipated or unanticipated events.
About FlexsteelFlexsteel
Industries, Inc. is headquartered in Dubuque, Iowa, and was
incorporated in 1929. Flexsteel is a designer, manufacturer,
importer and marketer of quality upholstered and wood furniture for
residential, recreational vehicle, office, hospitality and
healthcare markets. All products are distributed nationally.
For more information, visit our web site at
http://www.flexsteel.com.
FLEXSTEEL INDUSTRIES, INC. AND SUBSIDIARIES CONSOLIDATED CONDENSED
BALANCE SHEETS (UNAUDITED) (in thousands)
September 30,
June
30,
2009 2009
ASSETS
CURRENT ASSETS: Cash and cash equivalents $ 990 $ 1,714
Trade receivables, net 32,900 31,283 Inventories 72,089 73,844
Other 5,778 7,872 Total current assets 111,757 114,713
NONCURRENT ASSETS: Property, plant, and equipment, net 23,120
23,298 Other assets 13,523 12,960 TOTAL $ 148,400 $ 150,971
LIABILITIES AND SHAREHOLDERS’
EQUITY
CURRENT LIABILITIES: Accounts payable – trade $ 8,377 $
9,745 Notes payable and current maturities of long-term debt 7,000
10,000 Accrued liabilities 17,010 16,552 Total current liabilities
32,387 36,297 LONG-TERM LIABILITIES: Other long-term
liabilities 7,662 7,676 Total liabilities 40,049 43,973
SHAREHOLDERS’ EQUITY 108,351 106,998 TOTAL $ 148,400 $
150,971 FLEXSTEEL INDUSTRIES, INC. AND SUBSIDIARIES
CONSOLIDATED STATEMENTS OF OPERATIONS (UNAUDITED) (in thousands,
except per share data)
Three
Months Ended
September 30, 2009 2008 NET SALES $ 75,940 $ 91,417 COST OF
GOODS SOLD (59,384 ) (74,281 ) GROSS MARGIN 16,556 17,136 SELLING,
GENERAL AND ADMINISTRATIVE (14,141 ) (16,770 ) FACILITY
CONSOLIDATION COSTS -- (1,348 ) OPERATING INCOME (LOSS)
2,415 (982 )
OTHER INCOME (EXPENSE):
Interest and other income 32 109 Interest expense (137 ) (286 )
Total (105 ) (177 ) INCOME (LOSS) BEFORE INCOME TAXES 2,310 (1,159
) INCOME TAX (PROVISION) BENEFIT (930 ) 410 NET INCOME
(LOSS) $ 1,380 $ (749 ) AVERAGE NUMBER OF COMMON SHARES
OUTSTANDING: Basic 6,576 6,575 Diluted 6,615
6,575 EARNINGS PER SHARE OF COMMON STOCK: Basic $ 0.21
$ (0.11 ) Diluted $ 0.21 $ (0.11 ) FLEXSTEEL
INDUSTRIES, INC. AND SUBSIDIARIES CONSOLIDATED CONDENSED STATEMENTS
OF CASH FLOWS (UNAUDITED) (in thousands)
Three Months
Ended
September 30, 2009 2008
OPERATING ACTIVITIES:
Net income (loss) $ 1,380 $ (749 ) Adjustments to reconcile net
income to net cash provided by operating activities: Depreciation
and amortization 806 1,056 Gain on disposition of capital assets (3
) (143 ) Changes in operating assets and liabilities 858
2,068 Net cash provided by operating activities 3,041
2,232
INVESTING ACTIVITIES:
Net sales of investments 188 262 Proceeds from sale of capital
assets 3 441 Capital expenditures (627 ) (150 ) Net cash (used in)
provided by investing activities (436 ) 553
FINANCING ACTIVITIES:
Net repayments of borrowings (3,000 ) (3,462 ) Dividends paid (329
) (855 ) Net cash used in financing activities (3,329 ) (4,317 )
Decrease in cash and cash equivalents (724 ) (1,532 ) Cash
and cash equivalents at beginning of period 1,714 2,841
Cash and cash equivalents at end of period $ 990 $
1,309
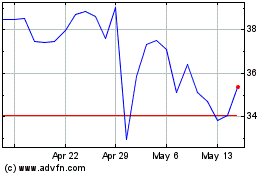
Flexsteel Industries (NASDAQ:FLXS)
Historical Stock Chart
From May 2024 to Jun 2024

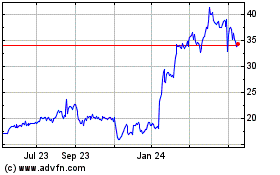
Flexsteel Industries (NASDAQ:FLXS)
Historical Stock Chart
From Jun 2023 to Jun 2024
