Flexsteel Industries, Inc. (NASDAQ:FLXS) today reported sales and
earnings for its third quarter and fiscal year-to-date ended March
31, 2006. Net sales for the fiscal quarter ended March 31, 2006
were $110.3 million compared to the prior year quarter of $101.3
million, an increase of 8.9%. Operating income for the current
quarter was $3.1 million compared to $1.7 million in the prior year
quarter. Net income for the current quarter was $1.8 million or
$0.27 per share compared to $1.7 million or $0.26 per share in the
prior year quarter. Prior year quarter net income of $1.7 million
includes a $0.1 million after tax gain from sale of a former
manufacturing facility and $0.7 million of tax benefit related to
reduced estimated tax liabilities. Net sales for the nine months
ended March 31, 2006 were $314.1 million compared to $304.3 million
in the prior year nine months, an increase of 3.2%. Net income for
the nine months ended March 31, 2006 was $3.2 million or $0.49 per
share, including stock-based compensation expense of $0.4 million
(after tax) or $0.06 per share, compared to net income of $4.5
million or $0.68 per share for the nine months ended March 31,
2005, which included a net gain (after tax) of $0.4 million or
$0.06 per share on the sale of facilities. For the quarter ended
March 31, 2006, residential net sales were $69.6 million, an
increase of 7.8% from the prior year quarter net sales of $64.6
million. This increase in residential net sales in the current
quarter is primarily due to greater demand for products in existing
markets and introduction into newly developed markets. For the nine
months ended March 31, 2006, residential net sales of $197.4
million are up 1.6% from net sales of $194.2 million in the prior
year. Recreational vehicle net sales for the quarter ended March
31, 2006 were $19.1 million, down 3.4% from the prior year quarter
net sales of $19.7 million. On a year-to-date basis, recreational
vehicle net sales decreased 11.9% to $53.3 million, compared to
$60.5 million in the nine-months ended March 31, 2005. The decline
in recreational vehicle net sales is due primarily to a continued
weak wholesale market environment. Sales of commercial products
increased from $17.0 million to $21.6 million and from $49.6
million to $63.4 million, for the quarter and fiscal year-to-date,
respectively. This approximate 28% increase in commercial net sales
for the quarter and year-to-date is primarily due to expanded
commercial office product offerings and improved industry
performance of hospitality products. Gross margin for the quarter
ended March 31, 2006 was 19.4% compared to 17.9% in the prior year
quarter. The gross margin improvement for the quarter is a result
of a greater percentage of shipments of commercial office,
hospitality and foreign sourced products whose margins were not as
significantly impacted by raw material cost increases. In addition,
selected selling price increases have been implemented. However,
the Company has been unable to fully pass on these raw material
cost increases on domestically manufactured product. For the nine
months ended March 31, 2006, the gross margin was 19.2% compared to
18.5% for the prior year nine-month period, reflecting the improved
margin in the current quarter. Selling, general and administrative
expenses were 16.5% and 16.4% of net sales for the quarters ended
March 31, 2006 and 2005, respectively. For the nine months ended
March 31, 2006 and 2005, selling, general and administrative
expenses were 17.3% and 16.6%, respectively. The increase in
selling, general and administrative costs on a year-to-date basis
in comparison to prior year resulted from increases in marketing
and royalty expenses, general increases in other fixed
administrative expenses and the recording of stock-based
compensation expense related to stock option grants. During the
quarter ended March 31, 2005, the Company recorded a pre-tax gain
on the sale of a former manufacturing facility of $0.2 million. For
the fiscal year-to-date in 2005 the Company recorded pre-tax gains
of $0.8 million on the sale of facilities. The income tax rate was
39.3% and 39.2% for the quarter and fiscal year-to-date periods
ending March 31, 2006, respectively. The Company expects that the
income tax rate for its fourth fiscal quarter will be approximately
39.2%. During the quarter ended March 31, 2005, an examination by
the Internal Revenue Service of the Company's federal income tax
returns for the fiscal years ended June 30, 2003 and 2004 was
completed. Due to the favorable results, the Company reduced its
estimate of accrued tax liabilities by $0.7 million. The decrease
resulted in income tax rates of (3.7%) and 27.9% for the quarter
and fiscal year-to-date periods ending March 31, 2005,
respectively. Working capital (current assets less current
liabilities) at March 31, 2006 was $96.0 million, compared to $85.4
million at June 30, 2005. Net cash used in operating activities was
$6.5 million for the nine-month period ended March 31, 2006. Net
cash provided by operating activities was $13.6 million for the
nine-month period ended March 31, 2005. Fluctuations in net cash
used in operating activities were primarily the result of changes
in accounts receivable, inventories and accounts payable. The
increase in inventories in fiscal 2006 relates primarily to the
expansion of foreign sourced product programs. Capital expenditures
were $3.2 million during the first nine months of fiscal year 2006.
Depreciation and amortization expense was $4.1 million and $4.4
million for the nine-month periods ended March 31, 2006 and 2005,
respectively. The Company expects that capital expenditures will be
less than $0.5 million for the remainder of the fiscal year. All
earnings per share amounts are on a diluted basis. Outlook
Flexsteel Industries, Inc., and the furniture industry in general,
continues to be impacted by increases in interest rates and
geopolitical issues leading to increased energy costs and
marketplace uncertainty. U. S. furniture manufacturers continue to
be faced with competition and pricing pressures from foreign
sourced products. The Company expects these challenging business
conditions, which could have an impact on its results of
operations, to continue through the remainder of the fiscal year.
In response to the aforementioned challenges, the Company continues
to monitor sell prices for its products and continues to identify
and implement cost control opportunities in all facets of its
business. The Company believes it has the necessary inventories,
product offerings and commitments in place to take advantage of
opportunities for expansion into new markets. The Company believes
that its strategy of providing furniture from a broad and varied
selection of domestically manufactured and foreign sourced products
is a sound business practice that it will continue to pursue.
Analysts Conference Call The Company will host a conference call
for analysts on Thursday, April 20, 2006, at 10:30 a.m. Central
Time. To access the call, please dial 1-888-275-4480 and provide
the operator with ID# 6095174. A replay will be available for two
weeks beginning approximately two hours after the conclusion of the
call by dialing 1-800-642-1687 and entering ID# 6095174.
Forward-Looking Statements Statements, including those in this
release, which are not historical or current facts, are
"forward-looking statements" made pursuant to the safe harbor
provisions of the Private Securities Litigation Reform Act of 1995.
There are certain important factors that could cause results to
differ materially from those anticipated by some of the statements
made herein. Investors are cautioned that all forward-looking
statements involve risk and uncertainty. Some of the factors that
could affect results are the cyclical nature of the furniture
industry, the effectiveness of new product introductions, the
product mix of sales, the cost of raw materials, foreign currency
revaluations, actions by governments including taxes and tariffs,
the amount of sales generated and the profit margins thereon,
competition (both foreign and domestic), changes in interest rates,
credit exposure with customers and general economic conditions. Any
forward-looking statement speaks only as of the date of this press
release. The Company specifically declines to undertake any
obligation to publicly revise any forward-looking statements that
have been made to reflect events or circumstances after the date of
such statements or to reflect the occurrence of anticipated or
unanticipated events. About Flexsteel Flexsteel Industries, Inc. is
headquartered in Dubuque, Iowa, and was incorporated in 1929.
Flexsteel is a designer, manufacturer, importer and marketer of
quality upholstered and wood furniture for residential,
recreational vehicle, office, hospitality and healthcare markets.
All products are distributed nationally. For more information,
visit our web site at http://www.flexsteel.com. -0- *T FLEXSTEEL
INDUSTRIES, INC. AND SUBSIDIARIES CONDENSED CONSOLIDATED BALANCE
SHEETS (UNAUDITED) March 31, June 30, 2006 2005 -------------
------------- ASSETS CURRENT ASSETS: Cash and cash
equivalents........... $801,050 $1,706,584
Investments......................... 754,690 1,508,751 Trade
receivables, net.............. 50,542,637 48,355,070
Inventories......................... 86,786,489 69,945,400
Other............................... 6,942,728 6,281,869
------------- ------------- Total current
assets...................... 145,827,594 127,797,674 NONCURRENT
ASSETS: Property, plant, and equipment, net. 25,275,425 26,140,914
Other assets........................ 13,795,317 12,719,090
------------- -------------
TOTAL..................................... $184,898,336
$166,657,678 ============= ============= LIABILITIES AND
SHAREHOLDERS' EQUITY CURRENT LIABILITIES: Accounts payable -
trade............... $20,481,928 $16,259,905 Notes payable and
current maturities of long-term debt........................
6,356,164 5,000,000 Accrued liabilities....................
22,974,834 21,149,428 ------------- ------------- Total current
liabilities................. 49,812,926 42,409,333 LONG-TERM
LIABILITIES: Long-term debt......................... 21,969,674
12,800,000 Other long-term liabilities............ 6,760,423
6,650,625 ------------- ------------- Total
liabilities......................... 78,543,023 61,859,958
SHAREHOLDERS' EQUITY...................... 106,355,313 104,797,720
------------- -------------
TOTAL..................................... $184,898,336
$166,657,678 ============= ============= FLEXSTEEL INDUSTRIES, INC.
AND SUBSIDIARIES CONSOLIDATED STATEMENTS OF INCOME (UNAUDITED)
Three Months Ended Nine Months Ended March 31, March 31,
--------------------------- --------------------------- 2006 2005
2006 2005 ------------- ------------- ------------- -------------
NET SALES..... $110,345,280 $101,348,058 $314,081,702 $304,254,441
COST OF GOODS SOLD......... (88,979,296) (83,175,515) (253,869,453)
(247,826,424) ------------- ------------- -------------
------------- GROSS MARGIN.. 21,365,984 18,172,543 60,212,249
56,428,017 SELLING, GENERAL AND ADMINI- STRATIVE..... (18,223,706)
(16,627,533) (54,320,932) (50,637,603) GAIN ON SALE OF FACILITIES
200,409 809,022 ------------- ------------- -------------
------------- OPERATING INCOME....... 3,142,278 1,745,419 5,891,317
6,599,436 ------------- ------------- ------------- -------------
OTHER INCOME (EXPENSE): Interest and other income... 247,120
141,687 554,055 436,373 Interest expense.. (487,530) (247,448)
(1,118,934) (791,441) ------------- ------------- -------------
------------- Total... (240,410) (105,761) (564,879) (355,068)
------------- ------------- ------------- ------------- INCOME
BEFORE INCOME TAXES. 2,901,868 1,639,658 5,326,438 6,244,368
BENEFIT FROM (PROVISION FOR) INCOME TAXES........ (1,140,000)
60,000 (2,090,000) (1,740,000) ------------- -------------
------------- ------------- NET INCOME.... $1,761,868 $1,699,658
$3,236,438 $4,504,368 ============= ============= =============
============= AVERAGE NUMBER OF COMMON SHARES OUTSTANDING:
Basic..... 6,562,456 6,539,079 6,556,669 6,528,179 =============
============= ============= ============= Diluted... 6,583,230
6,606,997 6,576,487 6,602,816 ============= =============
============= ============= EARNINGS PER SHARE OF COMMON STOCK:
Basic..... $0.27 $0.26 $0.49 $0.69 ============= =============
============= ============= Diluted... $0.27 $0.26 $0.49 $0.68
============= ============= ============= ============= FLEXSTEEL
INDUSTRIES, INC. AND SUBSIDIARIES CONDENSED CONSOLIDATED STATEMENTS
OF CASH FLOWS (UNAUDITED) Nine Months Ended March 31,
------------------------- 2006 2005 ------------ ------------
OPERATING ACTIVITIES: Net income..................................
$3,236,438 $4,504,368 Adjustments to reconcile net income to net
cash provided by (used in) operating activities: Depreciation and
amortization........... 4,099,889 4,381,188 Gain on disposition of
capital assets... (41,647) (852,838) Stock based compensation
expense........ 427,000 Changes in operating assets and
liabilities............................ (14,211,816) 5,577,125
------------ ------------ Net cash (used in) provided by operating
activities................................. (6,490,136) 13,609,843
------------ ------------ INVESTING ACTIVITIES: Net purchases and
sales of investments.. 631,110 (260,599) Proceeds from sale of
capital assets.... 75,286 2,087,208 Capital
expenditures.................... (3,169,859) (2,714,835)
------------ ------------ Net cash used in investing
activities....... (2,463,463) (888,226) ------------ ------------
FINANCING ACTIVITIES: Net proceeds of borrowings..............
10,525,838 (9,605,427) Dividends paid..........................
(2,555,874) (2,543,762) Proceeds from issuance of common stock..
78,101 175,022 ------------ ------------ Net cash provided by (used
in) financing activities................................. 8,048,065
(11,974,167) ------------ ------------ Increase (decrease) in cash
and cash equivalents................................ (905,534)
747,450 Cash and cash equivalents at beginning of
period..................................... 1,706,584 2,476,521
------------ ------------ Cash and cash equivalents at end of
period.. $801,050 $3,223,971 ============ ============ *T
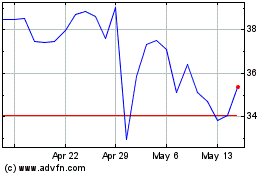
Flexsteel Industries (NASDAQ:FLXS)
Historical Stock Chart
From Oct 2024 to Nov 2024

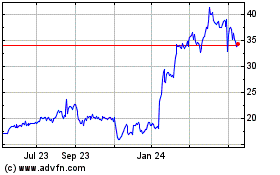
Flexsteel Industries (NASDAQ:FLXS)
Historical Stock Chart
From Nov 2023 to Nov 2024
