Fifth Third Tops, Revs Up - Analyst Blog
October 20 2011 - 9:21AM
Zacks
Fifth Third Bancorp’s (FITB) third-quarter 2011
net income of $373 million or 40 cents per share outpaced the Zacks
Consensus Estimate of 33 cents.
The results compare favorably with net income of $328 million or
35 cents per share in the prior quarter and $175 million or 22
cents per share in the prior-year quarter.
Quarterly results at Fifth Third reflect a better-than-expected
revenue figure backed by fee income growth sequentially. Credit
metrics also improved significantly. However, higher operating
expenses were on the downside.
Performance in Detail
Total revenue at Fifth Third was $1.57 billion in the third
quarter, comfortably ahead of the Zacks Consensus Estimate of $1.48
billion. Revenue also increased 2.8% sequentially but declined 10%
from the prior-year quarter. The sequential increase in revenue
primarily reflects a significant increase in non-interest income
and net interest income. However, both net interest and
non-interest income declined on a year-over- year basis.
Fifth Third’s net interest income was up 4% sequentially but
down 2% year over year to $902 million. Net interest margin surged
3 basis points (bps) sequentially but plunged 5 bps year over year
to 3.65%.
The sequential increase in income and margin during the reported
quarter reflected growth in C&I, residential mortgage, auto,
and bankcard loan balances, as well as in investment securities.
These increases more than offset lower yields on loans and
securities given the current interest rate environment.
On a year-over-year basis, both net interest income and margin
decreased mainly due to lower loan and investment securities
yields, partly offset by higher average loan balances, run-off in
higher-priced CDs, and mix shift to lower cost deposit
products.
Average portfolio loan and lease balances inched up 1%
sequentially and 3% year over year. Average core deposits were flat
sequentially and climbed 4% year over year as transaction deposit
growth was partially offset by continued runoff of consumer time
deposits (CDs).
Fifth Third’s non-interest income upped 1% sequentially but
plummeted 20% year over year to $665 million. The sequential
progress was attributable to securities gains, higher
mortgage-related revenue and deposit service charges. However, the
year-over-year decline resulted from decreased mortgage-related
revenue, reduced deposit service charges and other non-interest
income.
Fifth Third’s non-interest expenses increased 5% sequentially
but dropped 3% year over year to $946 million. Excluding $28
million of costs related to the termination of certain FHLB
borrowings and hedging transactions in the third quarter,
non-interest expense inched up 2% sequentially, attributed to
increase in credit-related costs and card and processing
expense.
These were partly offset by lower housing investments impairment
expense. The year-over-year decline reflected substantially lower
credit-related expenses.
Credit Quality
Credit metrics improved in the reported quarter at Fifth Third.
Net charge-offs were $262 million or 132 bps of average loans and
leases compared with a respective $304 million or 156 bps in the
prior quarter. Provision for loans and leases plummeted 23%
sequentially and 81% year over year to $87 million.
Total nonperforming assets, including loans held-for-sale, were
$2.1 billion, a decline of 5% from the prior quarter. The decline
was driven by the sale of assets from held-for-sale during the
quarter and by decreases in nonperforming loans and OREO in the
held-for-investment portfolio.
Capital Ratios
Fifth Third’s capital ratios were mixed during the quarter.
Sequentially, the Tier 1 common equity ratio increased 13 bps to
9.33% while Tier 1 capital ratio increased 3 bps to 11.96%,
reflecting retained earnings growth offset by the redemption of
TRUPs during the quarter. Total capital ratio improved 22 bps to
16.25%, and leverage ratio climbed 5 bps to 11.08%.
However, the tangible common equity to tangible assets ratio
inched down 1 bps to 8.63%, excluding unrealized gains/losses.
Fifth Third posted an increase in both book value and tangible
book value per share. As of September 30, 2011, book value per
share was $13.73 and tangible book value per share was $11.05, up
from $13.23 and $10.55, respectively, as of June 30, 2011.
Return on assets was 1.34% and return on average common equity
was 11.9%, up from 1.22% and 11.0%, respectively, in the prior
quarter.
Our Take
We believe Fifth Third is well positioned to benefit from a
rebound in economic conditions along its footprint. Its diverse
revenue mix augurs well. Improved credit metrics are
encouraging. This has been a trend in this quarter and many of the
Wall Street biggies such as U.S. Bancorp (USB),
Citigroup Inc. (C) and JPMorgan Chase
& Company (JPM) have similarly posted
better-than-expected results on lower loan loss provisions.
However, regulatory issues remain an overhang.
Fifth Third retains a Zacks #3 Rank, which translates into a
short-term ‘Hold’ recommendation. Moreover, considering the
fundamentals, we have maintained a “Neutral” recommendation on the
stock
CITIGROUP INC (C): Free Stock Analysis Report
FIFTH THIRD BK (FITB): Free Stock Analysis Report
JPMORGAN CHASE (JPM): Free Stock Analysis Report
US BANCORP (USB): Free Stock Analysis Report
Zacks Investment Research
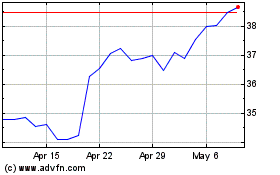
Fifth Third Bancorp (NASDAQ:FITB)
Historical Stock Chart
From May 2024 to Jun 2024

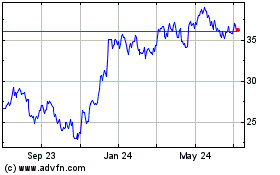
Fifth Third Bancorp (NASDAQ:FITB)
Historical Stock Chart
From Jun 2023 to Jun 2024
