false 0000711772 0000711772 2023-07-18 2023-07-18
UNITED STATES
SECURITIES AND EXCHANGE COMMISSION
WASHINGTON, D.C. 20549
FORM 8-K
CURRENT REPORT
Pursuant to Section 13 or 15(d)
of the Securities Exchange Act of 1934
Date of Report (Date of earliest event reported): July 18, 2023
CAMBRIDGE BANCORP
(Exact name of Registrant as Specified in Its Charter)
|
|
|
|
|
| Massachusetts |
|
001-38184 |
|
04-2777442 |
| (State or Other Jurisdiction of Incorporation) |
|
(Commission File Number) |
|
(IRS Employer Identification No.) |
|
| 1336 Massachusetts Avenue |
| Cambridge, MA 02138 |
| (Address of Principal Executive Offices) (Zip Code) |
Registrant’s Telephone Number, Including Area Code: (617) 876-5500
Not Applicable
(Former Name or Former Address, if Changed Since Last Report)
Check the appropriate box below if the Form 8-K filing is intended to simultaneously satisfy the filing obligation of the registrant under any of the following provisions (see General Instructions A.2. below):
| ☐ |
Written communications pursuant to Rule 425 under the Securities Act (17 CFR 230.425) |
| ☐ |
Soliciting material pursuant to Rule 14a-12 under the Exchange Act (17 CFR 240.14a-12) |
| ☐ |
Pre-commencement communications pursuant to Rule 14d-2(b) under the Exchange Act (17 CFR 240.14d-2(b)) |
| ☐ |
Pre-commencement communications pursuant to Rule 13e-4(c) under the Exchange Act (17 CFR 240.13e-4(c)) |
Securities registered pursuant to Section 12(b) of the Act:
|
|
|
|
|
| Common Stock |
|
CATC |
|
NASDAQ |
| (Title of each class) |
|
(Trading symbol) |
|
(Name of each exchange on which registered) |
Indicate by check mark whether the registrant is an emerging growth company as defined in Rule 405 of the Securities Act of 1933 (§230.405 of this chapter) or Rule 12b-2 of the Securities Exchange Act of 1934 (§240.12b-2 of this chapter).
Emerging growth company ☐
If an emerging growth company, indicate by check mark if the registrant has elected not to use the extended transition period for complying with any new or revised financial accounting standards provided pursuant to Section 13(a) of the Exchange Act. ☐
| Item 7.01 |
Regulation FD Disclosure. |
A copy of the second quarter investor presentation is being furnished as Exhibit 99.1 and is incorporated herein by reference.
Information contained herein, including Exhibit 99.1, shall not be deemed filed for the purposes of the Securities Exchange Act of 1934, nor shall such information and Exhibit be deemed incorporated by reference in any filing under the Securities Act of 1933.
| Item 9.01. |
Financial Statements and Exhibits. |
(a) Not applicable.
(b) Not applicable.
(c) Not applicable.
(d) Exhibits.
The exhibits required by this item are set forth on the Exhibit Index
SIGNATURES
Pursuant to the requirements of the Securities Exchange Act of 1934, the registrant has duly caused this report to be signed on its behalf by the undersigned thereunto duly authorized.
|
|
|
|
|
|
|
|
|
|
|
CAMBRIDGE BANCORP |
|
|
|
|
| July 18, 2023 |
|
|
|
|
|
|
|
|
|
|
|
|
|
|
By |
|
/s/ Joseph P. Sapienza |
|
|
|
|
|
|
Joseph P. Sapienza |
|
|
|
|
|
|
Senior Vice President, Interim Chief Financial Officer (Principal Financial Officer and Principal Accounting Officer) |

Exhibit 99.1 Investor Presentation July 18, 2023 NASDAQ: CATC Parent of
Cambridge Trust Company

Contents 03 Company Profile 06 Financial Highlights 19 Strategic Focus
24 Appendix This presentation includes non-GAAP measures and should be reviewed with the Company’s Q2 2023 Earnings Release and SEC filings.
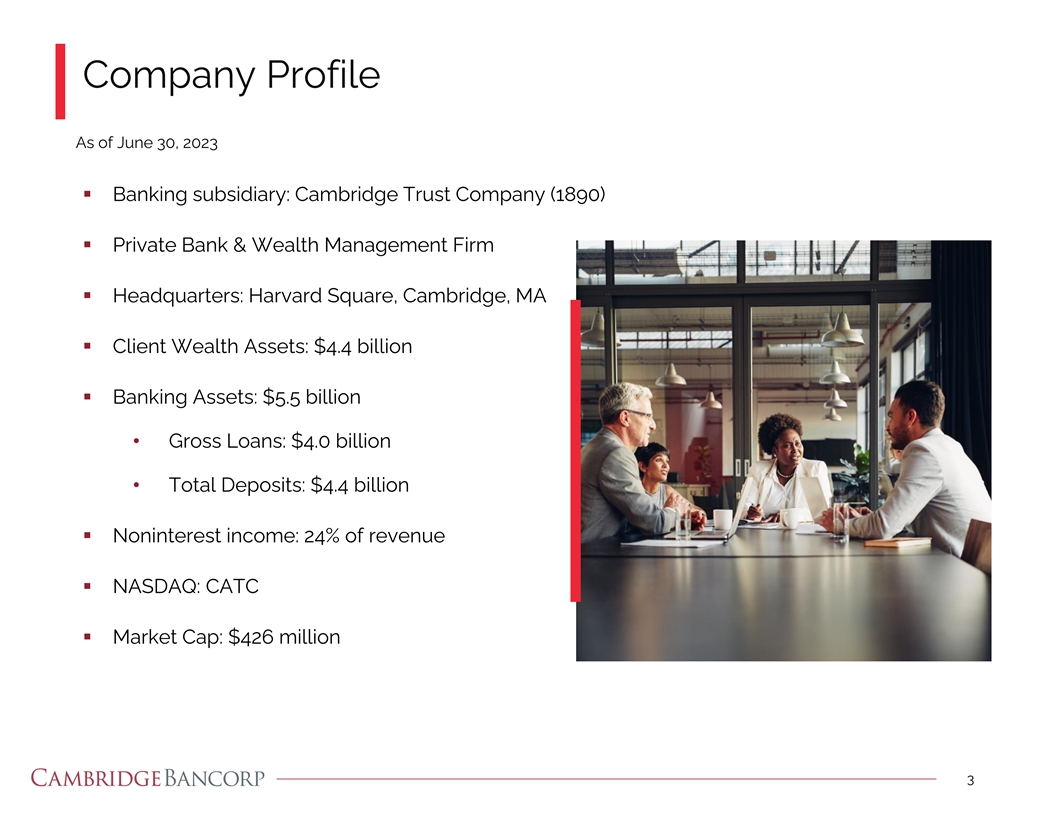
Company Profile As of June 30, 2023 ▪ Banking subsidiary:
Cambridge Trust Company (1890) ▪ Private Bank & Wealth Management Firm ▪ Headquarters: Harvard Square, Cambridge, MA ▪ Client Wealth Assets: $4.4 billion ▪ Banking Assets: $5.5 billion • Gross Loans: $4.0 billion
• Total Deposits: $4.4 billion ▪ Noninterest income: 24% of revenue ▪ NASDAQ: CATC ▪ Market Cap: $426 million 3

Geographic Footprint 1 Concord Dover 2 Portsmouth Manchester Stratham
North Hampton Bedford North Andover 3 Andover Lexington Concord Winchester Cambridge Weston Boston Wellesley Newton Needham CATC Branches (22) CATC Wealth Offices (5) 4 Source: S&P Global Market Intelligence; FDIC

Market Characteristics ▪ Wealth Management capability is 1 Median
Household Income ($000s) well-suited to the highly affluent $106 Boston and southern New $97 $74 Hampshire markets ▪ Greater Boston economy is Boston- Cambridge- Manchester-Nashua Nation diversified; the region is a global hub Newton MSA MSA
for innovation, healthcare, life 1 Proj. Household Income Change (’23 – ’28) 2 sciences, and education 16.3% 14.3% 13.4% ▪ Massachusetts is less reliant on Boston- Cambridge- Manchester-Nashua Nation federal funding compared
to other Newton MSA MSA 2 states 1 Unemployment Rates ▪ Cambridge Trust’s private banking 3.7% 2.1% model caters to entrepreneurial 1.4% local communities Boston- Cambridge- Manchester-Nashua Nation Newton MSA MSA 5 1: Source: S&P
Global Market Intelligence as of 2023, and Bureau of Labor Statistics as of May 2023. 2: Source: Boston Business Journal as of April 2021, and WalletHub as of March 2023.

Q2 2023 Performance Highlights Operating ROAA Operating EPS Operating
ROTCE 0.70% $1.23 8.51% $9.6MM 2.21% 0.00% Operating Net Adjusted Net Net Charge-Offs 1 (Annualized) Income Interest Margin 8.41% $58.05 0.95% TCE Ratio Tangible Book Allowance for Credit Value per Share Loss Ratio 6 1: Adjusted net interest margin
excludes the impact of merger related loan accretion.

Strong Capital Position As of June 30, 2023 Capital Position* 16.0%
14.2% 13.1% 13.1% 12.0% 10.5% 8.0% 8.7% 8.5% 8.4% 7.0% 4.0% 4.0% 0.0% TOTAL TIER 1 TIER I TIER I TANGIBLE COMMON EQUITY* CAPITAL CAPITAL COMMON EQUITY LEVERAGE CATC Minimum Capital Required** Tangible Book Value per Share $60.00 $58.05 $57.15 $55.00
$55.01 $50.00 $50.07 $45.00 $46.66 $40.00 $35.00 $30.00 2019 2020 2021 2022 2023 7 *Current quarter capital ratios are estimated. Tangible Common Equity is not a regulatory capital ratio. **Minimum capital required for capital adequacy plus capital
conservation buffer. Tangible Common Equity and Tangible Book Value Per Share are non-GAAP measures.

Liquidity Position As of June 30, 2023 Dollars in millions Correspondent
Bank 2 FRB Available $1,823 Available $10 Wholesale Deposits Available $192 FHLB Available $586 Total access to funds of $2.6B 1 Sources of Liquidity Estimate of Uninsured Deposits Source Available As of Uninsured $ Uninsured % 2 Federal Reserve
Bank $1,823 June 30, 2023 $1,350 30.2% Federal Home Loan Bank $586 March 31, 2023 $1,548 33.1% Wholesale Deposits $192 December 31, 2022 $2,501 51.8% Correspondent Bank $10 Total $2,611 8 1: Available liquidity is 49% loan secured, 43% investment
securities secured, and 8% unsecured. 2: FRB liquidity includes an estimate of $177MM available from the Federal Reserve’s Bank Term Funding Program as of June 30, 2023.

Deposit and Net Interest Margin Profile Deposit Composition ex.
Wholesale MMDA & Demand Other Deposits Savings 36% 24% NOW & Other Trans. Accounts Time Deposits 14% 26% Consumer Deposits- 48% Commercial Deposits- 52% 1 1 Total Deposits ex. Wholesale ($MM) Adjusted Net Interest Margin & Cost of
Deposits 1 Q2 2023 Avg. Cost of Deposits : 1.52% 1 $4,434 June 30, 2023 Spot Cost of Deposits : 1.66% $4,328 $4,086 5.00% $3,372 4.00% 3.36% 3.22% 2.93% 2.87% 2.58% 3.00% 2.21% $2,352 2.00% 0.70% 1.00% 0.25% 0.26% 1.52% 0.13% 1.01% 0.00% 2019 2020
2021 2022 Q1 '23 Q2 '23 1 1 Adj. Net Interest Margin Cost of Deposits 2019 2020 2021 2022 2023 9 2019, 2020 and 2022 include acquired balances from Optima Bank & Trust Company, Wellesley Bancorp, Inc., and Northmark Bank, respectively. 1:
Adjusted net interest margin excludes the impact of merger related loan accretion and PPP income. Cost of Deposits excludes wholesale deposits.

Wealth Management & Noninterest Income th Listed as the 17 Largest
Independent Investment Advisers in Massachusetts by the Boston Business Journal in 2023 Client Wealth Assets ($MM) Net Client Flows ($MM) YTD 2019 2020 2021 2022 2023 $4,853 $4,359 $4,168 $2,760 $3,287 $3,994 $4,656 $3,876 Starting AUM $4,060 $3,453
339 Acquired AUM* (5) (69) 90 (218) (62) Net Flows 532 437 572 (562) 285 Net Market Impact $3,287 $3,994 $4,656 $3,876 $4,099 Ending AUM 165 174 197 184 260 Custody Assets $3,453 $4,168 $4,853 $4,060 $4,359 Total WM 2019 2020 2021 2022 2023 Assets
The average relationship size was $3.2MM as of June 30, 2023 *Acquired in our merger with Wellesley Bancorp, Inc. Wealth Management Revenue ($MM) Total Noninterest Income ($MM) Fee Income was 24% of Revenue in 2023 $35.0 $33.0 $29.8 $44.3 $26.5
$43.0 $39.5 $36.4 79% 77% 75% $16.0 73% $20.7 0.84% 0.81% 0.79% 0.78% 0.79% AUM AUM AUM AUM 77% AUM Fee Fee Fee Fee Fee 2019 2020 2021 2022 YTD 2023 2019 2020 2021 2022 YTD 2023 Wealth Management All Other 10 AUM is comprised of approximately 58%
equities, 28% fixed income, and 14% cash/other as of June 30, 2023. AUM Fee represents the weighted average fee on Assets Under Management during the period.

Total Assets and Loans As of June 30, 2023 Total Assets ($MM) Loan
Portfolio Residential - Residential - $5,560 $5,490 Adjustable Fixed Rate Rate 19% $4,892 20% Consumer $3,949 1% Home Equity Construction $2,856 2% 4% Commercial & Industrial 9% CRE 45% 2019 2020 2021 2022 2023 Consumer Loans - 43% Commercial
Loans - 57% 1 Total Loans ($MM) Loan Portfolio by Interest Rate Type $4,063 $4,025 % % % $3,319 As of $3,154 Adjustable Floating Fixed June 30, 2023 44% 31% 25% $2,227 March 31, 2023 44% 31% 25% December 31, 2022 44% 31% 25% 4.73% Q2 2023 average
loan yield excluding FV accretion 2019 2020 2021 2022 2023 11 2019, 2020 and 2022 include acquired balances from Optima Bank & Trust Company, Wellesley Bancorp, Inc., and Northmark Bank, respectively. 1: Floating rate loans are tied to a market
index while adjustable-rate loans are adjusted based on contractual terms of the loan.
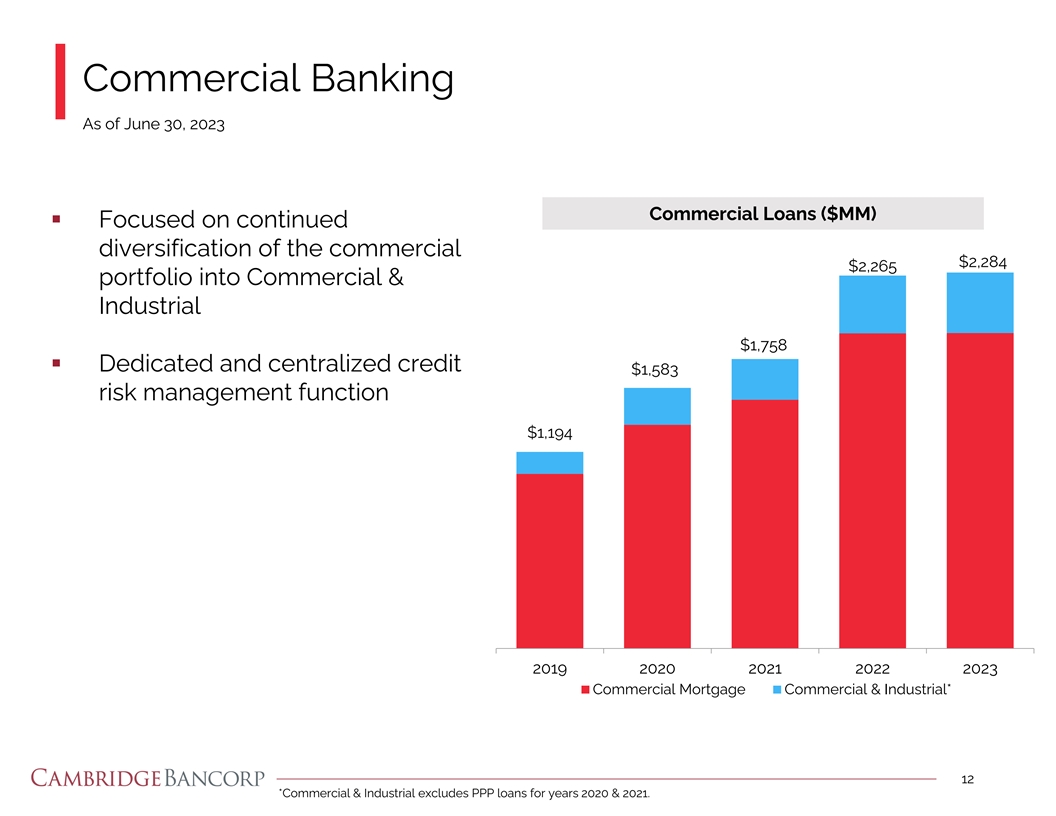
Commercial Banking As of June 30, 2023 Commercial Loans ($MM) ▪
Focused on continued diversification of the commercial $2,284 $2,265 portfolio into Commercial & Industrial $1,758 ▪ Dedicated and centralized credit $1,583 risk management function $1,194 2019 2020 2021 2022 2023 Commercial Mortgage
Commercial & Industrial* 12 *Commercial & Industrial excludes PPP loans for years 2020 & 2021.

Commercial Real Estate Loan Portfolio By Sector By Geography Hotel
& Lodging 4% Other Residential 5% MA 84% Mixed Use 5% Construction & Land 6% Multifamily 39% Industrial/ Warehouse 8% ME 2% Other 8% Other 3% Retail 10% Office 15% NH 11% Portfolio Details: • $1.9 billion outstanding as of June 30,
2023 • $1.7 million average loan size 13

Investment Office Portfolio 1 Investment Office represents 6% of
Weighted Avg. LTV Total Loans as of June 30, 2023 100% 75% Boston & Cambridge, 59% MA 3% 56% 53% 50% 25% Other Office 3% 0% Non Office 94% Boston & Other Office Total Office Cambridge, MA Portfolio Details: • $0 is past due as of June
30, 2023 • 9% of Office loans mature in the next two years • 7% of Office loans reprice in the next two years 14 1: Weighted Avg. LTV is based on total loan exposure against the most recent property appraisal.

Commercial & Industrial Loan Portfolio By Industry By Geography
Accommodation Manufacturing 2% and Food 1% Real Estate, Rental, Retail Trade 1% and Leasing 5% MA 46% Construction 6% Renewable Energy 34% Wholesale Trade 8% CT 5% Health Care and Social NH 5% Assistance 8% RI 6% Other 27% NY 11% Professional
Scientific All Other 22% and Technical 13% Industry breakout excludes PPP loans Geography breakout excludes PPP loans Portfolio Details: • $367 million outstanding as of June 30, 2023 • $594,000 average loan size 15

Consumer Loan Portfolio As of June 30, 2023 Weighted Balance Avg. LTV*
100.0 48% 57% 46% 6% Residential - Fixed 0.0 Residential - Adjustable Home Equity Usage Geography 80% 82% 1% 3% 20% 14% Owner Occupied Non-Owner Occupied MA NH ME Other $1.7B outstanding as of June 30, 2023 Weighted Average FICO 787** 16 *The
Weighted Average LTV calculation only includes one collateral property value for loans with multiple collateral and excludes loans with a zero balance. **Most recent weighted average FICO Score, excluding loans with a zero balance.

Asset Quality Highlights NPLs / Loans NPAs / Assets 0.18% 0.18% 0.16%
0.16% 0.13% 0.13% 0.12% 0.11% 2021 2022 Q1 2023 Q2 2023 2021 2022 Q1 2023 Q2 2023 Reserves / Loans Annualized Net Charge Offs (Recoveries)/Loans 1.04% 20-year average NCOs of 0.02% 0.95% 0.95% 0.93% 0.00% 0.00% 0.00% 0.00% 2021 2022 Q1 2023 Q2 2023
2021 2022 Q1 2023 Q2 2023 17

Allowance for Credit Losses (ACL) Dollars in millions Allowance for
Credit Losses: YTD 2023 0.93% 0.95% Commercial Loans ACL Ratio Q2: 1.03% Consumer Loans ACL Ratio Q2: 0.83% ACL Key Attributes: 1% • Sophisticated model uses loan level probability of default loss given default 23% discounted cash flows as the
primary basis for the quantitative loss estimation • Ending Unemployment Rate in forecast period: 4.08% • Forecast Period: 2 Quarters • Reversion Period: 4 Quarters 76% Quantitative Qualitative PCD 18

Strategic Focus 19

Strategic Progress and Focus Recent Progress Strategic Focus ▪
Expand client base & deepen existing ▪ Completed merger with Northmark Bank, relationships to grow deposit base adding attractive clients and markets ▪ Committed $140 million to support ▪ Leverage private banking model in
highly attractive markets affordable housing in Massachusetts and New Hampshire by partnering with the ▪ Increase brand awareness Massachusetts Housing Partnership and New Hampshire Housing ▪ Expand Wealth Management assets under
management ▪ Named the 17th Largest Independent Investment Advisers in Massachusetts ▪ Grow and diversify Commercial Banking (according to Boston Business Journal) opportunities & relationships ▪ Named as one of the
region’s top corporate charitable contributors (according to Boston Business Journal) ▪ Increased resources to support expansion of business development initiatives 20
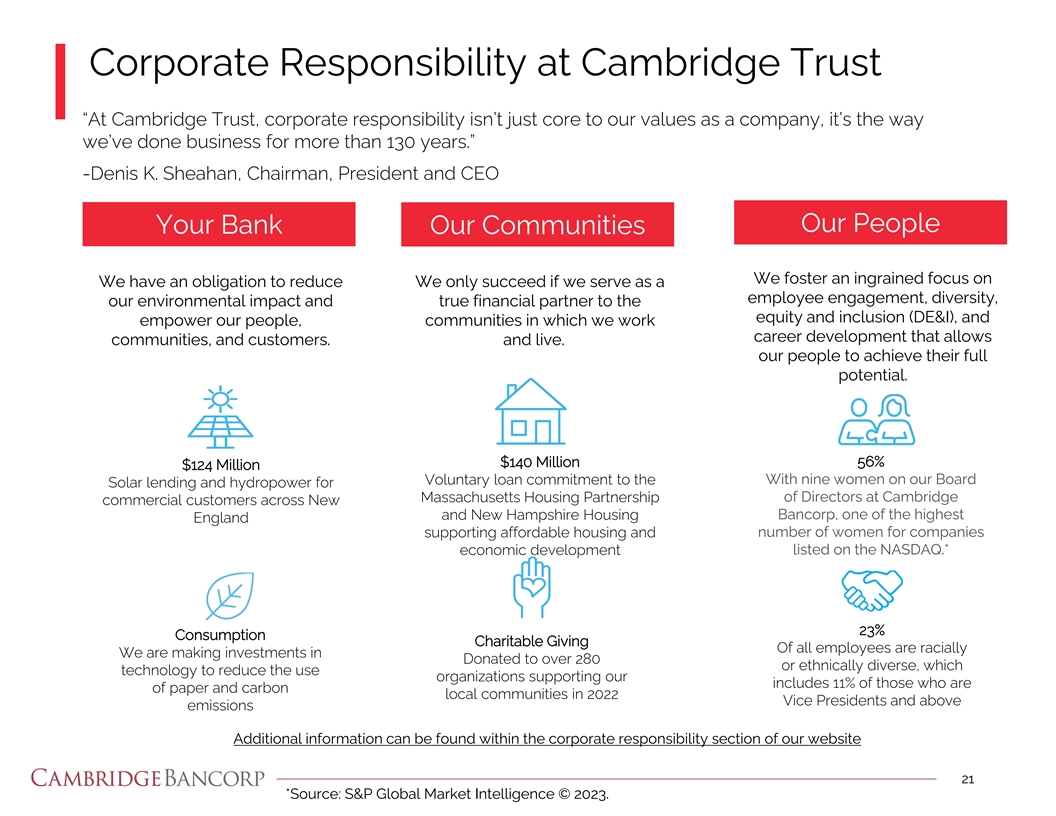
Corporate Responsibility at Cambridge Trust “At Cambridge Trust,
corporate responsibility isn’t just core to our values as a company, it’s the way we’ve done business for more than 130 years.” -Denis K. Sheahan, Chairman, President and CEO Our People Your Bank Our Communities We foster an
ingrained focus on We have an obligation to reduce We only succeed if we serve as a employee engagement, diversity, our environmental impact and true financial partner to the equity and inclusion (DE&I), and empower our people, communities in
which we work career development that allows communities, and customers. and live. our people to achieve their full potential. $140 Million 56% $124 Million With nine women on our Board Voluntary loan commitment to the Solar lending and hydropower
for of Directors at Cambridge Massachusetts Housing Partnership commercial customers across New and New Hampshire Housing Bancorp, one of the highest England supporting affordable housing and number of women for companies economic development listed
on the NASDAQ.* 23% Consumption Charitable Giving Of all employees are racially We are making investments in Donated to over 280 or ethnically diverse, which technology to reduce the use organizations supporting our includes 11% of those who are of
paper and carbon local communities in 2022 Vice Presidents and above emissions Additional information can be found within the corporate responsibility section of our website 21 *Source: S&P Global Market Intelligence © 2023.

Stock Price Performance and Dividend Trend Stock Price Performance
Declared Dividends 23 years of increased dividends (1999 – 2022) $3.50 $2.56 $2.38 $2.50 $2.04 $2.12 $2.01 $1.50 $0.50 2019 2020 2021 2022 2023 22 Source: S&P Global Market Intelligence © 2023 as of June 30, 2023. 2023 Dividends
includes all dividends declared through July 18, 2023.

Why Cambridge Bancorp? Business Model • Focused private banking
business model • Attractive geographic markets • Affluent client base • Expanding commercial services • Investing for future growth Performance • Consistently profitable • Strong returns • Core deposit
funded • Well-capitalized Credit • Strong asset quality • Sound underwriting acumen and risk management practices Culture • Client-centric service culture • Loyal client base • Experienced, conservative leadership
• Commitment to our community 23

Appendix 24

Appendix: Interest Rate Risk Profile As of June 30, 2023 These
simulations assume that there is no growth in interest-earning assets or interest-bearing liabilities over the next 12 and 24 months. Net Interest Income (NII) Sensitivity Immediate Parallel Shock – Year 1 Immediate Parallel Shock – Year
2 Up 200 (0.6%) Up 200 12.0% Up 100 (0.2%) Up 100 12.4% Down 100 0.5% Down 100 11.9% Down 200 (0.4)% Down 200 9.5% Ramps – Year 1 Up 200 (0.2%) (3.8%) Down 200 These estimates of changes in the Company’s net interest income require us to
make certain assumptions including loan- and mortgage related investment prepayment speeds, reinvestment rates, deposit cost, deposit repricing, and deposit maturities and decay rates. These assumptions are inherently uncertain and, as a result, we
cannot precisely predict the impact of changes in interest rates on net interest income. Although our analysis provides an indication of our interest rate risk exposure at a particular point in time, such estimates are not intended to, and do not,
provide a precise forecast of the effect of changes in market interest rates and will differ from actual results. 25

Forward Looking Statements and Non-GAAP Measures Certain statements
herein may constitute “forward-looking statements” as defined in the Private Securities Litigation Reform Act of 1995. Such forward-looking statements about the Company and its industry involve substantial risks and uncertainties.
Statements other than statements of current or historical fact, including statements regarding the Company’s future financial condition, results of operations, business plans, liquidity, cash flows, projected costs, and the impact of any laws
or regulations applicable to the Company. Words such as “anticipates,” “believes,” “estimates,” “expects,” “forecasts,” “intends,” “plans,” “projects,”
“may,” “will,” “should,” and other similar expressions are intended to identify these forward-looking statements. Such statements are subject to factors that could cause actual results to differ materially from
anticipated results. Such factors include, but are not limited to, the following: the businesses of Cambridge Bancorp and Northmark may not be combined successfully, or such combination may take longer to accomplish than expected; the cost savings
from the merger may not be fully realized or may take longer to realize than expected; operating costs, customer loss and business disruption following the merger, including adverse effects on relationships with employees, may be greater than
expected; changes to interest rates; the ability to control costs and expenses; the current global economic uncertainty and economic conditions being less favorable than expected; disruptions to the credit and financial markets; changes in the
Company’s accounting policies or in accounting standards; weakness in the real estate market; legislative, regulatory, or accounting changes that adversely affect the Company’s business and/or competitive position; the Dodd-Frank
Act’s consumer protection regulations; the impact of the COVID-19 pandemic and actions taken in response to the pandemic on consumer confidence and global and regional economies and economic activity; a prolonged resurgence in the severity of
the COVID-19 pandemic due to variants and mutations of the virus; disruptions in the Company’s ability to access the capital markets; effects of changes in amounts of deposits on the Company’s funding costs and net interest margin;
changes in non-performing assets; future provisions for credit losses; and other factors that are described in the Company’s filings with the Securities and Exchange Commission, including the Annual Report on Form 10-K for the year end
December 31, 2022, which the Company filed on March 16, 2023. The Company does not undertake, and specifically disclaims any obligation, to publicly release the result of any revisions which may be made to any forward-looking statements to reflect
the occurrence of anticipated or unanticipated events or circumstances after the date of such statements. You are cautioned not to place undue reliance on these forward-looking statements. This presentation contains financial information determined
by methods other than in accordance with GAAP. This information includes operating net income and operating diluted earnings per share, tangible book value per share and the tangible common equity ratio, operating return on average assets, operating
return on tangible common equity, and operating efficiency ratio. Operating net income and operating diluted earnings per share exclude items that management believes are unrelated to its core banking business such as merger and acquisition
expenses, gain (loss) on disposition of investment securities, and other items. The Company’s management uses operating net income and operating diluted earnings per share to measure the strength of the Company’s core banking business
and to identify trends that may to some extent be obscured by such excluded gains or losses. Management also supplements its evaluation of financial performance with an analysis of tangible book value per share (which is computed by dividing
shareholders’ equity less goodwill and acquisition related intangible assets, or “tangible common equity,” by common shares outstanding), the tangible common equity ratio (which is computed by dividing tangible common equity by
tangible assets, defined as total assets less goodwill and acquisition related intangibles), return on average assets and return on tangible common equity on an operating basis, and the operating efficiency ratio (which is computed by dividing
noninterest expense adjusted for non-operating expenses and total revenue adjusted for gain/(loss) on disposition of investment securities). The Company has included information on these non-GAAP financial measures because the Company believes that
investors may find it useful to have access to the same analytical tool used by management. As a result of merger and acquisition activity, the Company has recognized goodwill and other intangible assets in accordance with generally accepted
accounting principles. Excluding the impact of goodwill and other intangibles in measuring asset and capital values for the ratios provided, along with other bank standard capital ratios, provides a framework to compare the capital adequacy of the
Company to other companies in the financial services industry. These non-GAAP measures should not be viewed as a substitute for operating results and other financial measures determined in accordance with GAAP. An item which management deems to be
non-operating and excludes when computing these non-GAAP measures can be of substantial importance to the Company’s results for any particular quarter or year. The Company’s non-GAAP performance measures are not necessarily comparable to
non-GAAP performance measures which may be presented by other companies. Reconciliations of these non-GAAP financial measures to the most directly comparable GAAP financial measures are presented under “GAAP to Non-GAAP Reconciliations.
Reconciliations are included in the most recent Earnings Release, which can be located on our website here: http://ir.cambridgetrust.com/News/ 26

Cambridge Bancorp Parent of Cambridge Trust Company Denis K. Sheahan
Chairman, President and Chief Executive Officer 617-520-5520 27
v3.23.2
| X |
- DefinitionBoolean flag that is true when the XBRL content amends previously-filed or accepted submission.
| Name: |
dei_AmendmentFlag |
| Namespace Prefix: |
dei_ |
| Data Type: |
xbrli:booleanItemType |
| Balance Type: |
na |
| Period Type: |
duration |
|
| X |
- DefinitionFor the EDGAR submission types of Form 8-K: the date of the report, the date of the earliest event reported; for the EDGAR submission types of Form N-1A: the filing date; for all other submission types: the end of the reporting or transition period. The format of the date is YYYY-MM-DD.
| Name: |
dei_DocumentPeriodEndDate |
| Namespace Prefix: |
dei_ |
| Data Type: |
xbrli:dateItemType |
| Balance Type: |
na |
| Period Type: |
duration |
|
| X |
- DefinitionThe type of document being provided (such as 10-K, 10-Q, 485BPOS, etc). The document type is limited to the same value as the supporting SEC submission type, or the word 'Other'.
| Name: |
dei_DocumentType |
| Namespace Prefix: |
dei_ |
| Data Type: |
dei:submissionTypeItemType |
| Balance Type: |
na |
| Period Type: |
duration |
|
| X |
- DefinitionAddress Line 1 such as Attn, Building Name, Street Name
| Name: |
dei_EntityAddressAddressLine1 |
| Namespace Prefix: |
dei_ |
| Data Type: |
xbrli:normalizedStringItemType |
| Balance Type: |
na |
| Period Type: |
duration |
|
| X |
- Definition
+ References
+ Details
| Name: |
dei_EntityAddressCityOrTown |
| Namespace Prefix: |
dei_ |
| Data Type: |
xbrli:normalizedStringItemType |
| Balance Type: |
na |
| Period Type: |
duration |
|
| X |
- DefinitionCode for the postal or zip code
| Name: |
dei_EntityAddressPostalZipCode |
| Namespace Prefix: |
dei_ |
| Data Type: |
xbrli:normalizedStringItemType |
| Balance Type: |
na |
| Period Type: |
duration |
|
| X |
- DefinitionName of the state or province.
| Name: |
dei_EntityAddressStateOrProvince |
| Namespace Prefix: |
dei_ |
| Data Type: |
dei:stateOrProvinceItemType |
| Balance Type: |
na |
| Period Type: |
duration |
|
| X |
- DefinitionA unique 10-digit SEC-issued value to identify entities that have filed disclosures with the SEC. It is commonly abbreviated as CIK. Reference 1: http://www.xbrl.org/2003/role/presentationRef
-Publisher SEC
-Name Exchange Act
-Number 240
-Section 12
-Subsection b-2
| Name: |
dei_EntityCentralIndexKey |
| Namespace Prefix: |
dei_ |
| Data Type: |
dei:centralIndexKeyItemType |
| Balance Type: |
na |
| Period Type: |
duration |
|
| X |
- DefinitionIndicate if registrant meets the emerging growth company criteria. Reference 1: http://www.xbrl.org/2003/role/presentationRef
-Publisher SEC
-Name Exchange Act
-Number 240
-Section 12
-Subsection b-2
| Name: |
dei_EntityEmergingGrowthCompany |
| Namespace Prefix: |
dei_ |
| Data Type: |
xbrli:booleanItemType |
| Balance Type: |
na |
| Period Type: |
duration |
|
| X |
- DefinitionCommission file number. The field allows up to 17 characters. The prefix may contain 1-3 digits, the sequence number may contain 1-8 digits, the optional suffix may contain 1-4 characters, and the fields are separated with a hyphen.
| Name: |
dei_EntityFileNumber |
| Namespace Prefix: |
dei_ |
| Data Type: |
dei:fileNumberItemType |
| Balance Type: |
na |
| Period Type: |
duration |
|
| X |
- DefinitionTwo-character EDGAR code representing the state or country of incorporation.
| Name: |
dei_EntityIncorporationStateCountryCode |
| Namespace Prefix: |
dei_ |
| Data Type: |
dei:edgarStateCountryItemType |
| Balance Type: |
na |
| Period Type: |
duration |
|
| X |
- DefinitionThe exact name of the entity filing the report as specified in its charter, which is required by forms filed with the SEC. Reference 1: http://www.xbrl.org/2003/role/presentationRef
-Publisher SEC
-Name Exchange Act
-Number 240
-Section 12
-Subsection b-2
| Name: |
dei_EntityRegistrantName |
| Namespace Prefix: |
dei_ |
| Data Type: |
xbrli:normalizedStringItemType |
| Balance Type: |
na |
| Period Type: |
duration |
|
| X |
- DefinitionThe Tax Identification Number (TIN), also known as an Employer Identification Number (EIN), is a unique 9-digit value assigned by the IRS. Reference 1: http://www.xbrl.org/2003/role/presentationRef
-Publisher SEC
-Name Exchange Act
-Number 240
-Section 12
-Subsection b-2
| Name: |
dei_EntityTaxIdentificationNumber |
| Namespace Prefix: |
dei_ |
| Data Type: |
dei:employerIdItemType |
| Balance Type: |
na |
| Period Type: |
duration |
|
| X |
- DefinitionLocal phone number for entity.
| Name: |
dei_LocalPhoneNumber |
| Namespace Prefix: |
dei_ |
| Data Type: |
xbrli:normalizedStringItemType |
| Balance Type: |
na |
| Period Type: |
duration |
|
| X |
- DefinitionBoolean flag that is true when the Form 8-K filing is intended to satisfy the filing obligation of the registrant as pre-commencement communications pursuant to Rule 13e-4(c) under the Exchange Act. Reference 1: http://www.xbrl.org/2003/role/presentationRef
-Publisher SEC
-Name Exchange Act
-Number 240
-Section 13e
-Subsection 4c
| Name: |
dei_PreCommencementIssuerTenderOffer |
| Namespace Prefix: |
dei_ |
| Data Type: |
xbrli:booleanItemType |
| Balance Type: |
na |
| Period Type: |
duration |
|
| X |
- DefinitionBoolean flag that is true when the Form 8-K filing is intended to satisfy the filing obligation of the registrant as pre-commencement communications pursuant to Rule 14d-2(b) under the Exchange Act. Reference 1: http://www.xbrl.org/2003/role/presentationRef
-Publisher SEC
-Name Exchange Act
-Number 240
-Section 14d
-Subsection 2b
| Name: |
dei_PreCommencementTenderOffer |
| Namespace Prefix: |
dei_ |
| Data Type: |
xbrli:booleanItemType |
| Balance Type: |
na |
| Period Type: |
duration |
|
| X |
- DefinitionTitle of a 12(b) registered security. Reference 1: http://www.xbrl.org/2003/role/presentationRef
-Publisher SEC
-Name Exchange Act
-Number 240
-Section 12
-Subsection b
| Name: |
dei_Security12bTitle |
| Namespace Prefix: |
dei_ |
| Data Type: |
dei:securityTitleItemType |
| Balance Type: |
na |
| Period Type: |
duration |
|
| X |
- DefinitionName of the Exchange on which a security is registered. Reference 1: http://www.xbrl.org/2003/role/presentationRef
-Publisher SEC
-Name Exchange Act
-Number 240
-Section 12
-Subsection d1-1
| Name: |
dei_SecurityExchangeName |
| Namespace Prefix: |
dei_ |
| Data Type: |
dei:edgarExchangeCodeItemType |
| Balance Type: |
na |
| Period Type: |
duration |
|
| X |
- DefinitionBoolean flag that is true when the Form 8-K filing is intended to satisfy the filing obligation of the registrant as soliciting material pursuant to Rule 14a-12 under the Exchange Act. Reference 1: http://www.xbrl.org/2003/role/presentationRef
-Publisher SEC
-Name Exchange Act
-Section 14a
-Number 240
-Subsection 12
| Name: |
dei_SolicitingMaterial |
| Namespace Prefix: |
dei_ |
| Data Type: |
xbrli:booleanItemType |
| Balance Type: |
na |
| Period Type: |
duration |
|
| X |
- DefinitionTrading symbol of an instrument as listed on an exchange.
| Name: |
dei_TradingSymbol |
| Namespace Prefix: |
dei_ |
| Data Type: |
dei:tradingSymbolItemType |
| Balance Type: |
na |
| Period Type: |
duration |
|
| X |
- DefinitionBoolean flag that is true when the Form 8-K filing is intended to satisfy the filing obligation of the registrant as written communications pursuant to Rule 425 under the Securities Act. Reference 1: http://www.xbrl.org/2003/role/presentationRef
-Publisher SEC
-Name Securities Act
-Number 230
-Section 425
| Name: |
dei_WrittenCommunications |
| Namespace Prefix: |
dei_ |
| Data Type: |
xbrli:booleanItemType |
| Balance Type: |
na |
| Period Type: |
duration |
|
Cambridge Bancorporation (NASDAQ:CATC)
Historical Stock Chart
From Apr 2024 to May 2024

Cambridge Bancorporation (NASDAQ:CATC)
Historical Stock Chart
From May 2023 to May 2024
