AMERICAN WOODMARK CORP false 0000794619 0000794619 2024-08-02 2024-08-02
UNITED STATES
SECURITIES AND EXCHANGE COMMISSION
Washington, D.C. 20549
FORM 8-K
CURRENT REPORT
Pursuant to Section 13 or 15(d)
of the Securities Exchange Act of 1934
Date of Report (Date of earliest event reported): August 2, 2024
American Woodmark Corporation
(Exact name of registrant as specified in its charter)
|
|
|
|
|
| Virginia |
|
000-14798 |
|
54-1138147 |
| (State or other jurisdiction of incorporation) |
|
(Commission File Number) |
|
(I.R.S. Employer Identification Number) |
|
|
|
|
|
| 561 Shady Elm Road, Winchester, Virginia |
|
22602 |
| (Address of principal executive offices) |
|
(Zip Code) |
(540) 665-9100
(Registrant’s telephone number, including area code)
Check the appropriate box below if the Form 8-K filing is intended to simultaneously satisfy the filing obligation of the registrant under any of the following provisions:
| ☐ |
Written communications pursuant to Rule 425 under the Securities Act (17 CFR 230.425) |
| ☐ |
Soliciting material pursuant to Rule 14a-12 under the Exchange Act (17 CFR 240.14a-12) |
| ☐ |
Pre-commencement communications pursuant to Rule 14d-2(b) under the Exchange Act (17 CFR 240.14d-2(b)) |
| ☐ |
Pre-commencement communications pursuant to Rule 13e-4(c) under the Exchange Act (17 CFR 240.13e-4(c)) |
Securities registered pursuant to Section 12(b) of the Act:
|
|
|
|
|
| Title of Each Class |
|
Trading
Symbol |
|
Name of Each Exchange on Which Registered |
| Common Stock (no par value) |
|
AMWD |
|
NASDAQ Global Select Market |
Indicate by check mark whether the registrant is an emerging growth company as defined in Rule 405 of the Securities Act of 1933 (17 CFR 230.405) or Rule 12b-2 of the Securities Exchange Act of 1934 (17 CFR 240.12b-2).
Emerging growth company ☐
If an emerging growth company, indicate by check mark if the registrant has elected not to use the extended transition period for complying with any new or revised financial accounting standards provided pursuant to Section 13(a) of the Exchange Act. ☐
American Woodmark Corporation
| ITEM 7.01 |
REGULATION FD DISCLOSURE |
Beginning on August 2, 2024, American Woodmark Corporation (the “Company”) is making available to investors on the investors page of its website, https://americanwoodmark.com/investors, an investor presentation, a copy of which is furnished herewith as Exhibit 99.1 and incorporated herein by reference. The Company may periodically provide other information that may be important to investors, including future investor presentations, on the investors page of its website. Interested parties are encouraged to visit the Company’s website to view such information.
The information furnished on this Form 8-K, including the exhibit furnished herewith, shall not be deemed “filed” for purposes of Section 18 of the Securities Exchange Act of 1934, as amended (the “Exchange Act”), or otherwise subject to the liabilities of that section, nor shall it be deemed incorporated by reference into any other filings under the Securities Act of 1933, as amended, or the Exchange Act, except as expressly set forth by specific reference in such filing.
| ITEM 9.01 |
FINANCIAL STATEMENTS AND EXHIBITS |
(d) Exhibits
|
|
|
| Exhibit 99.1 |
|
Investor Presentation |
|
|
| Exhibit 104 |
|
Cover Page Interactive Data File (embedded within Inline XBRL document) |
SIGNATURES
Pursuant to the requirements of the Securities Exchange Act of 1934, the registrant has duly caused this report to be signed on its behalf by the undersigned thereunto duly authorized.
|
|
|
|
|
| AMERICAN WOODMARK CORPORATION |
| (Registrant) |
|
|
|
| /s/ PAUL JOACHIMCZYK |
|
|
|
/s/ M. SCOTT CULBRETH |
| Paul Joachimczyk |
|
|
|
M. Scott Culbreth |
| Senior Vice President and Chief Financial Officer |
|
|
|
President & Chief Executive Officer |
|
|
|
| Date: August 2, 2024 |
|
|
|
Date: August 2, 2024 |
| Signing on behalf of the registrant and as principal financial officer |
|
|
|
Signing on behalf of the registrant and as principal executive officer |

Exhibit 99.1 Investor Presentation Updated: July 2024
Legal Disclosure Forward-Looking Statements This presentation contains
certain “forward-looking statements” within the meaning of the Private Securities Litigation Reform Act of 1995, including statements as to expected future financial and operating results. These forward-looking statements may be
identified by the use of words such as “anticipate,” “estimate,” “project,” “forecast,” “expect,” “believe,” “should,” “could,” “would,”
“plan,” “may,” “intend,” “prospect,” “goal,” “will,” “predict,” or “potential” or other similar words or variations thereof. These statements are based
on the current beliefs and expectations of the management of American Woodmark and are subject to significant risks and uncertainties that could cause actual outcomes and results to differ materially from those expressed in this presentation. These
risks and uncertainties are detailed in certain of American Woodmark’s filings with the Securities and Exchange Commission (“SEC”), including in its Annual Report on Form 10-K for the year ended April 30, 2024 under the heading
“Risk Factors”, and under the heading “Management’s Discussion and Analysis of Financial Condition and Results of Operations – Forward-Looking Statements.” These reports, as well as the other documents filed by
American Woodmark with the SEC, are available free of charge at the SEC’s website at www.sec.gov. The statements made in this presentation, including with respect to any projected financial and operating results, are based on information
available to management as of the first day of the month set forth on the cover of this presentation and American Woodmark undertakes no obligation to update any such statements to reflect developments after such date. Non-GAAP Financial Measures
This presentation includes certain non-GAAP financial measures, including Adjusted EBITDA, Adjusted EBITDA Margin, Net Leverage, and Free Cash Flow. These measures are intended to serve as a supplement to, and not a substitute for, the most
comparable GAAP measures. For reconciliations of these non-GAAP financial measures to the most comparable GAAP financial measures, please see Appendix A to this presentation. 2
Table of Contents American Woodmark at a Glance 5 Long-Term Strategy 12
Competitive Advantages 22 Financial Overview 29 3
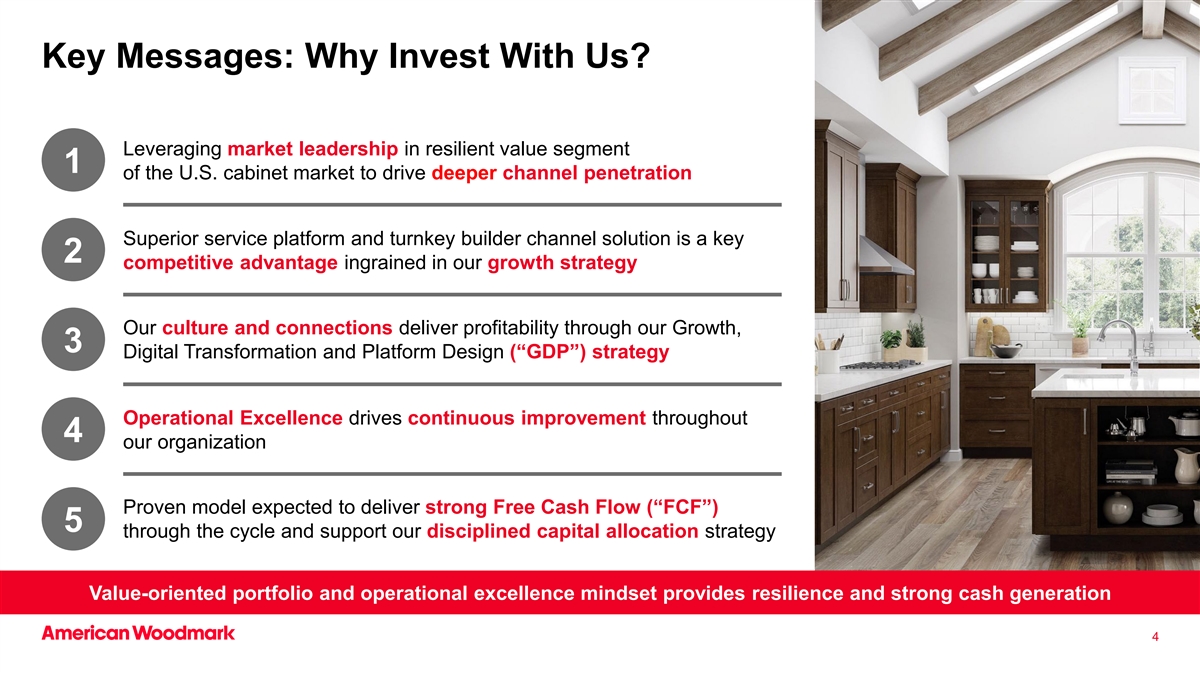
Key Messages: Why Invest With Us? Leveraging market leadership in
resilient value segment 1 of the U.S. cabinet market to drive deeper channel penetration Superior service platform and turnkey builder channel solution is a key 2 competitive advantage ingrained in our growth strategy Our culture and connections
deliver profitability through our Growth, 3 Digital Transformation and Platform Design (“GDP”) strategy Operational Excellence drives continuous improvement throughout 4 our organization Proven model expected to deliver strong Free Cash
Flow (“FCF”) 5 through the cycle and support our disciplined capital allocation strategy Value-oriented portfolio and operational excellence mindset provides resilience and strong cash generation 4
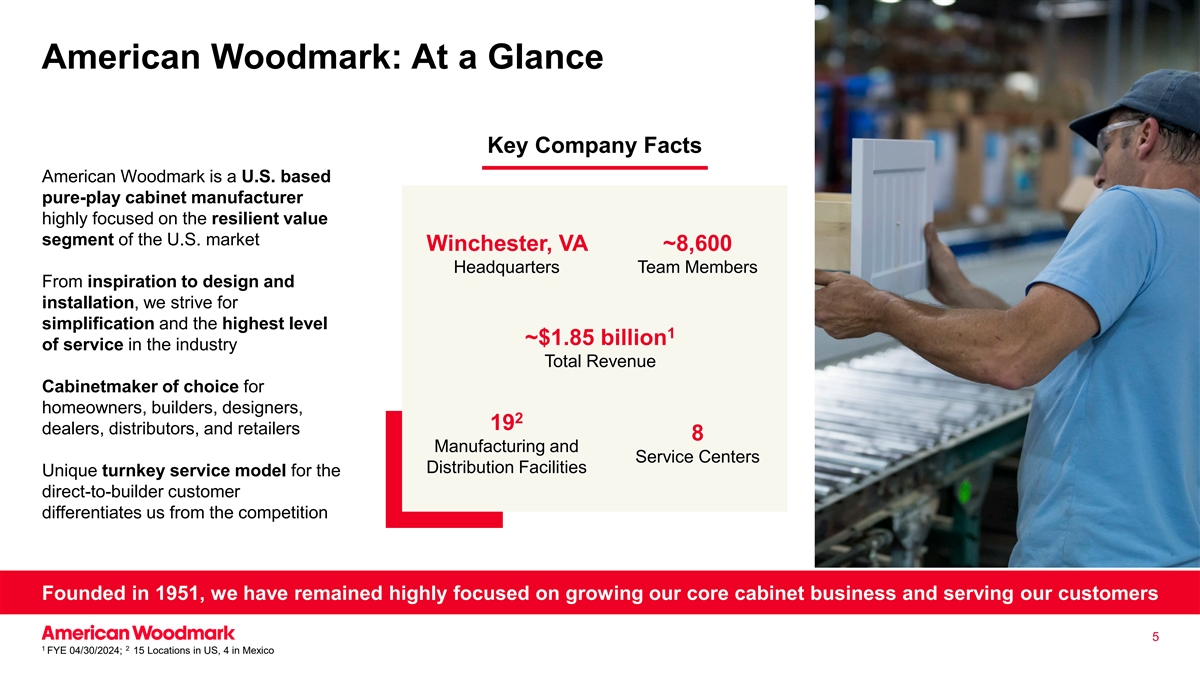
American Woodmark: At a Glance Key Company Facts American Woodmark is a
U.S. based pure-play cabinet manufacturer highly focused on the resilient value segment of the U.S. market Winchester, VA ~8,600 Headquarters Team Members From inspiration to design and installation, we strive for simplification and the highest
level 1 ~$1.85 billion of service in the industry Total Revenue Cabinetmaker of choice for homeowners, builders, designers, 2 19 dealers, distributors, and retailers 8 Manufacturing and Service Centers Distribution Facilities Unique turnkey service
model for the direct-to-builder customer differentiates us from the competition Founded in 1951, we have remained highly focused on growing our core cabinet business and serving our customers 5 1 2 FYE 04/30/2024; 15 Locations in US, 4 in
Mexico
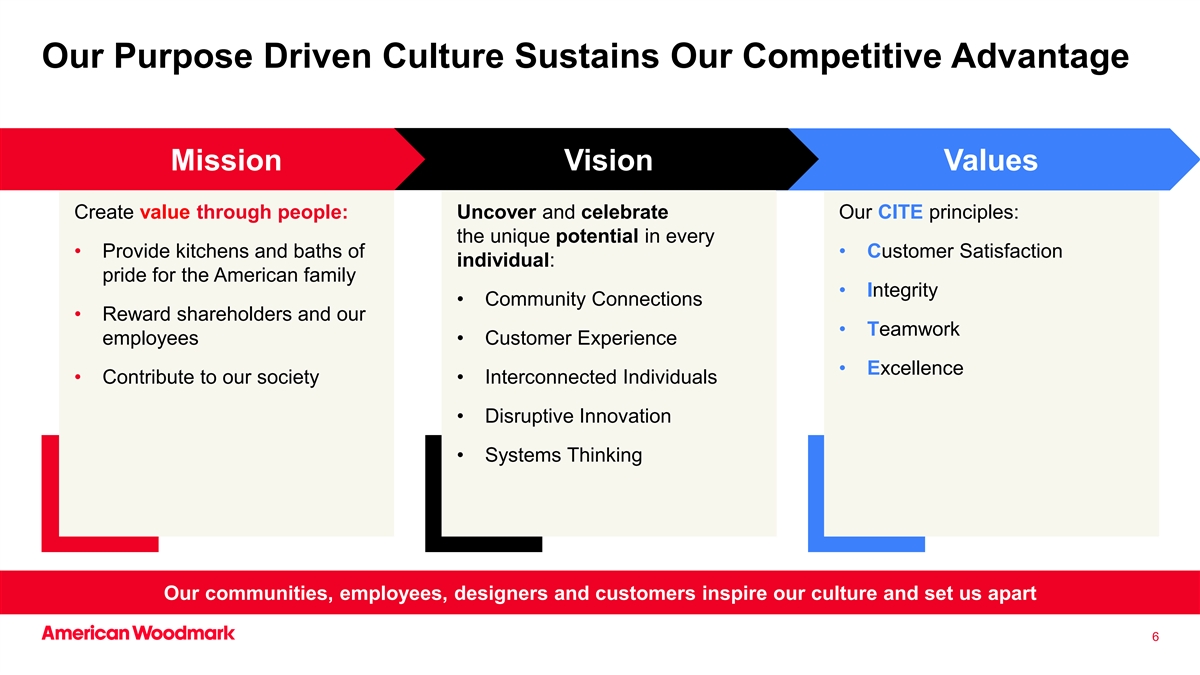
Our Purpose Driven Culture Sustains Our Competitive Advantage Mission
Vision Values Create value through people: Uncover and celebrate Our CITE principles: the unique potential in every • Provide kitchens and baths of • Customer Satisfaction individual: pride for the American family • Integrity
• Community Connections • Reward shareholders and our • Teamwork employees • Customer Experience • Excellence • Contribute to our society • Interconnected Individuals • Disruptive Innovation •
Systems Thinking Our communities, employees, designers and customers inspire our culture and set us apart 6
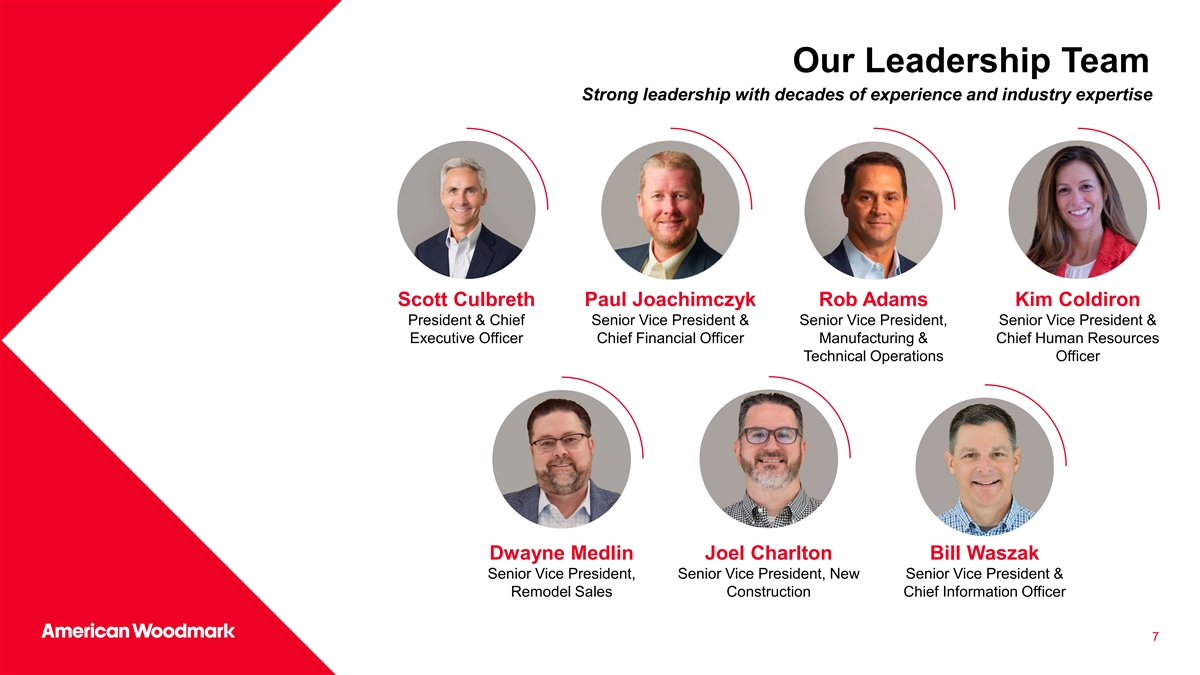
Our Leadership Team Strong leadership with decades of experience and
industry expertise Scott Culbreth Paul Joachimczyk Rob Adams Kim Coldiron President & Chief Senior Vice President & Senior Vice President, Senior Vice President & Executive Officer Chief Financial Officer Manufacturing & Chief Human
Resources Technical Operations Officer Dwayne Medlin Joel Charlton Bill Waszak Senior Vice President, Senior Vice President, New Senior Vice President & Remodel Sales Construction Chief Information Officer 7
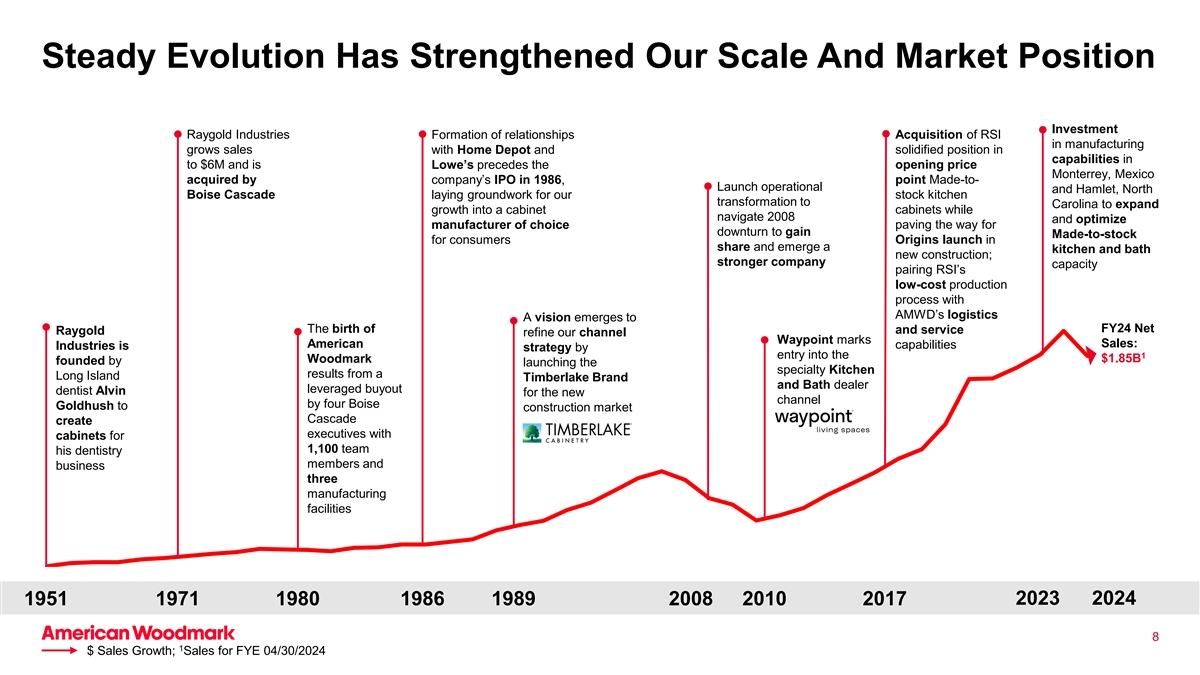
Steady Evolution Has Strengthened Our Scale And Market Position
Investment Raygold Industries Formation of relationships Acquisition of RSI in manufacturing grows sales with Home Depot and solidified position in capabilities in to $6M and is Lowe’s precedes the opening price Monterrey, Mexico acquired by
company’s IPO in 1986, point Made-to- Launch operational and Hamlet, North Boise Cascade laying groundwork for our stock kitchen transformation to Carolina to expand growth into a cabinet cabinets while navigate 2008 and optimize manufacturer
of choice paving the way for downturn to gain Made-to-stock for consumers Origins launch in share and emerge a kitchen and bath new construction; stronger company capacity pairing RSI’s low-cost production process with AMWD’s logistics A
vision emerges to The birth of FY24 Net and service Raygold refine our channel Waypoint marks American Sales: capabilities Industries is strategy by entry into the 1 Woodmark $1.85B founded by launching the specialty Kitchen results from a Long
Island Timberlake Brand and Bath dealer leveraged buyout dentist Alvin for the new channel by four Boise Goldhush to construction market Cascade create executives with cabinets for 1,100 team his dentistry members and business three manufacturing
facilities 1951 1971 1980 1986 1989 2008 2010 2017 2023 2024 8 1 $ Sales Growth; Sales for FYE 04/30/2024
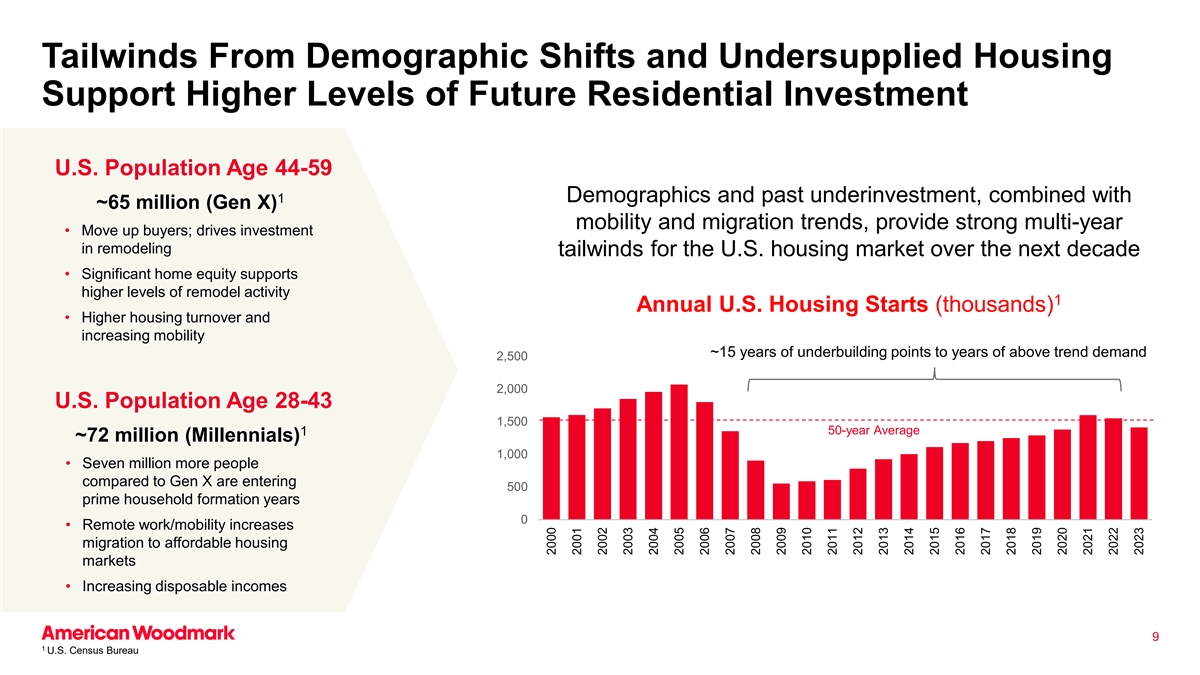
Tailwinds From Demographic Shifts and Undersupplied Housing Support
Higher Levels of Future Residential Investment U.S. Population Age 44-59 1 Demographics and past underinvestment, combined with ~65 million (Gen X) mobility and migration trends, provide strong multi-year • Move up buyers; drives investment in
remodeling tailwinds for the U.S. housing market over the next decade • Significant home equity supports higher levels of remodel activity 1 Annual U.S. Housing Starts (thousands) • Higher housing turnover and increasing mobility ~15
years of underbuilding points to years of above trend demand 2,500 2,000 U.S. Population Age 28-43 1,500 50-year Average 1 ~72 million (Millennials) 1,000 • Seven million more people compared to Gen X are entering 500 prime household formation
years 0 • Remote work/mobility increases migration to affordable housing markets • Increasing disposable incomes 9 1 U.S. Census Bureau 2000 2001 2002 2003 2004 2005 2006 2007 2008 2009 2010 2011 2012 2013 2014 2015 2016 2017 2018 2019
2020 2021 2022 2023
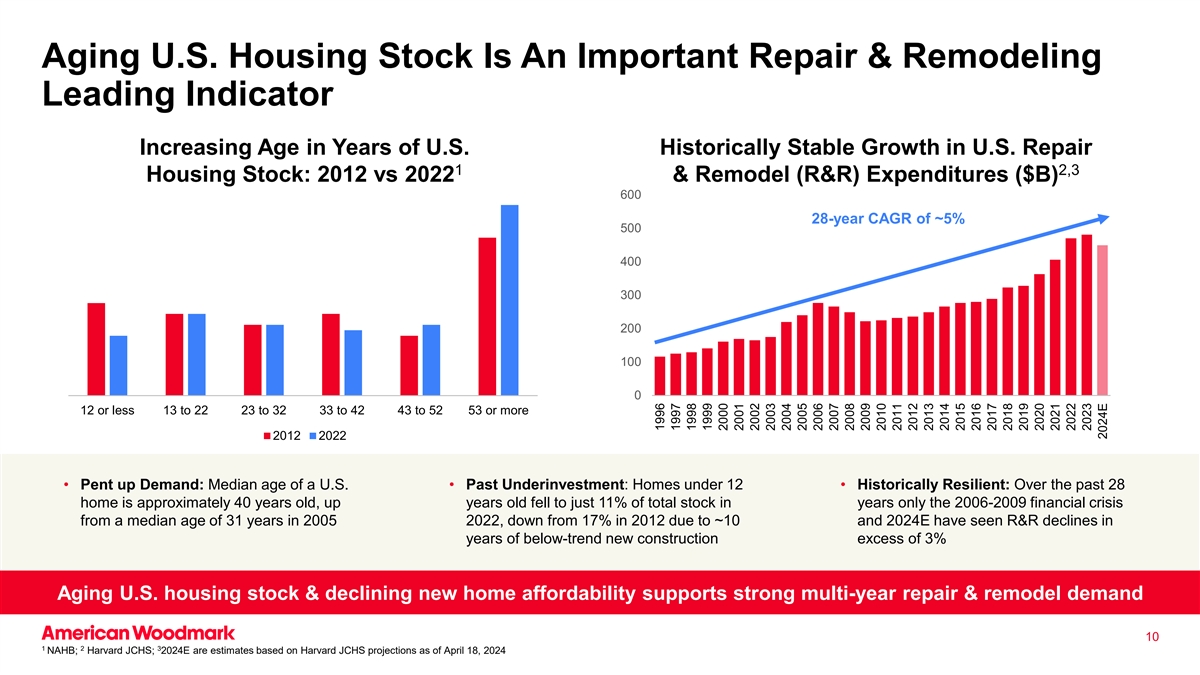
Aging U.S. Housing Stock Is An Important Repair & Remodeling
Leading Indicator Increasing Age in Years of U.S. Historically Stable Growth in U.S. Repair 1 2,3 Housing Stock: 2012 vs 2022 & Remodel (R&R) Expenditures ($B) 600 28-year CAGR of ~5% 500 400 300 200 100 0 12 or less 13 to 22 23 to 32 33 to
42 43 to 52 53 or more 2012 2022 • Pent up Demand: Median age of a U.S. • Past Underinvestment: Homes under 12 • Historically Resilient: Over the past 28 home is approximately 40 years old, up years old fell to just 11% of total
stock in years only the 2006-2009 financial crisis from a median age of 31 years in 2005 2022, down from 17% in 2012 due to ~10 and 2024E have seen R&R declines in years of below-trend new construction excess of 3% Aging U.S. housing stock &
declining new home affordability supports strong multi-year repair & remodel demand 10 1 2 3 NAHB; Harvard JCHS; 2024E are estimates based on Harvard JCHS projections as of April 18, 2024 1996 1997 1998 1999 2000 2001 2002 2003 2004 2005 2006
2007 2008 2009 2010 2011 2012 2013 2014 2015 2016 2017 2018 2019 2020 2021 2022 2023 2024E
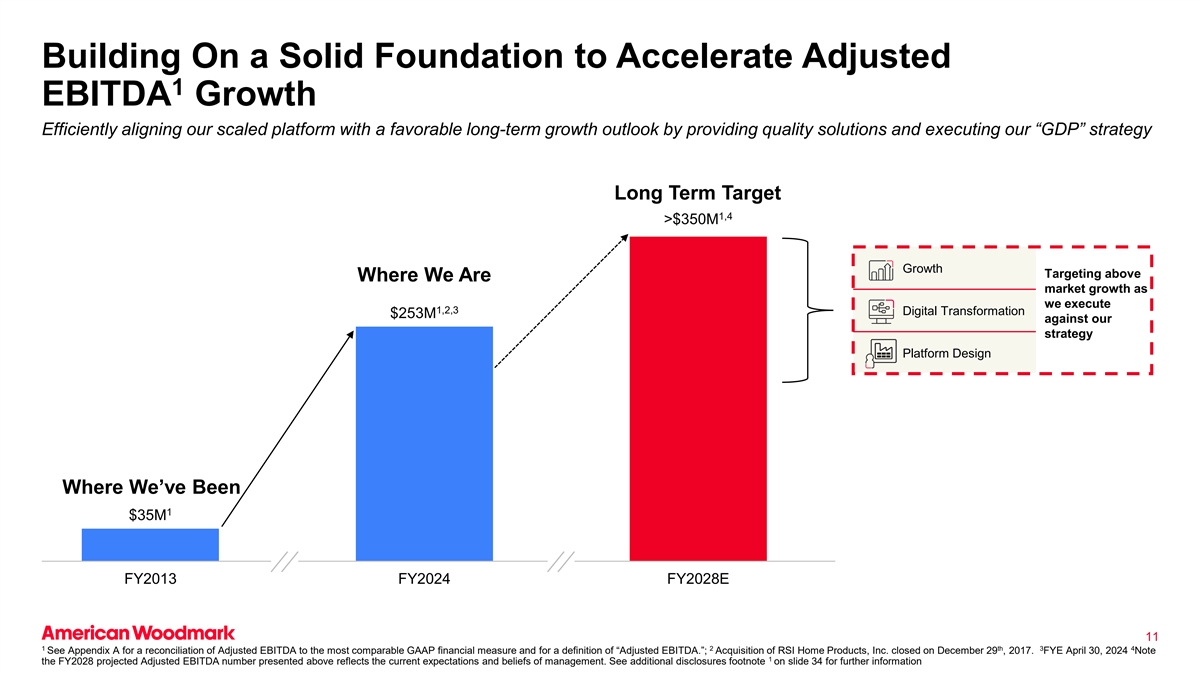
Building On a Solid Foundation to Accelerate Adjusted 1 EBITDA Growth
Efficiently aligning our scaled platform with a favorable long-term growth outlook by providing quality solutions and executing our “GDP” strategy EBITDA Long Term Target 1,4 >$350M Growth Targeting above Where We Are market growth as
we execute 1,2,3 Digital Transformation $253M against our strategy Platform Design Where We’ve Been 1 $35M FY2013 FY2024 FY2028E 11 1 2 th 3 4 See Appendix A for a reconciliation of Adjusted EBITDA to the most comparable GAAP financial measure
and for a definition of “Adjusted EBITDA.”; Acquisition of RSI Home Products, Inc. closed on December 29 , 2017. FYE April 30, 2024 Note 1 the FY2028 projected Adjusted EBITDA number presented above reflects the current expectations and
beliefs of management. See additional disclosures footnote on slide 34 for further information
Long-term Strategy: “GDP” 12
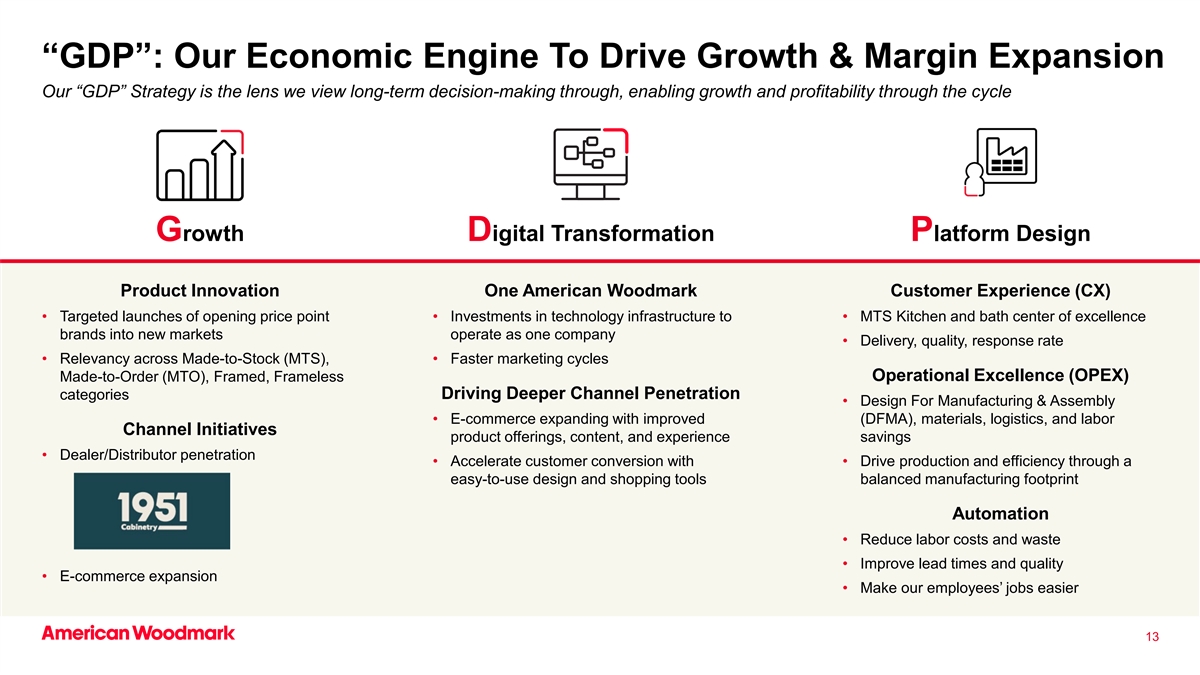
“GDP”: Our Economic Engine To Drive Growth & Margin
Expansion Our “GDP” Strategy is the lens we view long-term decision-making through, enabling growth and profitability through the cycle Growth Digital Transformation Platform Design Product Innovation One American Woodmark Customer
Experience (CX) • Targeted launches of opening price point • Investments in technology infrastructure to • MTS Kitchen and bath center of excellence brands into new markets operate as one company • Delivery, quality, response
rate • Relevancy across Made-to-Stock (MTS), • Faster marketing cycles Operational Excellence (OPEX) Made-to-Order (MTO), Framed, Frameless Driving Deeper Channel Penetration categories • Design For Manufacturing & Assembly
• E-commerce expanding with improved (DFMA), materials, logistics, and labor Channel Initiatives product offerings, content, and experience savings • Dealer/Distributor penetration • Accelerate customer conversion with •
Drive production and efficiency through a easy-to-use design and shopping tools balanced manufacturing footprint Automation • Reduce labor costs and waste • Improve lead times and quality • E-commerce expansion • Make our
employees’ jobs easier 13
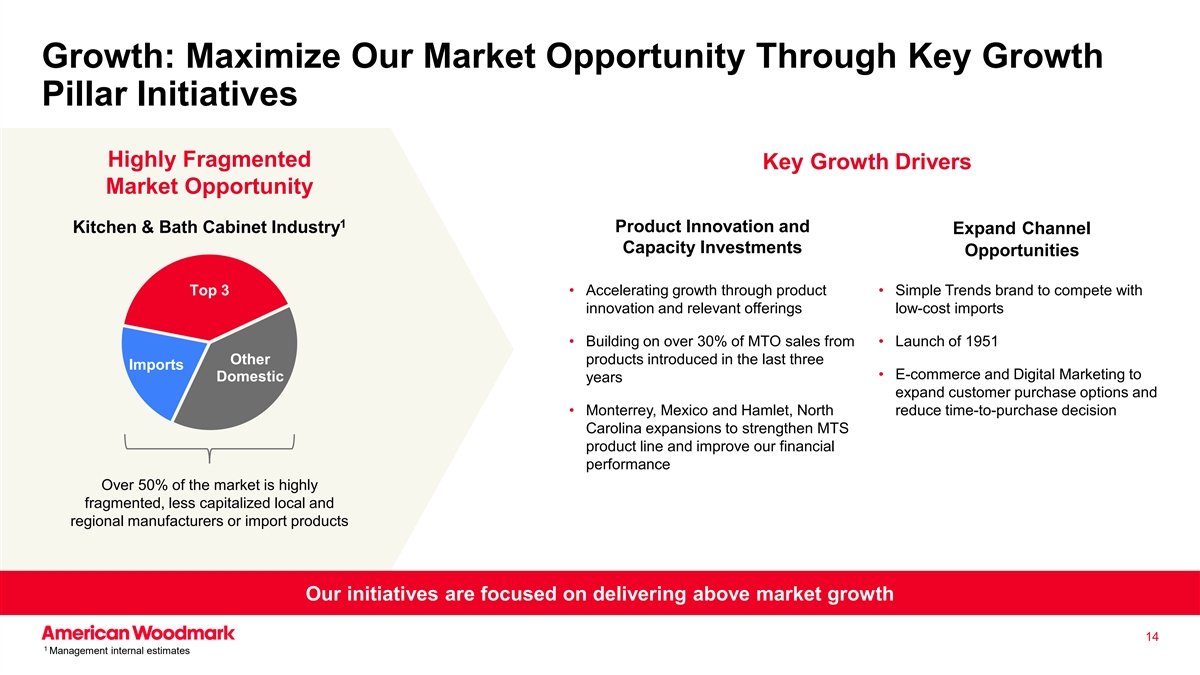
Growth: Maximize Our Market Opportunity Through Key Growth Pillar
Initiatives Highly Fragmented Key Growth Drivers Market Opportunity 1 Product Innovation and Kitchen & Bath Cabinet Industry Expand Channel Capacity Investments Opportunities Top 3 • Accelerating growth through product • Simple
Trends brand to compete with innovation and relevant offerings low-cost imports • Building on over 30% of MTO sales from • Launch of 1951 Other products introduced in the last three Imports • E-commerce and Digital Marketing to
Domestic years expand customer purchase options and • Monterrey, Mexico and Hamlet, North reduce time-to-purchase decision Carolina expansions to strengthen MTS product line and improve our financial performance Over 50% of the market is
highly fragmented, less capitalized local and regional manufacturers or import products Our initiatives are focused on delivering above market growth 14 1 Management internal estimates
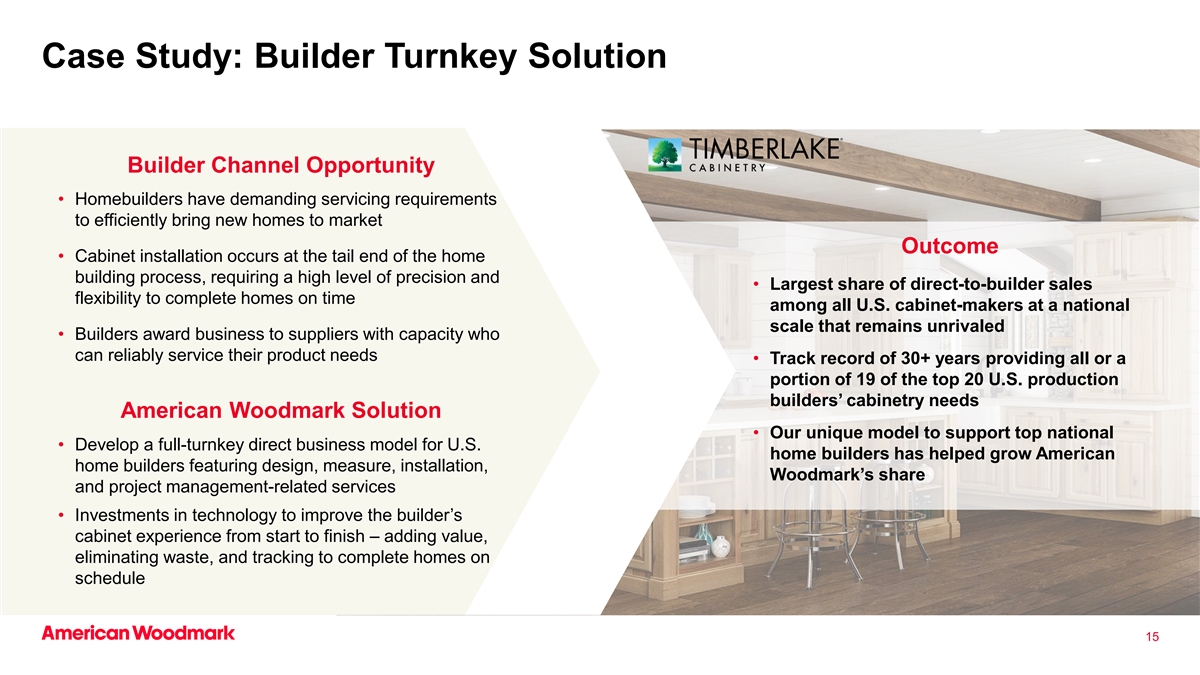
Case Study: Builder Turnkey Solution Builder Channel Opportunity
• Homebuilders have demanding servicing requirements to efficiently bring new homes to market Outcome • Cabinet installation occurs at the tail end of the home building process, requiring a high level of precision and • Largest
share of direct-to-builder sales flexibility to complete homes on time among all U.S. cabinet-makers at a national scale that remains unrivaled • Builders award business to suppliers with capacity who can reliably service their product needs
• Track record of 30+ years providing all or a portion of 19 of the top 20 U.S. production builders’ cabinetry needs American Woodmark Solution • Our unique model to support top national • Develop a full-turnkey direct
business model for U.S. home builders has helped grow American home builders featuring design, measure, installation, Woodmark’s share and project management-related services • Investments in technology to improve the builder’s
cabinet experience from start to finish – adding value, eliminating waste, and tracking to complete homes on schedule 15
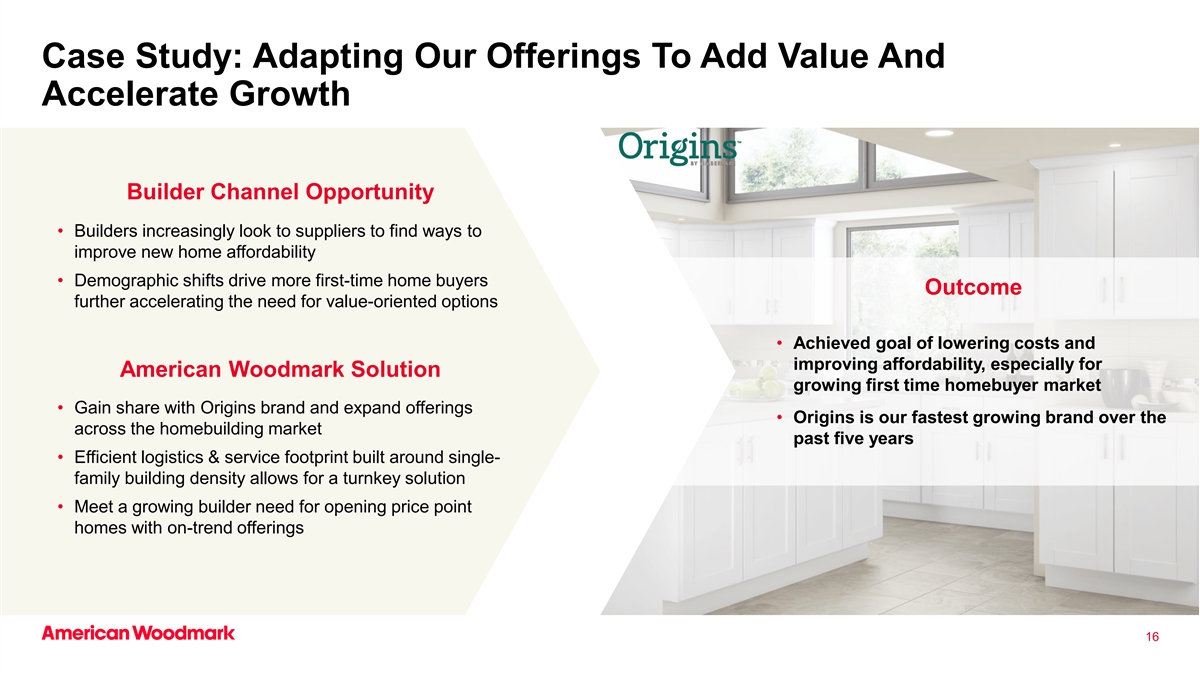
Case Study: Adapting Our Offerings To Add Value And Accelerate Growth
Builder Channel Opportunity • Builders increasingly look to suppliers to find ways to improve new home affordability • Demographic shifts drive more first-time home buyers Outcome further accelerating the need for value-oriented options
• Achieved goal of lowering costs and improving affordability, especially for American Woodmark Solution growing first time homebuyer market • Gain share with Origins brand and expand offerings • Origins is our fastest growing
brand over the across the homebuilding market past five years • Efficient logistics & service footprint built around single- family building density allows for a turnkey solution • Meet a growing builder need for opening price point
homes with on-trend offerings 16
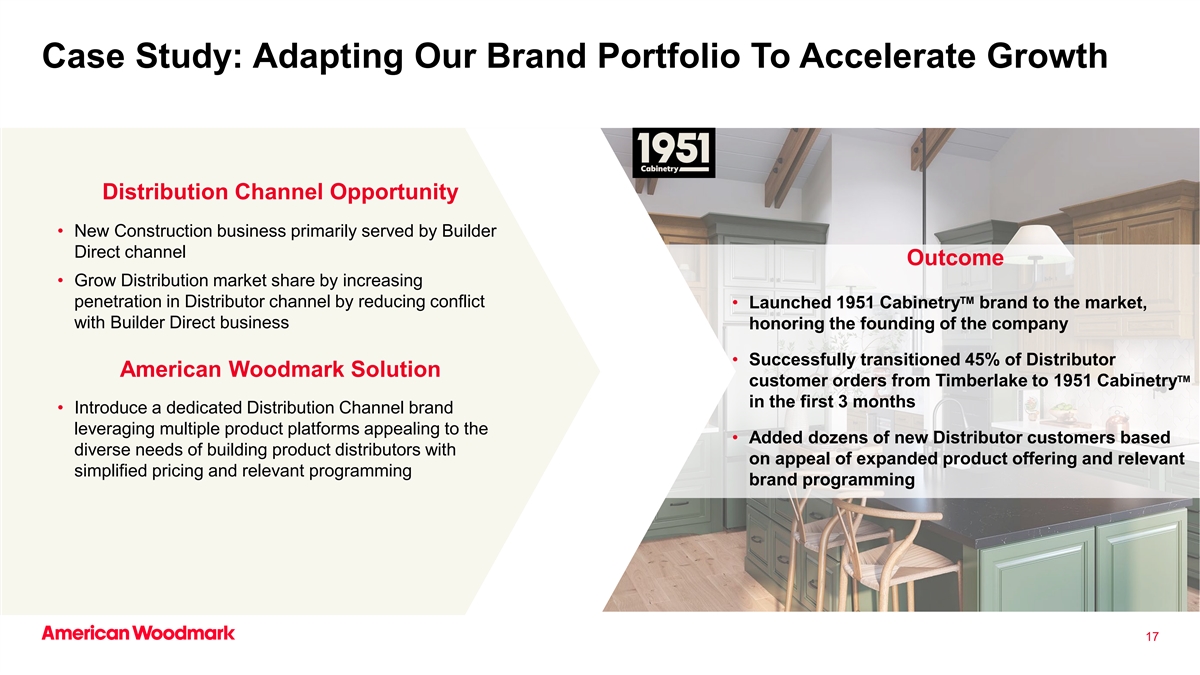
Case Study: Adapting Our Brand Portfolio To Accelerate Growth
Distribution Channel Opportunity • New Construction business primarily served by Builder Direct channel Outcome • Grow Distribution market share by increasing TM penetration in Distributor channel by reducing conflict • Launched
1951 Cabinetry brand to the market, with Builder Direct business honoring the founding of the company • Successfully transitioned 45% of Distributor American Woodmark Solution TM customer orders from Timberlake to 1951 Cabinetry in the first 3
months • Introduce a dedicated Distribution Channel brand leveraging multiple product platforms appealing to the • Added dozens of new Distributor customers based diverse needs of building product distributors with on appeal of expanded
product offering and relevant simplified pricing and relevant programming brand programming 17
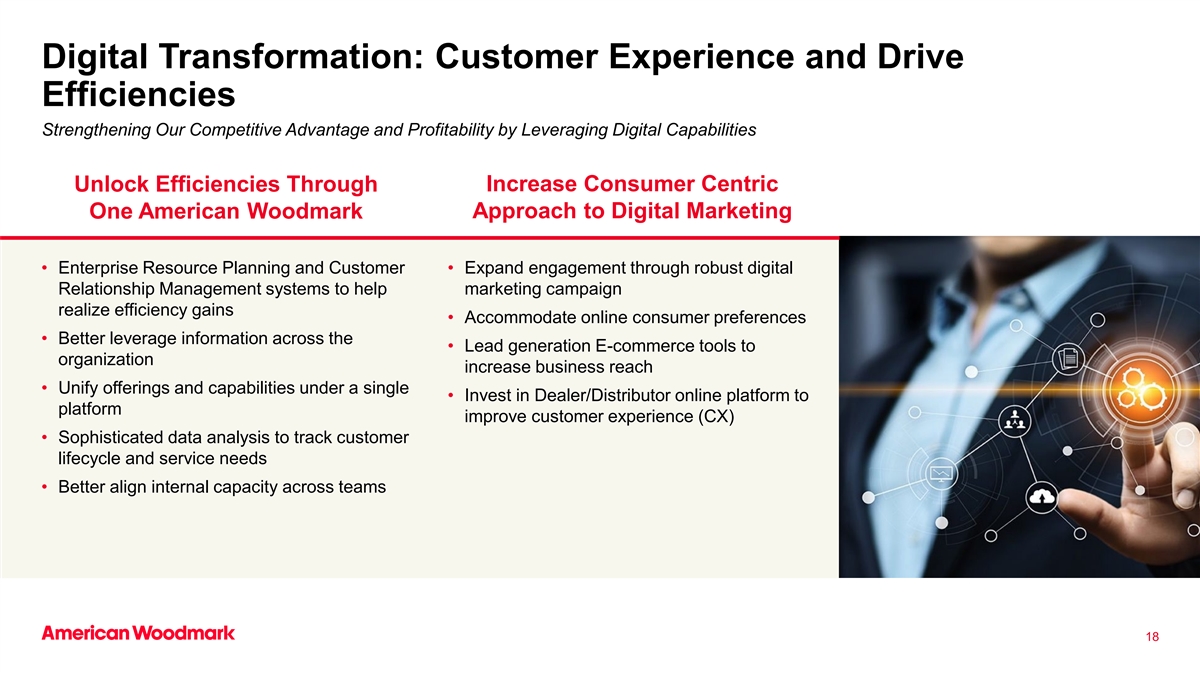
Digital Transformation: Customer Experience and Drive Efficiencies
Strengthening Our Competitive Advantage and Profitability by Leveraging Digital Capabilities Unlock Efficiencies Through Increase Consumer Centric One American Woodmark Approach to Digital Marketing • Enterprise Resource Planning and Customer
• Expand engagement through robust digital Relationship Management systems to help marketing campaign realize efficiency gains • Accommodate online consumer preferences • Better leverage information across the • Lead
generation E-commerce tools to organization increase business reach • Unify offerings and capabilities under a single • Invest in Dealer/Distributor online platform to platform improve customer experience (CX) • Sophisticated data
analysis to track customer lifecycle and service needs • Better align internal capacity across teams 18
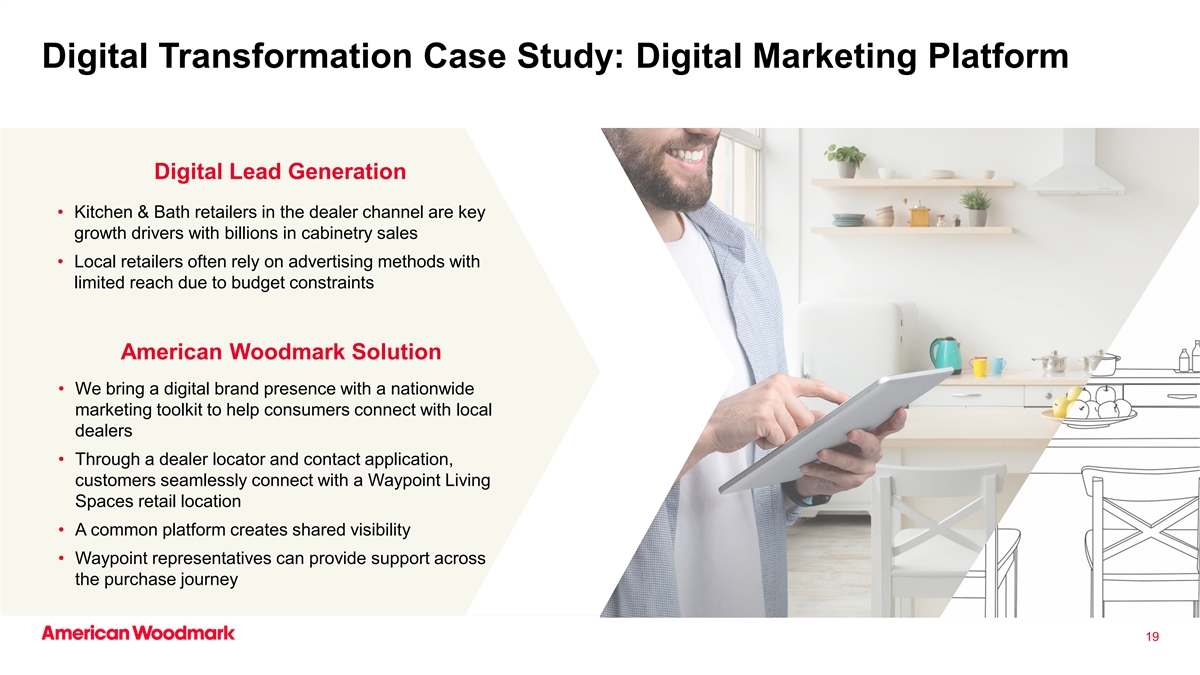
Digital Transformation Case Study: Digital Marketing Platform Digital
Lead Generation • Kitchen & Bath retailers in the dealer channel are key growth drivers with billions in cabinetry sales • Local retailers often rely on advertising methods with limited reach due to budget constraints American
Woodmark Solution • We bring a digital brand presence with a nationwide marketing toolkit to help consumers connect with local dealers • Through a dealer locator and contact application, customers seamlessly connect with a Waypoint
Living Spaces retail location • A common platform creates shared visibility • Waypoint representatives can provide support across the purchase journey 19
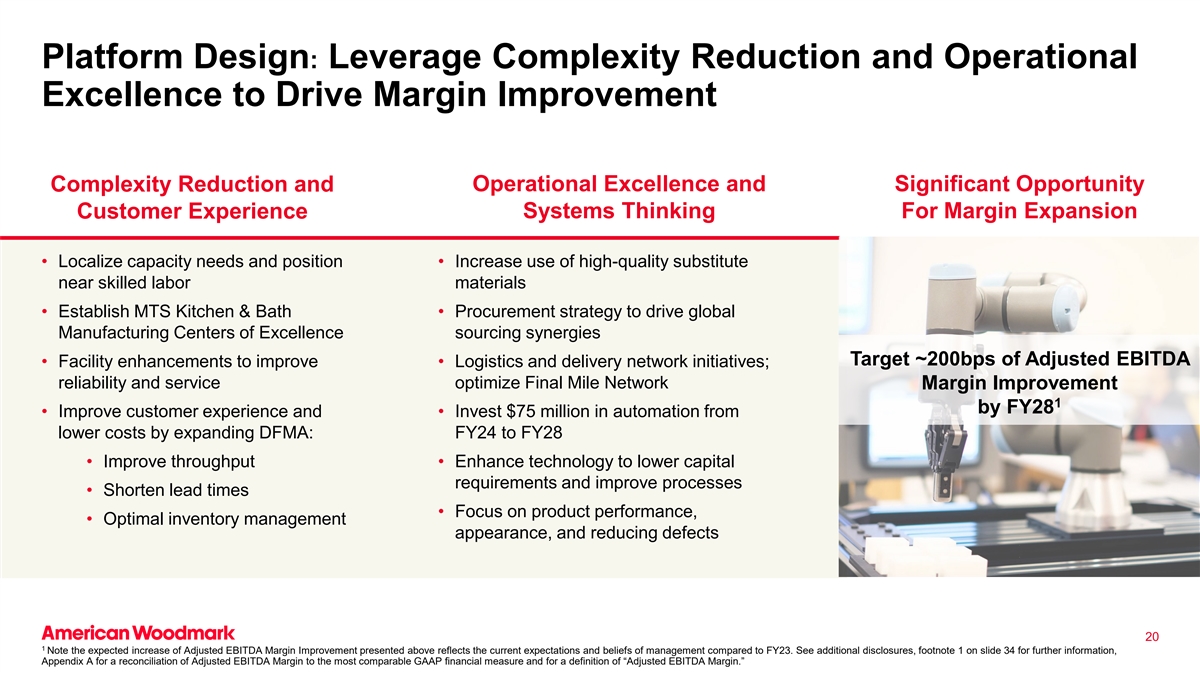
Platform Design: Leverage Complexity Reduction and Operational
Excellence to Drive Margin Improvement Complexity Reduction and Operational Excellence and Significant Opportunity Customer Experience Systems Thinking For Margin Expansion • Localize capacity needs and position • Increase use of
high-quality substitute near skilled labor materials • Establish MTS Kitchen & Bath • Procurement strategy to drive global Manufacturing Centers of Excellence sourcing synergies Target ~200bps of Adjusted EBITDA • Facility
enhancements to improve • Logistics and delivery network initiatives; reliability and service optimize Final Mile Network Margin Improvement 1 by FY28 • Improve customer experience and • Invest $75 million in automation from lower
costs by expanding DFMA: FY24 to FY28 • Improve throughput • Enhance technology to lower capital requirements and improve processes • Shorten lead times • Focus on product performance, • Optimal inventory management
appearance, and reducing defects 20 1 Note the expected increase of Adjusted EBITDA Margin Improvement presented above reflects the current expectations and beliefs of management compared to FY23. See additional disclosures, footnote 1 on slide 34
for further information, Appendix A for a reconciliation of Adjusted EBITDA Margin to the most comparable GAAP financial measure and for a definition of “Adjusted EBITDA Margin.”
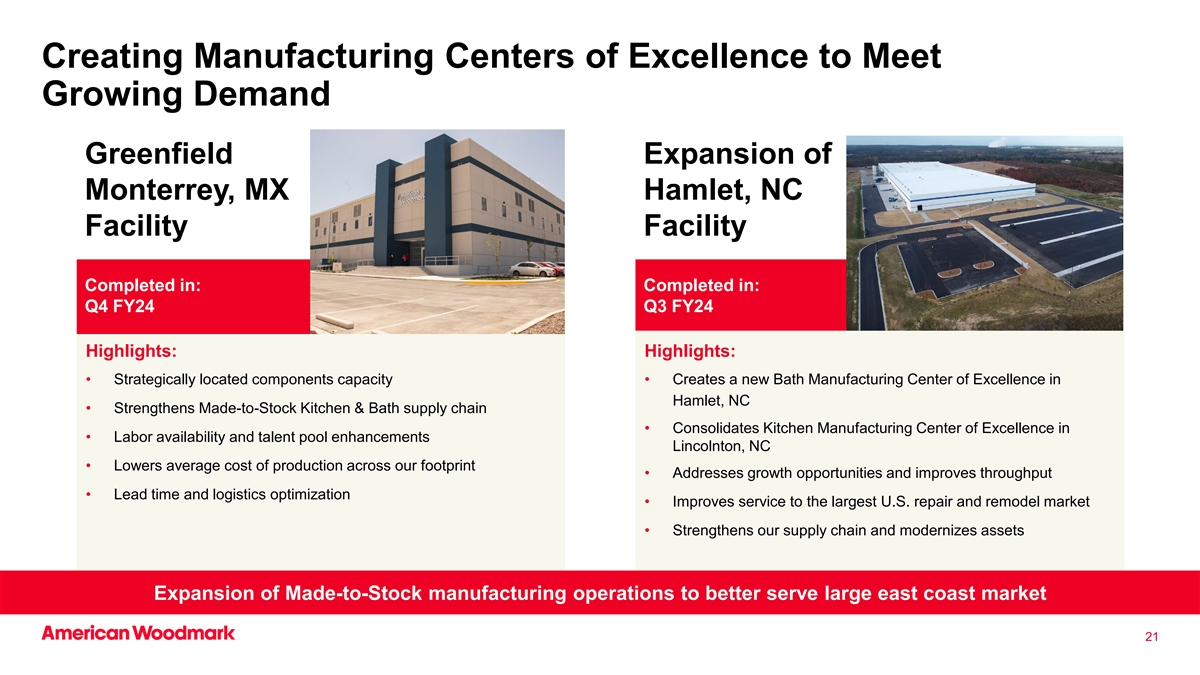
Creating Manufacturing Centers of Excellence to Meet Growing Demand
Greenfield Expansion of Monterrey, MX Hamlet, NC Facility Facility Completed in: Completed in: Q4 FY24 Q3 FY24 Highlights: Highlights: • Strategically located components capacity • Creates a new Bath Manufacturing Center of Excellence in
Hamlet, NC • Strengthens Made-to-Stock Kitchen & Bath supply chain • Consolidates Kitchen Manufacturing Center of Excellence in • Labor availability and talent pool enhancements Lincolnton, NC • Lowers average cost of
production across our footprint • Addresses growth opportunities and improves throughput • Lead time and logistics optimization • Improves service to the largest U.S. repair and remodel market • Strengthens our supply chain
and modernizes assets Expansion of Made-to-Stock manufacturing operations to better serve large east coast market 21

Competitive Advantages
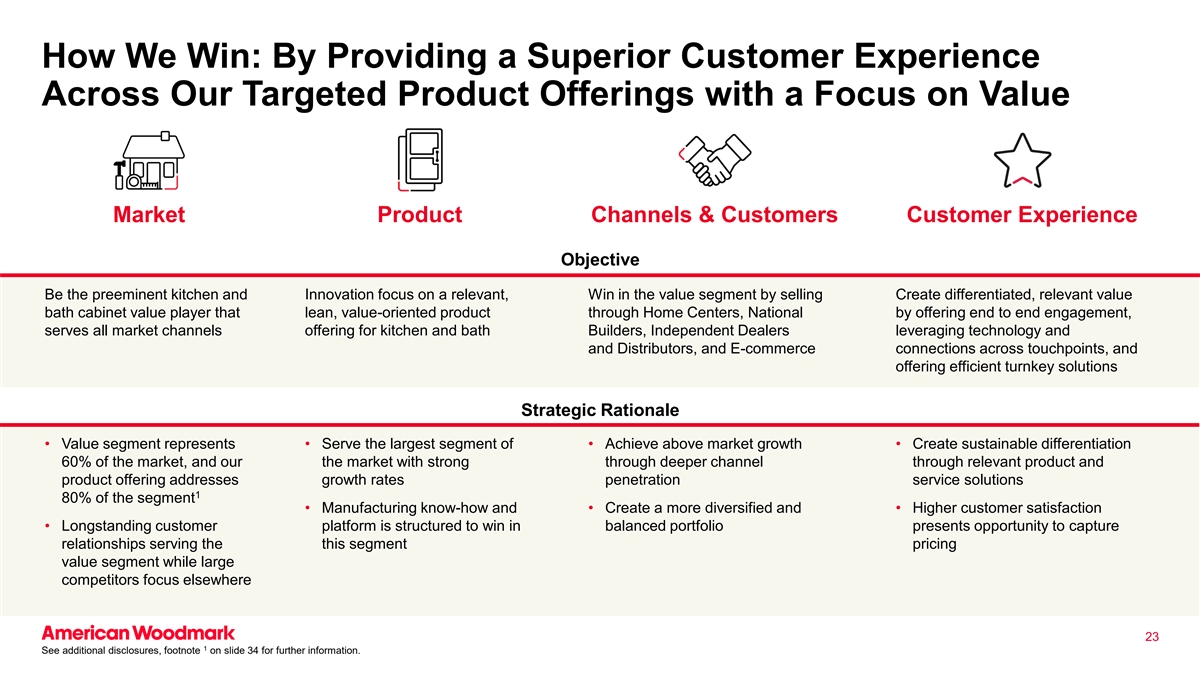
How We Win: By Providing a Superior Customer Experience Across Our
Targeted Product Offerings with a Focus on Value Market Product Channels & Customers Customer Experience Objective Be the preeminent kitchen and Innovation focus on a relevant, Win in the value segment by selling Create differentiated, relevant
value bath cabinet value player that lean, value-oriented product through Home Centers, National by offering end to end engagement, serves all market channels offering for kitchen and bath Builders, Independent Dealers leveraging technology and and
Distributors, and E-commerce connections across touchpoints, and offering efficient turnkey solutions Strategic Rationale • Value segment represents • Serve the largest segment of • Achieve above market growth • Create
sustainable differentiation 60% of the market, and our the market with strong through deeper channel through relevant product and product offering addresses growth rates penetration service solutions 1 80% of the segment • Manufacturing
know-how and • Create a more diversified and • Higher customer satisfaction • Longstanding customer platform is structured to win in balanced portfolio presents opportunity to capture relationships serving the this segment pricing
value segment while large competitors focus elsewhere 23 1 See additional disclosures, footnote on slide 34 for further information.
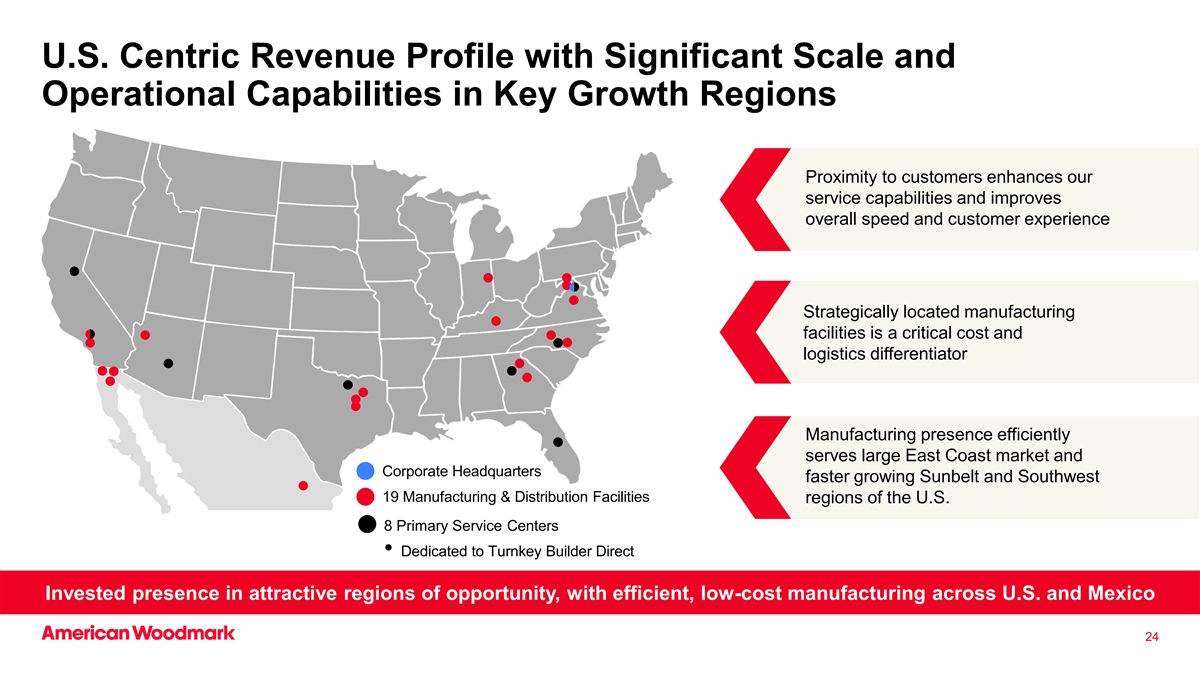
U.S. Centric Revenue Profile with Significant Scale and Operational
Capabilities in Key Growth Regions Proximity to customers enhances our service capabilities and improves overall speed and customer experience Strategically located manufacturing facilities is a critical cost and logistics differentiator
Manufacturing presence efficiently serves large East Coast market and Corporate Headquarters faster growing Sunbelt and Southwest 19 Manufacturing & Distribution Facilities regions of the U.S. 8 Primary Service Centers • Dedicated to
Turnkey Builder Direct Invested presence in attractive regions of opportunity, with efficient, low-cost manufacturing across U.S. and Mexico 24
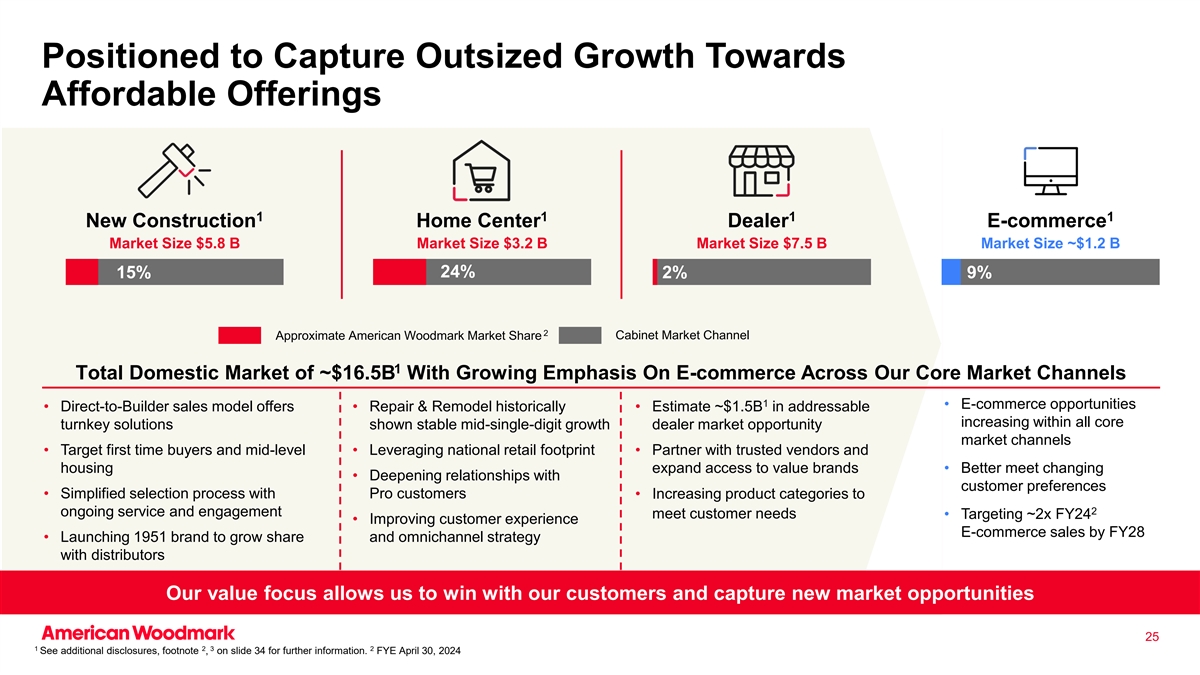
Positioned to Capture Outsized Growth Towards Affordable Offerings 1 1
1 1 New Construction Home Center Dealer E-commerce Market Size $5.8 B Market Size $3.2 B Market Size $7.5 B Market Size ~$1.2 B 24% 15% 2% 9% 2 Approximate American Woodmark Market Share Cabinet Market Channel 1 Total Domestic Market of ~$16.5B With
Growing Emphasis On E-commerce Across Our Core Market Channels 1 • E-commerce opportunities • Direct-to-Builder sales model offers • Repair & Remodel historically • Estimate ~$1.5B in addressable increasing within all
core turnkey solutions shown stable mid-single-digit growth dealer market opportunity market channels • Target first time buyers and mid-level • Leveraging national retail footprint • Partner with trusted vendors and housing expand
access to value brands • Better meet changing • Deepening relationships with customer preferences • Simplified selection process with Pro customers • Increasing product categories to 2 ongoing service and engagement meet
customer needs • Targeting ~2x FY24 • Improving customer experience E-commerce sales by FY28 • Launching 1951 brand to grow share and omnichannel strategy with distributors Our value focus allows us to win with our customers and
capture new market opportunities 25 1 2 3 2 See additional disclosures, footnote , on slide 34 for further information. FYE April 30, 2024
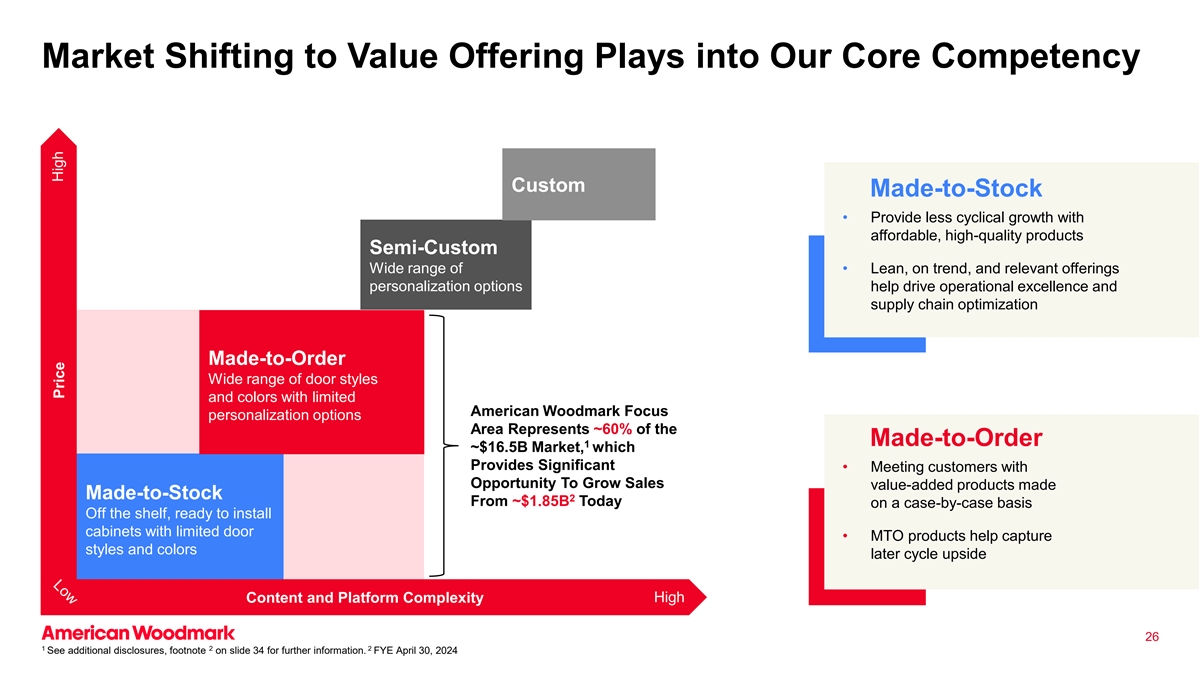
Market Shifting to Value Offering Plays into Our Core Competency Custom
Made-to-Stock • Provide less cyclical growth with affordable, high-quality products Semi-Custom Wide range of • Lean, on trend, and relevant offerings personalization options help drive operational excellence and supply chain
optimization Made-to-Order Wide range of door styles and colors with limited American Woodmark Focus personalization options Area Represents ~60% of the Made-to-Order 1 ~$16.5B Market, which Provides Significant • Meeting customers with
Opportunity To Grow Sales value-added products made Made-to-Stock 2 From ~$1.85B Today on a case-by-case basis Off the shelf, ready to install cabinets with limited door • MTO products help capture styles and colors later cycle upside Content
and Platform Complexity High 26 1 2 2 See additional disclosures, footnote on slide 34 for further information. FYE April 30, 2024 High Price
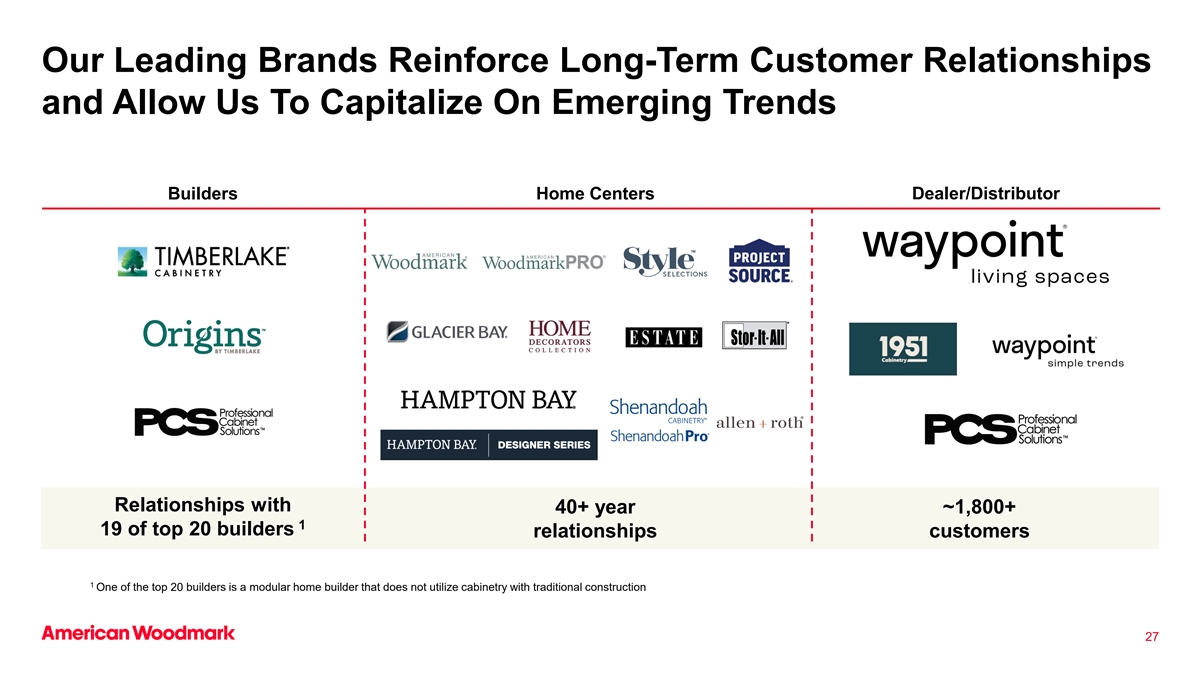
Our Leading Brands Reinforce Long-Term Customer Relationships and Allow
Us To Capitalize On Emerging Trends Builders Home Centers Dealer/Distributor Relationships with 40+ year ~1,800+ 1 19 of top 20 builders relationships customers 1 One of the top 20 builders is a modular home builder that does not utilize cabinetry
with traditional construction 27
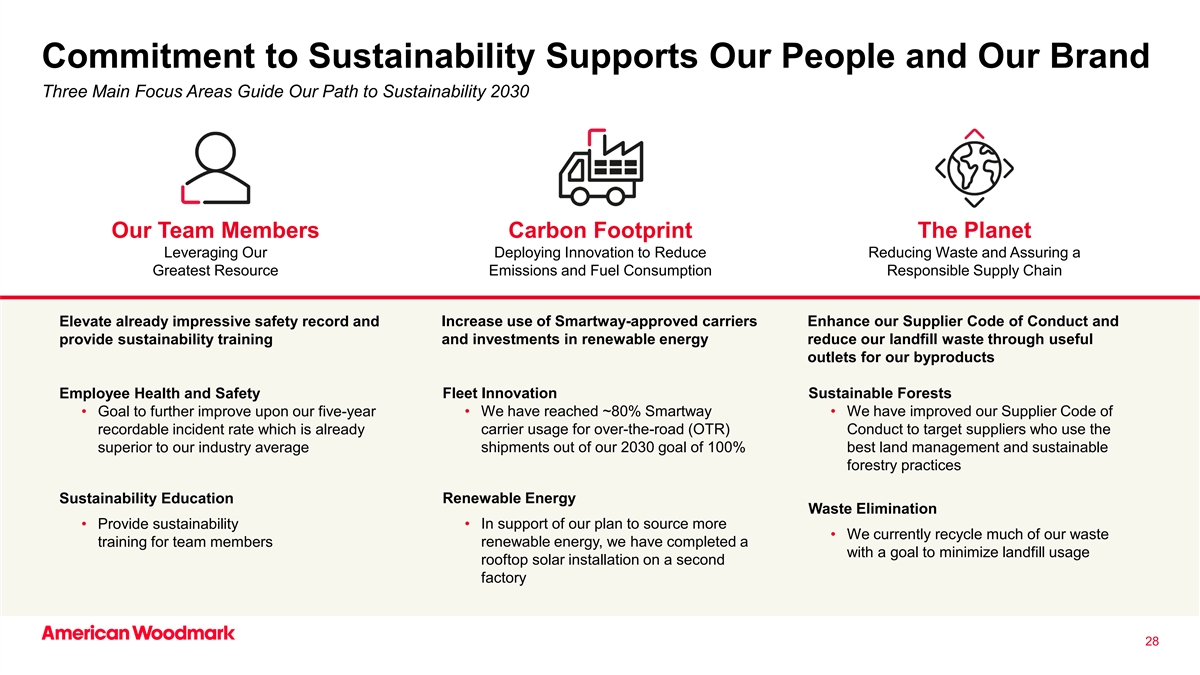
Commitment to Sustainability Supports Our People and Our Brand Three
Main Focus Areas Guide Our Path to Sustainability 2030 Our Team Members Carbon Footprint The Planet Leveraging Our Deploying Innovation to Reduce Reducing Waste and Assuring a Greatest Resource Emissions and Fuel Consumption Responsible Supply Chain
Elevate already impressive safety record and Increase use of Smartway-approved carriers Enhance our Supplier Code of Conduct and provide sustainability training and investments in renewable energy reduce our landfill waste through useful outlets for
our byproducts Employee Health and Safety Fleet Innovation Sustainable Forests • Goal to further improve upon our five-year • We have reached ~80% Smartway • We have improved our Supplier Code of recordable incident rate which is
already carrier usage for over-the-road (OTR) Conduct to target suppliers who use the superior to our industry average shipments out of our 2030 goal of 100% best land management and sustainable forestry practices Sustainability Education Renewable
Energy Waste Elimination • Provide sustainability • In support of our plan to source more • We currently recycle much of our waste training for team members renewable energy, we have completed a with a goal to minimize landfill
usage rooftop solar installation on a second factory 28

Financial Overview
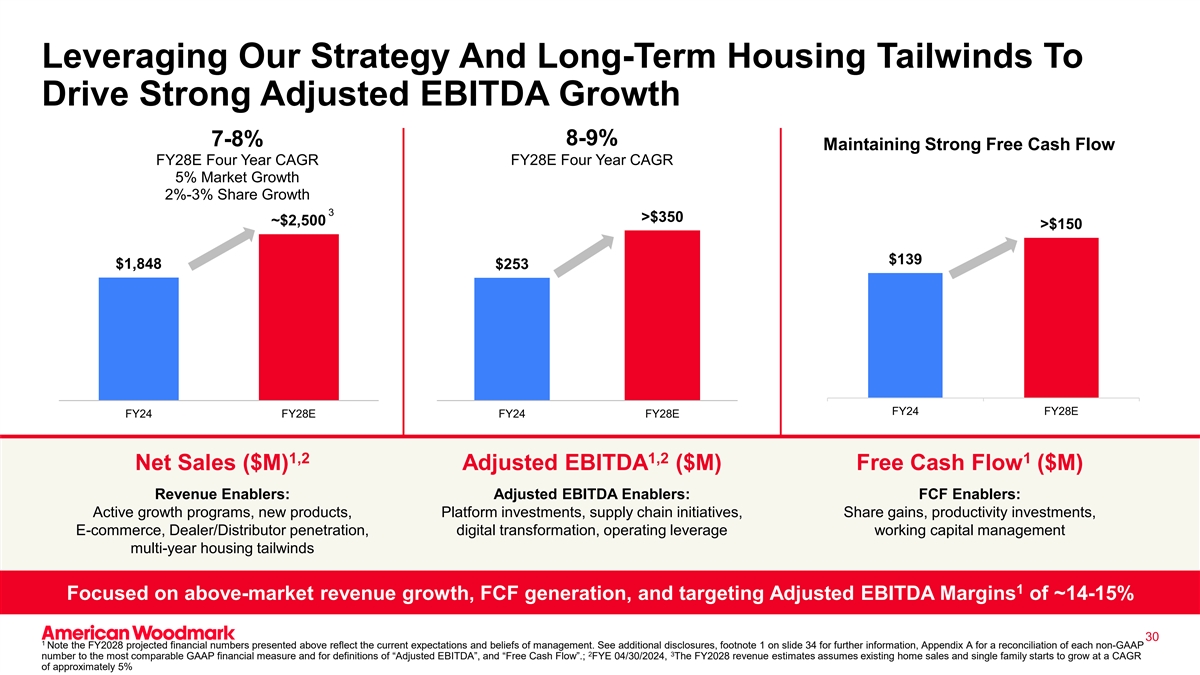
Leveraging Our Strategy And Long-Term Housing Tailwinds To Drive Strong
Adjusted EBITDA Growth 8-9% 7-8% Maintaining Strong Free Cash Flow FY28E Four Year CAGR FY28E Four Year CAGR 5% Market Growth 2%-3% Share Growth 3 >$350 ~$2,500 >$150 $139 $1,848 $253 FY24 FY28E FY24 FY28E FY24 FY28E 1,2 1,2 1 Net Sales ($M)
Adjusted EBITDA ($M) Free Cash Flow ($M) Revenue Enablers: Adjusted EBITDA Enablers: FCF Enablers: Active growth programs, new products, Platform investments, supply chain initiatives, Share gains, productivity investments, E-commerce,
Dealer/Distributor penetration, digital transformation, operating leverage working capital management multi-year housing tailwinds 1 Focused on above-market revenue growth, FCF generation, and targeting Adjusted EBITDA Margins of ~14-15% 30 1 Note
the FY2028 projected financial numbers presented above reflect the current expectations and beliefs of management. See additional disclosures, footnote 1 on slide 34 for further information, Appendix A for a reconciliation of each non-GAAP 2 3
number to the most comparable GAAP financial measure and for definitions of “Adjusted EBITDA”, and “Free Cash Flow”.; FYE 04/30/2024, The FY2028 revenue estimates assumes existing home sales and single family starts to grow
at a CAGR of approximately 5%
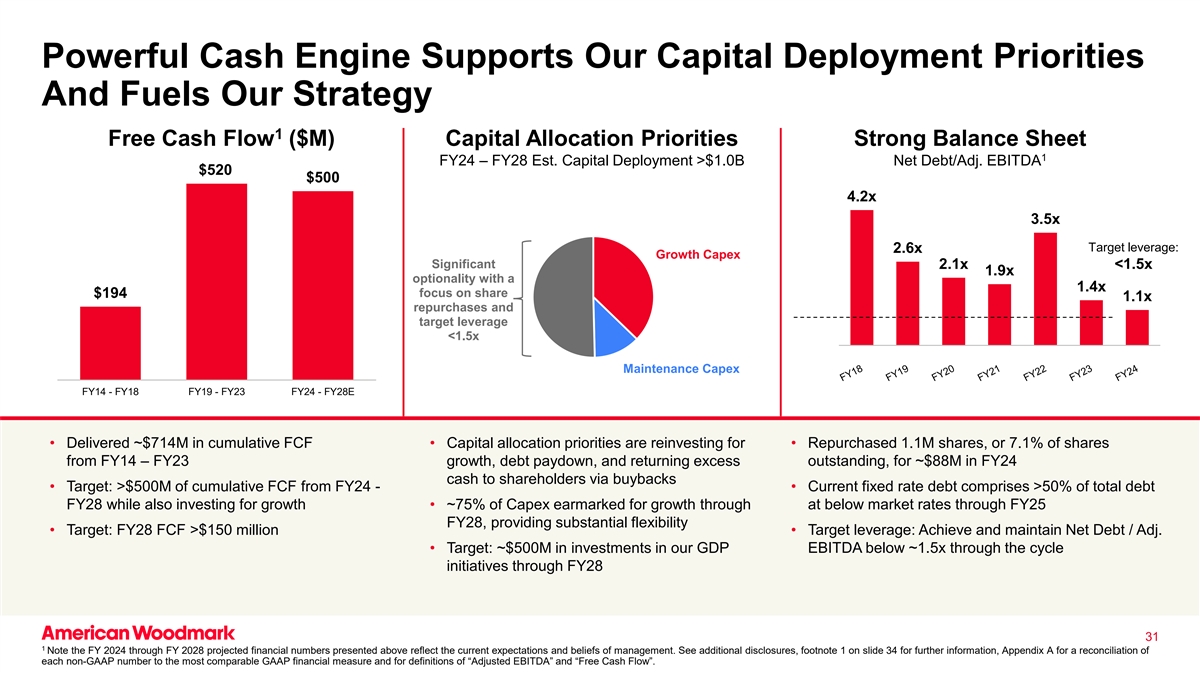
Powerful Cash Engine Supports Our Capital Deployment Priorities And
Fuels Our Strategy 1 Free Cash Flow ($M) Capital Allocation Priorities Strong Balance Sheet 1 FY24 – FY28 Est. Capital Deployment >$1.0B Net Debt/Adj. EBITDA $520 $500 4.2x 3.5x Target leverage: 2.6x Growth Capex Significant 2.1x <1.5x
1.9x optionality with a 1.4x $194 focus on share 1.1x repurchases and target leverage <1.5x Maintenance Capex FY14 - FY18 FY19 - FY23 FY24 - FY28E • Delivered ~$714M in cumulative FCF • Capital allocation priorities are reinvesting
for • Repurchased 1.1M shares, or 7.1% of shares from FY14 – FY23 growth, debt paydown, and returning excess outstanding, for ~$88M in FY24 cash to shareholders via buybacks • Target: >$500M of cumulative FCF from FY24 - •
Current fixed rate debt comprises >50% of total debt FY28 while also investing for growth • ~75% of Capex earmarked for growth through at below market rates through FY25 FY28, providing substantial flexibility • Target: FY28 FCF
>$150 million • Target leverage: Achieve and maintain Net Debt / Adj. • Target: ~$500M in investments in our GDP EBITDA below ~1.5x through the cycle initiatives through FY28 31 1 Note the FY 2024 through FY 2028 projected financial
numbers presented above reflect the current expectations and beliefs of management. See additional disclosures, footnote 1 on slide 34 for further information, Appendix A for a reconciliation of each non-GAAP number to the most comparable GAAP
financial measure and for definitions of “Adjusted EBITDA” and “Free Cash Flow”.
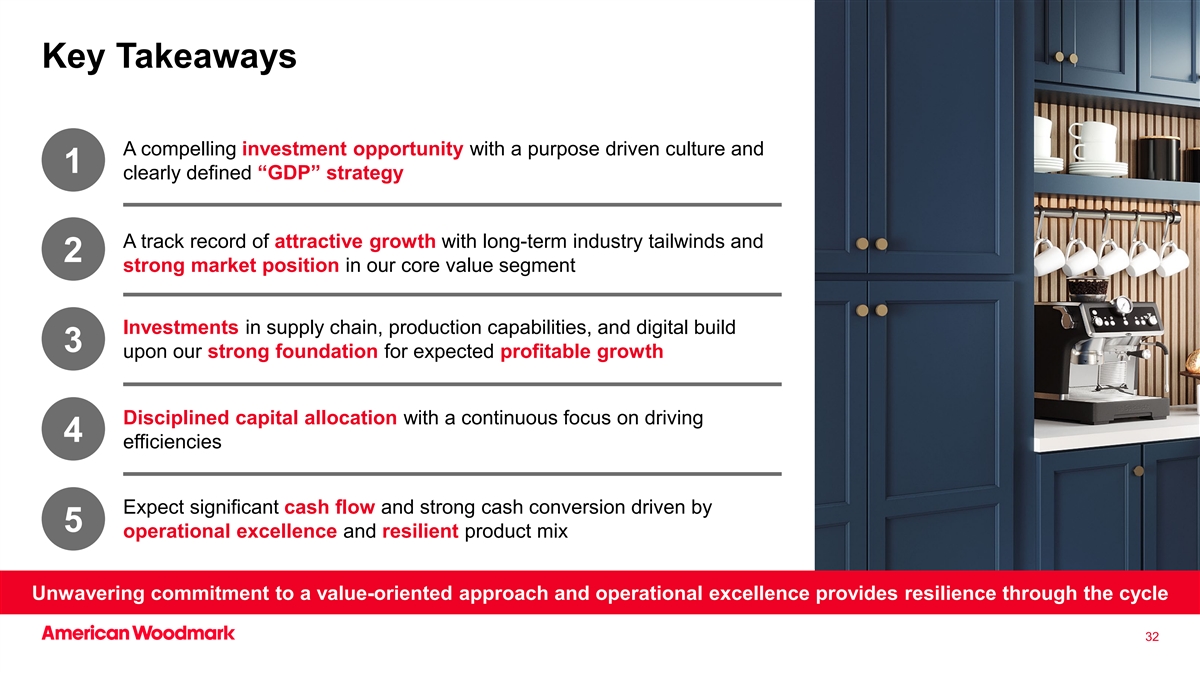
Key Takeaways A compelling investment opportunity with a purpose driven
culture and 1 clearly defined “GDP” strategy A track record of attractive growth with long-term industry tailwinds and 2 strong market position in our core value segment Investments in supply chain, production capabilities, and digital
build 3 upon our strong foundation for expected profitable growth Disciplined capital allocation with a continuous focus on driving 4 efficiencies Expect significant cash flow and strong cash conversion driven by 5 operational excellence and
resilient product mix Unwavering commitment to a value-oriented approach and operational excellence provides resilience through the cycle 32

Appendix
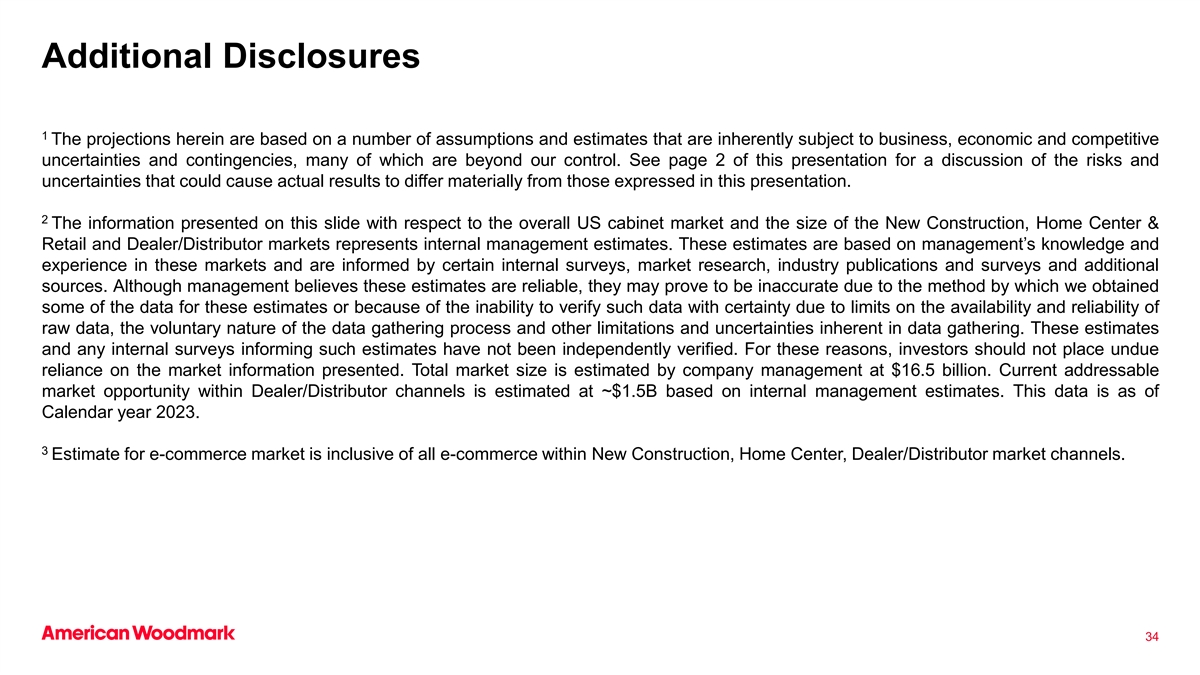
Additional Disclosures 1 The projections herein are based on a number
of assumptions and estimates that are inherently subject to business, economic and competitive uncertainties and contingencies, many of which are beyond our control. See page 2 of this presentation for a discussion of the risks and uncertainties
that could cause actual results to differ materially from those expressed in this presentation. 2 The information presented on this slide with respect to the overall US cabinet market and the size of the New Construction, Home Center & Retail
and Dealer/Distributor markets represents internal management estimates. These estimates are based on management’s knowledge and experience in these markets and are informed by certain internal surveys, market research, industry publications
and surveys and additional sources. Although management believes these estimates are reliable, they may prove to be inaccurate due to the method by which we obtained some of the data for these estimates or because of the inability to verify such
data with certainty due to limits on the availability and reliability of raw data, the voluntary nature of the data gathering process and other limitations and uncertainties inherent in data gathering. These estimates and any internal surveys
informing such estimates have not been independently verified. For these reasons, investors should not place undue reliance on the market information presented. Total market size is estimated by company management at $16.5 billion. Current
addressable market opportunity within Dealer/Distributor channels is estimated at ~$1.5B based on internal management estimates. This data is as of Calendar year 2023. 3 Estimate for e-commerce market is inclusive of all e-commerce within New
Construction, Home Center, Dealer/Distributor market channels. 34
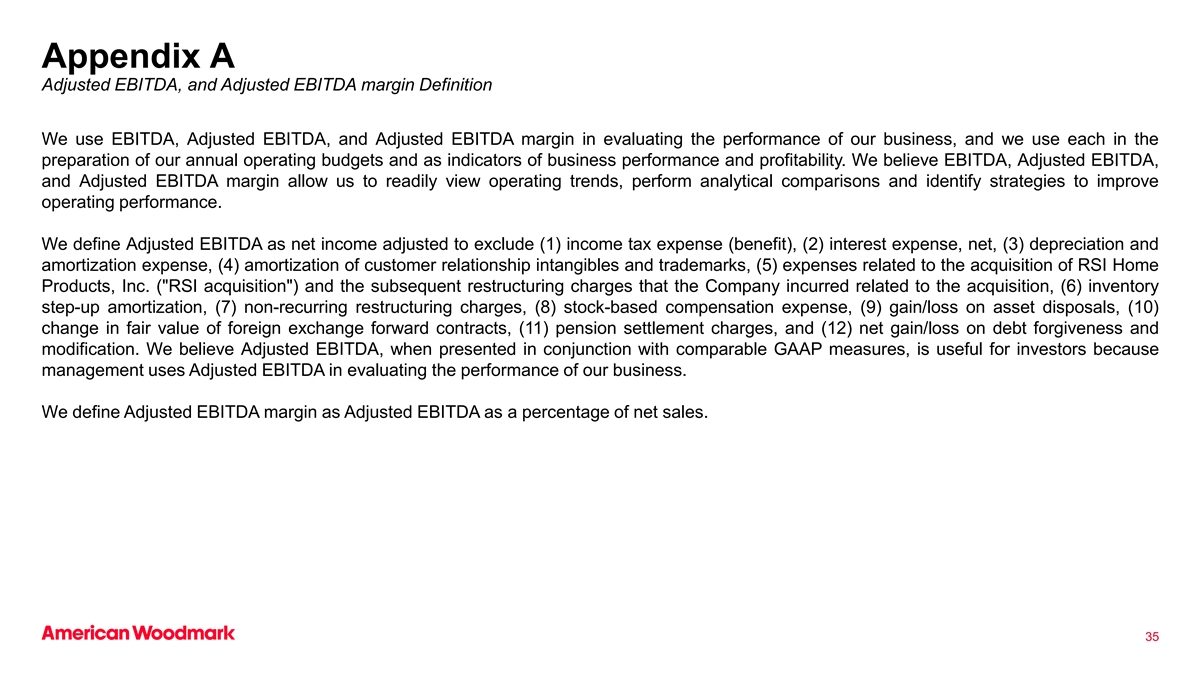
Appendix A Adjusted EBITDA, and Adjusted EBITDA margin Definition We
use EBITDA, Adjusted EBITDA, and Adjusted EBITDA margin in evaluating the performance of our business, and we use each in the preparation of our annual operating budgets and as indicators of business performance and profitability. We believe EBITDA,
Adjusted EBITDA, and Adjusted EBITDA margin allow us to readily view operating trends, perform analytical comparisons and identify strategies to improve operating performance. We define Adjusted EBITDA as net income adjusted to exclude (1) income
tax expense (benefit), (2) interest expense, net, (3) depreciation and amortization expense, (4) amortization of customer relationship intangibles and trademarks, (5) expenses related to the acquisition of RSI Home Products, Inc. ( RSI acquisition )
and the subsequent restructuring charges that the Company incurred related to the acquisition, (6) inventory step-up amortization, (7) non-recurring restructuring charges, (8) stock-based compensation expense, (9) gain/loss on asset disposals, (10)
change in fair value of foreign exchange forward contracts, (11) pension settlement charges, and (12) net gain/loss on debt forgiveness and modification. We believe Adjusted EBITDA, when presented in conjunction with comparable GAAP measures, is
useful for investors because management uses Adjusted EBITDA in evaluating the performance of our business. We define Adjusted EBITDA margin as Adjusted EBITDA as a percentage of net sales. 35
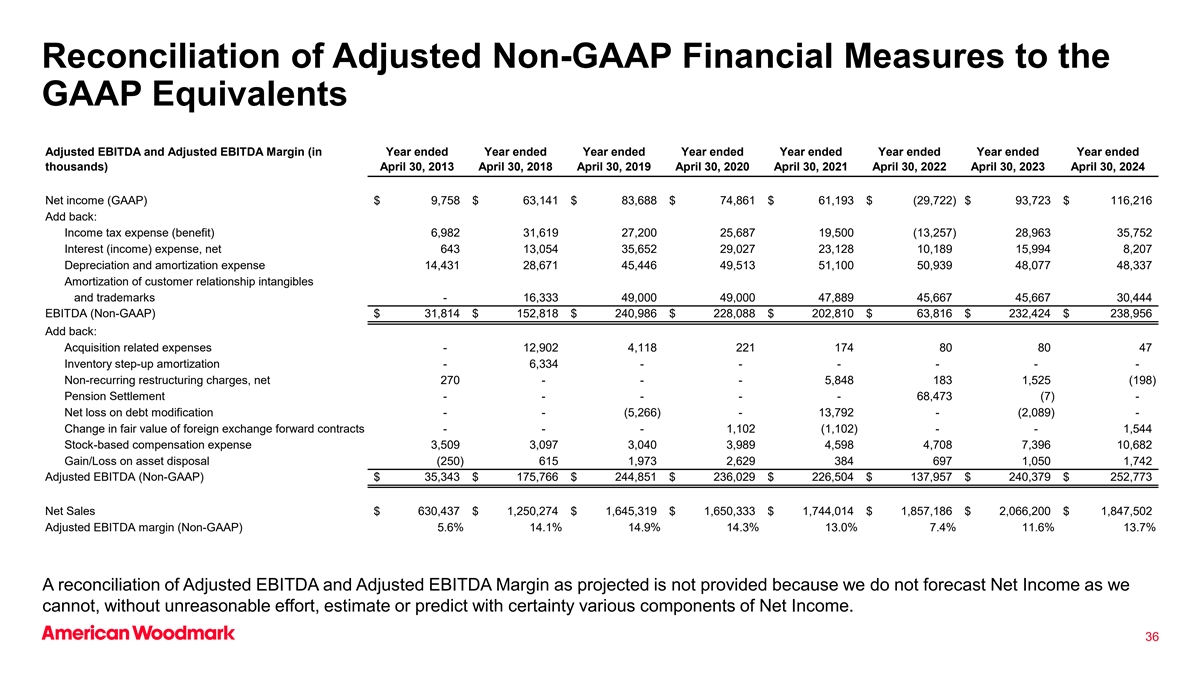
Reconciliation of Adjusted Non-GAAP Financial Measures to the GAAP
Equivalents Adjusted EBITDA and Adjusted EBITDA Margin (in Year ended Year ended Year ended Year ended Year ended Year ended Year ended Year ended thousands) April 30, 2013 April 30, 2018 April 30, 2019 April 30, 2020 April 30, 2021 April 30, 2022
April 30, 2023 April 30, 2024 Net income (GAAP) $ 9,758 $ 63,141 $ 83,688 $ 74,861 $ 61,193 $ (29,722) $ 93,723 $ 116,216 Add back: Income tax expense (benefit) 6,982 31,619 27,200 25,687 19,500 (13,257) 28,963 35,752 Interest (income) expense, net
643 13,054 35,652 29,027 23,128 10,189 15,994 8,207 Depreciation and amortization expense 14,431 28,671 45,446 49,513 51,100 50,939 48,077 48,337 Amortization of customer relationship intangibles and trademarks - 16,333 49,000 49,000 47,889 45,667
45,667 30,444 EBITDA (Non-GAAP) $ 31,814 $ 152,818 $ 240,986 $ 228,088 $ 202,810 $ 63,816 $ 232,424 $ 238,956 Add back: Acquisition related expenses - 12,902 4,118 221 174 80 80 47 Inventory step-up amortization - 6,334 - - - - - - Non-recurring
restructuring charges, net 270 - - - 5,848 183 1,525 (198) Pension Settlement - - - - - 68,473 (7) - Net loss on debt modification - - (5,266) - 13,792 - (2,089) - Change in fair value of foreign exchange forward contracts - - - 1,102 (1,102) - -
1,544 Stock-based compensation expense 3,509 3,097 3,040 3,989 4,598 4,708 7,396 10,682 Gain/Loss on asset disposal (250) 615 1,973 2,629 384 697 1,050 1,742 Adjusted EBITDA (Non-GAAP) $ 35,343 $ 175,766 $ 244,851 $ 236,029 $ 226,504 $ 137,957 $
240,379 $ 252,773 Net Sales $ 630,437 $ 1,250,274 $ 1,645,319 $ 1,650,333 $ 1,744,014 $ 1,857,186 $ 2,066,200 $ 1,847,502 Adjusted EBITDA margin (Non-GAAP) 5.6% 14.1% 14.9% 14.3% 13.0% 7.4% 11.6% 13.7% A reconciliation of Adjusted EBITDA and
Adjusted EBITDA Margin as projected is not provided because we do not forecast Net Income as we cannot, without unreasonable effort, estimate or predict with certainty various components of Net Income. 36
Additional Definitions Free cash flow To better understand trends in
our business, we believe that it is helpful to subtract amounts for capital expenditures consisting of cash payments for property, plant and equipment and cash payments for investments in displays from cash flows from continuing operations which is
how we define free cash flow. Management believes this measure gives investors an additional perspective on cash flow from operating activities in excess of amounts required for reinvestment. It also provides a measure of our ability to repay our
debt obligations. Net leverage Net leverage is a performance measure that we believe provides investors with a more complete understanding of our leverage position and borrowing capacity after factoring in cash and cash equivalents that eventually
could be used to repay outstanding debt. We define net leverage as net debt (total debt less cash and cash equivalents) divided by the trailing 12 months Adjusted EBITDA. A reconciliation of these non-GAAP financial measures and the most directly
comparable measures calculated and presented in accordance with GAAP are set forth on the following tables. 37
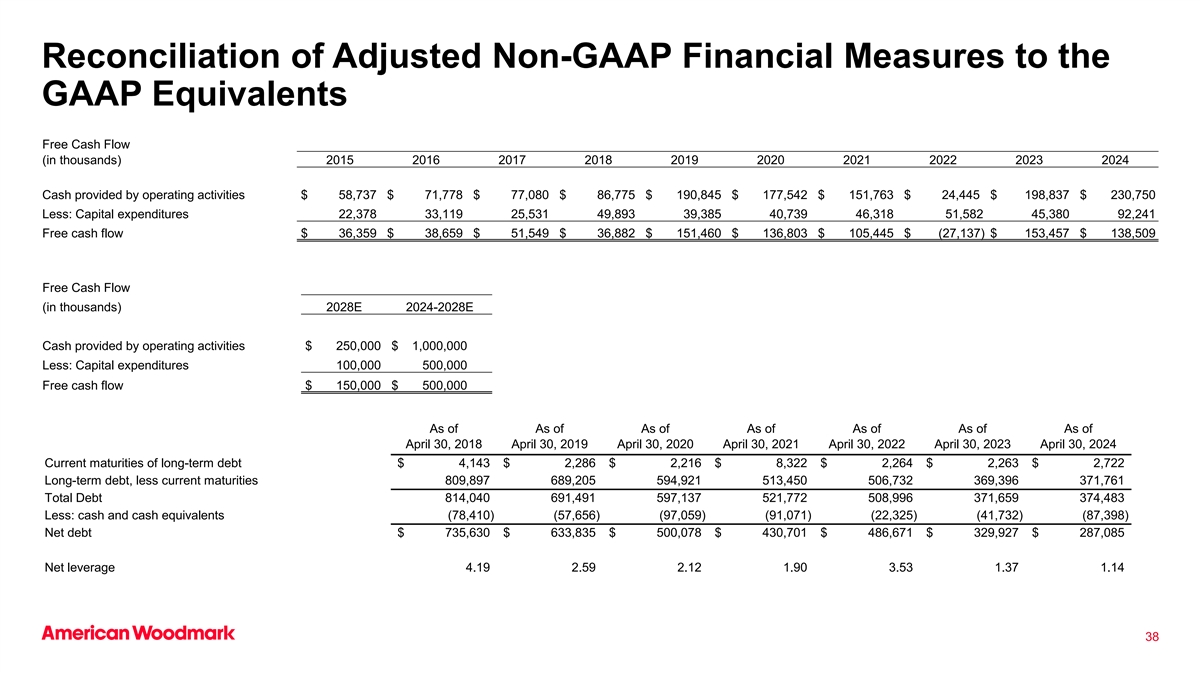
Reconciliation of Adjusted Non-GAAP Financial Measures to the GAAP
Equivalents Free Cash Flow (in thousands) 2015 2016 2017 2018 2019 2020 2021 2022 2023 2024 Cash provided by operating activities $ 58,737 $ 71,778 $ 77,080 $ 86,775 $ 190,845 $ 177,542 $ 151,763 $ 24,445 $ 198,837 $ 230,750 Less: Capital
expenditures 22,378 33,119 25,531 49,893 39,385 40,739 46,318 51,582 45,380 92,241 Free cash flow $ 36,359 $ 38,659 $ 51,549 $ 36,882 $ 151,460 $ 136,803 $ 105,445 $ (27,137) $ 153,457 $ 138,509 Free Cash Flow (in thousands) 2028E 2024-2028E Cash
provided by operating activities $ 250,000 $ 1,000,000 Less: Capital expenditures 100,000 500,000 Free cash flow $ 150,000 $ 500,000 As of As of As of As of As of As of As of April 30, 2018 April 30, 2019 April 30, 2020 April 30, 2021 April 30, 2022
April 30, 2023 April 30, 2024 Current maturities of long-term debt $ 4,143 $ 2,286 $ 2,216 $ 8,322 $ 2,264 $ 2,263 $ 2,722 Long-term debt, less current maturities 809,897 689,205 594,921 513,450 506,732 369,396 371,761 Total Debt 814,040 691,491
597,137 521,772 508,996 371,659 374,483 Less: cash and cash equivalents (78,410) (57,656) (97,059) (91,071) (22,325) (41,732) (87,398) Net debt $ 735,630 $ 633,835 $ 500,078 $ 430,701 $ 486,671 $ 329,927 $ 287,085 Net leverage 4.19 2.59 2.12 1.90
3.53 1.37 1.14 38
v3.24.2.u1
| X |
- DefinitionBoolean flag that is true when the XBRL content amends previously-filed or accepted submission.
| Name: |
dei_AmendmentFlag |
| Namespace Prefix: |
dei_ |
| Data Type: |
xbrli:booleanItemType |
| Balance Type: |
na |
| Period Type: |
duration |
|
| X |
- DefinitionFor the EDGAR submission types of Form 8-K: the date of the report, the date of the earliest event reported; for the EDGAR submission types of Form N-1A: the filing date; for all other submission types: the end of the reporting or transition period. The format of the date is YYYY-MM-DD.
| Name: |
dei_DocumentPeriodEndDate |
| Namespace Prefix: |
dei_ |
| Data Type: |
xbrli:dateItemType |
| Balance Type: |
na |
| Period Type: |
duration |
|
| X |
- DefinitionThe type of document being provided (such as 10-K, 10-Q, 485BPOS, etc). The document type is limited to the same value as the supporting SEC submission type, or the word 'Other'.
| Name: |
dei_DocumentType |
| Namespace Prefix: |
dei_ |
| Data Type: |
dei:submissionTypeItemType |
| Balance Type: |
na |
| Period Type: |
duration |
|
| X |
- DefinitionAddress Line 1 such as Attn, Building Name, Street Name
| Name: |
dei_EntityAddressAddressLine1 |
| Namespace Prefix: |
dei_ |
| Data Type: |
xbrli:normalizedStringItemType |
| Balance Type: |
na |
| Period Type: |
duration |
|
| X |
- Definition
+ References
+ Details
| Name: |
dei_EntityAddressCityOrTown |
| Namespace Prefix: |
dei_ |
| Data Type: |
xbrli:normalizedStringItemType |
| Balance Type: |
na |
| Period Type: |
duration |
|
| X |
- DefinitionCode for the postal or zip code
| Name: |
dei_EntityAddressPostalZipCode |
| Namespace Prefix: |
dei_ |
| Data Type: |
xbrli:normalizedStringItemType |
| Balance Type: |
na |
| Period Type: |
duration |
|
| X |
- DefinitionName of the state or province.
| Name: |
dei_EntityAddressStateOrProvince |
| Namespace Prefix: |
dei_ |
| Data Type: |
dei:stateOrProvinceItemType |
| Balance Type: |
na |
| Period Type: |
duration |
|
| X |
- DefinitionA unique 10-digit SEC-issued value to identify entities that have filed disclosures with the SEC. It is commonly abbreviated as CIK. Reference 1: http://www.xbrl.org/2003/role/presentationRef
-Publisher SEC
-Name Exchange Act
-Number 240
-Section 12
-Subsection b-2
| Name: |
dei_EntityCentralIndexKey |
| Namespace Prefix: |
dei_ |
| Data Type: |
dei:centralIndexKeyItemType |
| Balance Type: |
na |
| Period Type: |
duration |
|
| X |
- DefinitionIndicate if registrant meets the emerging growth company criteria. Reference 1: http://www.xbrl.org/2003/role/presentationRef
-Publisher SEC
-Name Exchange Act
-Number 240
-Section 12
-Subsection b-2
| Name: |
dei_EntityEmergingGrowthCompany |
| Namespace Prefix: |
dei_ |
| Data Type: |
xbrli:booleanItemType |
| Balance Type: |
na |
| Period Type: |
duration |
|
| X |
- DefinitionCommission file number. The field allows up to 17 characters. The prefix may contain 1-3 digits, the sequence number may contain 1-8 digits, the optional suffix may contain 1-4 characters, and the fields are separated with a hyphen.
| Name: |
dei_EntityFileNumber |
| Namespace Prefix: |
dei_ |
| Data Type: |
dei:fileNumberItemType |
| Balance Type: |
na |
| Period Type: |
duration |
|
| X |
- DefinitionTwo-character EDGAR code representing the state or country of incorporation.
| Name: |
dei_EntityIncorporationStateCountryCode |
| Namespace Prefix: |
dei_ |
| Data Type: |
dei:edgarStateCountryItemType |
| Balance Type: |
na |
| Period Type: |
duration |
|
| X |
- DefinitionThe exact name of the entity filing the report as specified in its charter, which is required by forms filed with the SEC. Reference 1: http://www.xbrl.org/2003/role/presentationRef
-Publisher SEC
-Name Exchange Act
-Number 240
-Section 12
-Subsection b-2
| Name: |
dei_EntityRegistrantName |
| Namespace Prefix: |
dei_ |
| Data Type: |
xbrli:normalizedStringItemType |
| Balance Type: |
na |
| Period Type: |
duration |
|
| X |
- DefinitionThe Tax Identification Number (TIN), also known as an Employer Identification Number (EIN), is a unique 9-digit value assigned by the IRS. Reference 1: http://www.xbrl.org/2003/role/presentationRef
-Publisher SEC
-Name Exchange Act
-Number 240
-Section 12
-Subsection b-2
| Name: |
dei_EntityTaxIdentificationNumber |
| Namespace Prefix: |
dei_ |
| Data Type: |
dei:employerIdItemType |
| Balance Type: |
na |
| Period Type: |
duration |
|
| X |
- DefinitionLocal phone number for entity.
| Name: |
dei_LocalPhoneNumber |
| Namespace Prefix: |
dei_ |
| Data Type: |
xbrli:normalizedStringItemType |
| Balance Type: |
na |
| Period Type: |
duration |
|
| X |
- DefinitionBoolean flag that is true when the Form 8-K filing is intended to satisfy the filing obligation of the registrant as pre-commencement communications pursuant to Rule 13e-4(c) under the Exchange Act. Reference 1: http://www.xbrl.org/2003/role/presentationRef
-Publisher SEC
-Name Exchange Act
-Number 240
-Section 13e
-Subsection 4c
| Name: |
dei_PreCommencementIssuerTenderOffer |
| Namespace Prefix: |
dei_ |
| Data Type: |
xbrli:booleanItemType |
| Balance Type: |
na |
| Period Type: |
duration |
|
| X |
- DefinitionBoolean flag that is true when the Form 8-K filing is intended to satisfy the filing obligation of the registrant as pre-commencement communications pursuant to Rule 14d-2(b) under the Exchange Act. Reference 1: http://www.xbrl.org/2003/role/presentationRef
-Publisher SEC
-Name Exchange Act
-Number 240
-Section 14d
-Subsection 2b
| Name: |
dei_PreCommencementTenderOffer |
| Namespace Prefix: |
dei_ |
| Data Type: |
xbrli:booleanItemType |
| Balance Type: |
na |
| Period Type: |
duration |
|
| X |
- DefinitionTitle of a 12(b) registered security. Reference 1: http://www.xbrl.org/2003/role/presentationRef
-Publisher SEC
-Name Exchange Act
-Number 240
-Section 12
-Subsection b
| Name: |
dei_Security12bTitle |
| Namespace Prefix: |
dei_ |
| Data Type: |
dei:securityTitleItemType |
| Balance Type: |
na |
| Period Type: |
duration |
|
| X |
- DefinitionName of the Exchange on which a security is registered. Reference 1: http://www.xbrl.org/2003/role/presentationRef
-Publisher SEC
-Name Exchange Act
-Number 240
-Section 12
-Subsection d1-1
| Name: |
dei_SecurityExchangeName |
| Namespace Prefix: |
dei_ |
| Data Type: |
dei:edgarExchangeCodeItemType |
| Balance Type: |
na |
| Period Type: |
duration |
|
| X |
- DefinitionBoolean flag that is true when the Form 8-K filing is intended to satisfy the filing obligation of the registrant as soliciting material pursuant to Rule 14a-12 under the Exchange Act. Reference 1: http://www.xbrl.org/2003/role/presentationRef
-Publisher SEC
-Name Exchange Act
-Section 14a
-Number 240
-Subsection 12
| Name: |
dei_SolicitingMaterial |
| Namespace Prefix: |
dei_ |
| Data Type: |
xbrli:booleanItemType |
| Balance Type: |
na |
| Period Type: |
duration |
|
| X |
- DefinitionTrading symbol of an instrument as listed on an exchange.
| Name: |
dei_TradingSymbol |
| Namespace Prefix: |
dei_ |
| Data Type: |
dei:tradingSymbolItemType |
| Balance Type: |
na |
| Period Type: |
duration |
|
| X |
- DefinitionBoolean flag that is true when the Form 8-K filing is intended to satisfy the filing obligation of the registrant as written communications pursuant to Rule 425 under the Securities Act. Reference 1: http://www.xbrl.org/2003/role/presentationRef
-Publisher SEC
-Name Securities Act
-Number 230
-Section 425
| Name: |
dei_WrittenCommunications |
| Namespace Prefix: |
dei_ |
| Data Type: |
xbrli:booleanItemType |
| Balance Type: |
na |
| Period Type: |
duration |
|
American Woodmark (NASDAQ:AMWD)
Historical Stock Chart
From Jul 2024 to Aug 2024

American Woodmark (NASDAQ:AMWD)
Historical Stock Chart
From Aug 2023 to Aug 2024
