XRP Faces Extended Bearish Pressure At $0.4937 Amid Market Weakness
June 21 2024 - 7:00AM
NEWSBTC
XRP, one of the leading cryptocurrencies, is currently grappling
with extended bearish pressure amid prevailing market weakness. The
digital asset has been facing significant downward momentum,
influenced by a confluence of factors including macroeconomic
uncertainties, regulatory challenges, and broader market
sentiment. Thus far, XRP’s price has struggled to maintain
key support levels, exacerbating concerns among traders and
investors about its near-term performance. As bearish momentum
continues to dominate, this analysis delves into evaluating XRP’s
current market position with the help of key technical indicators
focusing on the 4-hour and the 1-day chart. The price of XRP has
increased by 0.63%, trading at about $0.4920 in the last 24 hours,
with a market capitalization of more than $27 billion and a trading
volume of more than $1 billion as of the time of writing. There has
been a 1.06% decrease in market capitalization in the last day
despite the trading volume being up by 5.89%. XRP Current Market
Performance And Trend Currently, the price of XRP is actively
bearish trading below the 100-day Simple Moving Average (SMA) in
the 4-hour timeframe, and the price here is beginning to decline
after a failed upward attempt. With the current price formation, it
can be suggested that XRP’s bearish trend may likely extend. Also,
the Composite Trend Oscillator confirms that XRP’s decline may be
extended as both the signal line and the SMA of the indicator are
descending from the overbought section toward the zero line. In the
1-day chart, XRP is trading below the 100-day SMA attempting to
move upward. It should be noted that this is just a short-term move
as the crypto asset’s price at some point will begin to drop again
thereby extending the bearish trend. Additionally, the formation of
the 1-day Composite Trend Oscillator indicates that XRP’s bearish
trend may likely extend as both the signal line and the SMA of the
indicator are trending below the zero line closed to the oversold
zone. Navigating The Bearish Market For The Token With XRP
currently facing significant bearish pressure, It should be noted
that if the crypto asset continues bearish as predicted, it will
begin to move towards the $0.4663 support level. If it breaks below
this level, it will decline further to test the $0.4088 support
level and may move to test the $0.3483 support level if it breaches
the $0.4088 level. However, if XRP fails to decline further
and decides to move upward, it will begin to move toward the
$0.5725 resistance level. Once this level is breached, XRP’s price
will continue upward to challenge the $0.6697 resistance level and
may move on to test other resistance levels above. Featured image
from Adobe Stock, chart from Tradingview.com
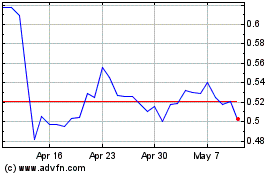
Ripple (COIN:XRPUSD)
Historical Stock Chart
From May 2024 to Jun 2024

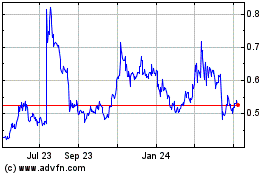
Ripple (COIN:XRPUSD)
Historical Stock Chart
From Jun 2023 to Jun 2024
