PG&E Down 29%, On Pace for Record Low After Bankruptcy News -- Data Talk
January 15 2019 - 11:23AM
Dow Jones News
PG&E Corporation (PCG) is currently at $5.95, down $2.43, or
29%
-- Would be new all-time low (Based on available data back to
Jan. 21, 1972)
-- Currently down six of the past seven days
-- On Monday, PG&E said it intends to file for Chapter 11
around Jan. 29 as it faces more than $30 billion in potential
liability costs related to its role in sparking deadly California
wildfires
-- Earlier Tuesday, Morgan Stanley cut its price target on
PG&E to $13.00/share from $31.00/share, Benzinga reported.
Macquarie and Argus cut their ratings on PG&E, Benzinga
said
-- Currently down four consecutive days; down 66.63% over this
period
-- Longest losing streak since Nov. 15, 2018 when it fell for
six straight trading days
-- Worst four-day stretch on record (Based on available data
back to Jan. 21, 1972)
-- Down 74.95% month-to-date
-- Down 91.69% from its all-time closing high of $71.56 on Sept.
11, 2017
-- Down 86.48% from 52 weeks ago (Jan. 16, 2018), when it closed
at $44.02
-- Down 39.5% at today's intraday low
-- Worst performer in the S&P 500 today
-- Most active stock in the S&P 500 today
All data as of 10:38:20 AM
Source: Dow Jones Market Data, FactSet
(END) Dow Jones Newswires
January 15, 2019 11:08 ET (16:08 GMT)
Copyright (c) 2019 Dow Jones & Company, Inc.
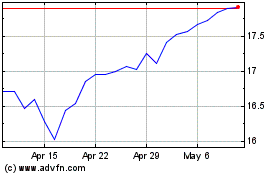
PG&E (NYSE:PCG)
Historical Stock Chart
From Mar 2024 to Apr 2024

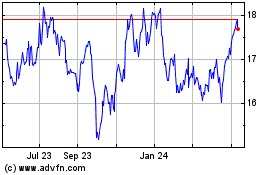
PG&E (NYSE:PCG)
Historical Stock Chart
From Apr 2023 to Apr 2024
