Franklin Street Properties Corp. (the “Company”, “FSP”, “our”
or “we”) (NYSE MKT: FSP), a real estate investment trust
(REIT), announced that it is reaffirming its FFO (Funds from
Operations) guidance for full year 2016 at approximately $1.03 per
diluted share. We are also updating our FFO guidance for the fourth
quarter of 2016 to be in the range of approximately $0.24 to $0.25
per diluted share. In addition, our initial full year FFO guidance
for 2017 is estimated to be in the range of approximately $1.04 to
$1.09 per diluted share. This guidance (a) excludes the impact of
future acquisitions, developments, dispositions, debt financings or
repayments or other capital market transactions; (b) reflects
estimates from our ongoing portfolio of properties, other real
estate investments and general and administrative expenses; and (c)
reflects our current expectations of economic conditions. We will
update guidance quarterly in our earnings releases. There can be no
assurance that the Company’s actual results will not differ
materially from the estimates set forth above.
George J. Carter, Chairman and Chief Executive Officer,
commented as follows:
“As we near completion of the fourth quarter, we continue to
believe that full year 2016 will mark the bottom of the reductive
effects that our ongoing property portfolio transition is having on
FFO. Our forecast is for resumed FFO growth in 2017. We look
forward with anticipation to the balance of 2016 and beyond.”
Funds From Operations (FFO)
The Company evaluates performance based on Funds From
Operations, which we refer to as FFO, as management believes that
FFO represents the most accurate measure of activity and is the
basis for distributions paid to equity holders. The Company defines
FFO as net income (computed in accordance with GAAP), excluding
gains (or losses) from sales of property, hedge ineffectiveness and
acquisition costs of newly acquired properties that are not
capitalized, plus depreciation and amortization, including
amortization of acquired above and below market lease intangibles
and impairment charges on properties or investments in
non-consolidated REITs, and after adjustments to exclude equity in
income or losses from, and, to include the proportionate share of
FFO from, non-consolidated REITs.
FFO should not be considered as an alternative to net income
(determined in accordance with GAAP), nor as an indicator of the
Company’s financial performance, nor as an alternative to cash
flows from operating activities (determined in accordance with
GAAP), nor as a measure of the Company’s liquidity, nor is it
necessarily indicative of sufficient cash flow to fund all of the
Company’s needs.
Other real estate companies and the National Association of Real
Estate Investment Trusts (NAREIT), may define this term in a
different manner. We have included FFO as defined by NAREIT as of
May 17, 2016 in the table below and note that other REITs may not
define FFO in accordance with the current NAREIT definition or may
interpret the current NAREIT definition differently than we do.
We believe that in order to facilitate a clear understanding of
the results of the Company, FFO should be examined in connection
with net income and cash flows from operating, investing and
financing activities in the consolidated financial statements.
Note Regarding FFO Definition
During the three months ended June 30, 2016, we changed the
definition of FFO to exclude hedge ineffectiveness, which does not
affect any prior period. Our interest rate swaps effectively fix
interest rates on our term loans; however, there is no floor on the
variable interest rate of the swaps whereas the current term loans
are subject to a zero percent floor. As a result, there is a
mismatch and the ineffective portion of the derivatives’ changes in
fair value are recognized directly into earnings each quarter as
hedge ineffectiveness. We believe that FFO excluding hedge
ineffectiveness is a useful supplemental measure regarding our
operating performance as it provides a more meaningful and
consistent comparison of our operating performance and allows
investors to more easily compare our operating results.
Reconciliation of Net Income to FFO
A reconciliation of Net Income to FFO for each of the three and
nine month periods ended September 30, 2015 and 2016 is shown
below. Management believes FFO is used broadly throughout the real
estate investment trust (REIT) industry as measurements of
performance. The Company has included FFO as defined by NAREIT as
of May 17, 2016 in the table below and notes that other REITs may
not define FFO in accordance with the current NAREIT definition or
may interpret the current NAREIT definition differently. The
Company’s computation of FFO may not be comparable to FFO reported
by other REITs or real estate companies that define FFO
differently.
Reconciliation of Net Income to FFO: Three
Months Ended Nine Months Ended September 30, September 30, (In
thousands, except per share amounts) 2016 2015 2016 2015 Net
income $ 2,458 $ 3,166 $ 6,649 $ 19,602 Gain (loss) on sale of
properties and property held for sale, less applicable income tax
523 (1) 1,166 (11,411) GAAP loss from non-consolidated REITs 196
284 568 644 FFO from non-consolidated REITs 787 645 2,327 2,131
Depreciation & amortization 23,112 22,848
67,991 68,694 NAREIT FFO 27,076 26,942 78,701 79,660 Hedge
ineffectiveness (621) — 388 — Acquisition costs of new properties
215 12 349 154 Funds From Operations
(FFO) $ 26,670 $ 26,954 $ 79,438 $ 79,814 Per Share Data EPS
$ 0.02 $ 0.03 $ 0.07 $ 0.20 FFO $ 0.26 $ 0.27 $ 0.78 $ 0.80
Weighted average shares (basic and diluted) 103,709 100,187 101,370
100,187
This press release, along with other news about FSP, is
available on the Internet at www.fspreit.com. We routinely post
information that may be important to investors in the Investor
Relations section of our website. We encourage investors to consult
that section of our website regularly for important information
about us and, if they are interested in automatically receiving
news and information as soon as it is posted, to sign up for E-mail
Alerts.
About Franklin Street Properties Corp.
Franklin Street Properties Corp., based in Wakefield,
Massachusetts, is focused on investing in institutional-quality
office properties in the U.S. FSP’s strategy is to invest in select
urban infill and central business district (CBD) properties, with
primary emphasis on our top five markets of Atlanta, Dallas,
Denver, Houston, and Minneapolis. FSP seeks value-oriented
investments with an eye towards long-term growth and appreciation,
as well as current income. FSP is a Maryland corporation that
operates in a manner intended to qualify as a real estate
investment trust (REIT) for federal income tax purposes. To learn
more about FSP please visit our website at www.fspreit.com.
Forward-Looking Statements
Statements made in this press release that state FSP’s or
management’s intentions, beliefs, expectations, or predictions for
the future may be forward-looking statements within the meaning of
the Private Securities Litigation Reform Act of 1995. This press
release may also contain forward-looking statements based on
current judgments and current knowledge of management, including
our estimates of Funds From Operations for future periods, which
are subject to certain risks, trends and uncertainties that could
cause actual results to differ materially from those indicated in
such forward-looking statements. Accordingly, readers are cautioned
not to place undue reliance on forward-looking statements.
Investors are cautioned that our forward-looking statements involve
risks and uncertainty, including without limitation, economic
conditions in the United States, disruptions in the debt markets,
economic conditions in the markets in which we own properties,
risks of a lessening of demand for the types of real estate owned
by us, changes in government regulations and regulatory
uncertainty, uncertainty about governmental fiscal policy,
geopolitical events and expenditures that cannot be anticipated
such as utility rate and usage increases, unanticipated repairs,
additional staffing, insurance increases and real estate tax
valuation reassessments. See the “Risk Factors” set forth in Part
I, Item 1A of our Annual Report on Form 10-K for the year ended
December 31, 2015, as the same may be updated from time to time in
subsequent filings with the United States Securities and Exchange
Commission. Although we believe the expectations reflected in the
forward-looking statements are reasonable, we cannot guarantee
future results, levels of activity, acquisitions, dispositions,
performance or achievements. We will not update any of the
forward-looking statements after the date of this press release to
conform them to actual results or to changes in our expectations
that occur after such date, other than as required by law.
View source
version on businesswire.com: http://www.businesswire.com/news/home/20161214006150/en/
For Franklin Street Properties Corp.Georgia Touma,
877-686-9496
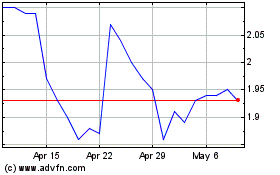
Franklin Street Properties (AMEX:FSP)
Historical Stock Chart
From Aug 2024 to Sep 2024

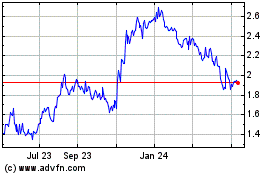
Franklin Street Properties (AMEX:FSP)
Historical Stock Chart
From Sep 2023 to Sep 2024
