UNITED STATES
SECURITIES AND EXCHANGE COMMISSION
Washington, D.C. 20549
____________________________________________
FORM 8-K
CURRENT REPORT
Pursuant to Section 13 or 15(d) of the Securities
Exchange Act of 1934
____________________________________________
Date of Report (Date of earliest event reported): December
1, 2015
QS Energy, Inc.
(Exact Name of Registrant as Specified in
Charter)
| Nevada |
|
0-29185 |
|
52-2088326 |
|
(State or other jurisdiction
of incorporation) |
|
(Commission File Number) |
|
(IRS Employer
Identification No.) |
| |
|
|
|
735 State Street, Suite 500
Santa Barbara,
CA |
|
93101 |
|
| (Address of principal executive offices) |
|
(Zip Code) |
|
Registrant’s telephone number, including
area code: (805) 845-3581
| |
| (Former name or former address, if changed since last report) |
| |
Check the appropriate
box below if the Form 8-K filing is intended to simultaneously satisfy the filing obligation of the registrant under any of the
following provisions:
| o |
Written communications pursuant to Rule 425 under the Securities Act (17 CFR 230.425) |
| o |
Soliciting material pursuant to Rule 14a-12 under the Exchange Act (17 CFR 240.14a-12) |
| o |
Pre-commencement communications pursuant to Rule 14d-2(b) under the Exchange Act (17 CFR 240.14d-2(b)) |
| o |
Pre-commencement communications pursuant to Rule 13e-4(c) under the Exchange Act (17 CFR 240.13e-4(c)) |
Item 8.01 Other Events.
On December 1, 2015,
QS Energy, Inc. (the “Company”) posted a presentation of its Business Plan on the Company’s website, a copy of
which is attached as Exhibit 99.1 hereto.
Item 9.01. Financial Statements and Exhibits.
(d) Exhibits:
Exhibit
Number |
|
Description |
| |
|
|
| 99.1 |
|
Presentation of Business Plan |
SIGNATURES
Pursuant to the requirements of the Securities
Exchange Act of 1934, the Registrant has duly caused this report to be signed on its behalf by the undersigned hereunto duly authorized.
| |
|
|
|
|
| Date: December 1, 2015 |
QS ENERGY, INC.
|
|
| |
By: |
/s/ Greggory Bigger |
|
| |
|
Name: Greggory Bigger |
|
| |
|
Title: Chief Executive Officer |
|
| |
|
|
|
|
|
EXHIBIT
99.1

QS
Energy, Inc.
Optimizing
the Efficiency and Safety
of
the Global Crude Oil Pipeline Infrastructure
BUSINESS
PLAN
December
2015
Greggory
M. Bigger, CEO
QS
Energy, Inc.
735
State Street, Suite 500
Santa
Barbara, CA 93101
|
Tel:
(805) 845-3581
E-mail:
gregg.bigger@qsenergy.com
Web:
www.qsenergy.com
|
No
offering is made or intended by this document. Any offering of interests in QS Energy, Inc. will be made only in compliance with
Federal and State securities laws.
This
document includes confidential and proprietary information of and regarding QS Energy, Inc. This document is provided for informational
purposes only. You may not use this document except for informational purposes, and you may not reproduce this document in whole
or in part, or divulge any of its contents without the prior written consent of QS Energy, Inc. By accepting this document, you
agree to be bound by these restrictions and limitations.
FORWARD
LOOKING STATEMENTS
This
presentation is neither an offer to sell nor a solicitation of offers to purchase securities. This presentation is the confidential
intellectual property of QS Energy, Inc. (“Company”). Any use or redistribution of this document or its contents without
the express written consent of the Company is prohibited. All statements other than statements of historical fact included in
this presentation, including, without limitation, statements regarding the Company’s anticipated financial position, business
strategy and plans and objectives of management of the Company for future operations are forward-looking statements. When used
in this presentation, words such as “anticipate,” “believe,” “estimate,” “expect,”
“intend,” and similar expressions, as they relate to the Company or its management, identify forward-looking statements.
Such forward-looking statements are based on the beliefs of the Company’s management as well as assumptions made by and
information currently available to the Company’s management. Actual results could differ materially from those contemplated
by the forward-looking statements as a result of certain factors not limited to, general economic and business conditions, competitive
factors, changes in business strategy or development plans, the ability to attract and retain qualified personnel, and changes
in legal and regulatory requirements. Such forward-looking statements reflect the current views of the Company with respect to
future events and are subject to these and other risks, uncertainties and assumptions relating to the operations, results of operations,
growth strategy and liquidity of the Company. All subsequent written and oral forward-looking statements attributable to the Company
or persons acting on its behalf are expressly qualified in their entirety by this paragraph.

Contents
| Executive
Summary |
1 |
| Technology |
1 |
| Acquisition
Strategy |
1 |
| Market
Opportunity |
2 |
| Funding
Strategy |
3 |
| Company
Overview |
4 |
| QS
Energy, Inc. |
4 |
| Special-Purpose
Subsidiary |
4 |
| Innovative
High Value Technologies |
5 |
| AOT
(Applied Oil Technology) |
5 |
| JHT
(Joule Heat Technology) |
9 |
| Product
Development and Commercialization |
11 |
| Published
Papers and Studies |
14 |
| Market
Overview |
17 |
| Market
Size |
17 |
| Projected
Pipeline Infrastructure Investment |
18 |
| Target
Markets |
22 |
| Upstream
Producers |
22 |
| Midstream
Transporters |
23 |
| Midstream
Gathering Transporters |
24 |
| Downstream
Refineries / Offloading Facilities |
24 |
| Our
Team |
25 |
| Executive
Management |
25 |
| Board
of Directors |
26 |
| QS
Energy Pool Board of Advisors |
27 |
| Pro
Forma Financials |
28 |
| General
Discussion |
28 |
| Pro
forma Income Statement |
30 |
| Pro
forma Balance Sheet |
31 |
| Pro
forma Cash Flow |
32 |
| Notes |
33 |
Executive
Summary
QS
Energy, Inc. (QS Energy) provides cutting-edge technologies
to companies active in the gathering, upstream and midstream crude oil industry to optimize the efficiency and safety of transporting
conventional and unconventional production to refineries. QS Energy's intellectual property portfolio includes 48 domestic and
international patents and patents pending, which have been developed independently and in conjunction with and exclusively licensed
from Temple University. Through its wholly owned subsidiary, QS Energy Pool, QS Energy looks to make accretive acquisitions of
complementary entities and assets in the oil and gas sector. QS Energy, Inc. is a publicly traded U.S. corporation (OTCQX symbol:
QSEP)1.
Technology
QS
Energy’s AOT and Joule Heat technologies comprise a suite of commercial crude oil pipeline flow assurance products designed
to reduce operating costs and increase capacity of upstream, gathering and midstream pipeline operations. AOT delivers viscosity
reduction by coagulating particulate matter found in crude oil into nanoscale particle clusters. Joule Heat is a highly energy-efficient
feedstock heating system that delivers optimal heat conductivity and performance using less power than other traditional heat
systems.
Acquisition
Strategy
QS
Energy has identified multiple attractive opportunities to acquire producing oil and gas field operations. Our strategy is to
acquire producing oil and gas fields with production profiles of at least ten years, proven long-term development rights, and
demonstrated positive cash flow at commodity prices as low as $25/barrel of oil and $2.00/MCF of gas. While commodity prices stay
low, QS Energy will continue to seek opportunistic acquisitions. As commodity prices rise and acquisition opportunities become
more expensive, QS Energy would be in a position to profit from increased operating revenues while redeploying acquisition capital
to drilling of proved, undeveloped well sites (PUDs) on its previously acquired properties.
Initial
Acquisition: Subject to funding availability, QS Energy is
currently pursuing the acquisition of profitable joint venture gas well operations and drilling rights within the Haynesville
Shale region, one of the largest onshore gas fields in the United States with an estimated 251 trillion cubic feet of recoverable
gas. Located in northwest Louisiana, these assets consist of joint venture interests in 7,000+ gross acres in four field areas,
21 producing wells and 38 Proved Undeveloped (PUD) and Probable wells. At today’s low gas prices, these assets continue
to generate positive cash flows of $100,000 per month, and are expected to operate profitably at gas prices as low as $2.00/MCF;
break-even operations estimated at $1.70/MCF. In 2014, when wellhead gas prices averaged $3.95/MCF, the properties generated $4.6M
in cash.
1
QS Energy was incorporated on February 18, 1998, as a Nevada corporation, under the name Mandalay Capital Corporation. The
Company originally branded itself as Save the World Air, Inc. in 1999 in anticipation of its entry into the “clean tech”
sector of industrial equipment. In 2015, the Company was renamed and re-branded as an energy technology and operations company
under the name QS Energy, Inc.
These
assets, if acquired, would be purchased post-bankruptcy, with clean title, free and clear of all debt and encumbrances. At current
and forecast gas prices, the joint venture interest in producing wells (PDP) are projected to provide a 12% to 17% return on investment
based solely on cash flow generated by producing wells; we would effectively be acquiring future development rights for free.
In
a 2014 year-end financial audit, EY Global Financial Services, reported the joint venture’s reserves under SEC rules of
Oil and Gas Compliance and Disclosure Interpretations2. This audit
valued the estimated ultimate recovery (EUR) of the producing wells (PDP) at 6.3 billion cubic feet of natural gas (BCF); and
identified 19 proved undeveloped sites (PUD), each with a EUR of more than 6 BCF. A summary of the audit SEC evaluation is as
follows:
Haynesville
Acquisition Target
Year End 2014 Audit
SEC Evaluation |
Reserve
Category |
Net
Reserves
(BCF) |
Gross
EUR
(BCF) |
| Proved |
6.3 |
84.6 |
| Probable |
34.8 |
196.0 |
| Possible |
8.3 |
42.4 |
| Contingent |
27.4 |
194.3 |
Despite
falling gas prices, we expect the fluidity of supply and demand forces within the global energy sector will result in commodity
prices rising in the near future. Data compiled by the U.S. Energy Information Agency, shows oil and natural gas rigs in the U.S.
dropped by 58% and 41%, respectively during the 12 months ending October 20153.
The potential loss of natural gas byproduct over the next year has been estimated to be as high as 1 billion cubic feet per day
as oil wells continue to shut down in the Bakken and Eagle Ford regions4.
Acquisition
Pipeline: QS Energy has identified several other oil and gas
asset targets and will proceed pursuant to funding availability.
Market
Opportunity
The
recent surge in oil and gas production and resultant oversupply and industry downturn have created a remarkable buy-opportunity
for companies positioned to acquire distressed assets out of bankruptcy, at auction, through direct purchase and other quick-strike
opportunities. Prior to the recent drop in oil and gas commodity prices, U.S. exploration and production companies drilled wells
at historic rates, capitalized through highly leveraged secured bank loans. As commodity prices fell, so did corporate valuations
and borrowing base. As reported by Business Insider, analysis of the Federal Reserve’s 2015 Shared National Credits exam
reveals that, “one in seven loans to oil and gas companies are edging toward default.”5
2
See https://www.sec.gov/divisions/corpfin/guidance/oilandgas-interp.htm
3
“Drilling Productivity Report for key tight oil
and shale gas regions”, Oct. 2015, U.S. Energy Information Administration, http://www.eia.gov/petroleum/drilling/archive/dpr_oct15.pdf
4
“EIA expects near-term decline in natural gas production
in major shale regions”, Aug. 26, 2015, U.S. Energy Information Administration, https://www.eia.gov/todayinenergy/detail.cfm?id=22672
5
“TROUBLING: Oil and gas companies are edging toward
default”, Business Insider, Nov. 13, 2015; http://www.businessinsider.com/banks-oil-and-gas-classified-loans-2015-11
Target Market: Initially, we plan to target small to mid-market operations valued at
$5MM - $25MM with annual revenues ranging from $1.5MM to $8MM. We have identified our first target acquisition, valued at $4MM
with debt-free positive annual cash flow of $1MM and long-term proven development rights.
Short-term:
Our first acquisitions will target cash flow positive oil and gas production operations, acquired debt-free, either through
direct asset purchase or bankruptcy. Operations must have demonstrated cash flow and should be able to operate profitably at gas
prices at or below $2.00/MCF or oil prices at or $25/bbl.
Although
we do intend to build a balanced oil and gas portfolio, our initial preference leans towards gas assets over oil due to lower
volatility and greater domestic influence on commodity prices.
Long-term:
We will continue to pursue opportunistic acquisitions while
commodity prices remain low. As commodity prices rise and acquisition opportunities become less attractive, QS Energy will turn
its focus to drilling proved, undeveloped well sites (PUDs) on its previously acquired properties.
Funding
Strategy
QS
Energy intends to fund acquisitions through the private placement of a $25 million convertible note, convertible to shares of
common stock of QS Energy, Inc. In advance of the private placement, we intend to raise additional working capital of approximately
$1 million in the form of convertible debt, and approximately $4 million in the form of a secured bridge loan for the sole purpose
of funding our first acquisition. The bridge loan will be settled in cash with funds raised through the convertible note. All
acquired properties will be held and operated by QS Energy Pool, a wholly owned subsidiary of QS Energy Inc., formed for the sole
purpose of acting as QS Energy’s acquisition vehicle. Cash flow from acquired properties will fund QS Energy working capital
and final commercialization of its oil pipeline flow assurance technologies.
Company
Overview
QS
Energy, Inc.
QS
Energy was originally incorporated on February 18, 1998, as a Nevada corporation, under the name Mandalay Capital Corporation.
In 1999, the Company changed its name to Save the World Air, Inc. in anticipation of its entry into the “clean tech”
sector of industrial equipment. In 2015, the Company was renamed and re-branded as an energy technology and operations company
under the name QS Energy, Inc.
QS
Energy is a developer and vendor of patent-protected industrial equipment designed to improve the operational and economic efficiencies
of the global crude oil pipeline infrastructure. Working in partnership with scientists at Temple University in Philadelphia and
in collaboration with petroleum engineers at leading production and transportation entities, QS Energy is establishing a strong
leadership position within the $6 trillion global energy industry. The Company specializes in technologies that favorably affect
the viscosity and flow of a wide spectrum of crude oil products by treating feedstock with electrical charges while in transit,
increasing operational efficiencies and providing “clean tech” benefits by helping to reduce CO2 emissions for the
upstream and midstream sectors.
Over
the past three years QS Energy has undergone an extensive corporate restructuring, significantly reducing expenses, while focusing
corporate activities on the final stages of technology commercialization and revenue growth through the execution of an opportunistic
acquisition strategy. In addition, operations were restructured to meet the demands of Sarbanes-Oxley compliance, all while reducing
administrative overhead. All of these initiatives were done with one purpose in mind: enhancing shareholder value.
Special-Purpose
Subsidiary
QS
Energy Pool is a wholly owned subsidiary of QS Energy, Inc., newly formed for the sole purpose of taking advantage of asset acquisition
opportunities in the oil and gas operations market. QS Energy Pool is specifically targeting the acquisition of one or more operating
companies or properties with proven positive cash flow, providing operating income and bottom line revenue which are both accretive
to and synergistic with QS Energy, Inc.’s current operations.
As
a wholly owned subsidiary of QS Energy, Inc., QS Energy Pool is managed and operated by QS Energy’s executive management
team and Board of Directors. QS Energy Pool has a clean balance sheet and no direct expenses.
We
have identified our first target acquisition, valued at $4MM with positive annual cash flow of $1MM and substantial long-term
development rights. Follow-on acquisitions are targeted at values of $5MM - $25MM with annual revenues ranging from $1.5MM to
$8MM.
To
expedite funding of its initial acquisition, QS Energy Pool intends to secure a $4MM short-term bridge loan, 100% secured by the
acquired assets. The bridge loan will be settled in cash with funds raised through the private placement of a $25MM convertible
note, convertible to common shares of QS Energy Pool’s parent company, QS Energy, Inc. Follow-on acquisitions will be funded
primarily with the balance of funds raised through QS Energy, Inc.’s convertible note.
QS
Energy Pool has formed an Advisory Board comprised of energy industry veterans, each providing a depth of knowledge and strategic
relationships within the oil and gas industry and capable of pre-vetting acquisition targets. See QS Energy Pool Board of Advisors
section below for details.
Innovative
High Value Technologies
Our
current product portfolio is comprised of two lines of patent-protected industrial equipment designed and fabricated entirely
in the U.S. and extensively field tested with leading midstream and upstream producers and pipeline operators.
AOT
(Applied Oil Technology)
AOT
(Applied Oil Technology), is a solid-state hardware system that reduces the viscosity of crude oil by applying a high intensity
electric field within one or more ASME6-certified pressure vessels.
Designed for installation at pump stations within the midstream sector. Independent third-party testing has proven the efficacy
of AOT to: 1) improve flow, 2) increase the volume of transported oil, 3) mitigate bottlenecks, 4) reduce the amount of energy
used to operate the line and, 5) lower operating pressure.
The
AOT is currently the industry’s only commercially available hardware solution utilizing electricity to reduce the viscosity
of crude oil in order to optimize pipeline performance. Protected by 48 worldwide patents, AOT uses electrorheology to change
the mechanical behavior of a variety of oils, liquid gases and other fluids. AOT is uniquely positioned as a cost-efficient, low
maintenance solution with documented efficacy that improves pipeline flow capacity, reduces pipeline operating pressure, unlocks
pipeline chokepoints and lowers pump station energy requirements.
6
American Society of Mechanical Engineers (ASME) is an engineering society and developer
of codes, standards, and certification programs associated with the art,
science, and practice of mechanical engineering.
Although
pipelines are by far the safest, most economical and most preferred method for transporting crude oil and petroleum products7,
a significant amount of energy and pressure is required to operate them – primarily due to the low mobility and high viscosity
characteristic of most grades of crude oil. To counter the inherent resistance of crude oil to flow, and to mitigate drag caused
by turbulence, pipeline operators rely upon chemical additives (diluents and DRA) and the use of heat (trace heating, bulk heating)
to reduce viscosity. While the use of drag reducing agents (DRAs) and heat can reliably achieve the desired viscosity reduction
(resulting in a higher Reynolds number8), lower friction factor
and reduced pump station power requirements, additives are costly, displace a percentage of the volume of feedstock being transported,
and must be removed during the final refinement process. Traditionally, additives dilute the oil by as much as 25 to 30 percent,
effectively reducing pipeline capacity by the same ratio.
Trace
heating systems require extensive wiring and insulation modifications to the pipeline and require a parallel power supply network
supported by control cabinets, temperature detectors and distribution boxes. Heat loss and other inefficiencies result in substantial
electricity/fuel consumption which adds significantly to operating overhead.
Fig.
1: Industrial design schematic and photo of AOT four-vessel viscosity reduction system. Following fabrication and pressure
testing, this 110-ton unit was ASME-certified, approved for use in hazardous location Class 1, Div. I. rated areas, and installed
on a 500,000 barrel per day mid-continent pipeline operated by a $36 billion North American energy company.
Unlike
diluents and DRAs, AOT does not require consumables and operates as a solid-state system while delivering an equivalent viscosity
reduction effect compared to those methods. By subjecting the flow to an electrical field as the crude oil moves through one or
more ASME-certified pressure vessels installed on an isolated skid at the pumping station, the AOT is able to coalesce microscopic
particles within the crude and reduce viscosity. This is accomplished by applying an electrical charge to a series of disk-shaped
metal plates positioned at intervals within the AOT vessel(s). Each plate is perforated with hundreds of round apertures that
allow continuous movement of the crude oil with minimal resistance.
7
“Pipelines are Safest for Transportation of Oil
and Gas”, The Manhattan Institute, June 2013:
http://www.manhattan-institute.org/html/ib_23.htm#.VT1_IiHBzRY
8
In fluid mechanics the Reynolds number (Re) is used to define
the ratio of resistant (inertial) forces to viscous forces to help predict flow patterns and drag.
Through
a process known as dielectrophoresis9, the electrical charge causes
a conformational change to the molecular structure of the naturally occurring paraffin and asphaltene content in the crude oil.
These randomly distributed particles bundle together into tight packets aligned in chains. By aggregating the suspended particles
into short chains traveling in the direction of flow, AOT decreases viscosity and increases pipeline flow rate, optimizing performance
for operators and transporters while lowering their capital requirements.

Fig.
2: Viscosity reduction test results documented by U.S. Department of Energy researchers during a test deployment of a single-vessel
AOT prototype conducted on a 4.4 mile, 6 inch, schedule 80 metal closed loop pipeline at the Rocky Mountain Oil Field Test Center
in Wyoming. The original viscosity of 81.6 centipoise (cP) was reduced by 40 percent,
to 48.95 cP.
In
addition to decreasing viscosity along the direction of flow, this unique chain formation also increases viscosity perpendicular
to the direction of flow which seems to suppress the onset of turbulence. Suppressed turbulence reduces turbulent friction and
substantially increases flow rate, far beyond the benchmark set by reduced viscosity alone. These factors combine to minimize
costs and increase throughput, while mitigating energy loss.
The
impact of viscosity reduction for pipeline transportation systems is well known and, in fact, a large portion of the products
serving the midstream sector seek to achieve this goal. Fluid viscosity plays an important role in the function of any hydraulics
system. It is one of the main sources of internal fluid friction that creates major friction loss, which must be overcome by a
strong pressure gradient created by a pump. Reduction of friction enables the reduction of pressure, thereby improving the efficiency
of the system as a whole. The reduction of power required for flow reduces demand on pump station motors, directly reducing the
amount of carbon dioxide (CO2) emitted. Provided that the pipeline system remains in the same flow condition (laminar or turbulent),
the reduction in viscosity delivered by AOT also leads to a reduction in power consumed per day.
9
Dielectrophoresis (DEP) occurs when a dielectric particle is subjected to a non-uniform electric field. When fields of a
specific frequency are tested for scientific or industrial applications, it becomes possible to manipulate particles selectivity
according to the effect desired.
Many
companies choose to operate their pipelines at a constant pressure or power level. In that case, viscosity reduction will effectively
increase pipeline capacity. Decreases in viscosity will, if strategically deployed, increase throughput and revenues significantly.
Lower viscosity also relieves bottlenecks, and provides companies with the ability to unload crude storage more quickly. This
allows for a more flexible schedule, shorter load times, and more time for maintenance. Reduced wax deposition and suppressed
pour point, two effects currently being studied and confirmed in laboratory testing, may also provide substantial ancillary benefits
to certain customers.
Whether
deployed in a single-vessel or multi-vessel configuration, each AOT pressure vessel can process up to 5,000 gallons of oil per
minute, up to a capacity of 150,000 barrels per day. Depending on customer need, AOT pressure vessels can be connected in parallel,
increasing cumulative capacity. The first commercial skid deployed on an operating pipeline used four pressure vessels in parallel
for a cumulative capacity of 600,000 barrels per day. The Company currently owns five AOT pressure vessels; one of which was recently
deployed in South Texas under lease with options to extend the lease or purchase the equipment (see IV: AOT and JHT Customer Deployments
section on page 23). The remaining four AOT pressure vessels will be re-deployed either separately or together depending on the
target pipeline infrastructure.
In
the 24-months following fabrication of the first AOT prototype in May 2013, two lease agreements resulted in an installation on
a 500,000 barrel per day mid-continent pipeline operated by a $36 billion company, as well as a deployment on a 100,000 barrel
per day pipeline serving the Eagle Ford Formation and operated by a $93 billion entity.
QS
Energy is currently in non-disclosure level discussions with pipeline operators in six of the world’s primary oil transportation
corridors. The Company has also furnished detailed engineering proposals to entities in the Middle East, Europe, Africa and Canada,
while engaging in active engineering and business discussions. Several configurations of single- and multi-vessel AOT systems
have also been extensively field tested by globally recognized independent testing organizations including the U.S. Department
of Energy10, ATS RheoSystems11
and PetroChina/The China Petroleum Pipeline Bureau (CPP)12.
10
“Project Test Results Report; QS Energy, Inc. Viscosity
Reduction Technology”, U.S. Department of Energy, April 4, 2012: https://qsenergy.box.com/DOE-STWA-RMOTC-Report
11
Based in State College, Pennsylvania, ATS
RheoSystems provides industry with rheological, viscoelastic, flow profile, and mechanical property testing capabilities: http://www.atsrheosystems.com
12
“AOT Viscosity Reduction Tests in China”,
PetroChina, China Petroleum Pipeline Bureau (CPP) Flow Assurance Research and Development Facility, June 26, 2012: https://qsenergy.box.com/PetroChina-STWA-Report
Designed
for installation at pump stations on a gravel or concrete substratum, AOT can optimize virtually any midstream infrastructure,
regardless of pipeline length, diameter, flow rating, volume or grade of crude oil carried.
Summary
of AOT Viscosity Reduction System Benefits:
| · | Increased
maximum flow rates for given MAOP (maximum allowable operating pressure) ratings. |
| · | Increased
safety margins via reduced pressure required to achieve constant flow rates. |
| · | Reduced
power consumption and operating expenses at each midstream pump station. |
| · | Reduced
pour point and wax appearance temperatures. |
| · | Reduced
reliance on bulk heating systems. |
| · | Reduced
reliance on chemical pour point WAT depressants and additives. |
JHT
(Joule Heat Technology)
JHT
(Joule Heat Technology)13 is a highly energy-efficient, electrically-powered
heating system that applies an electric current directly to crude oil within an ASME-certified pressure vessel to efficiently
elevate oil temperature, substantially mitigating the high pour point nature of heavy, waxy feedstock and the flow challenges
caused by cold weather environments.
The
Company’s patent-pending Joule Heat Technology takes a unique approach to upstream oil heating. Specifically developed to
treat a wide spectrum of crude oil types, and designed to withstand cold weather conditions, JHT is electrically powered, compact
and adaptable to a variety of environments, from pipelines and oilfields to marine, rail and truck offloading facilities.
Due
to a variety of factors such as high viscosity, density, poor mobility and cold ambient temperatures, the energy industry invests
heavily in trace heating and other electrical and natural gas powered systems to ensure the safe, reliable and cost effective
transport of crude oil. Although the use of heat is common throughout the energy sector, it has traditionally been extremely inefficient
and therefore costly. Existing trace heating systems rely on an electrical resistor to heat the oil, which results in inefficiencies
through heat loss to the ambient environment. Despite the obvious need for a better, energy-efficient heating system, there has
not been a significant technological innovation in crude oil heating in many years – until now.
Developed
and designed in-house by QS Energy engineers and Dr. Carl Meinhart, a prominent researcher in the field of fluid mechanics at
the micro- and nano-scale, JHT is positioned to emerge as the most efficient and adaptable heat solution available for the upstream
and midstream sectors. The primary motivation for our research and development in service of providing innovative heat solutions
for the oil sector was a direct result of lengthy discussions with exploration and production (E&P) entities, pipeline operators
and government officials. Many state governments are scrutinizing activities such as drilling, flaring (the burning off of gas
at the well hole) and the transport of oil and natural gas because they contribute significantly to CO2 (greenhouse gas or GHG)
emissions. A significant portion of the blame for these emissions is centered on the inefficiencies of existing heat technologies.
13
Joule heating is the process by which the passage of an electric current through a resistive conductor releases heat and
is also known as ohmic heating and resistive heating.
JHT
achieves its superior efficiencies by subjecting oil diverted to the JHT vessel to a direct electric field that increases oil
temperature uniformly without interruption of flow. Instead of using energy to heat the pipe wall as seen in trace and direct-fired
(bulk) heaters, JHT creates heat within the oil itself by directly applying an electric field and pumping heat in the form of
electric work, creating a warm core of oil that diffuses heat more evenly. Existing trace heating systems require high levels
of maintenance, for example through the replacement of glycol, a non-corrosive fluid commonly used in convective heat transfer
systems.

Fig.
3: Traditional trace heating generates heat via a resistive heating element which transfers energy into the oil. In
contrast, JHT applies an electrical charge directly to the oil, generating heat within the feedstock itself.
JHT
is a standalone system, designed to function maintenance-free for long periods of time in remote locations. The system can also
interface with any extant SCADA (Supervisory Control and Data Acquisition) infrastructure and can be customized for large, high
volume transmission pipelines or low-flow "feeder" pipelines which are ubiquitous throughout the massive upstream sector.
The
first fully functional JHT unit was recently fabricated by one of our ISO/TS 29001-certified14
supply chain partners and is undergoing laboratory testing by Southern Research Institute15.
Once final calibration and pressure testing has been completed, the system will be installed on a primary pipeline serving the
Greater Monument Butte oilfield located in the Uintah Basin in Utah and operated by Newfield Exploration Company. Newfield is
Utah’s largest oil producer, responsible for approximately 40 percent of the state’s total output.
14
ISO/TS 29001:2010 is a globally
recognized standard that defines the quality management system for product and service supply organizations serving the petroleum,
petrochemical and natural gas industries: http://www.iso.org/iso/home/store/catalogue_tc/catalogue_detail.htm?csnumber=55499
15
An incorporated affiliate of The
University of Alabama at Birmingham (UAB), Southern Research Institute provides environmental and energy research and laboratory
services to government and commercial organizations around the world.
Summary
of JHT Benefits:
| · | Delivers
optimal heat conductivity and performance with less power and in a smaller form factor. |
| · | Achieves
upwards of 60 percent energy efficiency compared to an average of 30 percent seen in
electrical resistor systems. |
| · | Reduces
demand on existing bulk heaters on pipelines, storage tanks or offloading facilities
by preheating the oil and improving the overall system assurance. |
| · | Reduces
back pressure by lowering pipeline operating pressure. |
| · | Avoids
excessive buildup or corking due to poor mobility. |
| · | Drives
overall operational efficiencies by providing greater control over pour point temperatures. |
| · | Runs
on electricity from the available grid. |
| · | Produces
less local emissions, reducing environmental impact. |
Product
Development and Commercialization
At
its inception in 1998, the Company’s research and development focused on improving the fuel efficiency and reducing CO2
and other emissions of gasoline and diesel combustion engines. It was through these preliminary product development efforts that
in 2007 the research of Dr. Rongjia Tao, professor and chair of physics at Temple University
in Philadelphia, came to the attention of QS Energy leadership.
Recognized
as a leading expert in the use of electric and magnetic fields for industrial applications, Dr. Tao had published several technical
papers proposing that electrorheological principles could be useful in improving the performance of land-based and undersea oil
pipelines. Coincidentally, following a decade of declining domestic crude oil production, enhanced oil recovery (EOR) techniques
had sparked intensive new E&P activity and upstream output was soaring to historic highs. The resultant pipeline capacity
challenges were becoming well documented in energy industry trade publications, providing a strong case for commercializing hardware
based on Dr. Tao’s studies.
In
2008, the Company pivoted away from the automotive and truck aftermarket and began underwriting research at Temple University
to develop industrial equipment capable of optimizing pipeline performance through advanced fluid mechanics. Within months, QS
Energy-funded projects at the Physics Department at Temple had shown strong evidence that the
effects of a high intensity electric field could significantly reduce the viscosity of a wide range of crude oils. Newly launched
business development efforts by QS Energy procured oil samples from around the world that, once tested, provided data useful for
the construction of small-scale AOT prototypes.
During
the next two years the joint R&D program resulted in 48 worldwide patents related to the use of electrical fields to treat
crude oil, liquid natural gas and other petroleum products. QS Energy is the sole worldwide licensee of these patents and holds
exclusive rights for their use in commercial applications, in perpetuity, under a royalty agreement with Temple University. The
core functionality of AOT is centered on delivering an electrical “bath” to crude oil in transit based on principles
of electrorheology identified and pioneered by Dr. Tao.
Beginning
in the second quarter of 2011, the Company initiated engineering and supply chain contracting protocols necessary to transition
from prototype testing of our patented industrial-grade technologies to full scale commercial production. Since that time, QS
Energy has been working in close collaboration with leading energy companies and has leveraged its resources as a publicly traded
entity to underwrite the successful development of two distinct categories of pipeline optimization technology. With the expertise
and collaboration of Industrial Screen & Maintenance in Casper, Wyoming, the first functional AOT vessel was fabricated and
shipped to the Rocky Mountain Oilfield Testing Center (RMOTC) for rigorous testing and analysis on a functioning closed loop pipeline.
Operated by the U.S. Department of Energy, the RMOTC was established to provide oilfield infrastructure and SCADA resources to
companies serving the energy industry.
Following
independent verification and validation of viscosity reduction in a range suitable for commercial viability by the research team
at the Department of Engineering at Temple University and U.S. Department of Energy personnel at the RMOTC, the Company initiated
discussions with several leading crude oil producers and transporters. In collaboration with engineering teams at 19 leading energy
industry vendors, including Bechtel, Worley Parsons/Colt Engineering, Kiewit, Gulf Interstate and four Fortune 500 entities, development
of the first industrial-grade AOT system commenced in 2012.
Designed
to the exact specifications of the fourth largest pipeline operator in North America and specifically engineered for beta testing
on their high capacity, north-south, mid-continent pipeline, a four-vessel AOT system was engineered. Under the terms of a six-month
Equipment Lease/Option to Purchase Agreement the 110-ton, solid state, ASME Certified, 600# AOT skid was shipped and installed
in June 2014 on one of the most advanced pipeline infrastructures in the world. Following a series of efficacy tests performed
in conjunction by the Customer, QS Energy personnel, and ATS RheoSystems, AOT was verified to have achieved viscosity reduction
and reduced back pressure. If installed permanently, it would allow pipeline operations to increase throughput or reduce pipeline
operating pressure, and to reduce pumping station power consumption.
This
initial beta installation on a high profile primary pipeline provided the Company with the opportunity to participate in a collaborative
engineering environment with multiple companies, and brought AOT to the attention of the entire industry, including the company
that procured our current deployment. Through beta testing, QS Energy was able to understand and optimize the final details of
the design and installation. As a result of this lengthy, multiyear development effort with several leading entities in the midstream
sector, AOT has been certified to fully comply with the stringent standards and qualification processes as dictated by independent
engineering audit groups and North American industry regulatory bodies.
In
parallel with the development of the AOT system, QS Energy has been working internally to develop a new Joule Heat technology
(JHT). Although research, development and fabrication of JHT hardware is just entering its second year, much progress has been
made in a short amount of time. At the moment JHT has been proven viable in multi-physics models, and confirmed to be market valuable
following research and corroboration with clients and customers. Since market confirmation, QS Energy has built its first prototype,
full-scale installation and hopes to begin testing with a major upstream company within the month.
Applied
Oil Technology (AOT)
From
fiscal year 2013 to the present, QS Energy has executed two AOT Equipment Lease Agreements, both based on limited term leases
with an option to purchase the equipment outright. On August 1, 2013, the Company entered into a four-month Equipment Lease/Option
to Purchase Agreement with a $36 billion pipeline operator for use of a four-vessel AOT system on a 500,000 barrel per day line,
providing QS Energy with its first ever revenues. During the term of the lease, QS Energy successfully tested the AOT technology
on the midstream pipeline, proving its efficacy in reducing viscosity, optimizing pipeline performance, and improving flow. Third-party
ATS RheoSystems was present during the test and confirmed the results using a bench mount viscometer. Although the test periods
were short, QS Energy was also able to see the effects of viscosity reduction in the operational SCADA data.
On
July 15, 2014, the Company entered into a four-month Equipment Lease/Option to Purchase Agreement with an option to extend the
lease for up to a maximum of 84 months for a single-vessel AOT system on a 100,000 barrel per day line with a $96 billion pipeline
operator. This deployment offers the opportunity to optimize AOT for condensate, a super light crude oil that represents the fastest
growing category of feedstock today. In addition to providing useful test data from deployment in the field, these collaborative
opportunities are invaluable in further refining the AOT design and optimizing its performance capabilities.
The
specifics of these agreements are documented in our Company’s Form 10-Q filed with the Securities and Exchange Commission
(SEC) on August 11, 2014 and in various other SEC filings and press announcements since.
Joule
Heat Technology (JHT)
In
October 2014, QS Energy entered into a Joint Development Agreement with Newfield Exploration Company (NYSE: NFX) to test a commercial
prototype of JHT equipment on a crude oil pipeline serving the Greater Monument Butte oilfield located in the Uintah Basin of
Utah. This beta test of JHT provides ideal conditions to demonstrate our heat technology’s efficiency and efficacy. The
Uinta Basin is 5,000 to 10,000 feet above sea level with average low winter temperatures of 16ºF, and the crude oil pumped
from the region is highly paraffinic, with the consistency of shoe polish at room temperature. Uinta's black wax crude must remain
at a minimum temperature of 95°F (yellow wax above 115°F) and therefore requires a substantial amount of heat to keep
it above its high pour point. Newfield, like all other companies in the region, has significant operating expense overhead in
the form of fuel and power used to heat the waxy crude and counter the cold climate conditions characteristic of Utah. This deployment
provides an opportunity to showcase JHT as a cost-effective, low maintenance technology offering the potential to reduce operating
overhead through more efficient heating and transport of the feedstock.
Details
of this engagement are documented in a 10-K filed with the SEC on March 16, 2015.
Published
Papers and Studies
AOT
Video Overview

http://www.qsenergy.com/technology/technology-reports?file=54

Technical
papers published by Dr. Rongjia Tao, co-developer of AOT and Chairman of Temple University's Physics Department:
‘Reducing
viscosity of paraffin base crude oil with electric field for oil production and transportation’, Published in FUEL, The
Science and Technology of Fuel and Energy. Elsevier B.V. (October 25, 2013)
http://qsenergy.box.com/Jfuel-crude-oil
‘Neutron scattering studies of crude oil viscosity reduction with electric field’, Published in FUEL,
The Science and Technology of Fuel and Energy. Elsevier B.V. (June, 2014)
http://qsenergy.box.com/Neutron-Fuel
‘Suppressing Turbulence and Enhancing the Liquid Suspension Flow in Pipeline with Electromagnetic Fields’,
presented at the Tenth International Conference on Flow Dynamics,
November
25-27, 2013, Sendai, Miyagi, Japan.
http://qsenergy.box.com/Turbulence-2013-Tohoku
AOT
CASE STUDY
QS
Energy / ATS RheoSystems Joint Testing of
Commercial
Beta Deployment on Mid-Continent High Volume Pipeline
In
September 2014, a four-vessel AOT system was installed on a newly constructed, high-volume North-South, mid-continent pipeline
under the terms of an Equipment Lease-Option to Purchase Agreement. Fabricated by QS Energy supply chain partners in 2013, the
solid-state, 110-ton AOT system was shipped by freight truck and positioned on a gravel substrate on the equipment’s self-contained
steel skid-mount at a pumping station of the customer’s choosing.
This
commercial deployment and beta test opportunity was the result of extensive collaboration between QS Energy and executives and
engineers from multiple producers, pipeline operators and supply chain partners. Following installation, pressure testing and
calibration, the AOT system was interfaced with the extant SCADA (supervisory control and data acquisition) to provide a detailed
overview of the system’s performance, including real time monitoring of flow rates, back flow pressure and other relevant
metrics. Preliminary tests were conducted over a period of several weeks, under a variety of operating conditions and multiple
grades of crude oil and diluent mixtures.
During
the preliminary test cycle, it was determined that the electric field within the AOT pressure vessel was insufficient to fully
treat heavy crude oils at flow rates expected under full-scale operating conditions. The power supply provided with the AOT device
had been specified and approved by Temple University based on infrastructure and operating parameters, as well as on laboratory
tests performed on crude oil samples provided by the pipeline operator. Detailed investigation verified the AOT power supply had
been manufactured to, and was operating at, specifications as provided by Temple University, but was generating an electric field
approximately 10% of that required to optimize treatment under full-scale operating flow rates16.
It was further determined that replacing the AOT power supply with a more powerful unit would likely correct the situation. However,
due to time constraints, all parties agreed to go forward with the testing using the installed power supply.
In
its most extensive testing during this deployment, the AOT was operated under full-scale commercial operating conditions over
a two-day period. Operations were overseen by the pipeline operator and QS Energy engineers, while engineers from ATS RheoSystems,
a division of the CANNON Instrument Company (“ATS”), were on-site collecting data for subsequent analysis. Oil samples
were taken from the pipeline both before and after treatment by the AOT. Viscosity measurements were conducted on three grades
of heavy crude oils over the two-day testing period. Data collected and analyzed before and after AOT treatment demonstrated a
decrease in viscosity of approximately 23 percent 3 hours after treatment, and a decrease in viscosity of approximately 11 percent
13 hours after treatment; 22 hours after treatment, the crude oil had returned to its original pre-treated viscosity. Viscosity
reductions measured in these tests fell short of reductions experienced in the lab. Given the insufficiency of installed power
supply, we are very encouraged by these results. It is important to note that due the small size of data set collected, these
results cannot be relied upon to provide statistically significant proof of AOT efficacy.
In
consideration of non-discloser agreements, ATS RheoSystems provided a report summarizing test procedures and general findings
which excluded details of operations and results. A copy of this report, compiled by Jeshwanth Rameshwaram, Ph.D., Principal Rheologist,
ATS RheoSystems is available online in PDF format at:
https://qsenergy.box.com/ATS-AOT-SummaryRpt
16
Flow rate and treatment time are inversely proportional; as flow rate increases, the time crude oil particles spend within
the electric field decreases. As a result, higher flow rates require a stronger electric field to optimize AOT treatment.
U.S.
Department of Energy Field Test:
Save
the World Air, Inc. Viscosity Reduction Technology, Casper, Wyoming
Abstract:
The Rocky Mountain Oilfield Testing Center (RMOTC) conducted a field test on a prototype of the QS Energy in-line viscosity
reduction device at the Naval Petroleum Reserve No. 3 (NPR-3) located 35 miles north of Casper in Natrona County, Wyoming. The
in-line viscosity reduction device is designed to reduce the line-loss and increase the flow rate of crude oil traveling through
a commercial pipeline, thereby reducing the energy required for crude oil transportation. Reductions in line-loss and gains in
pump operation efficiency (i.e., reduced power consumption) were observed on the 4.4 mile 6” schedule 80 metal buried pipeline
test loop.
Test
Results:
Viscosity
Reduction The original viscosity was 81.6 cp. After the AOT device was turned on, it was reduced by 56.12 percent down to
48.95cp. After the AOT device was turned off, the crude oil in the section was gradually replaced by untreated crude oil and the
viscosity returned to the original value.
Pressure
Loss When the AOT device is turned on, the pressure loss is reduced by 56.12 percent, from 24.8 psi/mile (pounds per square
inch per mile) down to 14.87 psi/mile. After the device turned off, the crude oil in the section was replaced by untreated crude
oil and the pressure loss returns to the original value.
Conclusion:
Test
results indicate that the viscosity reduction device operated successfully and that the AOT 1.2H prototype delivers improved performance
over the original AOT prototype tested in October 2011. Pipeline line-loss and pump motor power consumption were reduced for a
given flow rate during the observed test. The device may hold potential for energy savings and increased pipeline flow rates for
the oil production and transportation industry.
Available
online at: https://qsenergy.box.com/DOE-STWA-RMOTC-Report
Market
Overview
The
energy sector continues to operate in a period of both rapid change and expansion. Due to the relatively recent and widespread
adoption of advanced oilfield drilling and completion technologies, known as enhanced oil recovery (EOR) techniques, enormous
reserves of “tight” oil and gas are now recoverable from shale formations throughout North America and the world.
This historic surge in upstream crude oil production has resulted in costly and persistent transportation bottlenecks when moving
upstream production to downstream storage, offloading facilities and refineries. This persistent and severe industrywide problem
is stimulating investments in new and existing pipeline infrastructure and a reliance on less desirable alternate forms of transport,
including rail and freight truck.
Since
the initial use of EOR or tertiary recovery techniques in the 1970s, oil and gas producers have progressively relied more heavily
on the application of gas and chemical injection as well as thermal recovery. These extraction techniques, coupled with a much
greater number of new wells in active oilfields, has raised the output of reservoirs by 30 to 60 percent above traditional primary
and secondary recovery practices17. Due to the rapid adoption of
advanced extraction technologies throughout the U.S. energy industry, a 34-year decline in domestic oil and gas production was
reversed in 2006. Historically high output from massive shale formations such as North Dakota’s Bakken, Texas’ Eagle
Ford and Permian Basin, Colorado’s Green River and Utah’s Uintah Basin continues to the present day.
Other
nations with significant exploitable shale formations include Russia, China, Argentina, Libya, Australia, Venezuela, Mexico and
dozens of others, providing a ready market for crude oil pipeline optimization technologies as production comes online. All told,
the U.S. Energy Information Administration estimates there to be 345 billion barrels of identified and recoverable shale oil worldwide.
Consequently,
oil production greatly exceeds the capacity of existing pipelines in the U.S., Canada and many other regions of the world, often
resulting in delivery delays to refineries, as well as reliance on less desirable rail and tanker truck transport. In the U.S.,
billions of dollars in lost revenue opportunities in leading oil producing states such as Texas, North Dakota, Alaska, California,
Colorado, Wyoming and Utah18 are attributed to production takeaway
constraints.
Market
Size
Industry
data and research by independent agencies such as the International Energy Agency (IEA) and IHS Global estimate that the world's
population currently consumes approximately 15 terawatts of energy in all forms annually. To put this into perspective, a terawatt
is equal to 1,000 gigawatts or roughly one thousand times the output of the largest coal-fired plants operating today. Based on
the known cost of sourcing, processing and transporting oil, gas, coal and other forms of usable energy, this places the value
of the global energy sector at roughly $6 trillion per year, or ten percent of the world’s collective economic output. By
2050, global power consumption is forecast to double to 30 terawatts.
17
EOR overview by the U.S. Dept. of Energy, Office of Fossil
Energy:
http://energy.gov/fe/science-innovation/oil-gas-research/enhanced-oil-recovery
18
“Pipeline Capacity; Ensuring the Resiliency the
US Requires”, Defense Transportation Journal, February, 2014:
http://www.ndtahq.com/documents/PipelineCapacity.pdf
According
to multiple studies, the primary drivers behind the continued worldwide increase in demand for energy are population and income
growth. World population is projected to reach 8.3 billion by 2030, adding 1.3 billion more consumers of oil, natural gas, coal
and other forms of energy. During the same time frame, world income is expected to effectively double from 2011 level. Primary
energy consumption is estimated to grow 2.1 percent annually between 2010 and 2020 and 1.3 percent per year from 2020 to 2030,
resulting in a 36 percent increase to global consumption by 203019.
Domestically,
the energy sector is the third largest industry, and the U.S. is one of the largest producers and consumers of energy. Since the
mid-1950s, oil has been the world’s leading energy source and today fossil fuel provides for around 36 percent of U.S. energy
demand with 70 percent refined into fuels used in transportation (gasoline, diesel, jet fuel, etc.)20.
The vast majority of U.S. crude oil production is transported by a network of pipelines, ranging from short “feeder”
lines to transmission lines stretching for hundreds or thousands of miles.
On
the demand side, the IEA forecasts that global oil markets will
remain strong as the market continues to rebalance following the precipitous drop in oil prices
from $110 in July to $40.00 as of November 2015. In its ‘Oil Market Report for April 2015’, IEA analysts have
revised upward global demand by 90,000 barrels per day to 93.6 million barrels per day (mbpd), a gain of 1.1 mbpd over last year.
Projected
Pipeline Infrastructure Investment
Among
the challenges facing the global crude oil production and transportation sectors, few are as intransigent or detrimental to the
industry as the transportation bottlenecks and well-to-market delivery delays that are endemic here in North America and overseas.
While new pipeline infrastructure projects are underway here in the U.S., Canada and in foreign markets, gaining legislative approval
is a lengthy process and their construction is highly capital-intensive.
19
“BP Energy Outlook 2030”, January 2013,
and “BP Statistical Review of World Energy”, June 2013, British Petroleum (BP p.l.c.):
https://www.bp.com/content/dam/bp/pdf/energy-economics/statistical-review-2015/
bp-statistical-review-of-world-energy-2015-full-report.pdf
20
Energy Information Administration, Monthly Energy Review,
July 2014:
http://www.eia.gov/totalenergy/data/monthly/previous.cfm
Although
pipelines are by far the safest and most economical transportation method21,
outmoded pipeline infrastructure constructed primarily in the 1950s and 1960s cannot provide the capacity necessary to move production
downstream to storage, refinery and offloading facilities. Consequently, delivery delays to refineries and reliance on less desirable
rail and tanker truck transport have increased exponentially since 2008 when the shale boom began in earnest. Data compiled by
the U.S. Energy Information Administration, IHS Global and the American Petroleum Institute identify billions in lost revenue
opportunities for E&P companies and tax collection agencies in leading oil producing states such as Texas, North Dakota, Alaska,
California, Colorado, Wyoming and Utah directly attributable to production takeaway constraints.
As
of 2013, the U.S. and Canadian midstream oil market was serviced by a total of 60,911 miles of crude oil pipelines, up 3,448 miles
or 6 percent over 2012 and up 11,647 miles or 23 percent over the past decade22.
Planned midstream pipeline projects are expected to bring an additional 20,000 miles of pipeline capacity over the 5 to 10 years.
However, the bulk of the active pipelines in the U.S. were constructed several decades ago, necessitating enormous capital investments
to maintain and update the aging pipeline infrastructure. Studies by research firm IHS Global Inc. estimate that between 2014
and 2020, an average of greater than $80 billion will be invested annually in U.S. midstream and downstream petroleum infrastructure23.
Despite
the recently depressed price level of the global oil benchmark (North Sea Brent crude, now trading between $50 and $60 a barrel,
roughly half the price of a year ago), experts forecast continued growth in crude oil pipeline capital expenditures. For example,
a study published by GlobalData in February of this year, ‘North America and
Russia to Dominate Global Oil and Gas Pipeline Construction by 2018’, estimates that U.S. oil and gas pipeline capital expenditures
for new construction will exceed $500 billion, resulting in the construction of 24,000 miles of new oil and gas pipeline capacity.
21
“Pipelines are Safest for Transportation of Oil
and Gas”, The Manhattan Institute, June 2013:
http://www.manhattan-institute.org/html/pipelines-are-safest-transportation-oil-and-gas-5716.html
22
“U.S. Liquids Pipeline Usage and Mileage Report”,
Association of Oil Pipe Lines, October 2014:
http://www.api.org/~/media/files/oil-and-natural-gas/pipeline/whats-new/us-liquids-pipeline-usage-mileage-report-oct-2014.pdf
23
“Oil & Natural Gas Transportation & Storage
Infrastructure: Status, Trends, & Economic Benefits”, IHS Global Inc., December 2013, page 20: http://www.api.org/~/media/Files/Policy/SOAE-2014/API-Infrastructure-Investment-Study.pdf

Fig.
4: Data from the International Energy Agency shows that the U.S. shale boom will continue to drive strong upstream
oil and gas output until at least 2020. QS Energy has diversified its target market by calibrating AOT functionality for a wide
spectrum of crude oil and condensate, an ultra-lightweight oil and the fastest growing segment of upstream production. Chart courtesy
of IEA Oil Market Report, February 2015.
QS
Energy’s AOT and Joule Heat Technologies are strategically aligned with the major requirements and challenges facing the
petroleum economy.
First,
AOT allows the midstream sector to increase capacity while remaining within maximum pressure requirements. The technology can
increase capacity for the industry and reduce reliance on truck and train transport, which has proven inefficient and often dangerous.
Second, AOT and JHT help to reduce operating expenses for pipeline operators. These technologies optimize per barrel energy expenditure,
which is especially important given the current oil price environment.
On
a global basis, the IEA projects that the energy sector will require $38 trillion of investment capital in existing and new capacity
by 2035 simply to meet growing demand for energy due to population growth24.
With the oil production boom in North America and overseas expected to continue to outstrip pipeline takeaway capacity, and downward
pressure on oil prices driving the need for ever greater operational efficiencies, AOT and JHT are uniquely positioned within
the industry as solutions capable of addressing both challenges.
24
“World Energy Outlook 2011”, International
Energy Agency, page 40:
https://www.iea.org/publications/freepublications/publication/WEO2011_WEB.pdf
Recently,
the softening of oil prices worldwide has incentivized producers and transporters to reduce costs and seek technologies that can
provide greater operational efficiencies. Industry analysts such as Rick Carr, principal and leader of Deloitte LLP’s oil
& gas operations and supply chain group, note that the drive to squeeze out better margins began in late 2013 when oil prices
fell to the $100 per barrel mark after a price expansion cycle that had been in place since 200025.
Capital-intensive extraction techniques necessary for unlocking tight oil and gas have boosted costs across the industry since
the shale boom began in earnest in 2008, and today’s low spot prices serve as a painful wakeup call for upstream and midstream
companies unaccustomed to scrutinizing overhead.
Research
conducted by IHS Global on behalf of the American Petroleum Institute shows that investment in the oil and gas midstream and downstream
infrastructure jumped 60 percent from 2010 to 2013, increasing from $56.3 billion to $89.6 billion. The report also estimates
that upwards of $90 billion of direct capital will be spent on oil and gas infrastructure this year alone. Data from the U.S.
Department of Energy suggests that developers of the nation’s midstream facilities will need to invest $200 billion to accommodate
expected shale-driven industry output by 2035.
In
answer to the energy industry’s pressing challenges, QS Energy is commercializing cost-efficient and proven “clean
tech” solutions for increasing the number of barrels of oil transported per day through existing pipeline gathering and
transmission systems. Our patent-protected product portfolio is dedicated to providing producers and transporters with highly
customizable industrial hardware capable of reducing operational overhead, increasing margins and delivering measurable competitive
advantages.
25
“Deloitte: Low Oil Prices Creating Need for More
Efficient Operations”, Rigzone.com, February 5, 2015:
http://www.rigzone.com/news/oil_gas/a/137095/Deloitte_Low_Oil_Prices_Creating_Need_for_More_Efficient_Operations
Target
Markets
The
oil and gas sector market can be segmented into three primary categories: Upstream Producers, Midstream Transporters and Downstream
Refiners:
| · | The
Upstream segment is involved in the exploration and production (E&P) of oil and gas. |
| · | Midstream
companies and partnerships transport oil and gas to markets via pipelines, rail and shipping,
and provide storage in the field and at the destination location. |
| · | The
Downstream sector refines oil and gas into finished products and, in cooperation with
manufacturers and retailers, markets and distributes fuels and other refined petroleum
products. |
Upstream
Producers
The
Upstream segment has the greatest exposure to commodity prices. When prices fall as has been the case recently, they feel the
brunt of this realignment. They also have the most to gain from additional flow throughput capacity and therefore would see immediate
benefit from QS Energy’s AOT and JHT solutions.
This
sector is typically more nimble and faces fewer barriers to entry. With clear financial upside for every additional barrel of
crude oil that they are able to transport, these companies are often open to new and innovative technology that will result in
greater efficiencies, lower costs and better cash flow. Upstream producers physically move the most volume of product. They are
customers to the Midstream transporters and enter into long-term contractual shipping obligations (tariff-based transportation
contracts) with them to secure the movement of product from their fields to the refiners and markets downstream.
Producers
make the spot market price for every barrel delivered to refinery, minus the transport costs, tariffs, and marketing discounts
associated with bringing the product to market. A rough rule of thumb for this market is that the further away they are from the
refinery, the higher the transport costs to deliver the product. Discussions with Upstream entities has uncovered strong interest
in solutions that unlock chokepoints from their field equipment to the transmission line loading terminals through viscosity reduction
(AOT) and optimizing flow by directly heating feedstock (JHT). In addition, this group would also benefit from transporters implementing
our AOT transmission-line series due to its ability to increase the overall flow capacity of pipelines transporting product from
loading terminals to market.
Midstream
Transporters
Midstream
entities move oil and gas from gathering lines to downstream storage and refineries. Functioning as “toll collectors”,
they earn fees whether oil prices are rising or falling. Their income is normally based on fixed-fee contracts, providing a great
deal more stability and predictability than in the upstream sector. Industry data shows ample evidence that upstream producers
are often caught with oversupply in relation to the takeaway capacity available to them. Inadequate pipeline infrastructure prompts
them to pull back their output (run fewer rigs) or suffer lower margins by using rail or freight truck to move production.
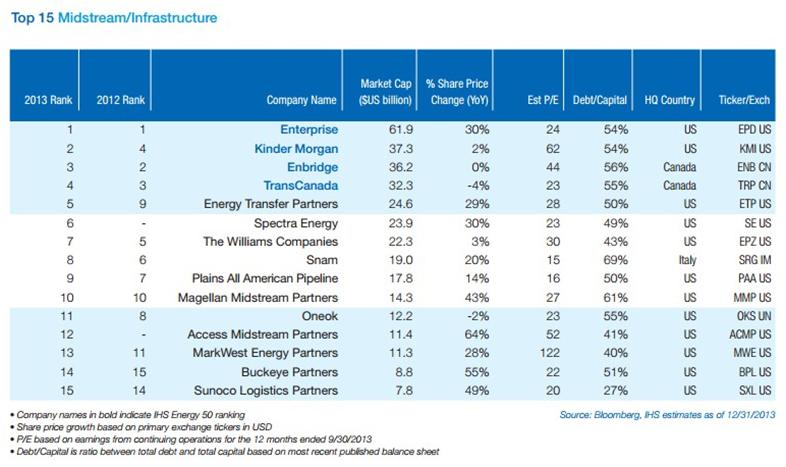
Fig.
5: Rankings of leading companies active in the North American Midstream sector, the principle target customer group for AOT.
Although primarily engaged in the operation of crude oil and natural gas pipelines, many are becoming vertically integrated and
are involved in the processing, storage and marketing of oil, gas, condensates and natural gas liquids. Chart courtesy of Bloomberg
and IHS Global.
Midstream
entities transport the bulk of the world’s crude oil output via the 400,000 miles of crude oil pipelines globally. Domestically,
they deliver a large percentage of the U.S. daily production of 9.2 million barrels per day through 160,000 miles of crude pipelines.
Midstream operators represent a strong and ready market for both AOT and JHT, and field test deployments for both solutions are
underway.
The
pipeline transport operators’ business model is to charge a tariff to transport each barrel of oil through their pipeline.
Due to the high daily volume of oil being transported and its value as a commodity, even incremental performance efficiencies
such as the 8 to 12 percent viscosity reduction demonstrated through a recent AOT beta field test is of high appeal from both
an overhead reduction and toll income increase perspective.
The
AOT and JHT performance enhancing capabilities that can be delivered to this market segment are derived from their ability to
increase flow, lower pipeline operating pressure and reduce the friction loss per mile of the crude oil as it passes through the
hundreds, or thousands, of miles of pipeline from the Upstream producers en route to the downstream refineries. Bottom line and
regulatory benefits can also be realized through increased volume rate capacities, higher toll rate income, reduced BTU per ton-mile
and reduced carbon emissions (CO2).
Midstream
Gathering Transporters
A
subset of the Midstream transporters sector is the gathering line operators, this group often functions as a part of the Upstream
producers’ operations, or within the Midstream transporter’s operations. Midstream gathering lines are the regional
transportation infrastructure that connect the upstream oilfields’ gathering lines to the Midstream long distance transporters’
main trunk lines. They are typically relatively short distance pipelines (20-100 miles) and have diameters between 6” and
12”.
Downstream
Refineries / Offloading Facilities
The
third market category of the industry that can potentially benefit from our solutions is the downstream refineries and rail, truck
and marine offloading sectors. The benefits of AOT viscosity reduction technology and JHT advanced heating equipment could be
significant, both from direct deployment and efficiencies realized in the upstream and midstream segments. Advantages for the
Downstream market sector would be generated through energy savings, reduced reliance on chemical based flow assurance additives,
reduced friction from turbulent pipelines, reduced Reid Vapor Pressures,26
and subsequent evaporation mitigation practices and hardware requirements as mandated by the U.S. Environmental Protection Agency27.
26
Reid vapor pressure (RVP) measures of the volatility of crude
oil and nonviscous petroleum liquids and is defined by the absolute vapor pressure exerted by a liquid at 100 °F (37.8 °C).
27
Oil and Natural Gas Air Pollution Standards, U.S. Environmental
Protection Agency: http://www.epa.gov/airquality/oilandgas/index.html
Our
Team
Executive
Management
Greggory
M. Bigger, Chairman of the Board, President and CEO was most
recently a Founding Partner of Rocfin Advisors, a strategic management consulting company providing advice and direction to a
variety of clients including companies in the energy, clean tech, and emerging technology markets. Prior, Mr. Bigger was Founder
and Board Member of The Bank of Santa Barbara, a regional California bank. Earlier in his career Mr. Bigger held a variety of
key management and leadership positions including U.S. Trust as a Vice President in the Private Client Group, and First Republic
Bank as a Vice President and Manager in the Private Banking Group. Mr. Bigger served in the United States Marine Corps Special
Operations Unit.
Under
Mr. Bigger’s leadership, QS Energy has established relationships with leading oil and gas producers and transporters in
North America, Europe, Africa and the Middle East. In driving the commercialization of the company’s technologies, he negotiated
equipment lease agreements with two $40+B market cap producers and transporters for testing of QSE’s viscosity reduction
technology on high-volume crude oil pipelines serving the largest crude oil transportation corridors in North America. Mr. Bigger
established all supply chain relationships for QSE, including vendor agreements with heavy equipment fabricators for the oil and
gas industry.
During
testing of a prototype of the Company’s AOT viscosity reduction system at the U.S. Department of Energy’s Rocky Mountain
Oil Field Testing Center (RMOTC), Mr. Bigger was instrumental in the rehabilitation of an existing pipeline at the Teapot
Dome oil field in Casper, Wyoming, which was developed into a 4.4 mile, 6-inch closed testing loop. He participated
in the installation and testing of the AOT using a SCADA system to monitor its performance, where significant viscosity reduction
was confirmed by RMOTC personnel. Working in cooperation with PetroChina and the China Petroleum Pipeline Bureau (CPP),
Mr. Bigger also managed a series of laboratory tests in the CPP test center in Shandong Province, near Beijing on crude oil from
the Daqing oil field, mainland China’s largest and most active reservoir.
Michael
McMullen, Controller, is responsible for financial and operational
leadership and establishing and implementing policies relevant to strategic planning and internal controls. Mr. McMullen has extensive
managerial and oversight experience with proven expertise in the areas of corporate governance, private and public capitalization,
asset valuation, risk assessment and in-depth understanding of operational and financial compliance and controls. In 2013, Mr.
McMullen designed, implemented and managed certification of the company’s Sarbanes-Oxley 404 compliant internal controls
and reporting procedures.
Prior
to joining QS Energy, Mr. McMullen served in senior executive capacities across a variety of industries. As a management consultant
and financial advisor to mid-market healthcare and technology entities, he specialized in providing growth and transition management
oversight to companies serving hospitals and cancer centers. In his role as Director of Strategic Development at Leema Energy
Resources he managed acquisition, valuation and due diligence cycles for the purchase and resale of energy-related assets acquired
from distressed savings and loan institutions, resulting in sale-leaseback, leveraged buyout and resale transactions totaling
$150 million. At FloWind Corporation Mr. McMullen negotiated domestic power plant contracts, international joint venture agreements
and equipment sales contracts in excess of $200 million and was responsible for management of FloWind’s $7 million research
program, resulting in the development of the company’s next generation wind turbine technology. As CFO of SomethingNow,
Inc. he was responsible for all finance and operations activities related to growing this internet company from start-up to commercial
operations, resulting in the infusion of $20M in equity, establishing key strategic relationships and ultimately negotiating and
closing the sale of the company to a NASDAQ 100 company.
Board
of Directors
Greggory
Bigger, Chairman of the Board, President and CEO. See Executive
Management section for details.
Don
Dickson has a 26+ year history with Kinder Morgan where he
now serves as project manager its Cortez pipeline. He has served in various capacities at Kinder Morgan, including Director of
Operations on two major pipeline projects Mr. Dickson has also served as CEO of Advanced Pipeline Services, and as Director of
Operations at Tetra Resources. Mr. Dickson began his career as a Senior Engineer with Halliburton Services.
Thomas
Bundros has served as CFO at Colonial Pipeline Company, the
world’s largest pipeline operator transporting 100 million gallons of refined petroleum products daily across 5,500 miles
of pipeline, Mr. Bundros held various financial positions in the Atlanta and New York offices of the Southern Company System,
the 16th largest utility company in the world and the fourth largest in the U.S. with over 4 million customers in Alabama, Georgia,
Florida, and Mississippi. Mr. Bundros currently serves as the COO for Dalton Utilities, a provider of electricity, natural gas,
water and telecom services to the city of Dalton and portions of northwest Georgia.
Mark
Stubbs currently serves as CFO for BBA Aviation's Aftermarket
Services Division, a leading global aviation services. Prior to joining BBA, Mr. Stubbs served as CFO and Interim CEO for CallWave,
Inc., a NASDAQ-listed telecom software company. Mr. Stubbs was CFO of Sound ID, a privately held consumer electronics company.
Prior to Sound ID, Mr. Stubbs held a number of executive positions including CFO of Sound ID, VP Global Supply Chain and Managing
Director EMEA (Europe, Middle East and Africa) at Somera, Inc.
Charles
Blum, former company President and CEO, spent 22 years as
the President/CEO of the Specialty Equipment Market Association (SEMA), which represented 6500 automotive parts and accessories
manufactures and distributors selling more than 31 billion dollars annually.
Nathan
Shelton has served as our director since February 12, 2007. Mr. Shelton has a long and distinguished career with a number
of diverse successful companies primarily related to the automotive industry, holding prominent positions. In 1987 he joined K&N
Engineering as President and part owner and built the company into an industry leader. In 2002 he sold his interest in K&N
Engineering and founded S&S Marketing, which is engaged in the automotive aftermarket parts rep business, which he currently
operates. Mr. Shelton is the recipient of numerous industry related prestigious awards and in 1992, Specialty Equipment Market
Association (SEMA) invited him to join its board of directors, which includes serving in capacity as its Chairman from 2002 to
2004. In 2007 he was elected to the SEMA “Hall of Fame”. Mr. Shelton served honorably in the U.S. Navy Seabees from
1968 to 1972.
QS
Energy Pool Board of Advisors
Bill
Nicholson has a long track record of success as a senior executive
in private and publicly traded companies in the energy industry, and the consumer products and technology sectors. From 1984 to
1992 Mr. Nicholson served as Chief Operating Officer of Amway Corp. during a period of extreme growth which saw revenues jump
from $1.5 billion to $5 billion. As an advisor and investor, Mr. Nicholson has consulted with the IMR Fund, Jacob’s Trading
Company, FLW Outdoors, and was a principle investor and president of Swiftships, Inc., a firm that became the leading manufacturer
of high-speed aluminum watercrafts used for marine patrol and offshore oil field support.
As
both an investor and general partner he has been active in natural gas exploration in the North Texas Barnett Shale, drilling
20 horizontal deep gas wells and owning and operating eight vessels and two ocean-going work barges in support of offshore oil
and gas production in the Persian Gulf, Gulf of Mexico, the California Coast and the India Ocean. As a captain in the U.S. Air
Force, Mr. Nicholson has 300 combat missions to his credit and is the recipient of the Distinguished Flying Cross, Air Medal,
Vietnamese Medal of Honor and Cross of Gallantry.
Scott
Y. Wood has three decades of well-to-refinery experience in
the energy industry, providing oversight of oil and gas properties in many of the industry’s most active shale formations
and basins. Mr. Wood’s career began in 1981 as a Petroleum Landman at Liberty Oil and Gas in Oklahoma City, prior to his
venturing out to develop oil and gas projects. In 1991 he formed Energy Reserves Group, LLC, an E&P company based in Galveston
Bay, Texas. As general manager, Mr. Wood oversaw a series of acquisitions and divestitures including Plains Illinois Inc. which
were consolidated into ERG Resources, L.L.C.
Pro
Forma Financials
The
following unaudited pro forma financial information is presented for illustrative purposes and does not purport to present current
operations and cannot be relied upon as a projection of future results. This information must be reviewed in the context of the
forward-looking statements cautionary language contained in the beginning of the Business Plan and the Risk Factors set forth
in Item 1A of the Company’s Form 10-K, filed with the SEC on March 3, 2016, and is subject to the Company acquiring acquisition
financing on acceptable terms and conditions, which financing may not be available to the company.
General
Discussion
The
following pro forma financials are based on current financials through third quarter 2015, detailed budget analysis and certain
assumptions regarding product development, sales and QS Energy Pool acquisitions. Oil and gas revenues assume successful acquisition
of natural gas wells described as the “Target Acquisition” in the Acquisition Strategy section above. Additional acquisitions
are reasonable estimates based on current market information, using “Target Acquisition” details as a baseline for
follow-on acquisition depletion and commodity price estimates. In total, it is assumed we close 5 acquisitions summarized as follows:

Funding
for the first acquisition is assumed to be in the form of secured debt in the amount of $3.8M (includes closing costs). $25M in
convertible notes are assumed to be funded in three closings during the first 7 months of 2016, summarized as follows:

Equipment
sales estimates are based on current technology status, and assume successful commercialization in the second quarter, 2016. Selling
price and cost of goods are based on current market experience, benefits analysis and actual build costs. These estimates are
based on the Company’s limited experience relating to lease and purchase option terms contained in two (2) field testing
leases, and do not necessarily reflect fair market value of the Company’s technology and equipment. The actual fair market
value of the Company’s technology and equipment has not yet been established or determined. The volume of equipment unit
sales is provided along with the following Pro forma Income Statement; summarized as follows:
| | |
| Business
Plan Baseline Forecast | |
| | |
| 2015Q4 | | |
| 2016Q1 | | |
| 2016Q2 | | |
| 2016Q3 | | |
| 2016Q4 | | |
| 2017Q1 | | |
| 2017Q2 | | |
| 2017Q3 | | |
| 2017Q4 | |
| AOT
Units Leased | |
| – | | |
| – | | |
| 1 | | |
| 1 | | |
| – | | |
| – | | |
| – | | |
| – | | |
| – | |
| AOT Units Sold | |
| – | | |
| – | | |
| – | | |
| – | | |
| 2 | | |
| 4 | | |
| 8 | | |
| 16 | | |
| 20 | |
| JH Units Sold | |
| – | | |
| – | | |
| – | | |
| – | | |
| – | | |
| 5 | | |
| 10 | | |
| 20 | | |
| 40 | |
Pro
forma Income Statement
| | |
Business
Plan Baseline Forecast |
| | |
2015Q4 | |
| 2016Q1 | |
| 2016Q2 | |
| 2016Q3 | |
| 2016Q4 | |
| 2017Q1 | | |
| 2017Q2 | |
| 2017Q3 | |
| 2017Q4 | |
| Oil & Gas Acquisitions | |
3,400,000 | |
| 2,600,000 | |
| 5,000,000 | |
| 10,000,000 | |
| – | |
| – | | |
| – | |
| – | |
| – | |
| Secured Debt Financing | |
3,800,000 | |
| (4,180,000 | ) |
| – | |
| – | |
| – | |
| – | | |
| – | |
| – | |
| – | |
| Convertible Debt Financing | |
– | |
| 10,000,000 | |
| 7,500,000 | |
| 7,500,000 | |
| – | |
| – | | |
| – | |
| – | |
| – | |
| AOT Units Leased | |
– | |
| – | |
| 1 | |
| 1 | |
| – | |
| – | | |
| – | |
| – | |
| – | |
| AOT Units Sold | |
– | |
| – | |
| – | |
| – | |
| 2 | |
| 4 | | |
| 8 | |
| 16 | |
| 20 | |
| JH Units Sold | |
– | |
| – | |
| – | |
| – | |
| – | |
| 5 | | |
| 10 | |
| 20 | |
| 40 | |
| | |
| Pro
forma Income Statement | |
| | |
| 2015Q4 | | |
| 2016Q1 | | |
| 2016Q2 | | |
| 2016Q3 | | |
| 2016Q4 | | |
| 2017Q1 | | |
| 2017Q2 | | |
| 2017Q3 | | |
| 2017Q4 | |
| Income | |
| | | |
| | | |
| | | |
| | | |
| | | |
| | | |
| | | |
| | | |
| | |
| Oil and Gas income, Net | |
| – | | |
| 471,850 | | |
| 925,202 | | |
| 1,578,244 | | |
| 1,780,734 | | |
| 1,666,477 | | |
| 1,565,535 | | |
| 1,480,164 | | |
| 1,423,474 | |
| AOT and JH Sales and Leases | |
| – | | |
| – | | |
| 20,000 | | |
| 20,000 | | |
| 2,000,000 | | |
| 4,600,000 | | |
| 9,200,000 | | |
| 18,400,000 | | |
| 24,800,000 | |
| AOT and JH Cost of Goods Sold | |
| – | | |
| – | | |
| – | | |
| – | | |
| (500,000 | ) | |
| (1,200,000 | ) | |
| (2,400,000 | ) | |
| (4,800,000 | ) | |
| (6,600,000 | ) |
| TOTAL INCOME | |
| – | | |
| 471,850 | | |
| 945,202 | | |
| 1,598,244 | | |
| 3,280,734 | | |
| 5,066,477 | | |
| 8,365,535 | | |
| 15,080,164 | | |
| 19,623,474 | |
| | |
| | | |
| | | |
| | | |
| | | |
| | | |
| | | |
| | | |
| | | |
| | |
| Expense | |
| | | |
| | | |
| | | |
| | | |
| | | |
| | | |
| | | |
| | | |
| | |
| General and Administrative | |
| 482,896 | | |
| 517,601 | | |
| 549,793 | | |
| 574,793 | | |
| 599,793 | | |
| 599,793 | | |
| 599,793 | | |
| 599,793 | | |
| 599,793 | |
| Research and Development | |
| 28,156 | | |
| 24,338 | | |
| 99,338 | | |
| 124,338 | | |
| 174,338 | | |
| 174,338 | | |
| 174,338 | | |
| 174,338 | | |
| 174,338 | |
| Operating Income (EBITDA) | |
| (511,052 | ) | |
| (70,088 | ) | |
| 296,071 | | |
| 899,113 | | |
| 2,506,603 | | |
| 4,292,345 | | |
| 7,591,404 | | |
| 14,306,033 | | |
| 18,849,342 | |
| Other Income (Expense) | |
| | | |
| | | |
| | | |
| | | |
| | | |
| | | |
| | | |
| | | |
| | |
| Other Income | |
| – | | |
| – | | |
| – | | |
| – | | |
| – | | |
| – | | |
| – | | |
| – | | |
| – | |
| Depreciation | |
| | | |
| | | |
| | | |
| | | |
| | | |
| | | |
| | | |
| | | |
| | |
| Depreciation, Corporate Assets | |
| (3,331 | ) | |
| (3,331 | ) | |
| (3,331 | ) | |
| (3,331 | ) | |
| (3,331 | ) | |
| (3,331 | ) | |
| (3,331 | ) | |
| (1,741 | ) | |
| – | |
| Depreciation, QSEP Assets | |
| (42,500 | ) | |
| (75,000 | ) | |
| (137,500 | ) | |
| (262,500 | ) | |
| (262,500 | ) | |
| (262,500 | ) | |
| (262,500 | ) | |
| (262,500 | ) | |
| (262,500 | ) |
| Amortized Interest, OID & BCF | |
| | | |
| | | |
| | | |
| | | |
| | | |
| | | |
| | | |
| | | |
| | |
| Spring 2015 Convertible Note | |
| (31,099 | ) | |
| (4,796 | ) | |
| (4,796 | ) | |
| (4,796 | ) | |
| (4,796 | ) | |
| (4,796 | ) | |
| (4,796 | ) | |
| (4,796 | ) | |
| (4,796 | ) |
| Bridge Loan | |
| (37,500 | ) | |
| (337,500 | ) | |
| – | | |
| – | | |
| – | | |
| – | | |
| – | | |
| – | | |
| – | |
| Secured Note | |
| – | | |
| (855,000 | ) | |
| – | | |
| – | | |
| – | | |
| – | | |
| – | | |
| – | | |
| – | |
| Preferred Convertible Note | |
| – | | |
| (121,667 | ) | |
| (638,750 | ) | |
| (912,500 | ) | |
| (912,500 | ) | |
| (912,500 | ) | |
| (912,500 | ) | |
| (912,500 | ) | |
| (912,500 | ) |
| Amortized Closing Costs | |
| (1,700 | ) | |
| (3,000 | ) | |
| (5,500 | ) | |
| (10,500 | ) | |
| (10,500 | ) | |
| (10,500 | ) | |
| (10,500 | ) | |
| (10,500 | ) | |
| (10,500 | ) |
| State taxes | |
| – | | |
| – | | |
| (800 | ) | |
| – | | |
| – | | |
| – | | |
| (800 | ) | |
| – | | |
| – | |
| Total Other Income (Expense) | |
| (116,130 | ) | |
| (1,400,294 | ) | |
| (790,677 | ) | |
| (1,193,627 | ) | |
| (1,193,627 | ) | |
| (1,193,627 | ) | |
| (1,194,427 | ) | |
| (1,192,037 | ) | |
| (1,190,296 | ) |
| NET INCOME | |
| (627,182 | ) | |
| (1,470,382 | ) | |
| (494,606 | ) | |
| (294,514 | ) | |
| 1,312,976 | | |
| 3,098,718 | | |
| 6,396,977 | | |
| 13,113,996 | | |
| 17,659,046 | |
This
unaudited pro forma financial information is presented for illustrative purposes and does not purport to present current operations
and cannot be relied upon as a projection of future results.
Pro
forma Balance Sheet
| | |
Pro
forma Balance Sheet | |
| ASSETS | |
2015Q4 | | |
2016Q1 | | |
2016Q2 | | |
2016Q3 | | |
2016Q4 | | |
2017Q1 | | |
2017Q2 | | |
2017Q3 | | |
2017Q4 | |
| Cash | |
$ | 1,118,930 | | |
$ | 2,604,842 | | |
$ | 4,915,112 | | |
$ | 2,420,892 | | |
$ | 5,034,162 | | |
$ | 9,324,840 | | |
$ | 16,647,111 | | |
$ | 31,501,477 | | |
$ | 50,599,152 | |
| Prepaid expenses and other current assets | |
| 57,161 | | |
| 57,161 | | |
| 57,161 | | |
| 57,161 | | |
| 57,161 | | |
| 57,161 | | |
| 57,161 | | |
| 57,161 | | |
| 57,161 | |
| Property and Equipment, Corporate, NET | |
| 21,726 | | |
| 18,395 | | |
| 15,064 | | |
| 11,733 | | |
| 8,403 | | |
| 5,072 | | |
| 1,741 | | |
| – | | |
| – | |
| Property and Equipment, QSEP Assets, NET | |
| 3,357,500 | | |
| 5,882,500 | | |
| 10,745,000 | | |
| 20,482,500 | | |
| 20,220,000 | | |
| 19,957,500 | | |
| 19,695,000 | | |
| 19,432,500 | | |
| 19,170,000 | |
| Inventory, AOT & JH (WIP, Cost Basis) | |
| – | | |
| – | | |
| – | | |
| 250,000 | | |
| 350,000 | | |
| 600,000 | | |
| 1,200,000 | | |
| 900,000 | | |
| 900,000 | |
| Other assets | |
| 6,480 | | |
| 6,480 | | |
| 6,480 | | |
| 6,480 | | |
| 6,480 | | |
| 6,480 | | |
| 6,480 | | |
| 6,480 | | |
| 6,480 | |
| Accrued Closing Costs, debt & acquisitions | |
| 462,300 | | |
| 1,163,300 | | |
| 1,807,800 | | |
| 2,647,300 | | |
| 2,636,800 | | |
| 2,626,300 | | |
| 2,615,800 | | |
| 2,605,300 | | |
| 2,594,800 | |
| Total assets | |
$ | 5,024,097 | | |
$ | 9,732,678 | | |
$ | 17,546,618 | | |
$ | 25,876,066 | | |
$ | 28,313,005 | | |
$ | 32,577,353 | | |
$ | 40,223,293 | | |
$ | 54,502,918 | | |
$ | 73,327,593 | |
| | |
| | | |
| | | |
| | | |
| | | |
| | | |
| | | |
| | | |
| | | |
| | |
| LIABILITIES AND STOCKHOLDERS’ EQUITY | |
| | | |
| | | |
| | | |
| | | |
| | | |
| | | |
| | | |
| | | |
| | |
| Accounts payable and accrued expenses | |
| 920,848 | | |
| 920,848 | | |
| 920,848 | | |
| 962,515 | | |
| 1,004,182 | | |
| 1,087,515 | | |
| 1,254,182 | | |
| 1,337,515 | | |
| 1,420,848 | |
| Notes Payable | |
| | | |
| | | |
| | | |
| | | |
| | | |
| | | |
| | | |
| | | |
| | |
| Bridge Loan | |
| 1,000,000 | | |
| – | | |
| – | | |
| – | | |
| – | | |
| – | | |
| – | | |
| – | | |
| – | |
| Secured Debt | |
| 3,800,000 | | |
| – | | |
| – | | |
| – | | |
| – | | |
| – | | |
| – | | |
| – | | |
| – | |
| Convertible Notes | |
| 191,840 | | |
| 10,191,840 | | |
| 17,691,840 | | |
| 25,191,840 | | |
| 25,191,840 | | |
| 25,191,840 | | |
| 25,191,840 | | |
| 25,191,840 | | |
| 25,191,840 | |
| Total Notes Payable, face value | |
| 4,991,840 | | |
| 10,191,840 | | |
| 17,691,840 | | |
| 25,191,840 | | |
| 25,191,840 | | |
| 25,191,840 | | |
| 25,191,840 | | |
| 25,191,840 | | |
| 25,191,840 | |
| Accrued Interest | |
| 32,313 | | |
| 95,443 | | |
| 450,239 | | |
| 955,035 | | |
| 1,459,831 | | |
| 1,964,627 | | |
| 2,469,423 | | |
| 2,974,219 | | |
| 3,479,015 | |
| Accrued OID & BCF Discounts | |
| (1,099,833 | ) | |
| (3,245,000 | ) | |
| (5,431,250 | ) | |
| (7,493,750 | ) | |
| (7,081,250 | ) | |
| (6,668,750 | ) | |
| (6,256,250 | ) | |
| (5,843,750 | ) | |
| (5,431,250 | ) |
| Notes Payable, Net | |
| 3,924,320 | | |
| 7,042,283 | | |
| 12,710,829 | | |
| 18,653,125 | | |
| 19,570,421 | | |
| 20,487,717 | | |
| 21,405,013 | | |
| 22,322,309 | | |
| 23,239,605 | |
| Total liabilities | |
| 4,845,168 | | |
| 7,963,131 | | |
| 13,631,677 | | |
| 19,615,640 | | |
| 20,574,603 | | |
| 21,575,232 | | |
| 22,659,195 | | |
| 23,659,824 | | |
| 24,660,453 | |
| | |
| | | |
| | | |
| | | |
| | | |
| | | |
| | | |
| | | |
| | | |
| | |
| EQUITY | |
| | | |
| | | |
| | | |
| | | |
| | | |
| | | |
| | | |
| | | |
| | |
| Common Stock ($0.001 par value) | |
| 183,172 | | |
| 183,172 | | |
| 183,172 | | |
| 183,172 | | |
| 183,172 | | |
| 183,172 | | |
| 183,172 | | |
| 183,172 | | |
| 183,172 | |
| Additional paid-in capital | |
| 101,211,215 | | |
| 104,272,215 | | |
| 106,912,215 | | |
| 109,552,215 | | |
| 109,717,215 | | |
| 109,882,215 | | |
| 110,047,215 | | |
| 110,212,215 | | |
| 110,377,215 | |
| Accumulated deficit | |
| (101,215,457 | ) | |
| (102,685,840 | ) | |
| (103,180,446 | ) | |
| (103,474,960 | ) | |
| (102,161,984 | ) | |
| (99,063,266 | ) | |
| (92,666,289 | ) | |
| (79,552,293 | ) | |
| (61,893,246 | ) |
| Total stockholders’ equity | |
| 178,929 | | |
| 1,769,547 | | |
| 3,914,941 | | |
| 6,260,427 | | |
| 7,738,403 | | |
| 11,002,121 | | |
| 17,564,098 | | |
| 30,843,094 | | |
| 48,667,140 | |
| Total liabilities and stockholders’
equity | |
| 5,024,097 | | |
| 9,732,678 | | |
| 17,546,618 | | |
| 25,876,066 | | |
| 28,313,005 | | |
| 32,577,353 | | |
| 40,223,293 | | |
| 54,502,918 | | |
| 73,327,593 | |
This
unaudited pro forma financial information is presented for illustrative purposes and does not purport to present current operations
and cannot be relied upon as a projection of future results.
Pro
forma Cash Flow
| | |
Pro forma Cash Flow | |
| Cash Flow | |
2015Q4 | | |
2016Q1 | | |
2016Q2 | | |
2016Q3 | | |
2016Q4 | | |
2017Q1 | | |
2017Q2 | | |
2017Q3 | | |
2017Q4 | |
| Net Income | |
| (627,182 | ) | |
| (1,470,382 | ) | |
| (494,606 | ) | |
| (294,514 | ) | |
| 1,312,976 | | |
| 3,098,718 | | |
| 6,396,977 | | |
| 13,113,996 | | |
| 17,659,046 | |
| Non-cash Expenses | |
| | | |
| | | |
| | | |
| | | |
| | | |
| | | |
| | | |
| | | |
| | |
| Employee and Director Options Expense | |
| 134,300 | | |
| 165,000 | | |
| 165,000 | | |
| 165,000 | | |
| 165,000 | | |
| 165,000 | | |
| 165,000 | | |
| 165,000 | | |
| 165,000 | |
| Depreciation & Amortization | |
| 116,130 | | |
| 1,400,294 | | |
| 789,877 | | |
| 1,193,627 | | |
| 1,193,627 | | |
| 1,193,627 | | |
| 1,193,627 | | |
| 1,192,037 | | |
| 1,190,296 | |
| Cash from Operations | |
| (376,752 | ) | |
| 94,912 | | |
| 460,271 | | |
| 1,064,113 | | |
| 2,671,603 | | |
| 4,457,345 | | |
| 7,755,604 | | |
| 14,471,033 | | |
| 19,014,342 | |
| Cash from (to) finance activities | |
| | | |
| | | |
| | | |
| | | |
| | | |
| | | |
| | | |
| | | |
| | |
| Change in prepaid and other assets | |
| – | | |
| – | | |
| – | | |
| – | | |
| – | | |
| – | | |
| – | | |
| – | | |
| – | |
| Change in Inventory | |
| – | | |
| – | | |
| – | | |
| (250,000 | ) | |
| (100,000 | ) | |
| (250,000 | ) | |
| (600,000 | ) | |
| 300,000 | | |
| – | |
| Change in AP and accrued expenses | |
| – | | |
| – | | |
| – | | |
| 41,667 | | |
| 41,667 | | |
| 83,333 | | |
| 166,667 | | |
| 83,333 | | |
| 83,333 | |
| Short-term Bridge Loan | |
| 1,000,000 | | |
| (1,125,000 | ) | |
| – | | |
| – | | |
| – | | |
| – | | |
| – | | |
| – | | |
| – | |
| Secured Debt | |
| 3,800,000 | | |
| (4,180,000 | ) | |
| – | | |
| – | | |
| – | | |
| – | | |
| – | | |
| – | | |
| – | |
| Preferred Convertible Notes | |
| – | | |
| 10,000,000 | | |
| 7,500,000 | | |
| 7,500,000 | | |
| – | | |
| – | | |
| – | | |
| – | | |
| – | |
| Oil and Gas Acquisitions | |
| (3,400,000 | ) | |
| (2,600,000 | ) | |
| (5,000,000 | ) | |
| (10,000,000 | ) | |
| – | | |
| – | | |
| – | | |
| – | | |
| – | |
| Closing costs, Debt | |
| (328,000 | ) | |
| (600,000 | ) | |
| (450,000 | ) | |
| (450,000 | ) | |
| – | | |
| – | | |
| – | | |
| – | | |
| – | |
| Closing costs, Acquisitions | |
| (136,000 | ) | |
| (104,000 | ) | |
| (200,000 | ) | |
| (400,000 | ) | |
| – | | |
| – | | |
| – | | |
| – | | |
| – | |
| Total Cash from Finance Activities | |
| 936,000 | | |
| 1,391,000 | | |
| 1,850,000 | | |
| (3,558,333 | ) | |
| (58,333 | ) | |
| (166,667 | ) | |
| (433,333 | ) | |
| 383,333 | | |
| 83,333 | |
| Net Cash Flow | |
| 559,248 | | |
| 1,485,912 | | |
| 2,310,271 | | |
| (2,494,220 | ) | |
| 2,613,270 | | |
| 4,290,678 | | |
| 7,322,271 | | |
| 14,854,366 | | |
| 19,097,675 | |
This
unaudited pro forma financial information is presented for illustrative purposes and does not purport to present current operations
and cannot be relied upon as a projection of future results.
Notes
QS Energy (PK) (USOTC:QSEP)
Historical Stock Chart
From Mar 2024 to Apr 2024
 Charts.")
QS Energy (PK) (USOTC:QSEP)
Historical Stock Chart
From Apr 2023 to Apr 2024
 Charts.")