SECURITIES AND EXCHANGE COMMISSION
Washington, D.C. 20549
FORM 6-K
REPORT OF FOREIGN PRIVATE ISSUER
Pursuant to Rule 13a-16 or 15d-16 of the
Securities Exchange Act of 1934
For the month of February 2024
Commission file number: 001-32749
FRESENIUS MEDICAL
CARE AG
(Translation of registrant's name into English)
Else-Kröner Strasse 1
61346 Bad Homburg
Germany
(Address of principal executive offices)
Indicate by check mark whether
the registrant files or will file annual reports under cover of Form 20-F or Form 40-F.
On February 20, 2024,
Fresenius Medical Care AG (the “Company”) issued a Press Release announcing its fourth quarter and full year results for the
period ending December 31, 2023. A copy of the Press Release is furnished as Exhibit 99.1 and the corresponding financial figures
as Exhibit 99.2.
The attached Press Release
contains non-GAAP financial measures. For purposes of Regulation G, a non-GAAP financial measure is a numerical measure of a company’s
performance, financial position, or cash flows that either excludes or includes amounts that are not normally excluded or included in
the most directly comparable measure calculated and presented in accordance with generally accepted accounting principles. To supplement
our fourth quarter and full year 2023 consolidated financial results presented in accordance with International Financial Reporting Standards,
or IFRS, we have used non-GAAP financial measures, including (a) EBITDA, or operating income excluding interest, taxes, depreciation
and amortization, (b) free cash flow, (c) net leverage ratio (ratio of net debt to adjusted EBITDA) and (d) results presented
in constant currency and as adjusted for special items identified in the Press Release and associated tables. These non-GAAP measures
are provided to enhance the user’s overall understanding of our current financial performance and our prospects for the future.
In addition, because we have historically reported certain non-GAAP financial measures in our financial results, we believe the inclusion
of these non-IFRS financial measures provides consistency and comparability in our financial reporting to prior periods for which these
non-GAAP financial measures were previously reported. These non-GAAP financial measures should not be used as a substitute for or be considered
superior to GAAP financial measures. Reconciliation of the non-GAAP financial measures to the most comparable IFRS financial measures
are included in the attached Financial Statements. As the reconciliation of amounts stated in Constant Currency is inherent in the disclosure
included in the Press Release, we believe that a separate reconciliation would not provide any additional benefit.
The Exhibits attached hereto,
shall not be deemed “filed” for purposes of Section 18 of the Securities and Exchange Act of 1934 (the “Exchange
Act”) or otherwise subject to the liabilities of that section, nor shall they be deemed incorporated by reference in any filing
under the Securities Act of 1933 or the Exchange Act, regardless of any general incorporation language in such filing.
EXHIBITS
The following exhibits are being furnished with
this Report:
SIGNATURES
Pursuant to the requirements
of the Securities Exchange Act of 1934, the Registrant has duly caused this report to be signed on its behalf by the undersigned thereunto
duly authorized.
DATE: February 20, 2024
| | Fresenius
Medical Care AG |
| |
By: |
/s/ Helen Giza |
| |
Name: |
Helen Giza |
| |
Title: |
Chief Executive Officer and Chair of the Management Board |
| |
By: |
/s/ Martin Fischer |
| |
Name: |
Martin Fischer |
| |
Title: |
Chief Financial Officer and member of the Management Board |
Exhibit 99.1

| Press Release | Media contact |
| | Christine Peters |
| | T +49 160 6066 770 |
| | christine.peters@freseniusmedicalcare.com |
| | |
| | Contact for analysts |
| | and investors |
| | Dr. Dominik Heger |
| | T +49 6172 609-2601 |
| | dominik.heger@freseniusmedicalcare.com |
| | |
| | www.freseniusmedicalcare.com |
February 20, 2024
Fresenius Medical Care delivers on commitments in a year of fundamental
transformation
| - | Revenue
growth of 5% in 2023 driven by favorable business development |
| - | Operating
income1 growth of 15% exceeding top end of outlook range, due to business growth,
FME25 savings ahead of plan and contributions from the Tricare settlement |
| - | Successful
execution on turnaround plan resulting in significant labor productivity improvements in
Care Delivery and positive pricing in Care Enablement |
| - | Several
key divestments announced as part of the ongoing Portfolio Optimization Program |
| - | Strong
cash flow performance and net financial leverage ratio reduced |
| - | Dividend
of €1.19 per share proposed |
| - | For
2024 continued revenue growth and accelerated operating income growth projected |
Helen Giza, Chief Executive Officer of Fresenius
Medical Care, said: “In 2023, we delivered on our commitments while we fundamentally transformed Fresenius Medical Care. Exceeding
our upgraded financial outlook for the full year was the very successful finish to an extraordinary year. We implemented the new global
operating model, progressed on our operational turnaround ambitions, changed our legal form and advanced on the Portfolio Optimization
Program through key divestments. Thanks to the commitment of our 120,000 employees, the high quality of care for our patients remains
front and center in everything we do. Based on the turnaround progress achieved last year, we have a strong foundation to build on to
make 2024 a year of accelerated profitable growth while progressing towards our ambitious mid-term margin target.”
| 1 | For
FY 2022, special items included costs related to the FME25 program, the impact of the war
in Ukraine, the impact of hyperinflation in Turkiye, the Humacyte investment remeasurement
and the net gain related to InterWell Health. Additionally, the FY 2022 basis for the 2023
outlook was adjusted for U.S. Provider Relief Funding. For FY 2023, special items include
costs related to the FME25 program, the Humacyte investment remeasurement, the costs associated
with the legal form conversion and effects from legacy portfolio optimization. For further
details please see the reconciliation attached to the Press Release. |
Key
figures (IFRS)
| | |
Q4 2023 | | |
Q4 2022 | | |
Growth | | |
Growth | |
FY 2023 | | |
FY 2022 | | |
Growth | | |
Growth | |
| | |
EUR
m | | |
EUR
m | | |
yoy | | |
yoy,
cc | |
EUR
m | | |
EUR
m | | |
yoy | | |
yoy,
cc | |
| Revenue | |
| 4,988 | | |
| 4,997 | | |
| 0 | % | |
+7 | % |
| 19,454 | | |
| 19,398 | | |
| 0 | % | |
| +5 | % |
| | |
| | | |
| | | |
| | | |
| |
| | | |
| | | |
| | | |
| | |
| Operating income | |
| 428 | | |
| 352 | | |
| +22 | % | |
+27 | % |
| 1,369 | | |
| 1,512 | | |
| -9 | % | |
| -7 | % |
| excl.
special items and PRF1 | |
| 555 | | |
| 489 | | |
| +14 | % | |
+18 | % |
| 1,741 | | |
| 1,540 | | |
| +13 | % | |
| +15 | % |
| | |
| | | |
| | | |
| | | |
| |
| | | |
| | | |
| | | |
| | |
| Net
income2 | |
| 188 | | |
| 139 | | |
| +35 | % | |
+41 | % |
| 499 | | |
| 673 | | |
| -26 | % | |
| -24 | % |
| excl.
special items and PRF1 | |
| 259 | | |
| 248 | | |
| +4 | % | |
+8 | % |
| 756 | | |
| 729 | | |
| +4 | % | |
| +6 | % |
| | |
| | | |
| | | |
| | | |
| |
| | | |
| | | |
| | | |
| | |
| Basic EPS (EUR) | |
| 0.64 | | |
| 0.47 | | |
| +35 | % | |
+41 | % |
| 1.70 | | |
| 2.30 | | |
| -26 | % | |
| -24 | % |
| excl.
special items, and PRF1 | |
| 0.88 | | |
| 0.85 | | |
| 4 | % | |
+8 | % |
| 2.58 | | |
| 2.49 | | |
| +4 | % | |
| +6 | % |
yoy = year-on-year, cc = at constant currency, EPS = earnings per
share
Successful execution against
the strategic plan
Fresenius Medical Care, the world’s leading
provider of products and services for individuals with renal diseases, successfully finished a year of significant transformation.
Structure:
During fiscal year 2023, Fresenius Medical Care continuously advanced its structural change. After implementing the new operating model
along with the corresponding new financial reporting at the start of the year, it ended with the successful completion of its change
of legal form into a German stock corporation. Through this change, a simplified corporate governance structure gives the Company more
flexibility and autonomy and strengthens the role of the free float shareholders.
| 2 | Net
income attributable to shareholders of Fresenius Medical Care AG |
Operational
efficiency: In 2023, the company successfully executed on its operational efficiency improvement and turnaround plans. The
FME25 transformation program reached annual sustainable savings of EUR 346 million, ahead of our initial plan for the year (EUR 250 to
300 million). Related one-time costs were EUR 153 million in 2023, adding up to EUR 420 million since the start of the program in 2021.
The program continues well on track to achieving the targeted EUR 650 million of sustainable annual savings by year end 2025. The significant
improvement in labor productivity in Care Delivery a year earlier than targeted, as well as the successful pricing initiatives in Care
Enablement additionally supported the underlying positive earnings development.
Portfolio Optimization:
Fresenius Medical Care announced several key divestments as part of the strategy to execute on its portfolio optimization
program to exit non-core and dilutive assets. The divestments of National Cardiovascular Partners in the U.S. (closed), our operations
in Argentina (closed) and Cura Day Hospitals Group in Australia (signed) generate EUR 0.5 billion in total proceeds, of which EUR 135
million were received in 2023. The three assets include 127 facilities, more than 4,500 employees, more than 10,000 dialysis patients.
Divestments closed in 2023 accounted for EUR 214 million of revenue and EUR 20 million of operating income.
Capital Allocation:
During 2023, Fresenius Medical Care strictly followed its disciplined financial policy. A significant increase of +32% in Free Cash Flow,
mainly due to favorable contributions from working capital and the Tricare settlement was used to reduce its net financial debt by 11%
to EUR 10.8 billion. The corresponding net leverage ratio (net debt/EBITDA) decreased to 3.2x at the end of 2023, compared to 3.4x at
the end of 2022. The Company adheres to its dividend policy of developing dividends in line with the development of net income excluding
special items. Consequently, the dividend proposal for fiscal year 2023 of EUR 1.19 per share corresponds to an increase by 6% compared
to prior year’s dividend.
Sustainability:
Fresenius Medical Care continued to make progress towards its Sustainability goals. Underscoring the Company’s focus
on high quality care, the patients’ overall satisfaction with our services measured by the Net Promoter Score of 72 was at an even
higher level than in previous years. With its recent submission of the commitment letter to the Science Based Targets Initiative (SBTi),
the Company underlines its goal to achieve climate neutrality in its operations by 2040 in line with the Paris Agreement.
Revenue development driven by
solid organic growth
In the fourth quarter 2023, revenue
remained flat with EUR 4,988 million (+7% at constant currency, +3% organic).
Care Delivery
revenue remained flat with EUR 3,976 million in the fourth quarter 2023 (+8% at constant currency, +2% organic).
In Care Delivery U.S., revenue increased by 2%
(+7% at constant currency, +1% organic). The increase was mainly driven by value-based care business growth, reimbursement rate increases,
a favorable payor mix, an increase in dialysis days as well as the impact from the Tricare settlement in the amount of €191 million,
partially offset by negative exchange rate effects. The annualization effect of COVID-19-related excess mortality in the late-stage CKD
(Chronic Kidney Disease) and ESRD (End-Stage Renal Disease) population continues to weigh on same market treatment growth (-0.6%). Adjusted
for the exit from less profitable acute care contracts same market treatment growth was flat.
In Care Delivery International, revenue declined
by 11% (+10% at constant currency, +7% organic) as a negative exchange rate effect could only be partially offset by organic growth.
Despite the annualization effect of COVID-19-related excess mortality, same market treatment growth was positive at 1.9%.
Care Enablement
revenue declined slightly by 1% to EUR 1,380 million in the fourth quarter 2023 (+5% at constant currency, +6% organic). The
negative exchange rate effects were partly offset by higher product sales as well as higher average sales prices.
Within Inter-segment eliminations3,
revenue for products transferred between the operating segments at fair market value declined by 5% to EUR -368 million in the fourth
quarter 2023 (+2% at constant currency).
In full year 2023, revenue was stable
at EUR 19,454 million (+5% at constant currency, +4% organic). Care Delivery revenue was stable at EUR 15,578 million (+5% at constant
currency, +3% organic). In Care Delivery U.S., revenue increased by 1% (+3% at constant currency, +3% organic). Adjusted for the exit
from less profitable acute care contracts, U.S. same market treatment growth was at +0.2%. Revenue in Care Delivery International declined
by 4% (+12% at constant currency, +7% organic). Care Enablement revenue was stable at EUR 5,345 million (+5% at constant currency, +4%
organic). Inter-segment eliminations3 declined by 5% and amounted to EUR -1,469 million (stable at constant currency).
| 3 | The
Company transfers products between segments at fair market value. The associated internal
revenues and expenses and all other consolidation of transactions are included within “Inter-segment
eliminations”. |
Earnings development driven
by labor productivity improvements and FME25 savings
In the fourth
quarter 2023, operating income increased by 22% to EUR 428 million (+27% at constant currency), resulting in a margin
of 8.6% (Q4 2022: 7.0%). Operating income excluding special items and U.S. Provider Relief Funding (PRF)1 increased by 14%
to EUR 555 million (+18% at constant currency), resulting in a margin of 11.1% (Q4 2022: 9.8%).
Operating income in Care Delivery rose
by 13% to EUR 515 million in the fourth quarter 2023 (+17% at constant currency), resulting in a margin of 13.0% (Q4 2022: 11.4%). Operating
income excluding special items and PRF1 increased by 12% to EUR 572 million (+16% at constant currency), resulting in a margin
of 14.4% (Q4 2022: 12.8%). This was mainly driven by savings from the FME25 program and the impact of the Tricare settlement in the net
amount of EUR 181 million. The operating income development was negatively impacted by our value-based care business, inflationary cost
increases as well as higher expense related to performance-based compensation plans.
Operating income in Care Enablement amounted
to EUR -42 million in the fourth quarter 2023 (Q4 2022: EUR -62 million), resulting in a margin of -3.1% (Q4 2022: -4.5%). Operating
income excluding special items1 improved from EUR -3 million in Q4 2022 to EUR 10 million, resulting in a margin of 0.7% (Q4
2022: -0.2%). The improvement compared to the previous year’s quarter was primarily driven by savings from the FME25 program and
positive pricing, partially offset by inflationary cost increases and unfavorable foreign currency transaction effects.
Operating income for Corporate amounted
to EUR -44 million in the fourth quarter 2023 (Q4 2022: EUR -44 million). Excluding special items1, operating income amounted
to EUR -26 million (Q4 2022: EUR -20 million).
In the full year 2023, operating income
decreased by 9% to EUR 1,369 million (-7% at constant currency), resulting in a margin of 7.0% (FY 2022: 7.8%). Excluding special items
and PRF1, operating income increased by 13% to EUR 1,741 million (+15% at constant currency), resulting in a margin of 8.9%
(FY 2022: 7.9%). In Care Delivery, operating income declined by 10% to EUR 1,516 million (-8% at constant currency), resulting in a margin
of 9.7% (FY 2022: 10.8%). Operating income excluding special items and PRF1 increased by 14% to EUR 1,687 million (+16% at
constant currency), resulting in a margin of 10.8% (Q4 2022: 9.5%). In Care Enablement, operating income decreased to EUR -67 million
(FY 2022: EUR -30 million), resulting in a margin of -1.2% (FY 2022: -0.6%). Operating income excluding special items1 improved
by +16% (+19% at constant currency) to EUR 119 million, resulting in a margin of 2.2% (Q4 2022: 1.9%). Operating income for Corporate
amounted to EUR -67 million (FY 2022: EUR -144 million). Operating income excluding special items1 amounted to EUR -52 million
(FY 2022: EUR -41 million).
Net income2
increased by 35% to EUR 188 million (+41% at constant currency) in the fourth quarter 2023. Excluding special items and PRF1,
net income2 increased by 4% to EUR 259 million (+8% at constant currency).
In the full year
2023, net income2 declined by 26% to EUR 499 million (-24% at constant currency). Excluding special items and PRF1,
net income2 increased by 4% to EUR 756 million (+6% at constant currency).
Basic earnings
per share (EPS) increased by 35% to EUR 0.64 (+41% at constant currency) in the fourth quarter 2023. EPS excluding special
items and PRF1 increased by 4% to EUR 0.88 (+8% at constant currency).
In the full year
2023, EPS declined by 26% to EUR 1.70 (-24% at constant currency). Excluding special items and PRF1, EPS increased
by 4% to EUR 2.58 (+6% at constant currency).
Strong cash flow development
Fresenius Medical
Care increased its operating cash flow by 20% to EUR 719 million in the fourth quarter, resulting in a margin of 14.4% (Q4 2022:
12.0%). The increase in net cash provided by operating activities is mainly due to higher income supported by the Tricare settlement
and favorable changes in working capital. In the full year 2023, operating cashflow increased by 21% to EUR 2,629 million, resulting
in a margin of 13.5% (FY 2022: 11.2%).
Free cash flow4
increased by 21% to EUR 480 million in the fourth quarter, resulting in a margin of 9.6% (Q4 2022: 8.0%). In the full
year 2023, Fresenius Medical Care generated free cash flow of EUR 1,960 million, a 32% increase compared to prior year, resulting in
a margin of 10.1% (FY 2022: 7.6%).
| 4 | Net
cash provided by / used in operating activities, after capital expenditures, before acquisitions,
investments, and dividends |
Patients, clinics and employees
As of December 31,
2023, Fresenius Medical Care treated 332,548 patients in 3,925 dialysis clinics worldwide and had 119,845 employees
(headcount) globally, compared to 128,044 employees as of December 31, 2022.
Outlook5
In 2024, Fresenius Medical Care expects revenue
to grow by a low- to mid-single digit percent rate compared to prior year.
The Company expects operating income to grow
by a mid- to high-teens percent rate compared to prior year.
The expected growth rates for 2024 are at constant
currency, excluding special items. The 2023 basis for the revenue outlook is EUR 19,049 million and for the operating income outlook
is EUR 1,540 million, both numbers are adjusted for the positive impact of the Tricare settlement and the operating business impact from
divestments closed by year-end 2023.
The Company reconfirms its targets to achieve
an operating income margin of 10% to 14% by 2025. This excludes impacts from portfolio changes.
Press conference
Fresenius Medical
Care will host a press conference to discuss the strategic outlook and full year 2023 results on February 20, 2024, at 10:00 a.m. CET
/ 4:00 a.m. EST. The press conference will be webcasted in the “Media” section (Link: Events | Fresenius Medical
Care). A replay will be available shortly after the conference.
| 5 | Revenue
and operating income, as referred to in the outlook, are both on a constant currency basis
and excluding special items. Special items include effects that are unusual in nature and
have not been foreseeable or not foreseeable in size or impact at the time of providing the
outlook. The growth rates are based on the results 2023 excluding the costs related to the
FME25 program (€153 M for operating income), the Legal Form Conversion Costs (€30
M for operating income), the impacts from Legacy Portfolio Optimization (€204 M for
operating income) and the Humacyte Investment Remeasurement (-€15 M for operating income).
Additionally, the results 2023 were adjusted for the Tricare settlement (-€191 M for
revenue and -€181 M for operating income) and for the divestiture of the Argentinian
business and NCP (-€214 M for revenue and -€20 M for operating income). |
Investor conference call
Fresenius Medical
Care will host a conference call to discuss the results of the fourth quarter and full year 2023 on February 20, 2024, at 02:00
p.m. CET / 08:00 a.m. EST. Details will be available on the Fresenius Medical Care website in the “Investors”
section (Link: Publications | Fresenius Medical Care). A replay will be available shortly after the call.
Please refer to our statement of earnings
included at the end of this news and to the attachments as separate PDF files for a complete overview of the results of the fourth quarter
and full year 2023. Our 20-F disclosure provides more details.
Fresenius Medical Care is the world's leading
provider of products and services for individuals with renal diseases of which around 4.1 million patients worldwide regularly undergo
dialysis treatment. Through its network of 3,925 dialysis clinics, Fresenius Medical Care provides dialysis treatments for approx. 333,000
patients around the globe. Fresenius Medical Care is also the leading provider of dialysis products such as dialysis machines or dialyzers.
Fresenius Medical Care is listed on the Frankfurt Stock Exchange (FME) and on the New York Stock Exchange (FMS).
For more information visit the Company’s
website at www.freseniusmedicalcare.com.
Disclaimer:
This release contains forward-looking statements
that are subject to various risks and uncertainties. Actual results could differ materially from those described in these forward-looking
statements due to various factors, including, but not limited to, changes in business, economic and competitive conditions, legal changes,
regulatory approvals, impacts related to COVID-19, results of clinical studies, foreign exchange rate fluctuations, uncertainties in
litigation or investigative proceedings, and the availability of financing. These and other risks and uncertainties are detailed in Fresenius
Medical Care AG’s reports filed with the U.S. Securities and Exchange Commission. Fresenius Medical Care AG does not undertake
any responsibility to update the forward-looking statements in this release.
Implementation of measures as presented herein
may be subject to information and consultation procedures with works councils and other employee representative bodies, as per local
laws and practice. Consultation procedures may lead to changes on proposed measures.
| Page 9/11 |
| Page 10/11 |
| Page 11/11 |
Exhibit 99.2
| Content:
Statement of earnings page 2
Segment information page 3
Balance sheet page 4
Cash flow page 5
page 6
Key metrics page 7
page 8
Outlook 2024 page 9
Disclaimer
Copyright by Fresenius Medical Care AG
email: ir@freseniusmedicalcare.com
phone: +49 6172 609 2525
Revenue development by segment
Reconciliation results excl. special items
This release contains forward-looking statements that are subject to various risks and uncertainties. Actual results could differ materially from those
described in these forward-looking statements due to various factors, including, but not limited to, changes in business, economic and competitive
conditions, legal changes, regulatory approvals, impacts related to COVID-19, results of clinical studies, foreign exchange rate fluctuations, uncertainties
in litigation or investigative proceedings, and the availability of financing. These and other risks and uncertainties are detailed in Fresenius Medical Care
AG’s reports filed with the U.S. Securities and Exchange Commission. Fresenius Medical Care AG does not undertake any responsibility to update the
forward-looking statements in this release.
Rounding adjustments applied to individual numbers and percentages may result in these figures differing immaterially from their absolute values.
Furthermore, totals and subtotals in tables may differ slightly from unrounded figures due to rounding in accordance with commercial rounding
conventions.
Fresenius Medical Care AG
February 20, 2024
COMPLETE OVERVIEW OF THE FOURTH QUARTER AND FULL YEAR 2023
Investor Relations |
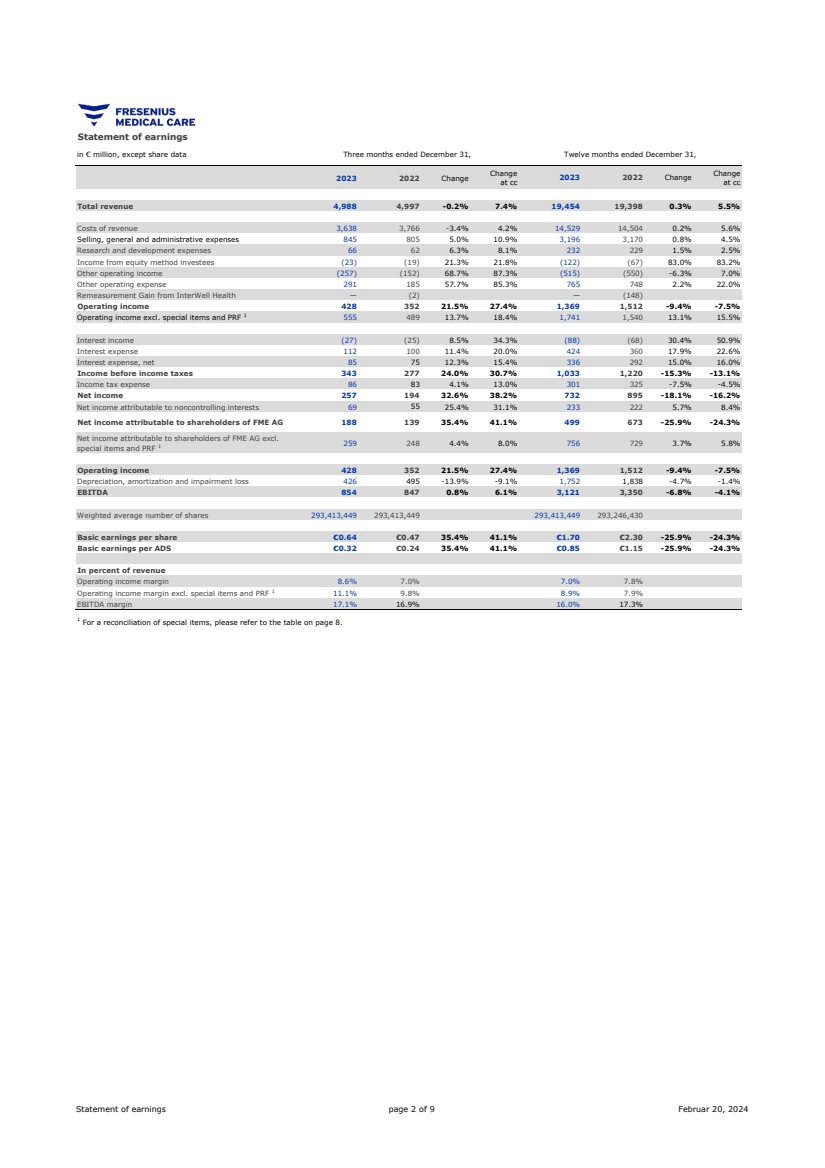
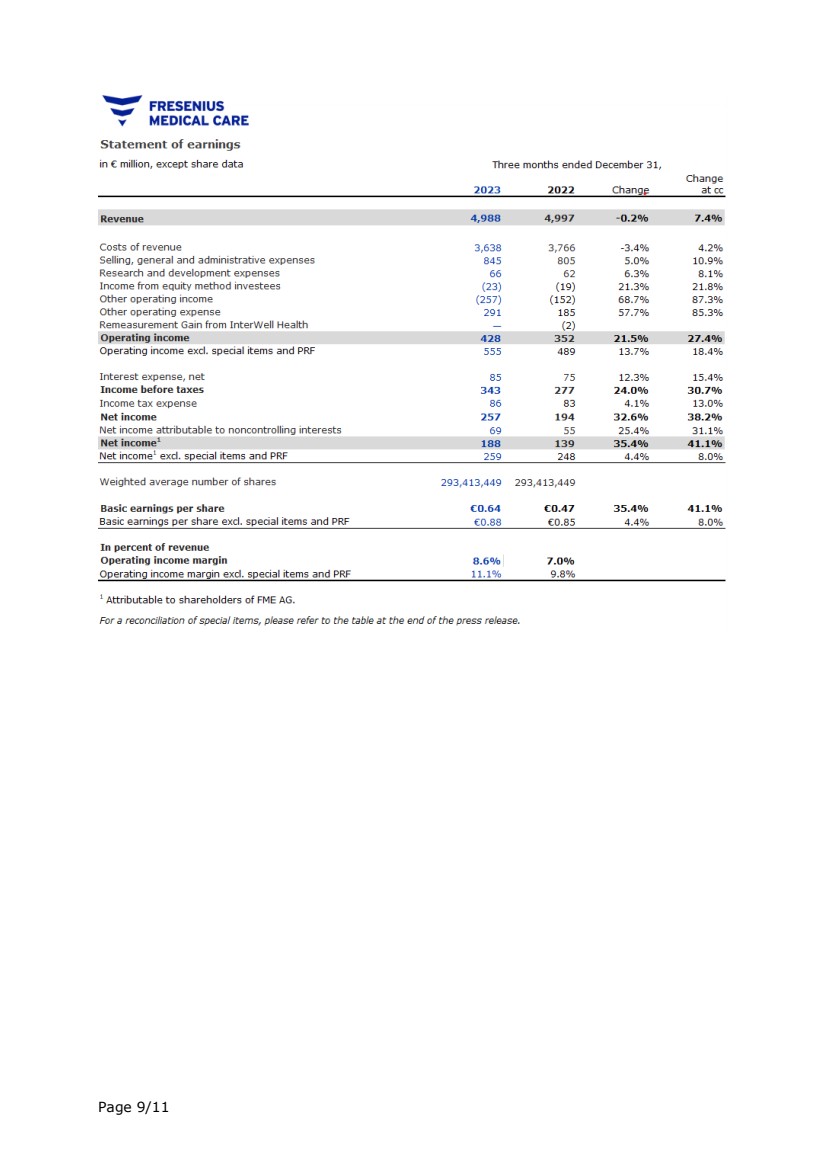
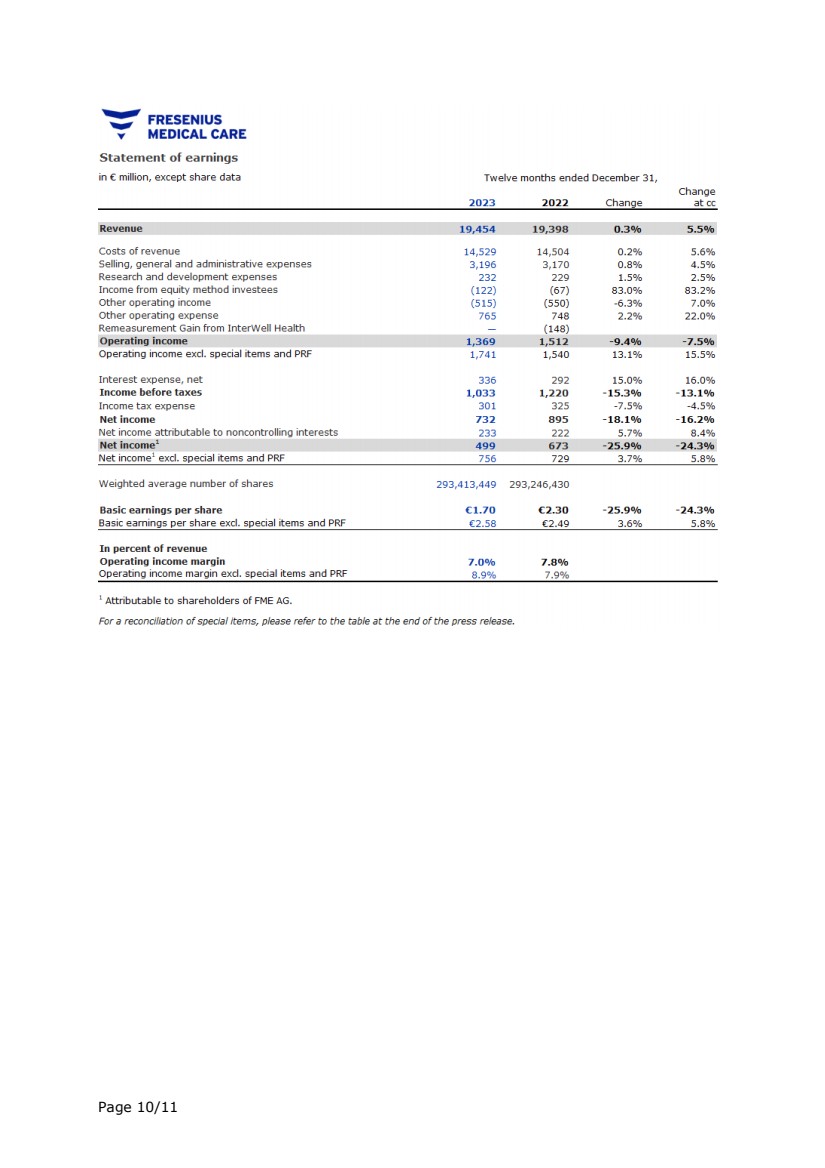
| Statement of earnings
in € million, except share data
2023 2022 Change Change
at cc 2023 2022 Change Change
at cc
Total revenue 4,988 4,997 -0.2% 7.4% 19,454 19,398 0.3% 5.5%
Costs of revenue 3,638 3,766 -3.4% 4.2% 14,529 14,504 0.2% 5.6%
Selling, general and administrative expenses 845 805 5.0% 10.9% 3,196 3,170 0.8% 4.5%
Research and development expenses 66 62 6.3% 8.1% 232 229 1.5% 2.5%
Income from equity method investees (23) (19) 21.3% 21.8% (122) (67) 83.0% 83.2%
Other operating income (257) (152) 68.7% 87.3% (515) (550) -6.3% 7.0%
Other operating expense 291 185 57.7% 85.3% 765 748 2.2% 22.0%
Remeasurement Gain from InterWell Health — (2) — (148)
Operating income 428 352 21.5% 27.4% 1,369 1,512 -9.4% -7.5%
Operating income excl. special items and PRF 1 555 489 13.7% 18.4% 1,741 1,540 13.1% 15.5%
Interest income (27) (25) 8.5% 34.3% (88) (68) 30.4% 50.9%
Interest expense 112 100 11.4% 20.0% 424 360 17.9% 22.6%
Interest expense, net 85 75 12.3% 15.4% 336 292 15.0% 16.0%
Income before income taxes 343 277 24.0% 30.7% 1,033 1,220 -15.3% -13.1%
Income tax expense 86 83 4.1% 13.0% 301 325 -7.5% -4.5%
Net income 257 194 32.6% 38.2% 732 895 -18.1% -16.2%
Net income attributable to noncontrolling interests 69 55 25.4% 31.1% 233 222 5.7% 8.4%
Net income attributable to shareholders of FME AG 188 139 35.4% 41.1% 499 673 -25.9% -24.3%
Net income attributable to shareholders of FME AG excl.
special items and PRF 1 259 248 4.4% 8.0% 756 729 3.7% 5.8%
Operating income 428 352 21.5% 27.4% 1,369 1,512 -9.4% -7.5%
Depreciation, amortization and impairment loss 426 495 -13.9% -9.1% 1,752 1,838 -4.7% -1.4%
EBITDA 854 847 0.8% 6.1% 3,121 3,350 -6.8% -4.1%
Weighted average number of shares 293,413,449 293,413,449 293,413,449 293,246,430
Basic earnings per share €0.64 €0.47 35.4% 41.1% €1.70 €2.30 -25.9% -24.3%
Basic earnings per ADS €0.32 €0.24 35.4% 41.1% €0.85 €1.15 -25.9% -24.3%
In percent of revenue
Operating income margin 8.6% 7.0% 7.0% 7.8%
Operating income margin excl. special items and PRF 1 11.1% 9.8% 8.9% 7.9%
EBITDA margin 17.1% 16.9% 16.0% 17.3%
1
For a reconciliation of special items, please refer to the table on page 8.
Three months ended December 31, Twelve months ended December 31,
Statement of earnings page 2 of 9 Februar 20, 2024 |
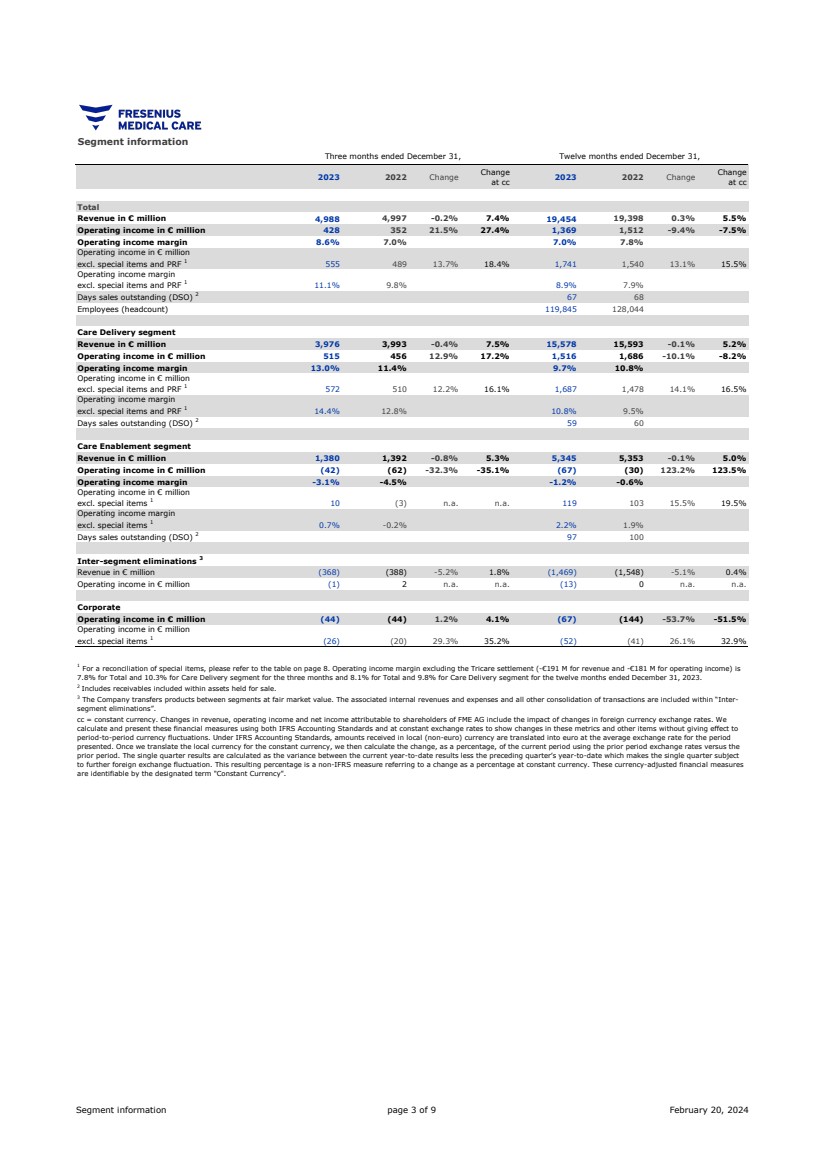
| Segment information
2023 2022 Change Change
at cc 2023 2022 Change Change
at cc
Total
Revenue in € million 4,988 4,997 -0.2% 7.4% 19,454 19,398 0.3% 5.5%
Operating income in € million 428 352 21.5% 27.4% 1,369 1,512 -9.4% -7.5%
Operating income margin 8.6% 7.0% 7.0% 7.8%
Operating income in € million
excl. special items and PRF 1 555 489 13.7% 18.4% 1,741 1,540 13.1% 15.5%
Operating income margin
excl. special items and PRF 1 11.1% 9.8% 8.9% 7.9%
Days sales outstanding (DSO) 2 67 68
Employees (headcount) 119,845 128,044
Care Delivery segment
Revenue in € million 3,976 3,993 -0.4% 7.5% 15,578 15,593 -0.1% 5.2%
Operating income in € million 515 456 12.9% 17.2% 1,516 1,686 -10.1% -8.2%
Operating income margin 13.0% 11.4% 9.7% 10.8%
Operating income in € million
excl. special items and PRF 1 572 510 12.2% 16.1% 1,687 1,478 14.1% 16.5%
Operating income margin
excl. special items and PRF 1 14.4% 12.8% 10.8% 9.5%
Days sales outstanding (DSO) 2 59 60
Care Enablement segment
Revenue in € million 1,380 1,392 -0.8% 5.3% 5,345 5,353 -0.1% 5.0%
Operating income in € million (42) (62) -32.3% -35.1% (67) (30) 123.2% 123.5%
Operating income margin -3.1% -4.5% -1.2% -0.6%
Operating income in € million
excl. special items 1 10 (3) n.a. n.a. 119 103 15.5% 19.5%
Operating income margin
excl. special items 1 0.7% -0.2% 2.2% 1.9%
Days sales outstanding (DSO) 2 97 100
Inter-segment eliminations 3
Revenue in € million (368) (388) -5.2% 1.8% (1,469) (1,548) -5.1% 0.4%
Operating income in € million (1) 2 n.a. n.a. (13) 0 n.a. n.a.
Corporate
Operating income in € million (44) (44) 1.2% 4.1% (67) (144) -53.7% -51.5%
Operating income in € million
excl. special items 1 (26) (20) 29.3% 35.2% (52) (41) 26.1% 32.9%
3
The Company transfers products between segments at fair market value. The associated internal revenues and expenses and all other consolidation of transactions are included within “Inter-segment eliminations”.
1
For a reconciliation of special items, please refer to the table on page 8. Operating income margin excluding the Tricare settlement (-€191 M for revenue and -€181 M for operating income) is
7.8% for Total and 10.3% for Care Delivery segment for the three months and 8.1% for Total and 9.8% for Care Delivery segment for the twelve months ended December 31, 2023.
cc = constant currency. Changes in revenue, operating income and net income attributable to shareholders of FME AG include the impact of changes in foreign currency exchange rates. We
calculate and present these financial measures using both IFRS Accounting Standards and at constant exchange rates to show changes in these metrics and other items without giving effect to
period-to-period currency fluctuations. Under IFRS Accounting Standards, amounts received in local (non-euro) currency are translated into euro at the average exchange rate for the period
presented. Once we translate the local currency for the constant currency, we then calculate the change, as a percentage, of the current period using the prior period exchange rates versus the
prior period. The single quarter results are calculated as the variance between the current year-to-date results less the preceding quarter’s year-to-date which makes the single quarter subject
to further foreign exchange fluctuation. This resulting percentage is a non-IFRS measure referring to a change as a percentage at constant currency. These currency-adjusted financial measures
are identifiable by the designated term "Constant Currency".
2 Includes receivables included within assets held for sale.
Three months ended December 31, Twelve months ended December 31,
Segment information page 3 of 9 February 20, 2024 |
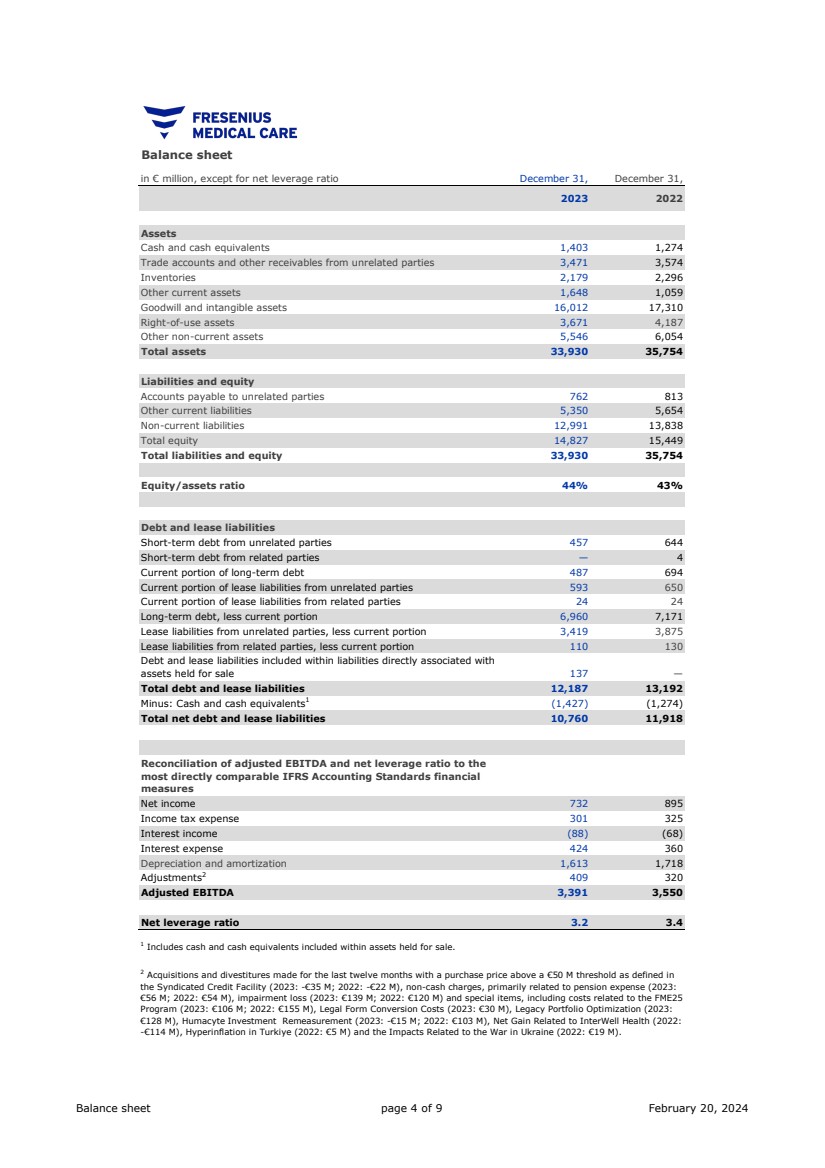
| Balance sheet
in € million, except for net leverage ratio December 31, December 31,
2023 2022
Assets
Cash and cash equivalents 1,403 1,274
Trade accounts and other receivables from unrelated parties 3,471 3,574
Inventories 2,179 2,296
Other current assets 1,648 1,059
Goodwill and intangible assets 16,012 17,310
Right-of-use assets 3,671 4,187
Other non-current assets 5,546 6,054
Total assets 33,930 35,754
Liabilities and equity
Accounts payable to unrelated parties 762 813
Other current liabilities 5,350 5,654
Non-current liabilities 12,991 13,838
Total equity 14,827 15,449
Total liabilities and equity 33,930 35,754
Equity/assets ratio 44% 43%
Debt and lease liabilities
Short-term debt from unrelated parties 457 644
Short-term debt from related parties — 4
Current portion of long-term debt 487 694
Current portion of lease liabilities from unrelated parties 593 650
Current portion of lease liabilities from related parties 24 24
Long-term debt, less current portion 6,960 7,171
Lease liabilities from unrelated parties, less current portion 3,419 3,875
Lease liabilities from related parties, less current portion 110 130
Debt and lease liabilities included within liabilities directly associated with
assets held for sale 137 —
Total debt and lease liabilities 12,187 13,192
Minus: Cash and cash equivalents1 (1,427) (1,274)
Total net debt and lease liabilities 10,760 11,918
Reconciliation of adjusted EBITDA and net leverage ratio to the
most directly comparable IFRS Accounting Standards financial
measures
Net income 732 895
Income tax expense 301 325
Interest income (88) (68)
Interest expense 424 360
Depreciation and amortization 1,613 1,718
Adjustments2 409 320
Adjusted EBITDA 3,391 3,550
Net leverage ratio 3.2 3.4
2
Acquisitions and divestitures made for the last twelve months with a purchase price above a €50 M threshold as defined in
the Syndicated Credit Facility (2023: -€35 M; 2022: -€22 M), non-cash charges, primarily related to pension expense (2023:
€56 M; 2022: €54 M), impairment loss (2023: €139 M; 2022: €120 M) and special items, including costs related to the FME25
Program (2023: €106 M; 2022: €155 M), Legal Form Conversion Costs (2023: €30 M), Legacy Portfolio Optimization (2023:
€128 M), Humacyte Investment Remeasurement (2023: -€15 M; 2022: €103 M), Net Gain Related to InterWell Health (2022:
-€114 M), Hyperinflation in Turkiye (2022: €5 M) and the Impacts Related to the War in Ukraine (2022: €19 M).
1
Includes cash and cash equivalents included within assets held for sale.
Balance sheet page 4 of 9 February 20, 2024 |
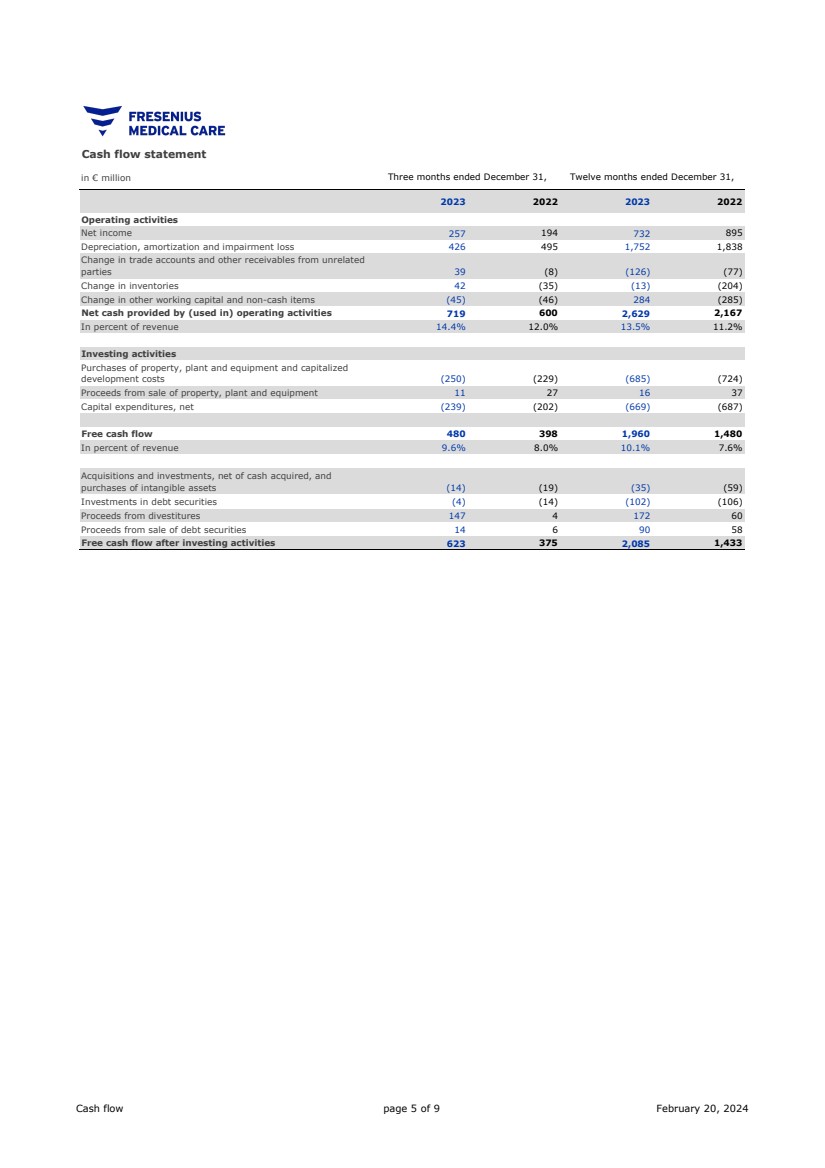
| Cash flow statement
in € million
2023 2022 2023 2022
Operating activities
Net income 257 194 732 895
Depreciation, amortization and impairment loss 426 495 1,752 1,838
Change in trade accounts and other receivables from unrelated
parties 39 (8) (126) (77)
Change in inventories 42 (35) (13) (204)
Change in other working capital and non-cash items (45) (46) 284 (285)
Net cash provided by (used in) operating activities 719 600 2,629 2,167
In percent of revenue 14.4% 12.0% 13.5% 11.2%
Investing activities
Purchases of property, plant and equipment and capitalized
development costs (250) (229) (685) (724)
Proceeds from sale of property, plant and equipment 11 27 16 37
Capital expenditures, net (239) (202) (669) (687)
Free cash flow 480 398 1,960 1,480
In percent of revenue 9.6% 8.0% 10.1% 7.6%
Acquisitions and investments, net of cash acquired, and
purchases of intangible assets (14) (19) (35) (59)
Investments in debt securities (4) (14) (102) (106)
Proceeds from divestitures 147 4 172 60
Proceeds from sale of debt securities 14 6 90 58
Free cash flow after investing activities 623 375 2,085 1,433
Three months ended December 31, Twelve months ended December 31,
Cash flow page 5 of 9 February 20, 2024 |
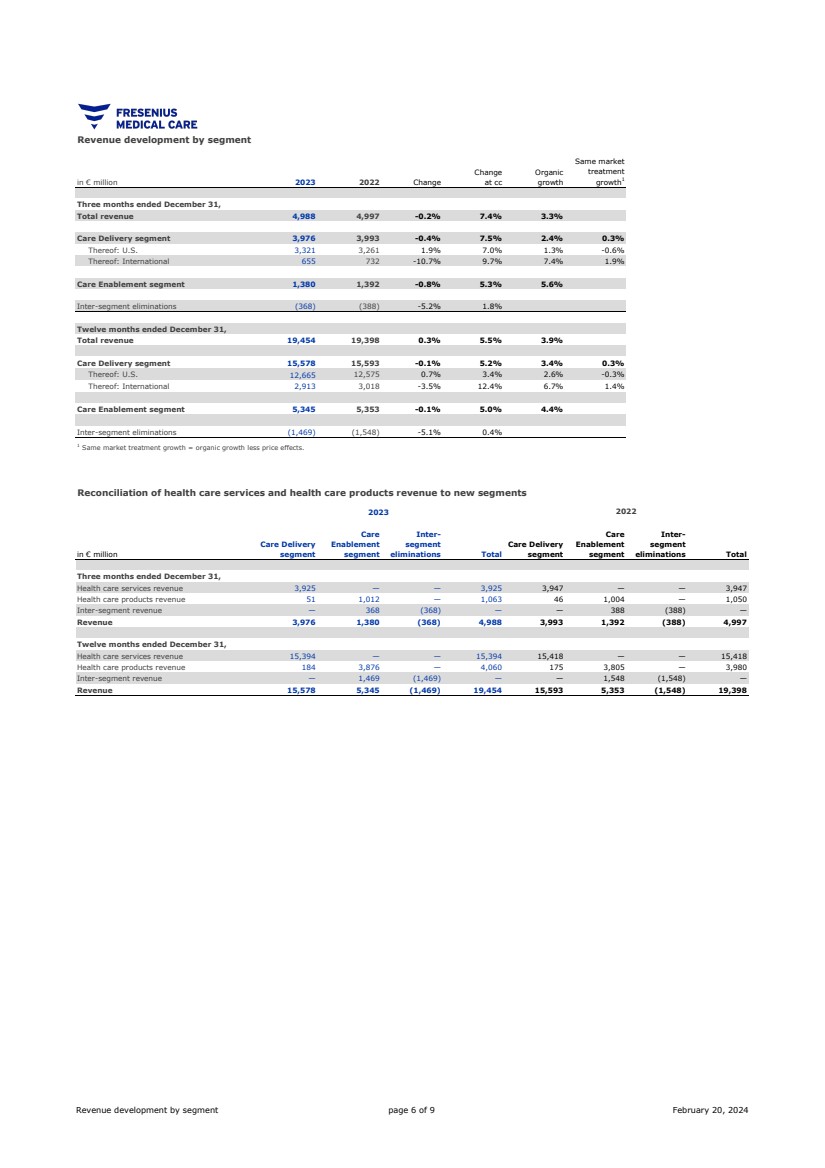
| in € million 2023 2022 Change
Change
at cc
Organic
growth
Same market
treatment
growth1
Three months ended December 31,
Total revenue 4,988 4,997 -0.2% 7.4% 3.3%
Care Delivery segment 3,976 3,993 -0.4% 7.5% 2.4% 0.3%
Thereof: U.S. 3,321 3,261 1.9% 7.0% 1.3% -0.6%
Thereof: International 655 732 -10.7% 9.7% 7.4% 1.9%
Care Enablement segment 1,380 1,392 -0.8% 5.3% 5.6%
Inter-segment eliminations (368) (388) -5.2% 1.8%
Twelve months ended December 31,
Total revenue 19,454 19,398 0.3% 5.5% 3.9%
Care Delivery segment 15,578 15,593 -0.1% 5.2% 3.4% 0.3%
Thereof: U.S. 12,665 12,575 0.7% 3.4% 2.6% -0.3%
Thereof: International 2,913 3,018 -3.5% 12.4% 6.7% 1.4%
Care Enablement segment 5,345 5,353 -0.1% 5.0% 4.4%
Inter-segment eliminations (1,469) (1,548) -5.1% 0.4%
in € million
Care Delivery
segment
Care
Enablement
segment
Inter-segment
eliminations Total
Care Delivery
segment
Care
Enablement
segment
Inter-segment
eliminations Total
Three months ended December 31,
Health care services revenue 3,925 — — 3,925 3,947 — — 3,947
Health care products revenue 51 1,012 — 1,063 46 1,004 — 1,050
Inter-segment revenue — 368 (368) — — 388 (388) —
Revenue 3,976 1,380 (368) 4,988 3,993 1,392 (388) 4,997
Twelve months ended December 31,
Health care services revenue 15,394 — — 15,394 15,418 — — 15,418
Health care products revenue 184 3,876 — 4,060 175 3,805 — 3,980
Inter-segment revenue — 1,469 (1,469) — — 1,548 (1,548) —
Revenue 15,578 5,345 (1,469) 19,454 15,593 5,353 (1,548) 19,398
1
Same market treatment growth = organic growth less price effects.
Revenue development by segment
2023
Reconciliation of health care services and health care products revenue to new segments
2022
Revenue development by segment page 6 of 9 February 20, 2024 |
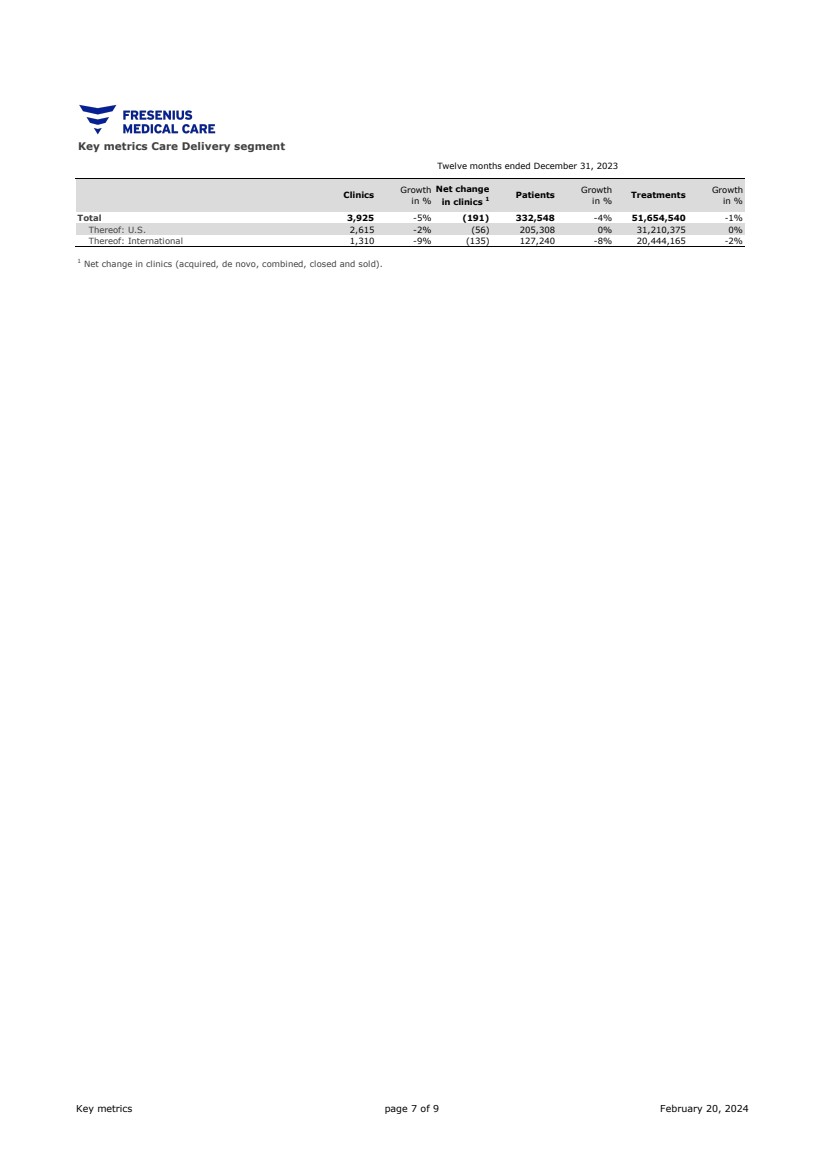
| Clinics Growth
in %
Net change
in clinics 1 Patients Growth
in % Treatments Growth
in %
Total 3,925 -5% (191) 332,548 -4% 51,654,540 -1%
Thereof: U.S. 2,615 -2% (56) 205,308 0% 31,210,375 0%
Thereof: International 1,310 -9% (135) 127,240 -8% 20,444,165 -2%
Key metrics Care Delivery segment
Twelve months ended December 31, 2023
1
Net change in clinics (acquired, de novo, combined, closed and sold).
Key metrics page 7 of 9 February 20, 2024 |
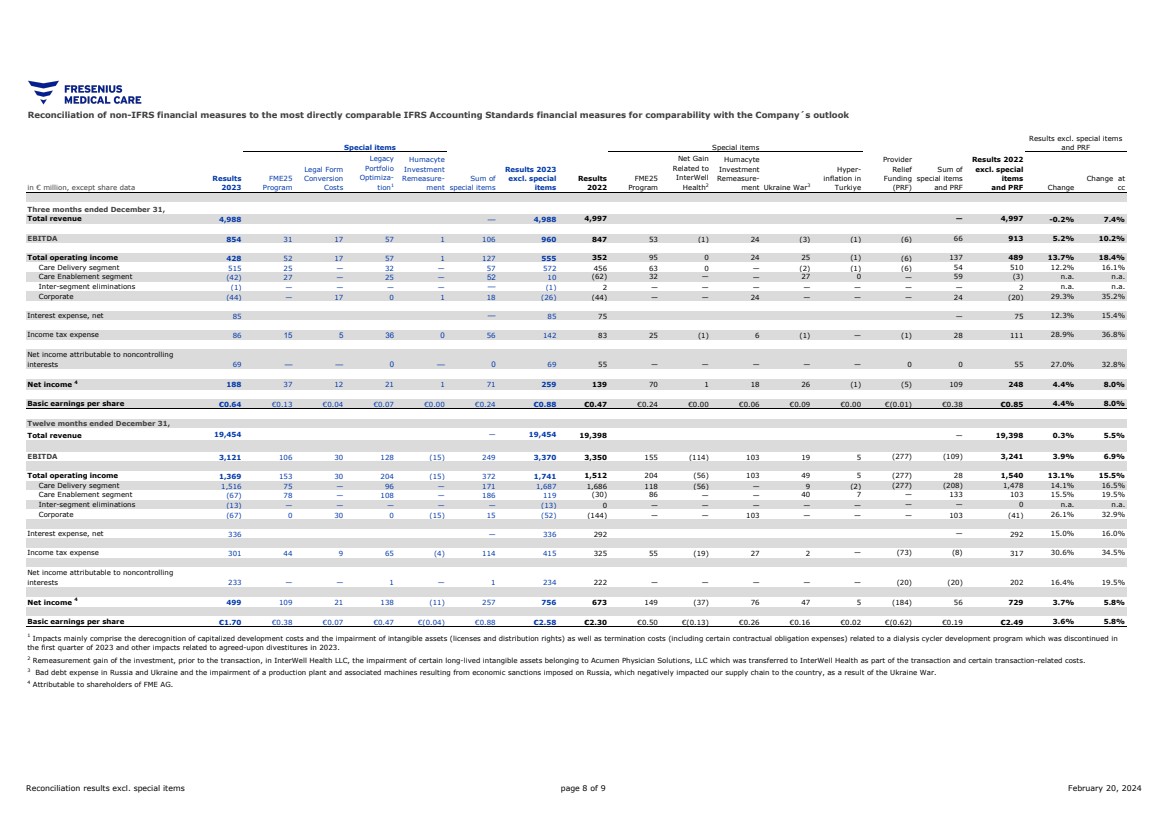
| in € million, except share data
Results
2023
FME25
Program
Legal Form
Conversion
Costs
Legacy
Portfolio
Optimiza-tion1
Humacyte
Investment
Remeasure-ment
Sum of
special items
Results 2023
excl. special
items
Results
2022
FME25
Program
Net Gain
Related to
InterWell
Health2
Humacyte
Investment
Remeasure-ment Ukraine War3
Hyper-inflation in
Turkiye
Provider
Relief
Funding
(PRF)
Sum of
special items
and PRF
Results 2022
excl. special
items
and PRF Change
Change at
cc
Three months ended December 31,
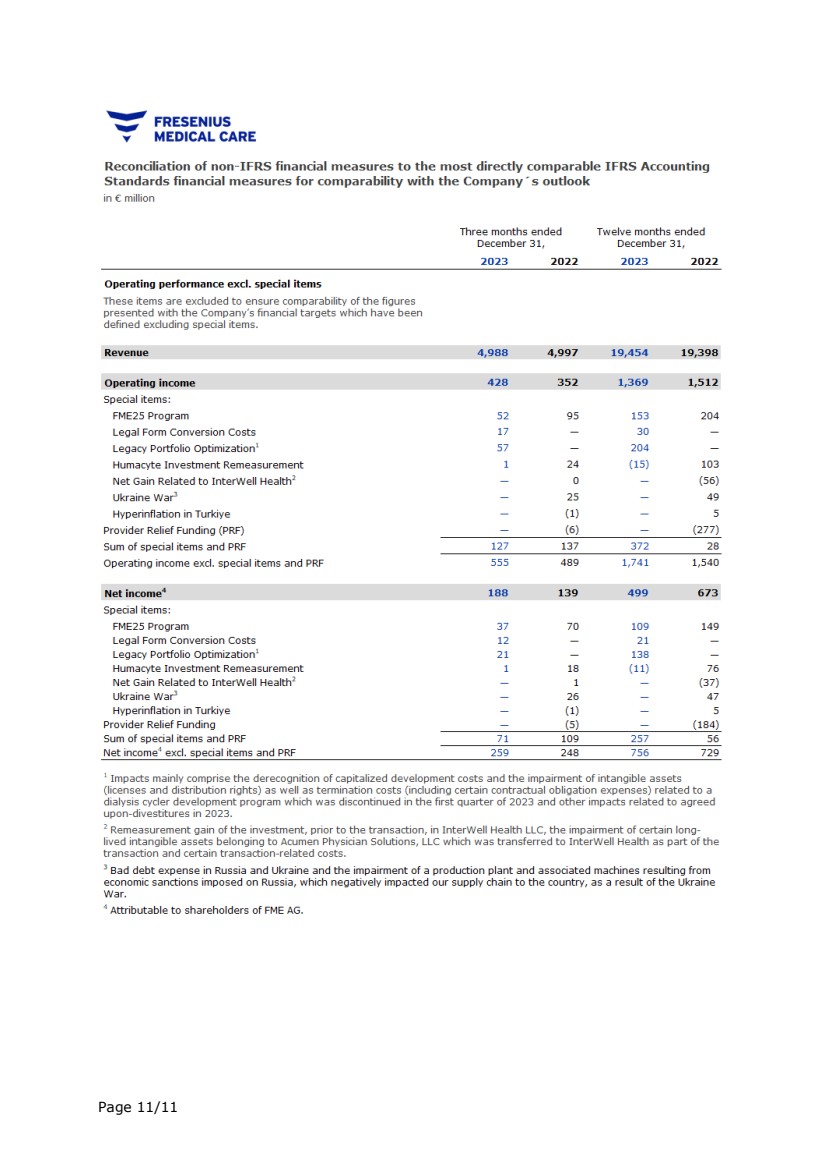
Total revenue 4,988 — 4,988 4,997 — 4,997 -0.2% 7.4%
EBITDA 854 31 17 57 1 106 960 847 53 (1) 24 (3) (1) (6) 66 913 5.2% 10.2%
Total operating income 428 52 17 57 1 127 555 352 95 0 24 25 (1) (6) 137 489 13.7% 18.4%
Care Delivery segment 515 25 — 32 — 57 572 456 63 0 — (2) (1) (6) 54 510 12.2% 16.1%
Care Enablement segment (42) 27 — 25 — 52 10 (62) 32 — — 27 0 — 59 (3) n.a. n.a.
Inter-segment eliminations (1) — — — — — (1) 2 — — — — — — — 2 n.a. n.a.
Corporate (44) — 17 0 1 18 (26) (44) — — 24 — — — 24 (20) 29.3% 35.2%
Interest expense, net 85 — 85 75 — 75 12.3% 15.4%
Income tax expense 86 15 5 36 0 56 142 83 25 (1) 6 (1) — (1) 28 111 28.9% 36.8%
Net income attributable to noncontrolling
interests 69 — — 0 — 0 69 55 — — — — — 0 0 55 27.0% 32.8%
Net income 4 188 37 12 21 1 71 259 139 70 1 18 26 (1) (5) 109 248 4.4% 8.0%
Basic earnings per share €0.64 €0.13 €0.04 €0.07 €0.00 €0.24 €0.88 €0.47 €0.24 €0.00 €0.06 €0.09 €0.00 €(0.01) €0.38 €0.85 4.4% 8.0%
Twelve months ended December 31,
Total revenue 19,454 — 19,454 19,398 — 19,398 0.3% 5.5%
EBITDA 3,121 106 30 128 (15) 249 3,370 3,350 155 (114) 103 19 5 (277) (109) 3,241 3.9% 6.9%
Total operating income 1,369 153 30 204 (15) 372 1,741 1,512 204 (56) 103 49 5 (277) 28 1,540 13.1% 15.5%
Care Delivery segment 1,516 75 — 96 — 171 1,687 1,686 118 (56) — 9 (2) (277) (208) 1,478 14.1% 16.5%
Care Enablement segment (67) 78 — 108 — 186 119 (30) 86 — — 40 7 — 133 103 15.5% 19.5%
Inter-segment eliminations (13) — — — — — (13) 0 — — — — — — — 0 n.a. n.a.
Corporate (67) 0 30 0 (15) 15 (52) (144) — — 103 — — — 103 (41) 26.1% 32.9%
Interest expense, net 336 — 336 292 — 292 15.0% 16.0%
Income tax expense 301 44 9 65 (4) 114 415 325 55 (19) 27 2 — (73) (8) 317 30.6% 34.5%
Net income attributable to noncontrolling
interests 233 — — 1 — 1 234 222 — — — — — (20) (20) 202 16.4% 19.5%
Net income 4 499 109 21 138 (11) 257 756 673 149 (37) 76 47 5 (184) 56 729 3.7% 5.8%
Basic earnings per share €1.70 €0.38 €0.07 €0.47 €(0.04) €0.88 €2.58 €2.30 €0.50 €(0.13) €0.26 €0.16 €0.02 €(0.62) €0.19 €2.49 3.6% 5.8%
2
Remeasurement gain of the investment, prior to the transaction, in InterWell Health LLC, the impairment of certain long-lived intangible assets belonging to Acumen Physician Solutions, LLC which was transferred to InterWell Health as part of the transaction and certain transaction-related costs.
3
Bad debt expense in Russia and Ukraine and the impairment of a production plant and associated machines resulting from economic sanctions imposed on Russia, which negatively impacted our supply chain to the country, as a result of the Ukraine War.
1
Impacts mainly comprise the derecognition of capitalized development costs and the impairment of intangible assets (licenses and distribution rights) as well as termination costs (including certain contractual obligation expenses) related to a dialysis cycler development program which was discontinued in
the first quarter of 2023 and other impacts related to agreed-upon divestitures in 2023.
4
Attributable to shareholders of FME AG.
Special items
Reconciliation of non-IFRS financial measures to the most directly comparable IFRS Accounting Standards financial measures for comparability with the Company´s outlook
Results excl. special items
Special items and PRF
Reconciliation results excl. special items page 8 of 9 February 20, 2024 |
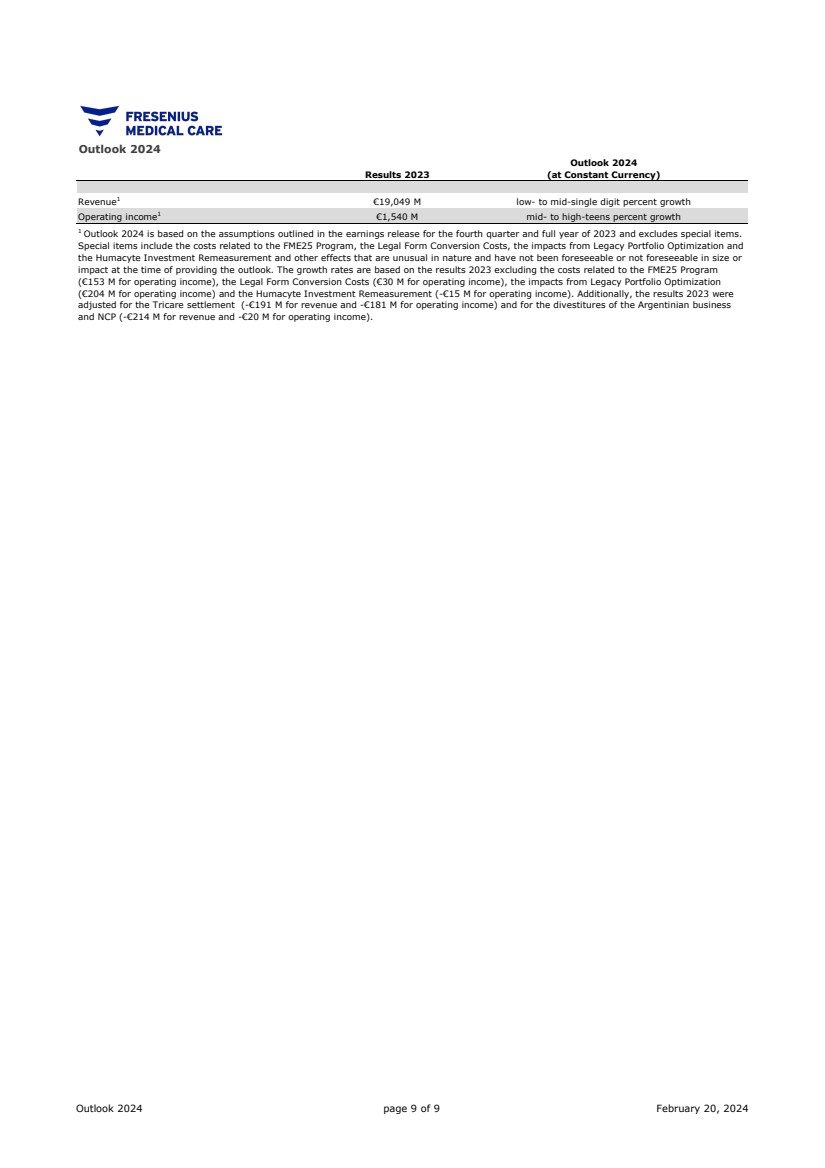
| Outlook 2024
Spalte1 Results 2023
Outlook 2024
(at Constant Currency)
Revenue1 €19,049 M low- to mid-single digit percent growth
Operating income1 €1,540 M mid- to high-teens percent growth
1 Outlook 2024 is based on the assumptions outlined in the earnings release for the fourth quarter and full year of 2023 and excludes special items.
Special items include the costs related to the FME25 Program, the Legal Form Conversion Costs, the impacts from Legacy Portfolio Optimization and
the Humacyte Investment Remeasurement and other effects that are unusual in nature and have not been foreseeable or not foreseeable in size or
impact at the time of providing the outlook. The growth rates are based on the results 2023 excluding the costs related to the FME25 Program
(€153 M for operating income), the Legal Form Conversion Costs (€30 M for operating income), the impacts from Legacy Portfolio Optimization
(€204 M for operating income) and the Humacyte Investment Remeasurement (-€15 M for operating income). Additionally, the results 2023 were
adjusted for the Tricare settlement (-€191 M for revenue and -€181 M for operating income) and for the divestitures of the Argentinian business
and NCP (-€214 M for revenue and -€20 M for operating income).
Outlook 2024 page 9 of 9 February 20, 2024 |
Fresenius Medical Care (NYSE:FMS)
Historical Stock Chart
From Apr 2024 to May 2024

Fresenius Medical Care (NYSE:FMS)
Historical Stock Chart
From May 2023 to May 2024
