BlackRock's Cash Engine Gets Boost, but Its Profit Falls --Update
July 19 2019 - 10:09AM
Dow Jones News
By Dawn Lim
BlackRock Inc.'s second-quarter profit fell about 7% as the
money-management giant faced increased competition and price
pressures.
A torrent of investor money and a rising U.S. stock market
helped lift BlackRock's assets to $6.8 trillion. Net inflows rose
more than sevenfold to more than $150 billion as the firm took a
surge of money into bond strategies, and its iShares
exchange-traded funds roughly doubled net inflows to over $36
billion.
The world's biggest money manager helped steer a revolution in
financial markets with exchange-traded funds that trade rapidly and
index funds that track markets cheaply. But BlackRock's results
show how in the hypercompetitive industry, an influx of assets
doesn't always translate to higher profits.
The prices of the most commonly offered strategies are falling
near zero. The rise and fall of markets can compound price
pressures for BlackRock.
As U.S. stocks rose, so did assets in cheaper products that
track those markets. Meanwhile a fall in other equity markets
outside the U.S. reduced assets -- and fees BlackRock could charge
-- on more lucrative strategies. That hurt its profits over the
quarter.
Chief Executive Laurence Fink is pushing to make BlackRock less
exposed to how investors direct their money and the ebb and flow of
markets. The firm is a financial superstore that provides
everything from bond-picking funds to workplace retirement products
and technology for Wall Street.
"I have to focus on what we can control," Mr. Fink said in an
interview. "And what we can control is the diversity of our
investment platform."
The firm earned $1 billion, or $6.41 a share, in the second
quarter on revenue of $3.5 billion. BlackRock earnings and revenue
fell from a year ago and missed analyst expectations.
In the latest quarter, investment advisory, administration fees,
and securities lending revenue fell by 1.4%. The firm said price
changes to some products and lower securities lending revenue also
offset the boost in assets.
Performance fees -- the money the firm gets for beating markets
in actively managed strategies -- fell about 30%.
Technology-services revenue rose 20%, reflecting higher revenue
from BlackRock's acquisition of French software firm eFront. The
transaction, the firm's largest acquisition by size in a decade,
adds to technology tools BlackRock offers financial institutions to
measure risk. Its technology business helps smooth any swings in
markets and gives it new reach across the technology infrastructure
that connects Wall Street.
Total net flows rose to $150.99 billion, up from $20 billion a
year earlier. Net flows are the difference between investor money
going into BlackRock and money leaving. The surge in new cash into
BlackRock comes after a 2018 slowdown of flows across major asset
managers raised investor concerns about whether asset management's
growth engines were sputtering.
As BlackRock sucks in more assets, its power to influence
markets and responsibility as a shareholder across myriad companies
could face more scrutiny from academics, investors and some
regulators.
"People question the scale," said Mr. Fink. "Scale also allows
us to provide lower fees and better outcomes for investors."
On the firm's scale, he added, "I don't see it as a liability.
It's giving us broader and deeper conversations with more
organizations."
The changes in BlackRock's asset mix reflected shifting investor
sentiment.
BlackRock had record second-quarter flows into bond strategies
as investors and financial institutions made bond bets as the
likelihood of an interest-rate cut increased. Others were hedging
against a possible downturn in stocks as many major indexes reached
records. Investors also surged into cash.
Net inflows into cash-management services increased more than
fourfold from the year ago period.
--Allison Prang contributed to this article.
Write to Dawn Lim at dawn.lim@wsj.com
(END) Dow Jones Newswires
July 19, 2019 09:54 ET (13:54 GMT)
Copyright (c) 2019 Dow Jones & Company, Inc.
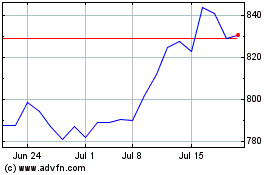
BlackRock (NYSE:BLK)
Historical Stock Chart
From Mar 2024 to Apr 2024

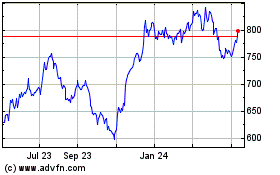
BlackRock (NYSE:BLK)
Historical Stock Chart
From Apr 2023 to Apr 2024
