BlackRock Reports First Net Outflow in Three Years --2nd Update
October 16 2018 - 11:49AM
Dow Jones News
By Dawn Lim and Allison Prang
Investors pulled cash from BlackRock Inc. for the first time in
three years, the latest sign of investor unease about the direction
of global markets.
The world's largest money manager said Tuesday that clients
withdrew a net $3.1 billion during the third quarter. That is
BlackRock's first quarterly outflow since the second quarter of
2015. It took in a net $96.1 billion in the third quarter of last
year.
The pullback was more evident on Wall Street than Main Street,
with the biggest client withdrawals coming from large institutions
instead of retail investors. Institutions pulled $30.8 billion from
BlackRock's index equity funds in the quarter.
"We're seeing more and more clients just pausing," BlackRock
Chief Executive Laurence Fink said in an interview, "and trying to
get their long-term views recalibrated."
The withdrawals could portend more trouble for other asset
managers that are already wrestling with slowing demand for Wall
Street's most popular investment products, a pricing war and
investor anxiety about everything from rising interest rates to
trade tensions.
Net inflows into all U.S. mutual funds and exchange-traded funds
fell 46% in the first three quarters of 2018 compared with the
year-ago period, according to data tracked by Morningstar.
Even cheaper funds that mimic indexes -- the most popular
investment product of the past decade -- are experiencing reduced
interest. Indexing pioneer Vanguard Group collected $62.6 billion
in net inflows in the third quarter of 2018 but that was down from
$76.9 billion a year ago.
BlackRock was one of the biggest beneficiaries of the decadelong
industry shift to low cost, passively managed investments. But that
part of its business is slowing, as well. Net flows into its index
mutual funds and iShares exchange-traded funds were $11.7 billion
during the third quarter, compared with the net flows of $70
billion a year ago.
What hurt BlackRock most in the third quarter were the actions
of its institutional investors, who pulled a net of $30.85 billion
from non-ETF equity index funds. Mr. Fink attributed that to
"ongoing divergent monetary policy and geopolitical
uncertainty."
The outflows include changes in funds held in cash management
accounts. One corporate client pulled about $23.5 billion from an
cash management account set aside for uses such as merger and
acquisitions, said a person familiar with the matter.
The discussion of outflows came on a day when the company
reported third-quarter earnings of $1.22 billion, up 29% from the
comparable quarter a year ago. Earnings per share came in at $7.54,
up from $5.76.
BlackRock's revenue rose 1.9% to $3.58 billion, which fell below
what analysts were anticipating. Revenue from investment-advisory
performance fees and distribution fees declined, but revenue from
technology services -- which includes BlackRock's Aladdin risk and
portfolio management tools -- climbed.
BlackRock had $6.44 trillion assets under management in the
quarter that finished in September, up 2.3% from the second quarter
of this year.
Shares fell 4.3% in mid morning trading Tuesday. Thus far in
2018, BlackRock shares have fallen about 20%.
There were signs in the third quarter that BlackRock is having
success reaching into new areas to offset volatility in earnings
and expand the strategies it provides to investors. Technology
services revenue rose to $200 million in the latest quarter, up
from $169 million, thanks to Aladdin tools that are used by
financial institutions to assess risk.
It also is making a push into the world of private equity, real
estate and infrastructure and alternative strategies, which
represent 2% of its total assets. The firm said it raised $4
billion in new commitments for alternative investments and put $2
billion to work into deals. Some of that new money included $1.5
billion raised so far for a fund run by an energy infrastructure
group BlackRock bought in 2017.
Write to Dawn Lim at dawn.lim@wsj.com and Allison Prang at
allison.prang@wsj.com
(END) Dow Jones Newswires
October 16, 2018 11:34 ET (15:34 GMT)
Copyright (c) 2018 Dow Jones & Company, Inc.
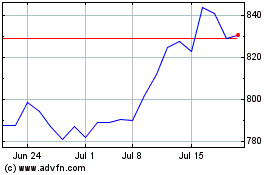
BlackRock (NYSE:BLK)
Historical Stock Chart
From Mar 2024 to Apr 2024

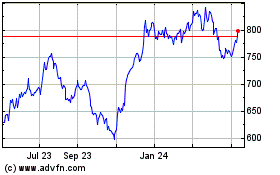
BlackRock (NYSE:BLK)
Historical Stock Chart
From Apr 2023 to Apr 2024
