Highlights and Recent Developments
- Emphasis on Streamlining Operations and
Rebuilding Infrastructure
- Investing in Technology and New
Products for Growth
- Q1 Total Revenues $2.4 million; 4.8%
reduction from Q1 2016
- Q1 Total Expenses $2.3 million, a
decrease of 22.6% from Q1 2016
- Q1 Income $58,000 versus a net loss of
$501,000 for Q1 2016
- Stockholder’s Equity $3.1 million at
March 31, 2017
- Total Client Assets $7.3 Billion at
March 31, 2017
Siebert Financial Corp. (NASDAQ:SIEB) announced financial
results for the first quarter ending March 31, 2017.
Gloria E. Gebbia, majority shareholder and board member of
Siebert Financial said, “We are pleased with our first quarter
results as we focus on streamlining operations and rebuilding our
infrastructure. Siebert founder Muriel ‘Mickie’ Siebert was a
visionary who built a great business. This is a wonderful
enterprise, and we are committed to serving our clients’ financial
needs with superior customer service and product development to
help them achieve their wealth management objectives.”
Immediately following the change in ownership in December 2016,
under the direction of our strong management team and Andrew Reich,
we began to execute the strategic plan of the Company’s business
including streamlining the firm’s operations, rebuilding the firm’s
technologic infrastructure to prepare for growth, moving the firm’s
call center and adjusting the firm’s cost structure. The results of
these efforts were reported in the Company’s Form 10-Q for the
first quarter of 2017. “We are proud of those results and our being
profitable in the first quarter of 2017,” added Gloria Gebbia.
For additional information, please refer to our Quarterly Report
on Form 10-Q for the period ended March 31, 2017 filed with the SEC
on May 12, 2017. You may also access the Form 10-Q through our
website.
About Siebert Financial Corp.
Siebert Financial is a holding company that conducts its retail
discount brokerage business through its wholly-owned subsidiary,
Muriel Siebert & Co., Inc. The firm became a member of the NYSE
in 1967, when Ms. Siebert became the first woman to own a seat on
the Exchange. In addition, in 2014 the Company began business as a
registered investment advisor through a wholly-owned subsidiary,
Siebert Investment Advisors, Inc. Siebert Financial is based in New
York City with additional retail branches in Boca Raton, FL and
Jersey City, NJ.www.siebertnet.com
Cautionary note regarding forward-looking statements
Statements in this press release that are not statements of
historical or current fact constitute “forward looking statements”
within the meaning of the Private Securities Litigation Reform Act
of 1995. Such forward looking statements involve risks and
uncertainties and known and unknown factors that could cause the
actual results of the Siebert Financial Corp. (the “Company”) to be
materially different from historical results or from any future
results expressed or implied by such forward looking statements,
including without limitation: changes in general economic and
market conditions; changes and prospects for changes in interest
rates; fluctuations in volume and prices of securities; changes in
demand for brokerage services; competition within and without the
brokerage business, including the offer of broader services;
competition from electronic discount brokerage firms offering
greater discounts on commissions than the Company; the prevalence
of a flat fee environment; limited trading opportunities; the
method of placing trades by the Company’s customers; computer and
telephone system failures; the level of spending by the Company on
advertising and promotion; trading errors and the possibility of
losses from customer non-payment of amounts due; other increases in
expenses and changes in net capital or other regulatory
requirements. As a result of these and other factors, the Company
may experience material fluctuations in its operating results on a
quarterly or annual basis, which could materially and adversely
affect its business, financial condition, operating results, and
stock price, as well as other risks detailed in the Company’s
filings with the Securities and Exchange Commission (“SEC”).
Accordingly, investors are cautioned not to place undue reliance on
any such “forward-looking statements. The Company undertakes no
obligation to update the information contained herein or to
publicly announce the result of any revisions to such
“forward-looking statements” to reflect future events or
developments. An investment in the Company involves various risks,
including those mentioned above and those, which are detailed from
time to time in the Company’s SEC filings, copies of which may be
obtained from the Company or through the SEC’s website.
Notice to Investors
This communication is provided for informational purposes only
and is neither an offer to sell nor a solicitation of an offer to
buy any securities in the United States or elsewhere.
Item 1. Financial Statements.
Siebert Financial Corp. &
Subsidiaries
Consolidated Statements of Financial Condition (Unaudited) - USD
($) Mar. 31, 2017 Dec. 31, 2016
ASSETS Cash and cash
equivalents $ 2,047,000 $ 2,730,000 Receivable from brokers 733,000
606,000 Securities owned, at fair value 0 92,000 Furniture,
equipment and leasehold improvements, net 215,000 46,000 Prepaid
expenses and other assets 403,000 342,000
3,398,000 3,816,000
Liabilities:
Accounts payable and accrued liabilities 284,000 738,000 Accrued
settlement liability 0 825,000
284,000 1,563,000 Commitments and
contingent liabilities
Stockholders' equity: Common stock,
$.01 par value; 49,000,000 shares authorized, 22,085,126 shares
issued and outstanding as of March 31, 2017 and 22,085,126 shares
issued and outstanding as of December 31, 2016 221,000 221,000
Additional paid-in capital 7,692,000 6,889,000 (Accumulated
deficit) (4,799,000 ) (4,857,000 )
3,114,000 2,253,000
$ 3,398,000 $ 3,816,000
See notes to condensed consolidated financial
statements.
Consolidated Statements of Operations (Unaudited)
- USD ($) 3 Months Ended Mar. 31, 2017 Mar. 31,
2016
Revenues: Commissions and fees $
1,183,000 $ 1,210,000 Margin interest, marketing and distribution
fees 1,080,000 868,000 Investment banking 5,000 12,000 Trading
profits 109,000 265,000 Interest and dividends 2,000
143,000
2,379,000 2,498,000
Expenses: Employee compensation and benefits 1,039,000
1,287,000 Clearing fees, including floor brokerage 263,000 238,000
Professional fees 425,000 670,000 Advertising and promotion 20,000
66,000 Communications 80,000 130,000 Occupancy 142,000 182,000
Other general and administrative 352,000
426,000
2,321,000 2,999,000
Net income (loss)
$ 58,000 $ (501,000 )
Net income loss per share of common
stock
Continuing operations
$
.00
$
(.02
)
Basic and diluted
$
.00
$
(.02
)
Weighted average shares outstanding
Basic
22,085,126 22,085,126
Diluted
22,085,126 22,085,126
See notes to condensed consolidated financial
statements.
Consolidated Statements of Cash
Flows (Unaudited) - USD ($) 3 Months Ended Mar. 31, 2017
Mar. 31, 2016
Cash flows from operating activities:
Net income (loss)
$ 58,000 $ (501,000 )
Adjustments to reconcile net income
(loss) to net cash used in operating activities:
Depreciation and amortization 46,000 68,000 Interest accrued on
note receivable from business sold to former affiliate 0 (140,000 )
Changes in: Securities owned, at fair value 92,000 (84,000 )
Advance to former affiliate 0 (82,000 ) Receivable from brokers
(127,000 ) 101,000 Prepaid expenses and other assets (61,000 )
(12,000 ) Accounts payable and accrued liabilities (476,000
) (606,000 ) Net cash used in operating
activities (468,000 ) (1,256,000 )
Cash flows from investing activities: Purchase of furniture,
equipment and leasehold improvements (215,000 ) (18,000 )
Collection of receivable from former affiliate 0
493,000 Net cash (used in) provided by
investing activities (215,000 ) 475,000 Net decrease in cash and
cash equivalents (683,000 ) (781,000 ) Cash and cash equivalents -
beginning of period 2,730,000
9,420,000 Cash and cash equivalents - end of period
$
2,047,000 $ 8,639,000
Supplemental Schedule Of Non-Cash
Financing Activities:
Payment by parent of expenses
$
803,000
—
See notes to condensed consolidated financial
statements.
View source
version on businesswire.com: http://www.businesswire.com/news/home/20170515006592/en/
Investors:Siebert Financial Corp.Yesenia Berdugo,
212-644-2435Office of the AdministratororMedia:LHK
Communications LLCLaura Hynes-Keller,
212-758-8602laurahk@lhkcommunications.com
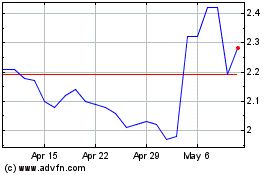
Siebert Financial (NASDAQ:SIEB)
Historical Stock Chart
From Mar 2024 to Apr 2024

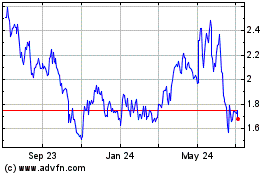
Siebert Financial (NASDAQ:SIEB)
Historical Stock Chart
From Apr 2023 to Apr 2024
