SAP SE 3Q 2016 -- Forecast
October 18 2016 - 7:53AM
Dow Jones News
FRANKFURT--The following is a summary of analysts' forecasts for
SAP SE (SAP) third-quarter results, based on a poll of 13 analysts
conducted by Dow Jones Newswires (figures in million euros, EPS,
dividend and target price in euro, according to IFRS). Earnings
figures are based on Non-IFRS and scheduled to be released October
21.
===
                           Revenue            Revenue
                    Total    C & S  Software      CSS
3rd Quarter       revenue      (a)  licenses      (b)
AVERAGE             5,312    4,433     1,013      781
Prev. Year          4,987    4,124     1,015      600
+/- in %             +6.5     +7.5      -0.2      +30

MEDIAN              5,318    4,441     1,013      782
Maximum             5,399    4,493     1,066      794
Minimum             5,092    4,272       913      750
Amount                 12       12        12       13

Baader-Helvea       5,373    4,493     1,066      780
Barclays            5,399       --     1,053      782
Bernstein           5,379    4,476     1,034      792
Bryan Garnier       5,287    4,406     1,009      787
Commerzbank            --    4,481     1,041      783
DZ Bank             5,302    4,430     1,000      780
Haitong Securities  5,092    4,272       913      750
HSBC                5,349    4,468     1,004      794
LBBW                5,323    4,447     1,045      780
Morgan Stanley      5,370    4,483     1,016      791
Pacific Crest       5,309    4,429       970      774
UBS                 5,252    4,376        --      770
Warburg Research    5,313    4,435     1,000      794

                                Net
                Operating   attrib.
3rd Quarter        profit    profit     EPS
AVERAGE             1,689     1,174    0.99
Prev. Year          1,616     1,176    0.98
+/- in %             +4.5      -0.2    +0.9

MEDIAN              1,691     1,199    1.00
Maximum             1,829     1,241    1.09
Minimum             1,562     1,046    0.87
Amount                 13         9      12

Baader-Helvea       1,691        --    1.00
Barclays            1,829        --    1.09
Bernstein           1,692     1,108    0.92
Bryan Garnier       1,711     1,211    0.99
Commerzbank         1,646        --      --
DZ Bank             1,683     1,200    1.00
Haitong Securities  1,562     1,046    0.87
HSBC                1,699     1,223    1.02
LBBW                1,744     1,199    1.00
Morgan Stanley      1,758     1,241    1.03
Pacific Crest       1,634     1,162    0.97
UBS                 1,670     1,176    0.98
Warburg Research    1,639        --    0.99


             Target price  Rating                 DPS 2016
AVERAGE             90.88  positive 9     AVERAGE     1.24
Prev. Quarter       81.83  neutral  0     Prev. Year  1.15
+/- in %              +11  negative 0     +/- in %    +7.8

MEDIAN              91.50                 MEDIAN      1.22
Maximum             95.00                 Maximum     1.40
Minimum             85.00                 Minimum     1.15
Amount                  8                 Amount         5

Baader-Helvea       85.00  Buy                          --
Barclays            95.00  Overweight                 1.22
Commerzbank         95.00  Buy                        1.26
DZ Bank                --  Buy                        1.17
HSBC                93.00  Buy                          --
JP Morgan           95.00  Overweight                   --
Morgan Stanley      88.00  Overweight                   --
UBS                 90.00  Buy                        1.15
Warburg Research    86.00  Buy                        1.40
===
Year-earlier figures are as reported by the company.
(a) Cloud & Software
(b) Cloud-subscriptions and -support
DJG/voi
(END) Dow Jones Newswires
October 18, 2016 07:38 ET (11:38 GMT)
Copyright (c) 2016 Dow Jones & Company, Inc.
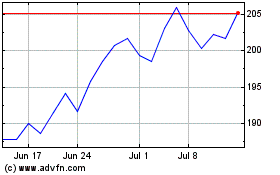
SAP (NYSE:SAP)
Historical Stock Chart
From Aug 2024 to Sep 2024

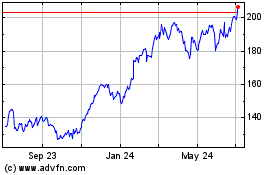
SAP (NYSE:SAP)
Historical Stock Chart
From Sep 2023 to Sep 2024
