UNITED STATES
SECURITIES
AND EXCHANGE COMMISSION
WASHINGTON,
DC 20549
FORM 8-K
CURRENT REPORT PURSUANT TO
SECTION
13 OR 15(d) OF THE
SECURITIES
EXCHANGE ACT OF 1934
Date of
Report:
November
5, 2015
(Date
of earliest event reported)
Glu Mobile Inc.
(Exact
Name of Registrant as Specified in Its Charter)
Delaware
(State or Other Jurisdiction of Incorporation)
|
001-33368
|
|
91-2143667
|
|
(Commission File Number)
|
|
(IRS Employer Identification No.)
|
|
500 Howard Street, Suite 300
San Francisco, California
|
|
94105
|
|
(Address of Principal Executive Offices)
|
|
(Zip Code)
|
(415) 800-6100
(Registrant’s Telephone Number, Including Area
Code)
Not Applicable
(Former name or former address, if changed
since last report.)
Check the appropriate box below if the Form 8-K filing is intended to
simultaneously satisfy the filing obligation of the registrant under any
of the following provisions (see General Instruction A.2. below):
⃞
Written
communications pursuant to Rule 425 under the Securities Act (17 CFR
230.425)
⃞
Soliciting
material pursuant to Rule 14a-12 under the Exchange Act (17 CFR
240.14a-12)
⃞
Pre-commencement
communications pursuant to Rule 14d-2(b) under the Exchange Act (17 CFR
240.14d-2(b))
⃞
Pre-commencement
communications pursuant to Rule 13e-4(c) under the Exchange Act (17 CFR
240.13e-4(c))
Item 2.02 Results of Operations and Financial Condition.
On November 5, 2015, Glu Mobile Inc. (“Glu”) issued
a press release announcing its financial results for the third quarter
and nine months ended September 30, 2015. A copy of the press release is
attached as Exhibit 99.01 to this report. In addition, on November 5,
2015, Glu made available on its corporate website at
www.glu.com/investors supplemental slides that were referenced during
Glu’s earnings call to discuss its financial results for the third
quarter and nine months ended September 30, 2015. A copy of such
supplemental slides is attached as Exhibit 99.02 to this report.
The information in this Item 2.02, including Exhibits 99.01 and 99.02 to
this report, shall not be deemed to be “filed” for purposes of Section
18 of the Securities Exchange Act of 1934, as amended, or otherwise
subject to the liabilities of that section or Sections 11 and 12(a)(2)
of the Securities Act of 1933, as amended. The information contained in
this Item 2.02 and in the accompanying Exhibits 99.01 and 99.02 shall
not be incorporated by reference into any registration statement or
other document filed by Glu with the Securities and Exchange Commission,
whether made before or after the date of this report, regardless of any
general incorporation language in such filing (or any reference to this
Current Report on Form 8-K generally), except as shall be expressly set
forth by specific reference in such filing.
Item 9.01 Financial Statements and Exhibits.
(d) Exhibits.
99.01 Press release issued by Glu regarding its financial results
for the third quarter and nine months ended September 30, 2015, dated
November 5, 2015
99.02 Supplemental slides made available by Glu on its corporate
website on November 5, 2015
SIGNATURES
Pursuant to the requirements of the Securities Exchange Act of 1934, the
registrant has duly caused this report to be signed on its behalf by the
undersigned hereunto duly authorized.
|
|
|
|
|
Glu Mobile Inc.
|
|
|
|
|
|
|
|
|
|
|
|
|
|
|
|
|
Date:
|
November 5, 2015
|
|
By:
|
/s/ Scott J. Leichtner
|
|
|
|
|
|
Name: Scott J. Leichtner
|
|
|
|
|
|
Title: Vice President and General Counsel
|
|
Exhibit 99.01
Glu
Reports Third Quarter 2015 Financial Results
-
Q3
non-GAAP revenue of $64.4 million and Q3 GAAP revenue of $63.3 million
-
Q3
Adjusted EBITDA of $8.5 million
-
Partnership
struck to bring Tencent’s chart-topping shooter game, WeFire, to North
and South America, EMEA, Australia and New Zealand in 2016
-
Over 1
billion total social following of celebrities with whom the company
has exclusive partnerships; titles featuring these celebrities
expected live by end of 2017 *
-
Hired
Electronic Arts and Kabam veteran, Nick Earl, as the President of
Global Studios.
SAN FRANCISCO--(BUSINESS WIRE)--November 5, 2015--Glu Mobile Inc.
(NASDAQ:GLUU), a leading global developer and publisher of free-to-play
games for smartphone and tablet devices, today announced financial
results for its third quarter ended September 30, 2015.
“We were satisfied with our financial results in the third quarter,
including our ability to exceed revenue and EBITDA expectations,” stated
Niccolo de Masi, Chairman and Chief Executive Officer of Glu. “During
the quarter, our results were driven by the ongoing strength of our
catalog as well as the continued outperformance of our Cooking Dash
game.”
de Masi continued, “The supermajority of titles launched in 2015 have
underperformed as solid monetization rates were offset by significantly
lower-than-expected install volumes. We have strengthened our studio
with the hiring of a new CTO and President of Studios, as well as Board
with the appointment of Greg Brandeau. We remain on the lookout for
accretive and strategic uses of our strong balance sheet.”
de Masi concluded, “We believe Glu is well positioned given the
potential promotional power of our exclusive, multi-year celebrity
gaming partnerships. We are proud to announce that Glu has now signed
partnerships with celebrities who in turn have over 1 billion* social
followers. We are similarly pleased with the opportunity to bring
Tencent’s chart-topping shooter WeFire to new territories where Glu has
a strong publishing operation.”
Third Quarter 2015 Financial Highlights:
-
Revenue: Total GAAP revenue was $63.3 million in the third
quarter of 2015 compared to $64.8 million in the third quarter of
2014. Total non-GAAP revenue was $64.4 million in the third quarter of
2015, compared to $83.6 million in the third quarter of 2014. Non-GAAP
revenue excludes changes in deferred revenue and litigation settlement
proceeds.
-
Gross Margin: GAAP gross margin was 53% in the third quarter of
2015 compared to 58% in the third quarter of 2014. Non-GAAP gross
margin was 59% in the third quarter of 2015 compared to 60% in the
third quarter of 2014. Non-GAAP gross margin excludes changes in
deferred revenue and litigation settlement proceeds, change in
deferred cost of revenue, amortization of intangible assets and
non-cash warrant expense.
-
GAAP Operating Income/(Loss): GAAP operating income was
$389,000 in the third quarter of 2015 compared to a loss of $(106,000)
in the third quarter of 2014.
-
Non-GAAP Operating Income: Non-GAAP operating income was $7.7
million in the third quarter of 2015 compared to $14.8 million during
the third quarter of 2014. Non-GAAP operating income excludes changes
in deferred revenue and deferred cost of revenue, amortization of
intangible assets, non-cash warrant expense, stock-based compensation
expense, restructuring charges, change in fair value of the Blammo
earnout, transitional costs and litigation costs and settlement
proceeds.
-
Adjusted EBITDA: Adjusted EBITDA was $8.5 million for the third
quarter of 2015, compared to $15.4 million during the third quarter of
2014. Adjusted EBITDA is defined as non-GAAP operating income
excluding depreciation.
-
GAAP Net Income and EPS: GAAP net income was $158,000 for the
third quarter of 2015 compared to $10.4 million for the third quarter
of 2014. GAAP diluted EPS was approximately breakeven for the third
quarter of 2015, based on 131.5 million weighted-average diluted
shares outstanding, compared to a GAAP diluted EPS of $0.10 for the
third quarter of 2014, based on 105.4 million diluted weighted-average
shares outstanding.
-
Non-GAAP Net Income and EPS: Non-GAAP net income was $7.7
million for the third quarter of 2015 compared to $17.3 million for
the third quarter of 2014. Non-GAAP diluted EPS was $0.06 for the
third quarter of 2015 based on 131.5 million weighted-average diluted
shares outstanding, compared to non-GAAP diluted EPS of $0.16 for the
third quarter of 2014 based on 105.4 million weighted-average diluted
shares outstanding.
-
Cash and Cash Flows: As of September 30, 2015, Glu had cash and
cash equivalents of $182.3 million compared to $189.7 million at the
end of the prior quarter. The company continues to have no debt. Cash
flows used in operations were $(7.8) million for the third quarter of
2015 compared to $2.5 million cash generated from operations for the
third quarter of 2014.
A reconciliation of GAAP to non-GAAP results has been provided in the
financial statement tables included in this press release. An
explanation of these measures is also included below under the heading
“Use of Non-GAAP Financial Measures.”
Recent Developments and Strategic Initiatives:
-
Today we announced the hiring of new President of Studios, Nick Earl.
Nick is a seasoned gaming veteran, having most recently held senior
studio roles at Electronic Arts and Kabam.
-
Today we announced a partnership to bring Tencent’s chart-topping
shooter game, WeFire, to North and South America, EMEA, Australia and
New Zealand.
-
Announced today that we have signed exclusive partnerships with
celebrities totaling over one billion social followers whose games
will be live by the end of 2017*.
-
In October, Tim Wilson joined Glu as Global Chief Technology Officer,
bringing to the company a strong background in global technology and
engineering leadership acquired through his extensive career in
gaming, including serving in multiple CTO positions at Electronic Arts.
-
In September, we announced the availability of Deer Hunter 2016 as
well as Deer Hunter VR, the company’s first title developed
exclusively for Oculus.
-
In September, Greg Brandeau, former CTO of Walt Disney Animation
Studios and former SVP of Technology for Pixar Animation Studios,
joined Glu’s Board of Directors.
“The ongoing traction with our catalog titles resulted in a
better-than-expected third quarter,” stated Eric R. Ludwig, Chief
Operating Officer and Chief Financial Officer. “We are confident that
the combination of our long-term strategy and strong balance sheet,
positions us well to scale Glu to the next level and generate greater
shareholder value over time.”
Business Outlook as of November 5, 2015:
The following forward-looking statements reflect expectations as of
November 5, 2015. Results may be materially different and are affected
by many factors, such as: consumer demand for mobile entertainment and
specifically Glu’s products; consumer demand for smartphones, tablets
and next-generation platforms; our ability to improve the monetization
of our titles and continue to successfully launch and update new games;
development delays on Glu's products; continued uncertainty in the
global economic environment; competition in the industry; storefront
featuring; changes in foreign exchange rates; Glu's effective tax rate
and other factors detailed in this release and in Glu's SEC filings.
Fourth Quarter Expectations – Quarter Ending December 31, 2015:
-
Non-GAAP revenue is expected to be between $50.0 million and $52.0
million.
-
Non-GAAP gross margin is expected to be approximately 62.7%.
-
Non-GAAP operating expenses are expected to be between $35.1 million
and $35.3 million.
-
Adjusted EBITDA, defined as non-GAAP operating income/(loss) excluding
depreciation of approximately $0.7 million, is expected to range from
a loss of $(2.0) million to $(3.0) million.
-
Income tax is expected to be an expense of approximately $0.2 million.
-
Non-GAAP net income/(loss) is expected to be between $(2.9) million
and ($3.9) million, or between $(0.02) and $(0.03) per
weighted-average basic share outstanding, which excludes approximately
$3.5 million of anticipated stock-based compensation expense and $2.3
million for amortization of intangibles.
-
Weighted-average common shares outstanding are expected to be
approximately 128.0 million basic and 129.3 million diluted.
2015 Expectations – Full Year Ending December 31, 2015:
-
Non-GAAP revenue is expected to be between $234.3 million and $236.3
million.
-
Non-GAAP gross margin is expected to be approximately 61.5%.
-
Adjusted EBITDA is expected to range from $11.0 million to $12.0
million.
-
Non-GAAP net income is expected to be between $7.6 million and $8.6
million, or between $0.06 and $0.07 per weighted-average diluted share
outstanding, which excludes approximately $11.7 million of anticipated
stock-based compensation expense, $9.7 million for amortization of
intangibles and the proceeds from the settlement of the Hothead Games
litigation, net of costs incurred.
-
Weighted-average common shares outstanding are expected to be
approximately 118.8 million basic and 122.8 million diluted.
-
We expect to have cash and short-term investments at December 31, 2015
of at least $170.0 million with no debt.
Quarterly Conference Call
Glu will discuss its quarterly results via teleconference today at 1:30
p.m. Pacific Time (4:30 p.m. Eastern Time). Please dial (866) 582-8907,
or if outside the U.S., (760) 298-5046, with conference ID # 50395369 to
access the conference call at least five minutes prior to the 1:30 p.m.
Pacific Time start time. A live webcast and replay of the call will also
be available on the investor relations portion of the company's website
at www.glu.com/investors. An audio replay will be available
between 4:30 p.m. Pacific Time, November 5, 2015, and 8:59 p.m. Pacific
Time, November 12, 2015, by calling (855) 859-2056, or (404) 537-3406,
with conference ID # 50395369.
Disclosure Using Social Media Channels and Calculation of Social
Followers
Glu currently announces material information to its investors using SEC
filings, press releases, public conference calls and webcasts. Glu uses
these channels as well as social media channels to announce information
about the company, games, employees and other issues. Given SEC guidance
regarding the use of social media channels to announce material
information to investors, Glu is notifying investors, the media, its
players and others interested in the company that in the future, it
might choose to communicate material information via social media
channels or, it is possible that information it discloses through social
media channels may be deemed to be material. Therefore, Glu encourages
investors, the media, players and others interested in Glu to review the
information posted on the company forum (http://ggnbb.glu.com/forum.php)
and the company Facebook site (https://www.facebook.com/glumobile),
the company twitter account (https://twitter.com/glumobile) and
Mr. de Masi’s twitter account (https://twitter.com/niccolodemasi). Investors,
the media, players or other interested parties can subscribe to the
company blog and twitter feed and Mr. de Masi’s twitter feed at the
addresses listed above. Any updates to the list of social media channels
Glu will use to announce material information will be posted on the
Investor Relations page of the company's website at www.glu.com/investors.
*Glu calculates the aggregate number of social followers of a particular
celebrity licensor by adding the total followers on Facebook, Twitter,
Instagram, Vevo and Vine for such celebrity. There is fan overlap among
these social channels and among Glu’s various celebrity licensors, and
such aggregate numbers have not been deduplicated.
The more than 1 billion total social followers supporting celebrity
titles that Glu expects to be live by the end of 2017 is based on the
combined Facebook, Twitter, Instagram, Vevo, and Vine audiences of Katy
Perry, Kim Kardashian West, Kendall and Kylie Jenner, Britney Spears,
Nicki Minaj, Jason Statham and additional yet-to-be announced
celebrities as of September 30, 2015.
Use of Non-GAAP Financial Measures
To supplement Glu's unaudited condensed consolidated financial data
presented in accordance with GAAP, Glu uses certain non-GAAP measures of
financial performance. The presentation of these non-GAAP financial
measures is not intended to be considered in isolation from, as a
substitute for, or superior to, the financial information prepared and
presented in accordance with GAAP, and may be different from non-GAAP
financial measures used by other companies. In addition, these non-GAAP
measures have limitations in that they do not reflect all of the amounts
associated with Glu's results of operations as determined in accordance
with GAAP. The non-GAAP financial measures used by Glu include
historical and estimated non-GAAP revenue, non-GAAP smartphone revenue,
non-GAAP cost of revenue, non-GAAP operating expenses, non-GAAP gross
profit, non-GAAP gross margin, non-GAAP operating income/(loss),
non-GAAP net income/(loss) and non-GAAP basic and diluted net
income/(loss) per share. These non-GAAP financial measures exclude the
following items from Glu's unaudited consolidated statements of
operations:
-
Change in deferred revenue and deferred cost of revenue;
-
Amortization of intangible assets;
-
Non-cash warrant expense;
-
Stock-based compensation expense;
-
Restructuring charges;
-
Change in fair value of Blammo earnout;
-
Litigation settlement proceeds and costs;
-
Transitional costs;
-
Release of tax liabilities and valuation allowance; and
-
Foreign currency exchange gains and losses primarily related to the
revaluation of assets and liabilities.
In addition, Glu has included in this release “Adjusted EBITDA” figures
which are used to evaluate Glu’s operating performance. Adjusted EBITDA
is defined as non-GAAP operating income/(loss) excluding depreciation.
Adjusted EBITDA margin is defined as Adjusted EBITDA divided by non-GAAP
revenue.
Glu may consider whether significant non-recurring items that arise in
the future should also be excluded in calculating the non-GAAP financial
measures it uses.
Glu believes that these non-GAAP financial measures, when taken together
with the corresponding GAAP financial measures, provide meaningful
supplemental information regarding Glu's performance by excluding
certain items that may not be indicative of Glu's core business,
operating results or future outlook. Glu's management uses, and believes
that investors benefit from referring to, these non-GAAP financial
measures in assessing Glu's operating results, as well as when planning,
forecasting and analyzing future periods. These non-GAAP financial
measures also facilitate comparisons of Glu's performance to prior
periods.
Cautions Regarding Forward-Looking Statements
This news release contains forward-looking statements, including those
regarding our “Business Outlook as of November 5, 2015” (“Fourth Quarter
Expectations – Quarter Ending December 30, 2015” and “2015 Expectations
– Full Year Ending December 31, 2015”), and the statements regarding
that we have signed exclusive, multi-year partnerships with celebrities
with over 1 billion social followers and expect games featuring these
celebrities to be live by the end of 2017; the strengthening of our
studios with the hiring of a new CTO and President of Studios and the
strengthening of our Board with the appointment of Greg Brandeau;
looking out for accretive and strategic uses of our strong balance
sheet; being well positioned given the promotional power of our
exclusive, multi-year celebrity gaming partnerships; bringing Tencent’s
chart-topping shooter WeFire to new territories where Glu has a
strong publishing operation; ongoing traction with our catalog titles;
and the combination of our long-term strategy and strong balance sheet
positioning Glu to scale to the next level and generate greater
shareholder value over time. These forward-looking statements are
subject to material risks and uncertainties that could cause actual
results to differ materially from those in the forward-looking
statements. Investors should consider important risk factors, which
include: the risks identified under "Business Outlook as of November 5,
2015"; the risk that Glu does not realize the anticipated strategic
benefits from our celebrity partnerships; the risk that the success of
WeFire in Asia does not correlate to strong performance in the markets
where we plan to publish the game; the risk that the number of social
followers of our celebrity partners does not correlate to strong
performance for our celebrity titles; the risk that consumer demand for
smartphones, tablets and next-generation platforms does not grow as
significantly as we anticipate or that we will be unable to capitalize
on any such growth; the risk that we do not realize a sufficient return
on our investment with respect to our efforts to develop free-to-play
games for smartphones, tablets and next-generation platforms, the risk
that we will not be able to maintain our good relationships with Apple
and Google; the risk that our development expenses for games for
smartphones, tablets and next-generation platforms are greater than we
anticipate; the risk that our recently and newly launched games are less
popular than anticipated or decline in popularity and monetization rate
more quickly than we anticipate; the risk that our newly released games
will be of a quality less than desired by reviewers and consumers; the
risk that the mobile games market, particularly with respect to
free-to-play gaming, is smaller than anticipated; the risk that we may
lose a key intellectual property license; the risk that we are unable to
recruit and retain qualified personnel for developing and maintaining
the games in our product pipeline resulting in reduced monetization of a
game, product launch delays or games being eliminated from our pipeline
altogether and other risks detailed under the caption "Risk Factors" in
our Form 10-Q filed with the Securities and Exchange Commission on
August 7, 2015 and our other SEC filings. You can locate these reports
through our website at http://www.glu.com/investors. We are under
no obligation, and expressly disclaim any obligation, to update or alter
our forward-looking statements whether as a result of new information,
future events or otherwise.
About Glu Mobile
Glu Mobile (GLUU) is a leading global developer and publisher of
free-to-play games for smartphone and tablet devices. Glu is focused on
creating compelling original IP games such as CONTRACT KILLER, COOKING
DASH, DEER HUNTER, DINER DASH, DINO HUNTER: DEADLY SHORES, ETERNITY
WARRIORS, FRONTLINE COMMANDO, RACING RIVALS, TAP SPORTS BASEBALL and TAP
SPORTS FOOTBALL, and branded IP games including KIM KARDASHIAN:
HOLLYWOOD, ROBOCOP: THE OFFICIAL GAME, MISSION IMPOSSIBLE: ROGUE NATION
and SNIPER X WITH JASON STATHAM on the App Store, Google Play, Amazon
Appstore, Facebook, Mac App Store, and Windows Phone. Glu’s unique
technology platform enables its titles to be accessible to a broad
audience of consumers globally. Founded in 2001, Glu is headquartered in
San Francisco with major U.S. offices outside Seattle and in Long Beach,
and international locations in Canada, China, India, Japan, Korea, and
Russia. Consumers can find high-quality entertainment wherever they see
the ‘g’ character logo or at www.glu.com.
For live updates, please follow Glu via Twitter at www.twitter.com/glumobile
or become a Glu fan at www.facebook.com/glumobile.
CONTRACT KILLER, COOKING DASH, DEER HUNTER, DINER DASH, DINO HUNTER:
DEADLY SHORES, ETERNITY WARRIORS, FRONTLINE COMMANDO, RACING RIVALS, TAP
SPORTS BASEBALL, TAP SPORTS FOOTBALL, SNIPER X, GLU,
GLU MOBILE, and the 'g' character logo are trademarks of Glu Mobile Inc.
|
|
|
|
|
|
|
|
Glu Mobile Inc.
|
|
|
|
|
|
|
Consolidated Balance Sheets
|
|
|
|
|
|
|
(in thousands)
|
|
|
|
|
|
|
(unaudited)
|
|
|
|
|
|
|
|
|
September 30,
|
|
December 31,
|
|
|
|
|
2015
|
|
2014
|
|
|
|
|
|
|
|
|
|
ASSETS
|
|
|
|
|
|
|
Cash and cash equivalents
|
|
$
|
182,349
|
|
|
$
|
70,912
|
|
|
|
Accounts receivable, net
|
|
|
25,986
|
|
|
|
32,231
|
|
|
|
Prepaid royalties
|
|
|
17,730
|
|
|
|
864
|
|
|
|
Prepaid expenses and other current assets
|
|
|
17,704
|
|
|
|
17,388
|
|
|
|
Total current assets
|
|
|
243,769
|
|
|
|
121,395
|
|
|
|
|
|
|
|
|
|
|
Property and equipment, net
|
|
|
5,536
|
|
|
|
6,116
|
|
|
|
Restricted cash
|
|
|
1,498
|
|
|
|
1,990
|
|
|
|
Long-term prepaid royalties
|
|
|
43,299
|
|
|
|
5,870
|
|
|
|
Other long-term assets
|
|
|
1,319
|
|
|
|
804
|
|
|
|
Intangible assets, net
|
|
|
20,103
|
|
|
|
27,524
|
|
|
|
Goodwill
|
|
|
87,915
|
|
|
|
87,964
|
|
|
|
Total assets
|
|
$
|
403,439
|
|
|
$
|
251,663
|
|
|
|
|
|
|
|
|
|
|
LIABILITIES AND STOCKHOLDERS' EQUITY
|
|
|
|
|
|
|
Accounts payable
|
|
$
|
10,561
|
|
|
$
|
11,685
|
|
|
|
Accrued liabilities
|
|
|
1,858
|
|
|
|
3,812
|
|
|
|
Accrued compensation
|
|
|
5,520
|
|
|
|
10,751
|
|
|
|
Accrued royalties
|
|
|
15,841
|
|
|
|
12,440
|
|
|
|
Deferred revenue
|
|
|
34,147
|
|
|
|
37,333
|
|
|
|
Total current liabilities
|
|
|
67,927
|
|
|
|
76,021
|
|
|
|
Other long-term liabilities
|
|
|
28,912
|
|
|
|
3,936
|
|
|
|
Total liabilities
|
|
|
96,839
|
|
|
|
79,957
|
|
|
|
|
|
|
|
|
|
|
Common stock
|
|
|
13
|
|
|
|
11
|
|
|
|
Additional paid-in capital
|
|
|
554,876
|
|
|
|
415,766
|
|
|
|
Accumulated other comprehensive loss
|
|
|
1
|
|
|
|
(8
|
)
|
|
|
Accumulated deficit
|
|
|
(248,290
|
)
|
|
|
(244,063
|
)
|
|
|
Stockholders' equity
|
|
|
306,600
|
|
|
|
171,706
|
|
|
|
Total liabilities and stockholders' equity
|
|
$
|
403,439
|
|
|
$
|
251,663
|
|
|
|
|
|
|
|
|
|
|
|
|
|
|
|
|
|
|
|
|
|
|
|
|
|
|
|
Glu Mobile Inc.
|
|
|
|
|
|
|
|
|
|
|
|
|
Condensed Consolidated Statements of Operations
|
|
|
|
|
|
|
|
|
|
|
|
|
(in thousands, except per share data)
|
|
|
|
|
|
|
|
|
|
|
|
|
(unaudited)
|
|
|
|
|
|
|
|
|
|
|
|
|
|
|
Three Months Ended
|
|
Nine Months Ended
|
|
|
|
|
September 30,
|
|
September 30,
|
|
September 30,
|
|
|
|
September 30,
|
|
|
|
|
2015
|
|
2014
|
|
2015
|
|
|
|
2014
|
|
|
|
|
|
|
|
|
|
|
|
|
|
|
|
Revenue
|
|
$
|
63,250
|
|
|
$
|
64,791
|
|
|
$
|
188,870
|
|
|
|
|
$
|
150,281
|
|
|
|
|
|
|
|
|
|
|
|
|
|
|
|
|
Cost of revenue:
|
|
|
|
|
|
|
|
|
|
|
|
|
Platform commissions, royalties and other
|
|
|
27,445
|
|
|
|
25,733
|
|
|
|
75,075
|
|
|
|
|
|
51,367
|
|
|
|
Amortization of intangible assets
|
|
|
2,360
|
|
|
|
1,338
|
|
|
|
7,228
|
|
|
|
|
|
2,333
|
|
|
|
Total cost of revenue
|
|
|
29,805
|
|
|
|
27,071
|
|
|
|
82,303
|
|
|
|
|
|
53,700
|
|
|
|
Gross profit
|
|
|
33,445
|
|
|
|
37,720
|
|
|
|
106,567
|
|
|
|
|
|
96,581
|
|
|
|
|
|
|
|
|
|
|
|
|
|
|
|
|
Operating expenses:
|
|
|
|
|
|
|
|
|
|
|
|
|
Research and development
|
|
|
16,304
|
|
|
|
15,355
|
|
|
|
52,855
|
|
|
|
|
|
48,231
|
|
|
|
Sales and marketing
|
|
|
12,302
|
|
|
|
15,327
|
|
|
|
37,511
|
|
|
|
|
|
32,801
|
|
|
|
General and administrative
|
|
|
4,419
|
|
|
|
6,808
|
|
|
|
19,254
|
|
|
|
|
|
17,865
|
|
|
|
Amortization of intangible assets
|
|
|
31
|
|
|
|
127
|
|
|
|
190
|
|
|
|
|
|
381
|
|
|
|
Restructuring charge
|
|
|
-
|
|
|
|
209
|
|
|
|
-
|
|
|
|
|
|
368
|
|
|
|
Total operating expenses
|
|
|
33,056
|
|
|
|
37,826
|
|
|
|
109,810
|
|
|
|
|
|
99,646
|
|
|
|
|
|
|
|
|
|
|
|
|
|
|
|
|
Income/(loss) from operations
|
|
|
389
|
|
|
|
(106
|
)
|
|
|
(3,243
|
)
|
|
|
|
|
(3,065
|
)
|
|
|
|
|
|
|
|
|
|
|
|
|
|
|
|
Interest income and other expense, net:
|
|
|
|
|
|
|
|
|
|
|
|
|
Interest income
|
|
|
15
|
|
|
|
7
|
|
|
|
34
|
|
|
|
|
|
20
|
|
|
|
Other expense
|
|
|
(167
|
)
|
|
|
(347
|
)
|
|
|
(644
|
)
|
|
|
|
|
(514
|
)
|
|
|
Interest income and other expense, net
|
|
|
(152
|
)
|
|
|
(340
|
)
|
|
|
(610
|
)
|
|
|
|
|
(494
|
)
|
|
|
|
|
|
|
|
|
|
|
|
|
|
|
|
Income/(loss) before income taxes
|
|
|
237
|
|
|
|
(446
|
)
|
|
|
(3,853
|
)
|
|
|
|
|
(3,559
|
)
|
|
|
Income tax benefit/(provision)
|
|
|
(79
|
)
|
|
|
10,850
|
|
|
|
(374
|
)
|
|
|
|
|
10,328
|
|
|
|
Net income/(loss)
|
|
$
|
158
|
|
|
$
|
10,404
|
|
|
$
|
(4,227
|
)
|
|
|
|
$
|
6,769
|
|
|
|
|
|
|
|
|
|
|
|
|
|
|
|
|
Net income/(loss) per share:
|
|
|
|
|
|
|
|
|
|
|
|
|
Basic
|
|
$
|
0.00
|
|
|
$
|
0.11
|
|
|
$
|
(0.04
|
)
|
|
|
|
$
|
0.08
|
|
|
|
Diluted
|
|
$
|
0.00
|
|
|
$
|
0.10
|
|
|
$
|
(0.04
|
)
|
|
|
|
$
|
0.07
|
|
|
|
|
|
|
|
|
|
|
|
|
|
|
|
|
Weighted average common shares outstanding
|
|
|
|
|
|
|
|
|
|
|
|
|
Basic
|
|
|
127,287
|
|
|
|
98,628
|
|
|
|
115,775
|
|
|
|
|
|
87,965
|
|
|
|
Diluted
|
|
|
131,486
|
|
|
|
105,438
|
|
|
|
115,775
|
|
|
|
|
|
93,578
|
|
|
|
|
|
|
|
|
|
|
|
|
|
|
|
|
Stock-based compensation expense included in:
|
|
|
|
|
|
|
|
|
|
|
|
|
Research and development
|
|
$
|
868
|
|
|
$
|
764
|
|
|
$
|
2,464
|
|
|
|
|
$
|
6,686
|
|
|
|
Sales and marketing
|
|
|
277
|
|
|
|
201
|
|
|
|
777
|
|
|
|
|
|
492
|
|
|
|
General and administrative
|
|
|
1,911
|
|
|
|
989
|
|
|
|
4,976
|
|
|
|
|
|
2,321
|
|
|
|
Total stock-based compensation expense
|
|
$
|
3,056
|
|
|
$
|
1,954
|
|
|
$
|
8,217
|
|
|
|
|
$
|
9,499
|
|
|
|
|
|
|
|
|
|
|
|
|
|
|
|
|
|
|
|
|
|
|
|
|
|
|
|
|
|
|
|
|
|
|
|
|
|
|
|
|
|
|
|
|
|
|
|
|
|
|
Glu Mobile Inc.
|
|
|
|
|
|
|
|
|
|
|
|
|
|
|
|
|
GAAP to Non-GAAP Reconciliation
|
|
|
|
|
|
|
|
|
|
|
|
|
|
|
|
|
(in thousands, except per share data)
|
|
|
|
|
|
|
|
|
|
|
|
|
|
|
|
|
(unaudited)
|
|
|
|
|
|
|
|
|
|
|
|
|
|
|
|
|
|
|
For the Three Months Ended
|
|
|
|
|
March 31,
|
|
June 30,
|
|
September 30,
|
|
December 31,
|
|
March 31,
|
|
June 30,
|
|
September 30,
|
|
|
|
|
2014
|
|
2014
|
|
2014
|
|
2014
|
|
2015
|
|
2015
|
|
2015
|
|
|
|
|
|
|
|
|
|
|
|
|
|
|
|
|
|
|
|
GAAP revenue
|
|
$ 44,580
|
|
|
$ 40,910
|
|
|
$ 64,791
|
|
|
$ 72,865
|
|
|
$ 69,470
|
|
|
$ 56,150
|
|
|
$ 63,250
|
|
|
|
Change in deferred revenue and litigation settlement proceeds
|
|
2,377
|
|
|
(5,874
|
)
|
|
18,762
|
|
|
3,363
|
|
|
(7,023
|
)
|
|
1,329
|
|
|
1,174
|
|
|
|
Non-GAAP revenue
|
|
46,957
|
|
|
35,036
|
|
|
83,553
|
|
|
76,228
|
|
|
62,447
|
|
|
57,479
|
|
|
64,424
|
|
|
|
|
|
|
|
|
|
|
|
|
|
|
|
|
|
|
|
|
GAAP gross profit
|
|
30,824
|
|
|
28,037
|
|
|
37,720
|
|
|
40,806
|
|
|
40,726
|
|
|
32,396
|
|
|
33,445
|
|
|
|
Change in deferred revenue and litigation settlement proceeds
|
|
2,377
|
|
|
(5,874
|
)
|
|
18,762
|
|
|
3,363
|
|
|
(7,023
|
)
|
|
1,329
|
|
|
1,174
|
|
|
|
Amortization of intangible assets
|
|
554
|
|
|
441
|
|
|
1,338
|
|
|
2,434
|
|
|
2,434
|
|
|
2,434
|
|
|
2,360
|
|
|
|
Non-cash warrant expense
|
|
-
|
|
|
-
|
|
|
1,126
|
|
|
66
|
|
|
93
|
|
|
135
|
|
|
1,896
|
|
|
|
Change in deferred platform commissions and royalty expense
|
|
(1,209
|
)
|
|
1,527
|
|
|
(9,122
|
)
|
|
(108
|
)
|
|
2,819
|
|
|
(321
|
)
|
|
(780
|
)
|
|
|
Non-GAAP gross profit
|
|
32,546
|
|
|
24,131
|
|
|
49,824
|
|
|
46,561
|
|
|
39,049
|
|
|
35,973
|
|
|
38,095
|
|
|
|
|
|
|
|
|
|
|
|
|
|
|
|
|
|
|
|
|
GAAP operating expense
|
|
30,117
|
|
|
31,703
|
|
|
37,826
|
|
|
35,676
|
|
|
38,214
|
|
|
38,540
|
|
|
33,056
|
|
|
|
Stock-based compensation
|
|
(2,979
|
)
|
|
(4,566
|
)
|
|
(1,954
|
)
|
|
(2,134
|
)
|
|
(2,129
|
)
|
|
(3,032
|
)
|
|
(3,056
|
)
|
|
|
Amortization of intangible assets
|
|
(127
|
)
|
|
(127
|
)
|
|
(127
|
)
|
|
(127
|
)
|
|
(127
|
)
|
|
(32
|
)
|
|
(31
|
)
|
|
|
Litigation costs and settlement proceeds
|
|
-
|
|
|
-
|
|
|
-
|
|
|
-
|
|
|
-
|
|
|
(476
|
)
|
|
390
|
|
|
|
Transitional costs
|
|
-
|
|
|
(682
|
)
|
|
(493
|
)
|
|
(255
|
)
|
|
(72
|
)
|
|
-
|
|
|
-
|
|
|
|
Change in fair value of Blammo earnout
|
|
(304
|
)
|
|
(531
|
)
|
|
-
|
|
|
-
|
|
|
-
|
|
|
-
|
|
|
-
|
|
|
|
Restructuring charge
|
|
-
|
|
|
(159
|
)
|
|
(209
|
)
|
|
(67
|
)
|
|
-
|
|
|
-
|
|
|
-
|
|
|
|
Non-GAAP operating expense
|
|
26,707
|
|
|
25,638
|
|
|
35,043
|
|
|
33,093
|
|
|
35,886
|
|
|
35,000
|
|
|
30,359
|
|
|
|
|
|
|
|
|
|
|
|
|
|
|
|
|
|
|
|
|
GAAP operating income/(loss)
|
|
707
|
|
|
(3,666
|
)
|
|
(106
|
)
|
|
5,130
|
|
|
2,512
|
|
|
(6,144
|
)
|
|
389
|
|
|
|
Change in deferred revenue and litigation settlement proceeds
|
|
2,377
|
|
|
(5,874
|
)
|
|
18,762
|
|
|
3,363
|
|
|
(7,023
|
)
|
|
1,329
|
|
|
1,174
|
|
|
|
Non-GAAP cost of revenue adjustment
|
|
(655
|
)
|
|
1,968
|
|
|
(6,658
|
)
|
|
2,392
|
|
|
5,346
|
|
|
2,248
|
|
|
3,476
|
|
|
|
Stock-based compensation
|
|
2,979
|
|
|
4,566
|
|
|
1,954
|
|
|
2,134
|
|
|
2,129
|
|
|
3,032
|
|
|
3,056
|
|
|
|
Amortization of intangible assets
|
|
127
|
|
|
127
|
|
|
127
|
|
|
127
|
|
|
127
|
|
|
32
|
|
|
31
|
|
|
|
Transitional costs
|
|
-
|
|
|
682
|
|
|
493
|
|
|
255
|
|
|
72
|
|
|
-
|
|
|
-
|
|
|
|
Change in fair value of Blammo earnout
|
|
304
|
|
|
531
|
|
|
-
|
|
|
-
|
|
|
-
|
|
|
-
|
|
|
-
|
|
|
|
Litigation costs and settlement proceeds
|
|
-
|
|
|
-
|
|
|
-
|
|
|
-
|
|
|
-
|
|
|
476
|
|
|
(390
|
)
|
|
|
Restructuring charge
|
|
-
|
|
|
159
|
|
|
209
|
|
|
67
|
|
|
-
|
|
|
-
|
|
|
-
|
|
|
|
Non-GAAP operating income/(loss)
|
|
5,839
|
|
|
(1,507
|
)
|
|
14,781
|
|
|
13,468
|
|
|
3,163
|
|
|
973
|
|
|
7,736
|
|
|
|
|
|
|
|
|
|
|
|
|
|
|
|
|
|
|
|
|
GAAP net income/(loss)
|
|
133
|
|
|
(3,768
|
)
|
|
10,404
|
|
|
1,379
|
|
|
1,124
|
|
|
(5,509
|
)
|
|
158
|
|
|
|
Change in deferred revenue and litigation settlement proceeds
|
|
2,377
|
|
|
(5,874
|
)
|
|
18,762
|
|
|
3,363
|
|
|
(7,023
|
)
|
|
1,329
|
|
|
1,174
|
|
|
|
Non-GAAP cost of revenue adjustment
|
|
(655
|
)
|
|
1,968
|
|
|
(6,658
|
)
|
|
2,392
|
|
|
5,346
|
|
|
2,248
|
|
|
3,476
|
|
|
|
Non-GAAP operating expense adjustment
|
|
3,410
|
|
|
6,065
|
|
|
2,783
|
|
|
2,583
|
|
|
2,328
|
|
|
3,540
|
|
|
2,697
|
|
|
|
Foreign currency exchange loss
|
|
136
|
|
|
31
|
|
|
347
|
|
|
981
|
|
|
290
|
|
|
186
|
|
|
167
|
|
|
|
Release of tax liabilities and valuation allowance
|
|
-
|
|
|
-
|
|
|
(8,352
|
)
|
|
1,531
|
|
|
-
|
|
|
-
|
|
|
-
|
|
|
|
Non-GAAP net income/(loss)
|
|
$ 5,401
|
|
|
$ (1,578
|
)
|
|
$ 17,286
|
|
|
$ 12,229
|
|
|
$ 2,065
|
|
|
$ 1,794
|
|
|
$ 7,672
|
|
|
|
|
|
|
|
|
|
|
|
|
|
|
|
|
|
|
|
|
Reconciliation of net income/(loss) and net income/(loss) per
share:
|
|
|
|
|
|
|
|
|
|
|
|
|
|
|
|
|
GAAP net income/(loss) per share - basic
|
|
$ 0.00
|
|
|
$ (0.04
|
)
|
|
$ 0.11
|
|
|
$ 0.01
|
|
|
$ 0.01
|
|
|
$ (0.05
|
)
|
|
$ 0.00
|
|
|
|
GAAP net income/(loss) per share - diluted
|
|
$ 0.00
|
|
|
$ (0.04
|
)
|
|
$ 0.10
|
|
|
$ 0.01
|
|
|
$ 0.01
|
|
|
$ (0.05
|
)
|
|
$ 0.00
|
|
|
|
Non-GAAP net income/(loss) per share - basic
|
|
$ 0.07
|
|
|
$ (0.02
|
)
|
|
$ 0.18
|
|
|
$ 0.12
|
|
|
$ 0.02
|
|
|
$ 0.02
|
|
|
$ 0.06
|
|
|
|
Non-GAAP net income/(loss) per share - diluted
|
|
$ 0.06
|
|
|
$ (0.02
|
)
|
|
$ 0.16
|
|
|
$ 0.11
|
|
|
$ 0.02
|
|
|
$ 0.01
|
|
|
$ 0.06
|
|
|
|
Shares used in computing Non-GAAP basic net income/(loss) per share
|
|
79,719
|
|
|
85,549
|
|
|
98,628
|
|
|
103,406
|
|
|
103,869
|
|
|
116,169
|
|
|
127,287
|
|
|
|
Shares used in computing Non-GAAP diluted net income/(loss) per share
|
|
85,398
|
|
|
85,549
|
|
|
105,438
|
|
|
106,954
|
|
|
107,851
|
|
|
122,538
|
|
|
131,486
|
|
|
|
|
|
|
|
|
|
|
|
|
|
|
|
|
|
|
|
|
Non-GAAP operating expense break-out:
|
|
|
|
|
|
|
|
|
|
|
|
|
|
|
|
|
GAAP research and development expense
|
|
$ 15,579
|
|
|
$ 17,297
|
|
|
$ 15,355
|
|
|
$ 16,053
|
|
|
$ 18,243
|
|
|
$ 18,308
|
|
|
$ 16,304
|
|
|
|
Transitional costs
|
|
-
|
|
|
(20
|
)
|
|
-
|
|
|
-
|
|
|
-
|
|
|
-
|
|
|
-
|
|
|
|
Stock-based compensation
|
|
(2,317
|
)
|
|
(3,605
|
)
|
|
(764
|
)
|
|
(736
|
)
|
|
(760
|
)
|
|
(836
|
)
|
|
(868
|
)
|
|
|
Non-GAAP research and development expense
|
|
13,262
|
|
|
13,672
|
|
|
14,591
|
|
|
15,317
|
|
|
17,483
|
|
|
17,472
|
|
|
15,436
|
|
|
|
|
|
|
|
|
|
|
|
|
|
|
|
|
|
|
|
|
GAAP sales and marketing expense
|
|
9,485
|
|
|
7,989
|
|
|
15,327
|
|
|
12,275
|
|
|
12,438
|
|
|
12,771
|
|
|
12,302
|
|
|
|
Stock-based compensation
|
|
(101
|
)
|
|
(190
|
)
|
|
(201
|
)
|
|
(209
|
)
|
|
(218
|
)
|
|
(282
|
)
|
|
(277
|
)
|
|
|
Non-GAAP sales and marketing expense
|
|
9,384
|
|
|
7,799
|
|
|
15,126
|
|
|
12,066
|
|
|
12,220
|
|
|
12,489
|
|
|
12,025
|
|
|
|
|
|
|
|
|
|
|
|
|
|
|
|
|
|
|
|
|
GAAP general & administrative expense
|
|
4,926
|
|
|
6,131
|
|
|
6,808
|
|
|
7,154
|
|
|
7,406
|
|
|
7,429
|
|
|
4,419
|
|
|
|
Transitional costs
|
|
-
|
|
|
(662
|
)
|
|
(493
|
)
|
|
(255
|
)
|
|
(72
|
)
|
|
-
|
|
|
-
|
|
|
|
Change in fair value of Blammo earnout
|
|
(304
|
)
|
|
(531
|
)
|
|
-
|
|
|
-
|
|
|
-
|
|
|
-
|
|
|
-
|
|
|
|
Stock-based compensation
|
|
(561
|
)
|
|
(771
|
)
|
|
(989
|
)
|
|
(1,189
|
)
|
|
(1,151
|
)
|
|
(1,914
|
)
|
|
(1,911
|
)
|
|
|
Litigation costs
|
|
-
|
|
|
-
|
|
|
-
|
|
|
-
|
|
|
-
|
|
|
(476
|
)
|
|
390
|
|
|
|
Non-GAAP general and administrative expense
|
|
$ 4,061
|
|
|
$ 4,167
|
|
|
$ 5,326
|
|
|
$ 5,710
|
|
|
$ 6,183
|
|
|
$ 5,039
|
|
|
$ 2,898
|
|
|
|
|
|
|
|
|
|
|
|
|
|
|
|
|
|
|
|
|
|
|
|
|
|
|
|
|
|
|
|
|
|
|
|
|
|
|
|
|
|
|
|
|
|
|
|
|
|
|
|
|
|
|
|
|
|
|
|
|
|
Glu Mobile Inc.
|
|
|
|
|
|
|
|
|
|
|
|
|
|
|
|
|
Non-GAAP Adjusted EBITDA
|
|
|
|
|
|
|
|
|
|
|
|
|
|
|
|
|
(in thousands)
|
|
|
|
|
|
|
|
|
|
|
|
|
|
|
|
|
(unaudited)
|
|
|
|
|
|
|
|
|
|
|
|
|
|
|
|
|
|
|
For the Three Months Ended
|
|
|
|
|
March 31,
|
|
June 30,
|
|
September 30,
|
|
December 31,
|
|
March 31,
|
|
June 30,
|
|
September 30,
|
|
|
|
|
2014
|
|
2014
|
|
2014
|
|
2014
|
|
2015
|
|
2015
|
|
2015
|
|
|
|
|
|
|
|
|
|
|
|
|
|
|
|
|
|
|
|
|
|
|
|
|
|
|
|
|
|
|
|
|
|
|
|
|
GAAP net income/(loss)
|
|
$
|
133
|
|
|
$
|
(3,768
|
)
|
|
$
|
10,404
|
|
|
$
|
1,379
|
|
|
$
|
1,124
|
|
|
$
|
(5,509
|
)
|
|
$
|
158
|
|
|
|
Change in deferred revenue and litigation settlement proceeds
|
|
|
2,377
|
|
|
|
(5,874
|
)
|
|
|
18,762
|
|
|
|
3,363
|
|
|
|
(7,023
|
)
|
|
|
1,329
|
|
|
|
1,174
|
|
|
|
Change in deferred platform commissions and royalty expense
|
|
|
(1,209
|
)
|
|
|
1,527
|
|
|
|
(9,122
|
)
|
|
|
(108
|
)
|
|
|
2,819
|
|
|
|
(321
|
)
|
|
|
(780
|
)
|
|
|
Non-cash warrant expense
|
|
|
-
|
|
|
|
-
|
|
|
|
1,126
|
|
|
|
66
|
|
|
|
93
|
|
|
|
135
|
|
|
|
1,896
|
|
|
|
Amortization of intangible assets
|
|
|
681
|
|
|
|
568
|
|
|
|
1,465
|
|
|
|
2,561
|
|
|
|
2,561
|
|
|
|
2,466
|
|
|
|
2,391
|
|
|
|
Depreciation
|
|
|
620
|
|
|
|
607
|
|
|
|
617
|
|
|
|
669
|
|
|
|
706
|
|
|
|
732
|
|
|
|
718
|
|
|
|
Stock-based compensation
|
|
|
2,979
|
|
|
|
4,566
|
|
|
|
1,954
|
|
|
|
2,134
|
|
|
|
2,129
|
|
|
|
3,032
|
|
|
|
3,056
|
|
|
|
Change in fair value of Blammo earnout
|
|
|
304
|
|
|
|
531
|
|
|
|
-
|
|
|
|
-
|
|
|
|
-
|
|
|
|
-
|
|
|
|
-
|
|
|
|
Transitional costs
|
|
|
-
|
|
|
|
682
|
|
|
|
493
|
|
|
|
255
|
|
|
|
72
|
|
|
|
-
|
|
|
|
-
|
|
|
|
Litigation costs and settlement proceeds
|
|
|
-
|
|
|
|
-
|
|
|
|
-
|
|
|
|
-
|
|
|
|
-
|
|
|
|
476
|
|
|
|
(390
|
)
|
|
|
Restructuring charge
|
|
|
-
|
|
|
|
159
|
|
|
|
209
|
|
|
|
67
|
|
|
|
-
|
|
|
|
-
|
|
|
|
-
|
|
|
|
Foreign currency exchange loss
|
|
|
136
|
|
|
|
31
|
|
|
|
347
|
|
|
|
981
|
|
|
|
290
|
|
|
|
186
|
|
|
|
167
|
|
|
|
Interest income and other expense
|
|
|
(6
|
)
|
|
|
(7
|
)
|
|
|
(7
|
)
|
|
|
(3
|
)
|
|
|
(6
|
)
|
|
|
(12
|
)
|
|
|
(15
|
)
|
|
|
Income tax provision/(benefit)
|
|
|
444
|
|
|
|
78
|
|
|
|
(10,850
|
)
|
|
|
2,773
|
|
|
|
1,104
|
|
|
|
(809
|
)
|
|
|
79
|
|
|
|
Total Non-GAAP Adjusted EBITDA
|
|
$
|
6,459
|
|
|
$
|
(900
|
)
|
|
$
|
15,398
|
|
|
$
|
14,137
|
|
|
$
|
3,869
|
|
|
$
|
1,705
|
|
|
$
|
8,454
|
|
|
|
|
|
|
|
|
|
|
|
|
|
|
|
|
|
|
|
|
|
|
|
|
|
|
|
|
|
|
|
|
|
In addition to the reasons stated above, which are generally applicable
to each of the items Glu excludes from its non-GAAP financial measures,
Glu believes it is appropriate to exclude certain items for the
following reasons:
Change in Deferred Revenue and Deferred Cost of Revenue. At the
date we sell certain premium games and micro-transactions, Glu has an
obligation to provide additional services and incremental unspecified
digital content in the future without an additional fee. In these cases,
we recognize the revenue and any associated cost of revenue, including
platform commissions and royalties, on a straight-line basis over the
estimated life of the paying user. Internally, Glu’s management excludes
the impact of the changes in deferred revenue and deferred cost of
revenue related to its premium and free-to-play games in its non-GAAP
financial measures when evaluating the company’s operating performance,
when planning, forecasting and analyzing future periods, and when
assessing the performance of its management team. Glu believes that
excluding the impact of the changes in deferred revenue and deferred
cost of revenue from its operating results is important to facilitate
comparisons to prior periods and to understand Glu’s operations.
Amortization of Intangible Assets. When analyzing the operating
performance of an acquired entity, Glu's management focuses on the total
return provided by the investment (i.e., operating profit generated from
the acquired entity as compared to the purchase price paid) without
taking into consideration any allocations made for accounting purposes.
Because the purchase price for an acquisition necessarily reflects the
accounting value assigned to intangible assets (including acquired
in-process technology and goodwill), when analyzing the operating
performance of an acquisition in subsequent periods, Glu's management
excludes the GAAP impact of acquired intangible assets to its financial
results. Glu believes that such an approach is useful in understanding
the long-term return provided by an acquisition and that investors
benefit from a supplemental non-GAAP financial measure that excludes the
accounting expense associated with acquired intangible assets.
Non-cash Warrant Expense. In the third and fourth quarters of
2014 and the first nine months of 2015, Glu recorded a non-cash charge
related to the vesting of warrants to purchase shares of common stock
issued to brand holders as part of third party licensing, development
and publishing arrangements. These charges were computed using the
Black-Scholes valuation model and were recorded in cost of revenue. When
evaluating the performance of its consolidated results, Glu does not
consider non-cash warrant expense as it places a greater emphasis on
overall stockholder dilution rather than the accounting charges
associated with the vesting of any warrants. As the non-cash warrant
expense impacts comparability from period to period Glu believes that
investors benefit from a supplemental non-GAAP financial measure that
excludes these charges.
Stock-Based Compensation Expense. The Company applies the fair
value provisions of ASC 718, Compensation-Stock Compensation (“ASC
718”). ASC 718 requires the recognition of compensation expense, using a
fair-value based method, for costs related to all share-based payments.
Included in the stock compensation expense was the contingent
consideration that was subsequently issued to the Blammo employees who
were former shareholders of Blammo, which was recorded as research and
development expense over the term of the earn-out periods, since these
employees were primarily employed in product development. Glu
re-measured the fair value of the contingent consideration each
reporting period and only recorded a compensation expense for the
portion of the earn-out target which was achieved. When evaluating the
performance of its consolidated results, Glu does not consider
stock-based compensation charges. Likewise, Glu's management team
excludes stock-based compensation expense from its short and long-term
operating plans. In contrast, Glu's management team is held accountable
for cash-based compensation and such amounts are included in its
operating plans. Further, when considering the impact of equity award
grants, Glu places a greater emphasis on overall stockholder dilution
rather than the accounting charges associated with such grants. Glu
believes it is useful to provide a non-GAAP financial measure that
excludes stock-based compensation in order to better understand the
long-term performance of its business.
Restructuring Charges. Glu undertook restructuring activities in
the second, third and fourth quarters of 2014 and recorded cash
restructuring charges due to the termination of certain employees in its
China, Europe and U.S. offices. Glu recorded the severance costs as an
operating expense when it communicated the benefit arrangement to the
employee and no significant future services, other than a minimum
retention period, were required of the employee to earn the termination
benefits. Glu believes that these restructuring charges do not reflect
its ongoing operations and that investors benefit from a supplemental
non-GAAP financial measure that excludes these charges.
Change in Fair Value of Blammo Earnout. As part of the
acquisition of Blammo, Glu committed to issue additional consideration
in the form of Glu’s common stock to the former, non-employee Blammo
shareholders if certain revenue targets were achieved. Glu recorded the
estimated contingent consideration liability at acquisition and adjusted
the fair value of the liability each reporting period. When analyzing
the operating performance of an acquired entity, Glu’s management
focuses on the total return provided by the investment (i.e., operating
profit generated from the acquired entity as compared to the purchase
price paid including the final amounts paid for contingent
consideration) without taking into consideration any expenses recognized
post-acquisition related to the change in fair value of the contingent
consideration. Because the final purchase price paid for an acquisition
necessarily reflects the accounting value assigned to both the
consideration, including the contingent consideration, paid and to the
intangible assets (including goodwill) acquired, when analyzing the
operating performance of an acquisition in subsequent periods, the
Company’s management excludes the GAAP impact of any adjustments to the
fair value of these acquisition-related balances to its financial
results. Glu believes that the fair value adjustments affect
comparability from period to period and that investors benefit from a
supplemental non-GAAP financial measure that excludes these charges.
Litigation Settlement Proceeds and Costs. These proceeds and
expenses consist primarily of one-time settlement payments received
from, and legal fees incurred in connection with, intellectual property
infringement matters. The Company has treated the settlement proceeds as
a multiple element arrangement and has allocated a significant portion
of the proceeds to revenue as deemed royalty revenue for the settlement
of past infringement. The residual proceeds have been allocated to
contra general and administrative expenses and offset legal fees
incurred. The Company excludes these proceeds and costs from its
non-GAAP measures as these proceeds and costs are isolated,
unpredictable and not expected to recur regularly, and the Company
believes that these non-recurring proceeds and costs have no direct
correlation to the operation of the Company’s ongoing core business.
Transitional Costs. GAAP requires expenses to be recognized for
various types of events associated with a business acquisition such as
legal, accounting and other deal related expenses. Glu has incurred
various costs related to the acquisition and integration of PlayFirst
and Cie Games into Glu’s operations. Glu recorded these non-recurring
acquisition and transitional costs as operating expenses when they were
incurred. Glu believes that these acquisition and transitional costs
affect comparability from period to period and that investors benefit
from a supplemental non-GAAP financial measure that excludes these
expenses.
Release of tax liabilities and valuation allowance. In the third
and fourth quarters of 2014 Glu adjusted a portion of its deferred tax
asset valuation allowance as a result of the deferred tax liabilities
recorded in connection with the Cie Games acquisition. Glu believes that
these non-recurring, one-time tax adjustments do not reflect its ongoing
operations and that investors benefit from a supplemental non-GAAP
financial measure that excludes these adjustments.
Foreign currency exchange gains and losses. Foreign currency
exchange gains and losses represent the net gain or loss that Glu has
recorded for the impact of currency exchange rate movements on cash and
other assets and liabilities denominated in foreign currencies related
to the revaluation of assets and liabilities. Accordingly, foreign
currency exchange gains and losses are generally unpredictable and can
cause Glu’s reported results to vary significantly. Due to the unusual
magnitude of these gains and losses, and the fact that Glu has not
engaged in hedging or taken other actions to reduce the likelihood of
incurring a sizeable net gain or loss in future periods, Glu excludes
foreign exchange gains and losses for comparability purposes. Glu
believes that these gains and losses do not reflect its ongoing
operations and that investors benefit from a supplemental non-GAAP
financial measure that excludes these items, enabling investors to
compare Glu’s core operating results in different periods without this
variability. Foreign exchange losses recognized during 2014 and 2015
were as follows (in thousands):
|
|
|
|
|
|
March 31, 2014
|
|
|
$
|
(136
|
)
|
|
June 30, 2014
|
|
|
|
(31
|
)
|
|
September 30, 2014
|
|
|
|
(347
|
)
|
|
December 31, 2014
|
|
|
|
(981
|
)
|
|
FY 2014
|
|
|
$
|
(1,495
|
)
|
|
|
|
|
|
|
|
|
|
|
|
March 31, 2015
|
|
|
$
|
(290
|
)
|
|
June 30, 2015
|
|
|
|
(186
|
)
|
|
September 30, 2015
|
|
|
|
(167
|
)
|
|
FY 2015
|
|
|
$
|
(643
|
)
|
CONTACT:
Investor Relations:
ICR, Inc.
Seth Potter,
646-277-1230
ir@glu.com
Exhibit 99.02

Glu Mobile Q3 2015 Earnings
© Glu Mobile Inc. – Proprietary Glu Mobile Inc. Q3 2015 Earnings Call
November 5, 2015 Page 1

Glu Mobile Q3 2015 Earnings
© Glu Mobile Inc. – Proprietary Safe Harbor Statement This presentation
contains "forward-looking" statements including: that we are minimally
exposed to increases in CPI; that the four categories on which we ones
where we believe we can be the best in the world in 2016/2017; that by
2020 there are expected to be approximately 4 billion smartphones; the
estimated size of the global games market, overall and by segment, for
2015; the expected launch dates for our upcoming celebrity titles; that
we have a strong pipeline of celebrity games in 2016 through 2017;
strong social features in a game will lead to long tail revenues; Glu’s
expected approach to integrating social features in its games; Glu has
multiple growth opportunities through wearables, the quad screen future,
mobile ad spending and international expansion; that we expect to launch
WeFire in certain territories in Q3-2016; that we have a growing and
engaged installed base; our Q4-2015 and full year 2015 guidance; the
expected contribution margin flow through of our gross revenue; our five
year goals of annual revenue growth of 20% to 30%, $1 billion of
non-GAAP revenue by 2020 and all quarters from Q3-2014 onward being
Adjusted EBITDA profitable; and our long-term margin targets. These
forward-looking statements are subject to material risks and
uncertainties that could cause actual results to differ materially from
those in the forward-looking statements. Investors should consider
important risk factors, which include: consumer demand for smartphones,
tablets and next-generation platforms does not grow as significantly as
we anticipate or that we will be unable to capitalize on any such
growth; the risk that we do not realize a sufficient return on our
investment with respect to our efforts to develop free-to-play games for
smartphones and tablets; the risk that we do not maintain our good
relationships with Apple and Google; the risk that Glu does not realize
the anticipated strategic benefits from its celebrity partnerships; the
risk that our development expenses are greater than we anticipate or
that we experience product delays; the risk that our recently and newly
launched games are less popular than anticipated; the risk that our
newly released games will be of a quality less than desired by reviewers
and consumers; the risk that the mobile games market, particularly with
respect to social, free-to-play gaming, is smaller than anticipated;
risks related to the restatement of certain of our historical financial
statements and other risks detailed under the caption "Risk Factors" in
our Form 10-Q filed with the Securities and Exchange Commission on
August 7, 2015 and our other SEC filings. You can locate these reports
through our website at http://www.glu.com/investors. These
"forward-looking" statements are based on estimates and information
available to us on November 5, 2015 and we are under no obligation, and
expressly disclaim any obligation, to update or alter our
forward-looking statements whether as a result of new information,
future events or otherwise.Page 2
Glu Mobile Q3 2015 Earnings
© Glu Mobile Inc. – Proprietary Use of Non-GAAP Financial Measures Glu
uses in this presentation certain non-GAAP measures of financial
performance. The presentation of these non-GAAP financial measures is
not intended to be considered in isolation from, as a substitute for, or
superior to, the financial information prepared and presented in
accordance with GAAP, and may be different from non-GAAP financial
measures used by other companies. In addition, these non-GAAP measures
have limitations in that they do not reflect all of the amounts
associated with Glu's results of operations as determined in accordance
with GAAP. The non-GAAP financial measures used by Glu include non-GAAP
revenue, non-GAAP smartphone revenue, non-GAAP cost of revenue, non-GAAP
gross profit, non-GAAP gross margin, non-GAAP operating expenses,
non-GAAP operating margin, non-GAAP net income/(loss), non-GAAP net
income/(loss) per share, Adjusted EBITDA and Adjusted EBITDA margin.
These non-GAAP financial measures exclude the following items from Glu's
unaudited consolidated statements of operations: Change in deferred
revenue and deferred cost of revenue; Amortization of intangible assets;
Non-cash warrant expense; Stock-based compensation expense;
Restructuring charges; Change in fair value of Blammo earnout;
Transitional costs; Litigation proceeds and costs; Release of tax
liabilities and valuation allowance; and Foreign currency exchange gains
and losses primarily related to the revaluation of assets and
liabilities. In addition, Glu has included in this presentation
“Adjusted EBITDA” figures which are used to evaluate Glu’s operating
performance and is defined as non-GAAP operating income/(loss) excluding
depreciation. Adjusted EBITDA margin is defined as Adjusted EBITDA
divided by non-GAAP revenue. Glu believes that these non-GAAP financial
measures, when taken together with the corresponding GAAP financial
measures, provide meaningful supplemental information regarding Glu's
performance by excluding certain items that may not be indicative of
Glu's core business, operating results or future outlook. Glu's
management uses, and believes that investors benefit from referring to,
these non-GAAP financial measures in assessing Glu's operating results,
as well as when planning, forecasting and analyzing future periods.
These non-GAAP financial measures also facilitate comparisons of Glu's
performance to prior periods. For a reconciliation of these non-GAAP
financial measures to their most directly comparable GAAP financial
measures, please refer to the tables at the end of this presentation.
Page 3
Glu Mobile Q3 2015 Earnings
© Glu Mobile Inc. – Proprietary Page 4 Executive Summary

Glu Mobile Q3 2015 Earnings
© Glu Mobile Inc. – Proprietary Page 5

Glu Mobile Q3 2015 Earnings
© Glu Mobile Inc. – Proprietary Strengthened Management Team Chris
Akhavan Pres. of Publishing 11 Quarters Eric R. Ludwig COO & CFO 44
Quarters Niccolo de Masi Chairman & CEO 24 Quarters Tim Wilson CTO New
Joiner Nick Earl Pres. of Studios New JoinerPage 6
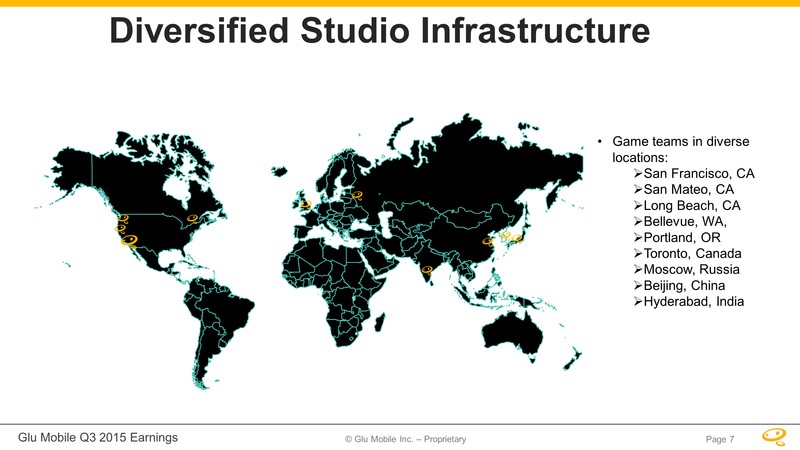
© Glu Mobile Inc. –
Proprietary Glu Mobile Q3 2015 Earnings Diversified Studio
Infrastructure Game teams in diverse locations: San Francisco, CA San
Mateo, CA Long Beach, CA Bellevue, WA, Portland, OR Toronto, Canada
Moscow, Russia Beijing, China Hyderabad, India Page 7
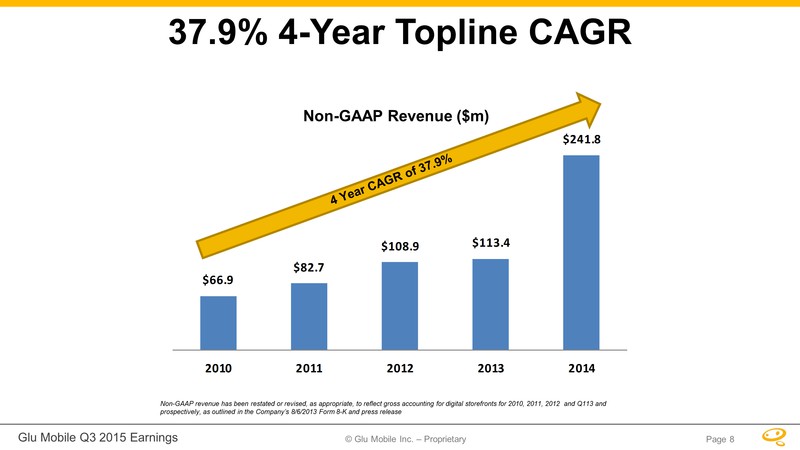
Glu Mobile Q3 2015 Earnings
© Glu Mobile Inc. – Proprietary 37.9% 4-Year Topline CAGR
$66.9$82.7$108.9$113.4$241.820102011201220132014 Non-GAAP revenue has
been restated or revised, as appropriate, to reflect gross accounting
for digital storefronts for 2010, 2011, 2012 and Q113 and prospectively,
as outlined in the Company’s 8/6/2013 Form 8-K and press release
Non-GAAP Revenue ($m) Page 8

Focus on ‘winner-takes-all’
‘blue-ocean’ genres •These represent categories where we believe we can
be the best in the world in 2016/2017 Glu Mobile Q3 2015 Earnings © Glu
Mobile Inc. – Proprietary Leader in 4 Key Gamer Demographics Page 9
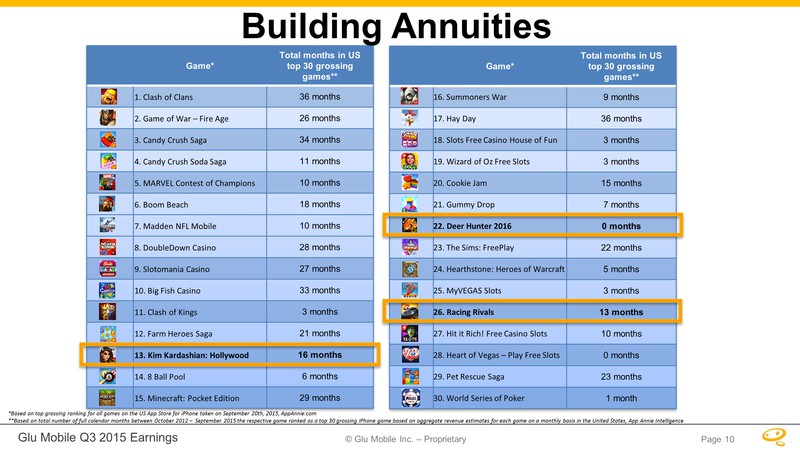
Page 10 building annuities

© Glu Mobile Inc. –
Proprietary Glu Mobile Q3 2015 Earnings Robocop $6.5M
31%21%9%8%4%3%3%2%2%2%15% Kim Kardashian: Hollywood $74.3M Deer Hunter
2014 $52.0M Eternity Warriors 3 $20.9M Racing Rivals $18.3M Dino Hunter:
Deadly Shores $10.0M Frontline Commando: D-Day $6.6M Contract Killer:
Sniper $6.2M Frontline Commando 2 $5.8M Other catalog $36.9M Contract
Killer 2 $4.4M 2014: Non-GAAP Revenue Delivery from a Broad Portfolio
Page 11
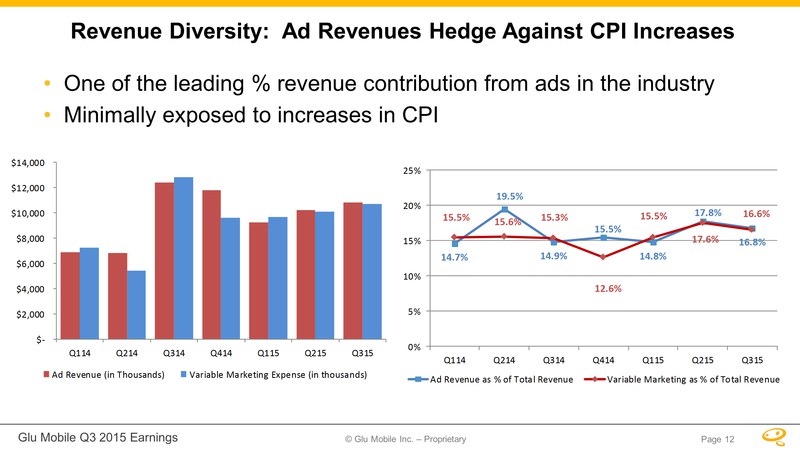
Glu Mobile Q3 2015 Earnings
© Glu Mobile Inc. – Proprietary Revenue Diversity: Ad Revenues Hedge
Against CPI Increases One of the leading % revenue contribution from ads
in the industry Minimally exposed to increases in CPI $- $2,000 $4,000
$6,000 $8,000 $10,000 $12,000 $14,000Q114Q214Q314Q414Q115Q215Q315Ad
Revenue (in Thousands)Variable Marketing Expense (in
thousands)14.7%19.5%14.9%15.5%14.8%17.8%16.8%15.5%15.6%15.3%12.6%15.5%17.6%16.6%0%5%10%15%20%25%Q114Q214Q314Q414Q115Q215Q315Ad
Revenue as % of Total RevenueVariable Marketing as % of Total
RevenuePage 12
Glu Mobile Q3 2015 Earnings
© Glu Mobile Inc. – Proprietary Growth Landscape Page 13
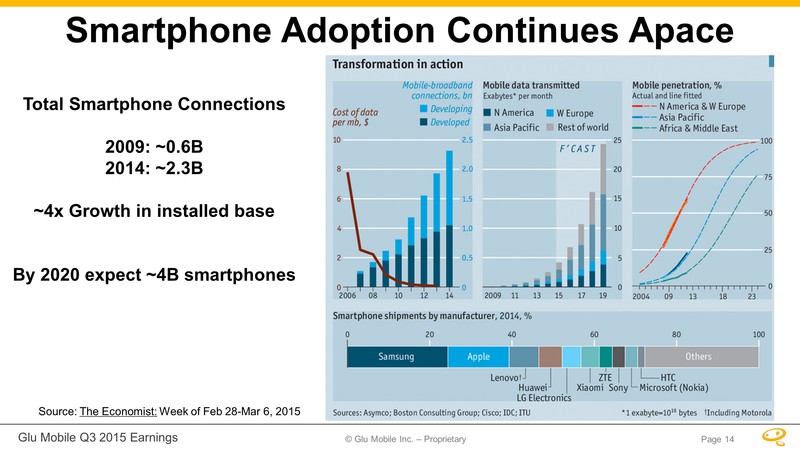
Glu Mobile Q3 2015 Earnings
© Glu Mobile Inc. – Proprietary Smartphone Adoption Continues Apace
Source: The Economist: Week of Feb 28-Mar 6, 2015 Total Smartphone
Connections 2009: ~0.6B 2014: ~2.3B ~4x Growth in installed base By 2020
expect ~4B smartphones Page 14
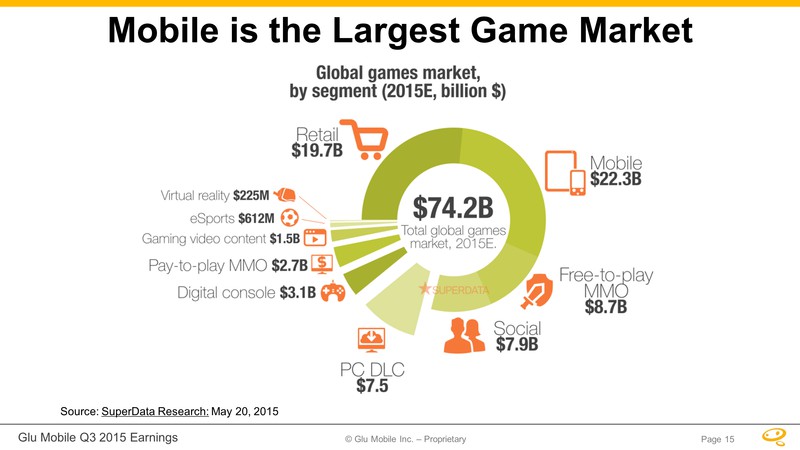
Glu Mobile Q3 2015 Earnings
© Glu Mobile Inc. – Proprietary Mobile is the Largest Game Market
Source: SuperData Research: May 20, 2015 Page 15
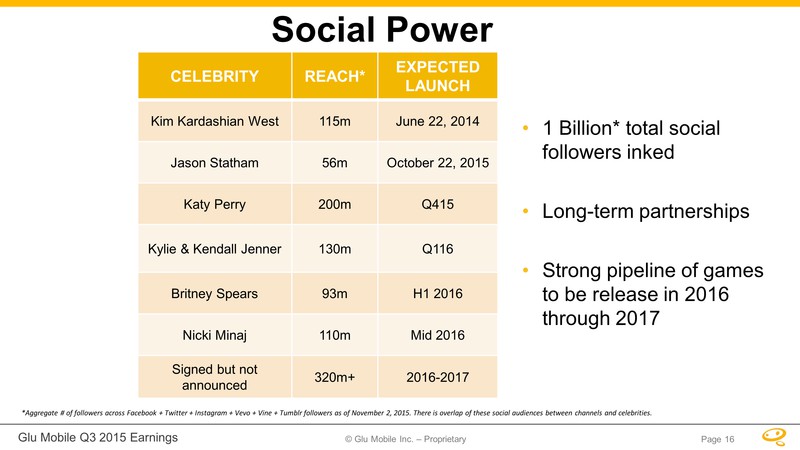
Social Power Page 16
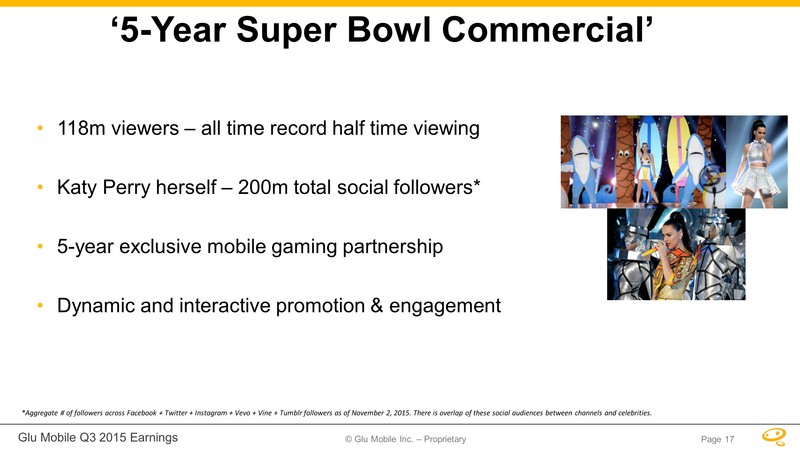
Glu Mobile Q3 2015 Earnings
© Glu Mobile Inc. – Proprietary ‘5-Year Super Bowl Commercial’ •118m
viewers – all time record half time viewing •Katy Perry herself – 200m
total social followers* •5-year exclusive mobile gaming partnership
•Dynamic and interactive promotion & engagement *Aggregate # of
followers across Facebook + Twitter + Instagram + Vevo + Vine + Tumblr
followers as of November 2, 2015. There is overlap of these social
audiences between channels and celebrities. Page 17
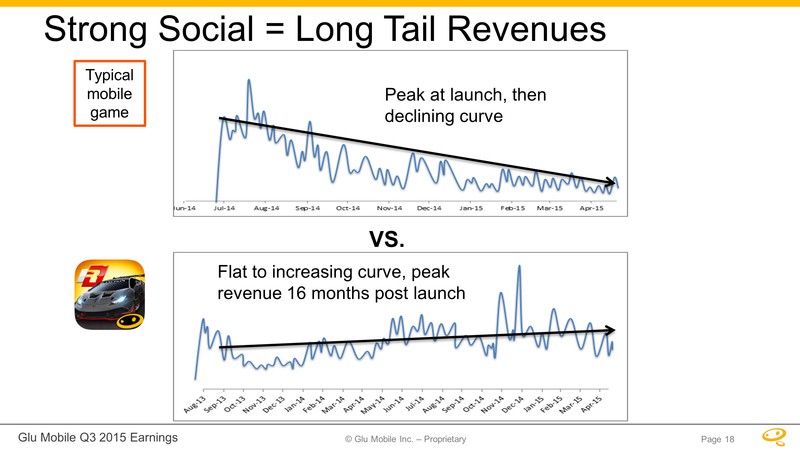
Glu Mobile Q3 2015 Earnings
© Glu Mobile Inc. – Proprietary Strong Social = Long Tail Revenues
Typical mobile game Peak at launch, then declining curve VS. Flat to
increasing curve, peak revenue 16 months post launch Page 18
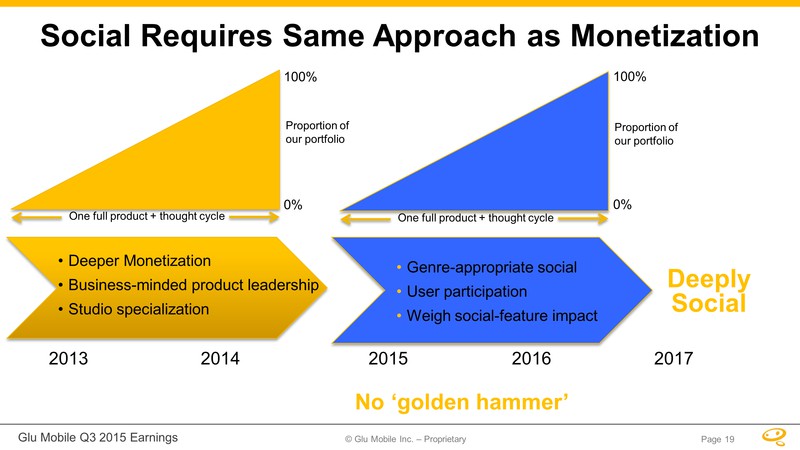
Glu Mobile Q3 2015 Earnings
© Glu Mobile Inc. – Proprietary Social Requires Same Approach as
Monetization 2013 2014 2015 2016 2017 •Deeper Monetization
•Business-minded product leadership •Studio specialization
•Genre-appropriate social •User participation •Weigh social-feature
impact 100% 0% Proportion of our portfolio One full product + thought
cycle Proportion of our portfolio One full product + thought cycle 100%
0% Deeply Social No ‘golden hammer’ Page 19
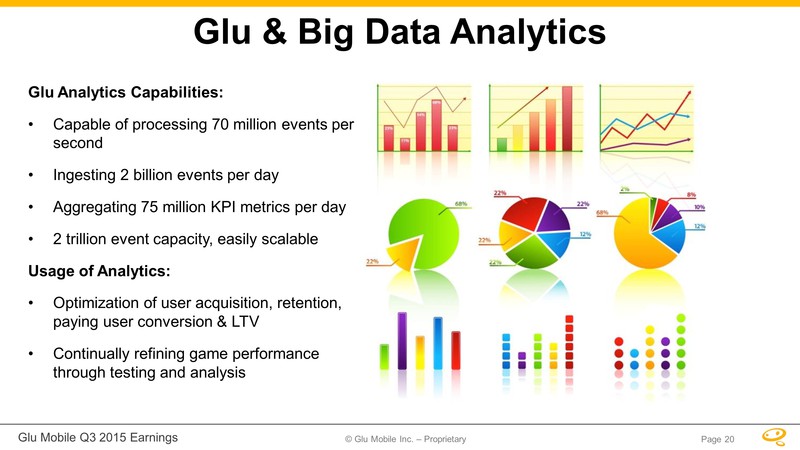
Glu Mobile Q3 2015 Earnings
© Glu Mobile Inc. – Proprietary Page 20 Glu Analytics Capabilities:
Capable of processing 70 million events per second Ingesting 2 billion
events per day Aggregating 75 million KPI metrics per day 2 trillion
event capacity, easily scalable Usage of Analytics: Optimization of user
acquisition, retention, paying user conversion & LTV Continually
refining game performance through testing and analysis Glu & Big Data
Analytics
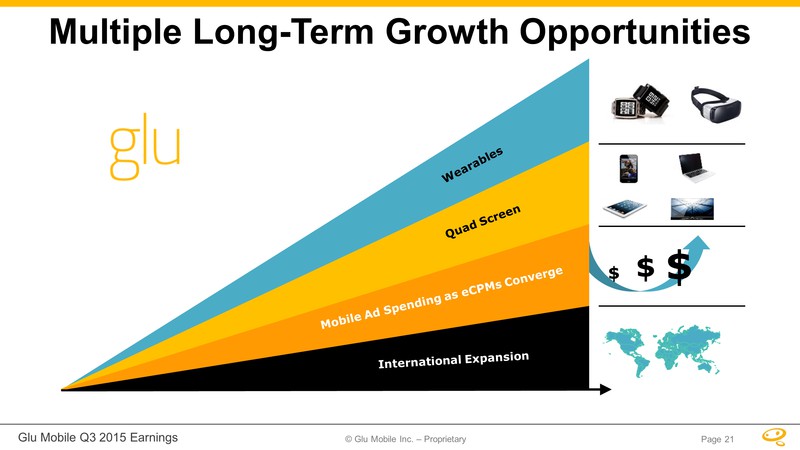
Glu Mobile Q3 2015 Earnings
© Glu Mobile Inc. – Proprietary Page 21 Multiple Long-Term Growth
Opportunities $ $ $

Glu Mobile Q3 2015 Earnings
© Glu Mobile Inc. – Proprietary Tencent ‘WeFire West’ Publishing
Partnership Page 22

Glu Mobile Q3 2015 Earnings
© Glu Mobile Inc. – Proprietary Introducing WeFire Five PVP gameplay
modes (and counting) Deep economy Social backend Synch PVP Scaled
robust, proven backend Page 23

Glu Mobile Q3 2015 Earnings
© Glu Mobile Inc. – Proprietary Publishing Partnership •We believe
WeFire to be the biggest revenue mobile shooter ever •Sustained Top 10
grossing ranking in China and other territories in Asia •Highly social
game with PvP and scaled backend •Glu partnering with Tencent to
westernize WeFire to proven Glu shooter IP •Expected to be live mid 2016
– territories include North & South America, EMEA, Australia & New
Zealand Page 24
Glu Mobile Q3 2015 Earnings
© Glu Mobile Inc. – Proprietary The Install Challenge Page 25

Games vs. Apps in Top Free
Rankings 0 8 6 4 2 United States Top 10 Free iPhone Downloads Jan-14
Feb-14 Mar-14 April-14 May-14 June-14 Jul-14 Aug-14 Sep-14 Oct-14 Nov-14
Dec-14 Jan-15 Feb-15 Mar-15 April-15 May-15 June-15 Jul-15 Aug-15 Sep-15
Oct-15 5 10 15 20 25 Applications Games 26

Glu Mobile Q3 2015 Earnings
© Glu Mobile Inc. – Proprietary 451352684433MESSAGING & SOCIALincluding
FacebookENTERTAINMENTincluding YouTubeGAMINGGaming Loses Ground to
Entertainment, Messaging & Social AppsQ2 2014Q2 2015 Source: Yahoo
Developer Network, August 26, 2015 +50% +240% -36% Time Spent in Minutes
Per Day (US consumers) Competing for AttentionPage 27
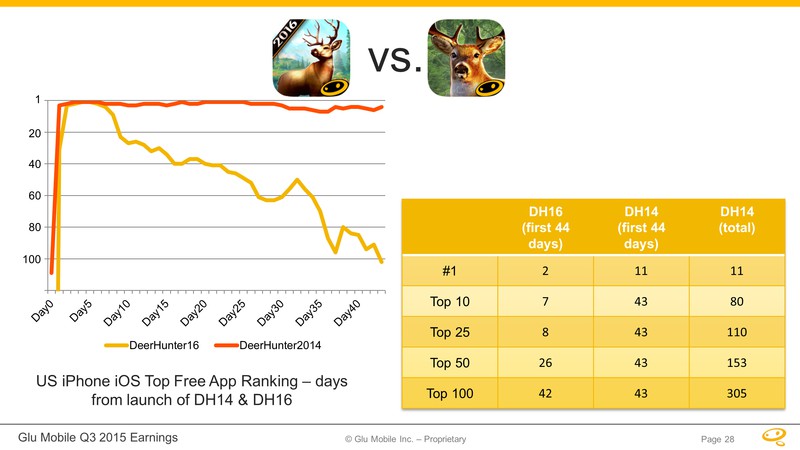
Glu Mobile Q32015 Earnings
Page 28
Glu Mobile Q3 2015 Earnings
© Glu Mobile Inc. – Proprietary Financial Overview Page 29
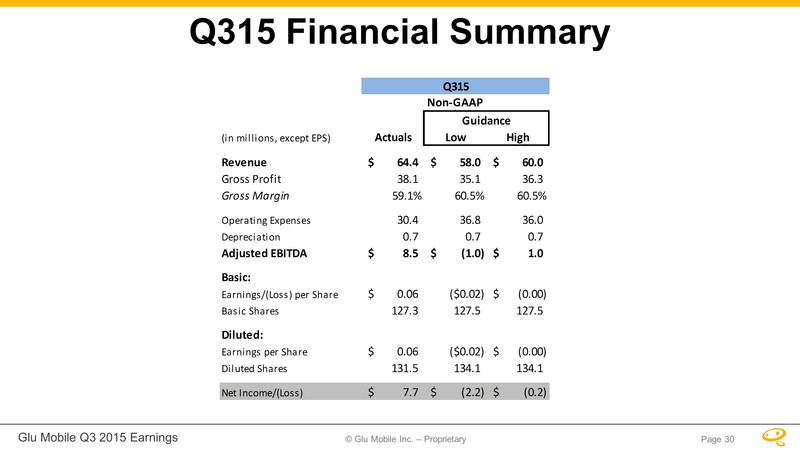
Glu Mobile Q3 2015 Earnings
© Glu Mobile Inc. – Proprietary Page 30 Q315 Financial Summary
Q315Non-GAAPGuidance(in millions, except EPS)ActualsLowHighRevenue64.4$
58.0$ 60.0$ Gross Profit38.1 35.1 36.3 Gross
Margin59.1%60.5%60.5%Operating Expenses30.4 36.8 36.0 Depreciation0.7
0.7 0.7 Adjusted EBITDA8.5$ (1.0)$ 1.0$ Basic:Earnings/(Loss) per
Share0.06$ ($0.02)(0.00)$ Basic Shares127.3 127.5 127.5 Diluted:Earnings
per Share0.06$ ($0.02)(0.00)$ Diluted Shares131.5 134.1 134.1 Net
Income/(Loss)7.7$ (2.2)$ (0.2)$
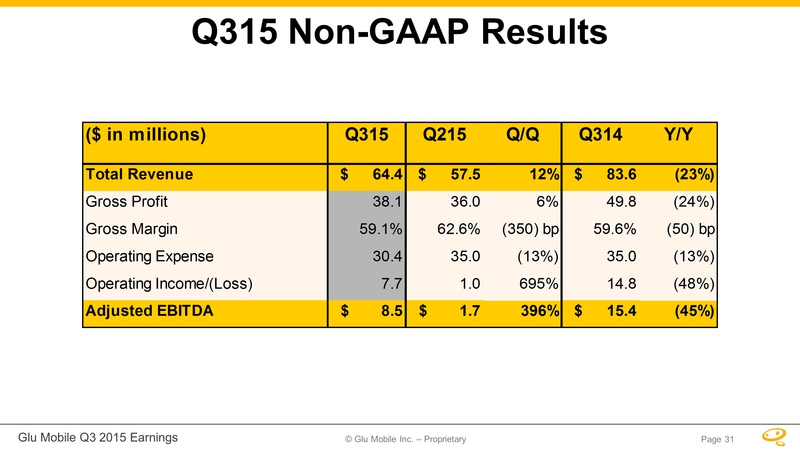
Q315 Non-GAAP Results ($ in
millions) Q315 Q215 Q/Q Q314 Y/Y Total Revenue $ 64.4 $ 57.5 12% $ 83.6
(23%) Gross Profit 38.1 36.0 6% 49.8 (24%) Gross Margin 59.1% 62.6%
(350) bp 59.6% (50) bp Operating Expense 30.4 35.0 (13%) 35.0 (13%)
Operating Income/(Loss) 7.7 1.0 695% 14.8 (48%) Adjusted EBITDA $ 8.5 $
1.7 396% $ 15.4 (45%) 31

Glu Mobile Q3 2015 Earnings
© Glu Mobile Inc. – Proprietary Page 32 Non-GAAP Revenue and Adjusted
EBITDA Non-GAAP revenue has been restated to reflect gross accounting
for digital storefronts Q113 and prospectively, as outlined in the
Company’s 8/6/2013 Form 8-K and press release. $24.7 $23.2 $22.6 $42.8
$47.0 $35.0 $83.6 $76.2 $62.4 $57.5 $64.4 $- $10.0 $20.0 $30.0 $40.0
$50.0 $60.0 $70.0 $80.0
$90.0Q113Q213Q313Q413Q114Q214Q314Q414Q115Q215Q315Non-GAAP Revenue(In
millions)($1.4)($2.9)($4.1)$6.2 $6.5 ($0.9)$15.4 $14.1 $3.9 $1.7 $8.5
$(10.0) $(5.0) $- $5.0 $10.0 $15.0
$20.0Q113Q213Q313Q413Q114Q214Q314Q414Q115Q215Q315Adjusted EBITDA(In
millions)
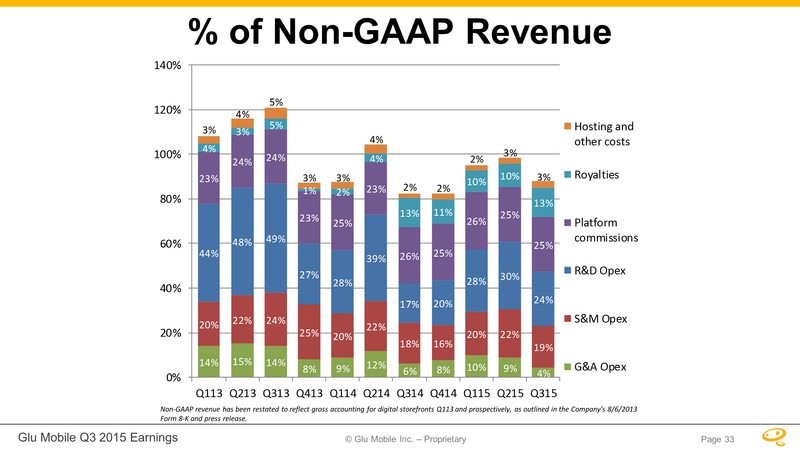
Glu Mobile Q3 2015 Earnings
© Glu Mobile Inc. – Proprietary Page 33 % of Non-GAAP Revenue Non-GAAP
revenue has been restated to reflect gross accounting for digital
storefronts Q113 and prospectively, as outlined in the Company’s
8/6/2013 Form 8-K and press release. 14%15%14%8 %9%12
%6%8%10%9%4%20%22%24%25%20%22%18%16%20%22%19%44 %48%49% 27%28%39%17%20%2
8%30%24%23%2 4%24%23%25%23 %26%25%26%25%25%4%3%5%1%2%4%13%11%10%10%1
3%3%4%5%3%3%4%2%2%2%3%3%0 %20%40%60%80%100%120%140%Q113Q213
Q313Q413Q114Q214Q314Q414Q115Q215Q315Hosting andother
costsRoyaltiesPlatformcommissionsR &D OpexS&M OpexG&A Opex
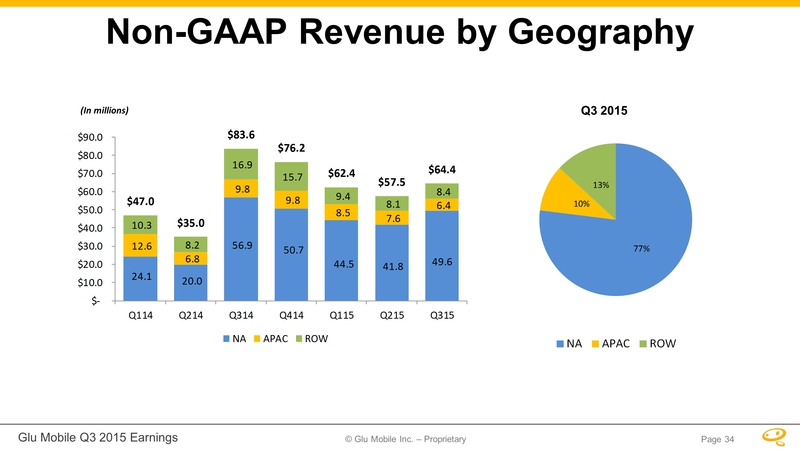
Non-GAAP Revenue by
Geography NA APAC ROW 56.9 50.7 44.5 41.8 49.6 $10.0 (In millions) $20.0
$30.0 $40.0 $50.0 $60.0 $70.0 $80.0 12.6 6.8 9.8 9.8 8.5 7.6 6.4 10.3
8.2 16.9 15.7 9.4 8.1 8.4 $47.0 $83.6 $47.0 $35.0 $76.2 $62.4 $57.5
$64.4 $35.0 34
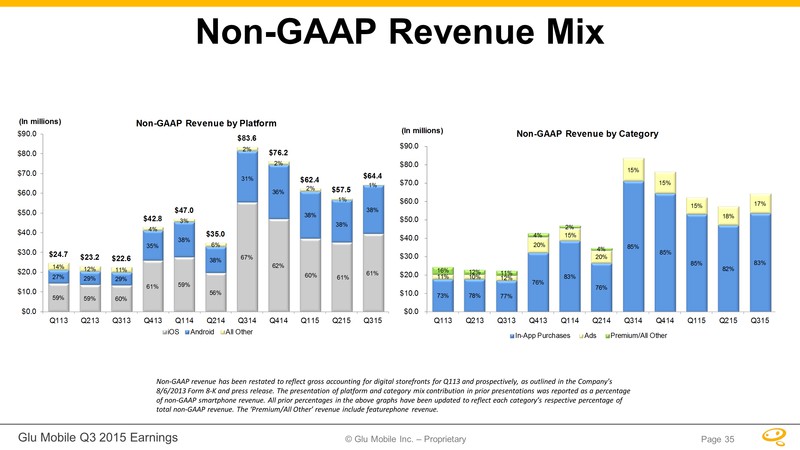
Glu Mobile Q3 2015 Earnings
© Glu Mobile Inc. – Proprietary Page 35 Non-GAAP Revenue Mix Non-GAAP
revenue has been restated to reflect gross accounting for digital
storefronts for Q113 and prospect ively, as outlined in the Company’s
8/6/2013 Form 8-K and press release. The presentation of platform and
category mix contribution in prior presentations was repo rted as a
percentage of non-GAAP smartphone revenue. All prior percentages in the
above graphs have been updated to reflect each category’s respective
percenta ge of total non-GAAP revenue. The ‘Premium/All Other’ revenue
include featurephone revenue. 59%59%60%61%59%56%67%62%60%61%61%27%29%29
%35%38%38%31%36%38%38%3 8%14%12%11%4%3%6%2%2%2%1%1%$24.7 $23.2 $22.6
$42.8 $47.0 $35 .0 $83.6 $76.2 $62.4 $57.5 $64.4 $0.
0$10.0$20.0$30.0$40.0
$50.0$60.0$70.0$80.0$90.0Q113Q213Q313Q413Q114Q214Q314Q414Q115Q215Q315(In
millions)No n-GAAP Revenue by PlatformiOSAndroidAll
Other73%78%77%76%83%76%85%85%85%82%83%11%10%12%20 %15%20%15%15%15%18%
17%16%12%11%4%2%4%$0.0$10.0$20.0$30.0$40.0$50.0$60.0$70.0$80.0$90.0Q113Q2
13Q313Q413Q114Q214Q314Q414Q115Q215Q315(In millions)Non-GAAP Revenue by
CategoryIn-App PurchasesAdsPremium/All Other
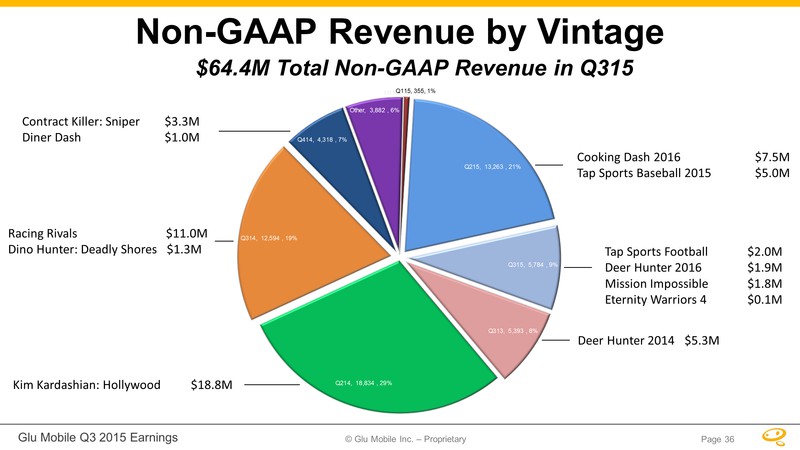
Glu Mobile Q3 2015 Earnings
© Glu Mobile Inc. – Proprietary Q214, 18,834 , 29%Q314, 12,594 ,
19%Q414, 4,318 , 7%Other, 3,882 , 6%Q115, 355 , 1%Q215, 13,263 ,
21%Q315, 5,784 , 9%Q313, 5,393 , 8% Non-GAAP Revenue by Vintage $64.4M
Total Non-GAAP Revenue in Q315 Deer Hunter 2014 $5.3M Racing Rivals
$11.0M Dino Hunter: Deadly Shores $1.3M Contract Killer: Sniper $3.3M
Diner Dash $1.0M Cooking Dash 2016 $7.5M Tap Sports Baseball 2015 $5.0M
Tap Sports Football $2.0M Deer Hunter 2016 $1.9M Mission Impossible
$1.8M Eternity Warriors 4 $0.1M Kim Kardashian: Hollywood $18.8M Q115,
355, 1%Page 36

Glu Mobile Q3 2015 Earnings
© Glu Mobile Inc. – Proprietary Page 37 Strong Balance Sheet ($ in
millions)Q315Q215Q314Cash and cash equivalents182.3$ 189.7$ 54.3$
Accounts receivable, net26.0 25.1 34.6 Prepaid expenses, royalties and
other current assets35.4 33.7 16.8 Other assets51.7 15.9 13.0 Intangible
assets & goodwill108.0 110.5 119.6 Total Assets403.4$ 374.9$ 238.3$
Accounts payable and accrued liabilities12.4 13.6 13.1 Accrued expenses,
royalties and other liabilities50.3 29.5 22.3 Deferred revenue34.1 31.2
34.2 Common stock/Paid in capital554.9 549.0 413.9 Accumulated deficit &
other comprehensive income(248.3) (248.4) (245.2) Total Liabilities and
Stockholders' Equity403.4$ 374.9$ 238.3$
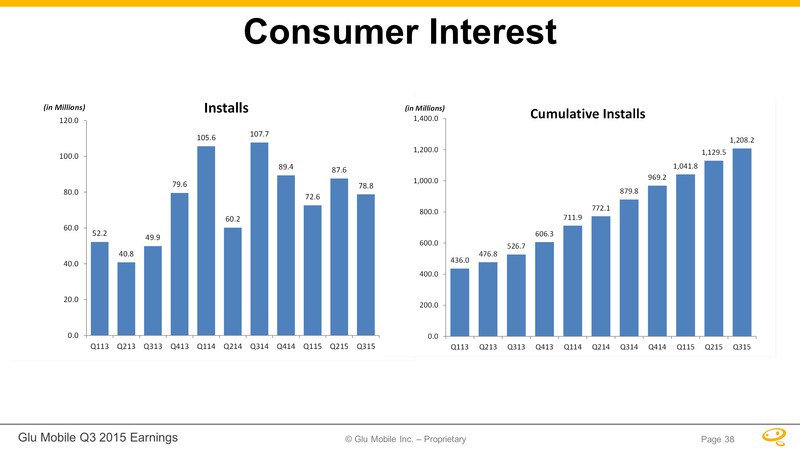
Glu Mobile Q3 2015 Earnings
© Glu Mobile Inc. – Proprietary Page 38 Consumer Interest
52.240.849.979.6105.660.2107.789.472.687.678.80.020.040.060.080.0100.0120.0Q113Q213Q313Q413Q114Q214Q314Q414Q115Q215Q315(in
Millions)Installs436.0476.8526.7606.3711.9772.1879.8969.21,041.81,129.51,208.20.0200.0400.0600.0800.01,000.01,200.01,400.0Q113Q213Q313Q413Q114Q214Q314Q414Q115Q215Q315(in
Millions)Cumulative Installs
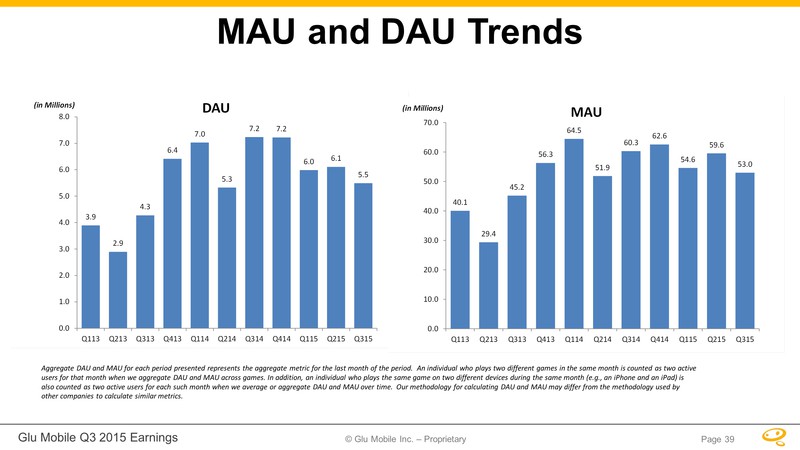
Glu Mobile Q3 2015 Earnings
© Glu Mobile Inc. – Proprietary Page 39 MAU and DAU Trends Aggregate DAU
and MAU for each period presented represents the aggregate metric for
the last month of the period. An individual who plays two different
games in the same month is counted as two active users for that month
when we aggregate DAU and MAU across games. In addition, an individual
who plays the same game on two different devices during the same month
(e.g., an iPhone and an iPad) is also counted as two active users for
each such month when we average or aggregate DAU and MAU over time. Our
methodology for calculating DAU and MAU may differ from the methodology
used by other companies to calculate similar metrics.
3.92.94.36.47.05.37.27.26.06.15.50.01.02.03.04.05.06.07.08.0Q113Q213Q313Q413Q114Q214Q314Q414Q115Q215Q315(in
Millions)DAU40.129.445.256.364.551.960.362.654.659.653.00.010.020.030.040.050.060.070.0Q113Q213Q313Q413Q114Q214Q314Q414Q115Q215Q315(in
Millions)MAU
© Glu Mobile Inc. –
Proprietary Glu Mobile Q3 2015 Earnings Page 40 Guidance
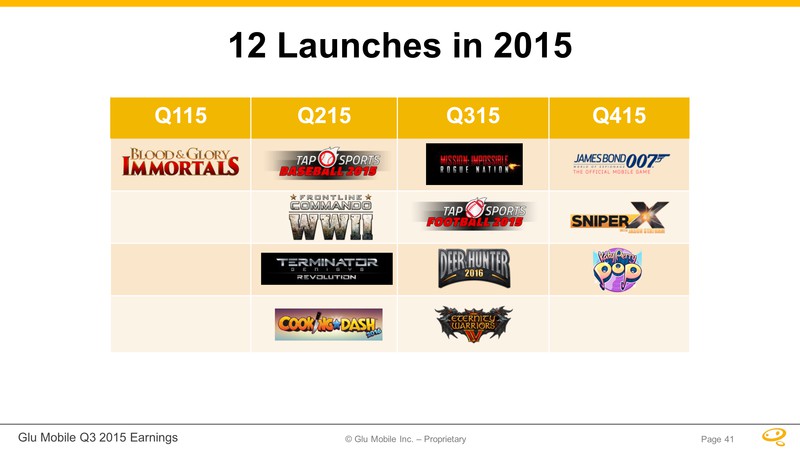
12 Launches in 2015 Page 41
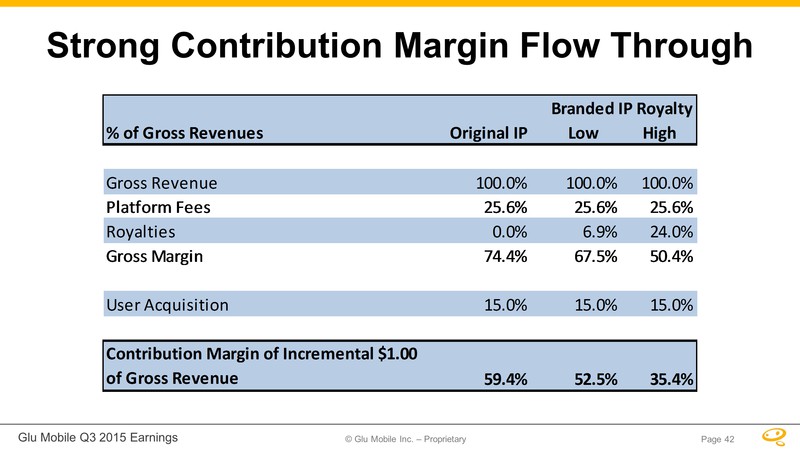
© Glu Mobile Inc. –
Proprietary Glu Mobile Q3 2015 Earnings Strong Contribution Margin Flow
Through % of Gross RevenuesOriginal IPLowHighGross
Revenue100.0%100.0%100.0%Platform
Fees25.6%25.6%25.6%Royalties0.0%6.9%24.0%Gross Margin74.4%67.5%50.4%User
Acquisition15.0%15.0%15.0%Contribution Margin of Incremental $1.00 of
Gross Revenue59.4%52.5%35.4%Branded IP Royalty Page 42
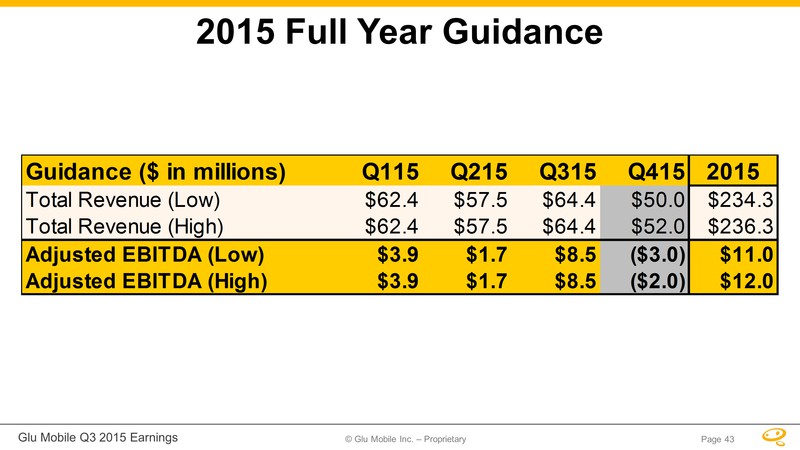
© Glu Mobile Inc. –
Proprietary Glu Mobile Q3 2015 Earnings Page 43 2015 Full Year Guidance
Guidance ($ in millions)Q115Q215Q315Q4152015Total Revenue (Low)$62.4
$57.5 $64.4 $50.0 $234.3 Total Revenue (High)$62.4 $57.5 $64.4 $52.0
$236.3 Adjusted EBITDA (Low)$3.9 $1.7 $8.5 ($3.0)$11.0 Adjusted EBITDA
(High)$3.9 $1.7 $8.5 ($2.0)$12.0

© Glu Mobile Inc. –
Proprietary Glu Mobile Q3 2015 Earnings Page 44 Q415 Guidance ($ in
millions, except EPS)Q315 ActQ415 GuidanceQ415 GuidanceLow HighTotal
Revenue$64.4 $50.0$52.0Gross Margin59.1%62.7%62.7%Operating Expense30.4
35.135.3Operating Income/(Loss) 7.7 (3.7)(2.7) Depreciation Addback 0.7
0.70.7Adjusted EBITDA$8.5 ($3.0)($2.0)Net Income/(Loss)7.7
(3.9)(2.9)Basic Shares (millions)127.3 128.0128.0Diluted Shares
(millions)131.5 129.3129.3Net Income/(Loss) Per Basic Share $0.06
($0.03)($0.02)Net Income/(Loss) Per Diluted Share $0.06
($0.03)($0.02)Cash and ST Investments Balance$182.3 $170.0
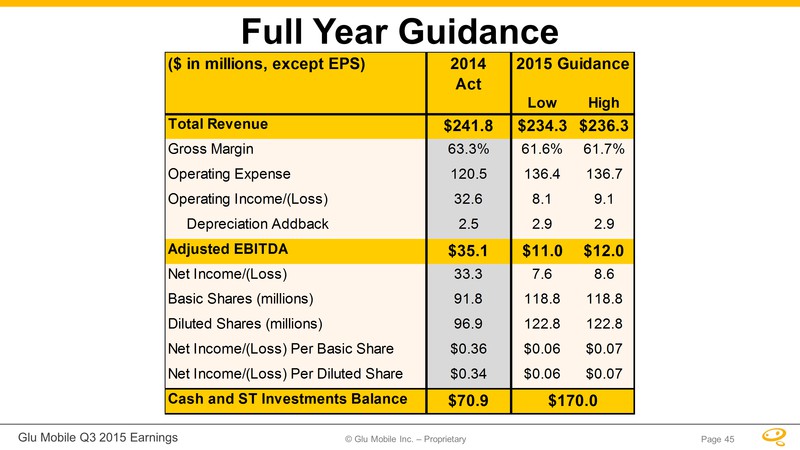
© Glu Mobile Inc. –
Proprietary Glu Mobile Q3 2015 Earnings Page 45 Full Year Guidance ($ in
millions, except EPS)2014ActLow HighTotal Revenue$241.8 $234.3 $236.3
Gross Margin63.3%61.6%61.7%Operating Expense120.5 136.4136.7Operating
Income/(Loss) 32.6 8.1 9.1 Depreciation Addback 2.5 2.92.9Adjusted
EBITDA$35.1 $11.0 $12.0 Net Income/(Loss)33.3 7.6 8.6 Basic Shares
(millions)91.8 118.8118.8Diluted Shares (millions)96.9 122.8122.8Net
Income/(Loss) Per Basic Share $0.36 $0.06 $0.07 Net Income/(Loss) Per
Diluted Share $0.34 $0.06 $0.07 Cash and ST Investments Balance$70.9
$170.0 2015 Guidance
© Glu Mobile Inc. –
Proprietary Glu Mobile Q3 2015 Earnings Page 46 Long-Term Model

© Glu Mobile Inc. –
Proprietary Glu Mobile Q3 2015 Earnings •Annual Revenue Growth of 20% to
30% •$1 Billion of Non-GAAP Revenue in 2020 •Long-term goal of all
quarters being Adjusted EBITDA Profitable Long Term Operating Model:
Five Year Goals Glu’s goals with respect to revenue growth and EBITDA
profitability illustrate potential outcomes if our business strategies
are successful. These goals should not be treated as forecasts,
projections or financial guidance. We cannot assure you that we will
achieve any particular growth rate and our revenue and EBITDA may not
grow at all. Our performance is subject to many material risks and
uncertainties that could cause our actual performance to fall short of
these goals, including the risks discussed in our Quarterly Report on
Form 10-Q filed with the SEC on August 7, 2015 and our other SEC
filings.Page 47
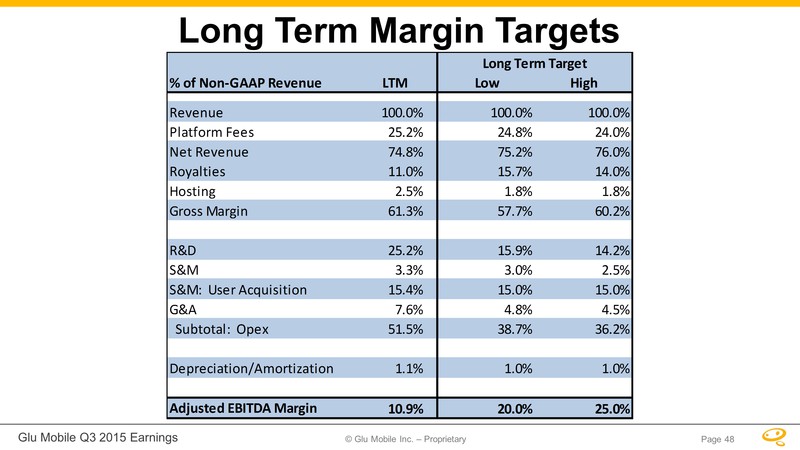
© Glu Mobile Inc. –
Proprietary Glu Mobile Q3 2015 Earnings Long Term Margin Targets % of
Non-GAAP RevenueLTMLowHighRevenue100.0%100.0%100.0%Platform
Fees25.2%24.8%24.0%Net
Revenue74.8%75.2%76.0%Royalties11.0%15.7%14.0%Hosting2.5%1.8%1.8%Gross
Margin61.3%57.7%60.2%R&D25.2%15.9%14.2%S&M3.3%3.0%2.5%S&M: User
Acquisition15.4%15.0%15.0%G&A7.6%4.8%4.5% Subtotal:
Opex51.5%38.7%36.2%Depreciation/Amortization1.1%1.0%1.0%Adjusted EBITDA
Margin10.9%20.0%25.0%Long Term TargetPage 48
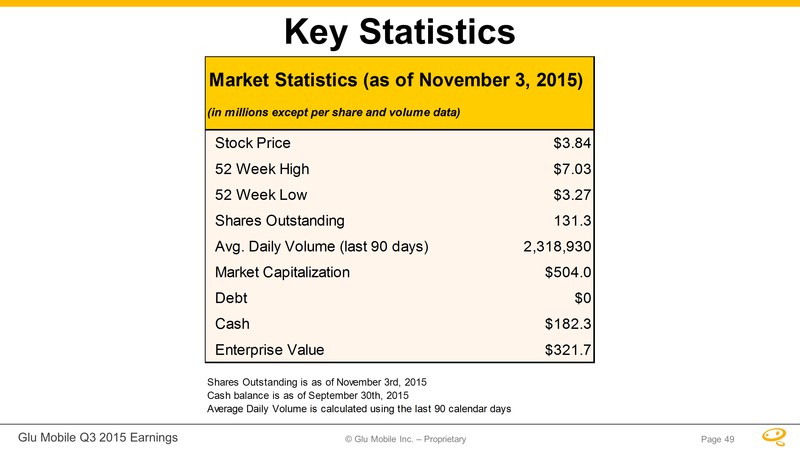
© Glu Mobile Inc. –
Proprietary Glu Mobile Q3 2015 Earnings Page 49 Key Statistics Stock
Price$3.84 52 Week High$7.03 52 Week Low$3.27 Shares Outstanding 131.3
Avg. Daily Volume (last 90 days)2,318,930 Market Capitalization$504.0
Debt$0 Cash$182.3 Enterprise Value$321.7 Shares Outstanding is as of
November 3rd, 2015Cash balance is as of September 30th, 2015Average
Daily Volume is calculated using the last 90 calendar daysMarket
Statistics (as of November 3, 2015) (in millions except per share and
volume data)
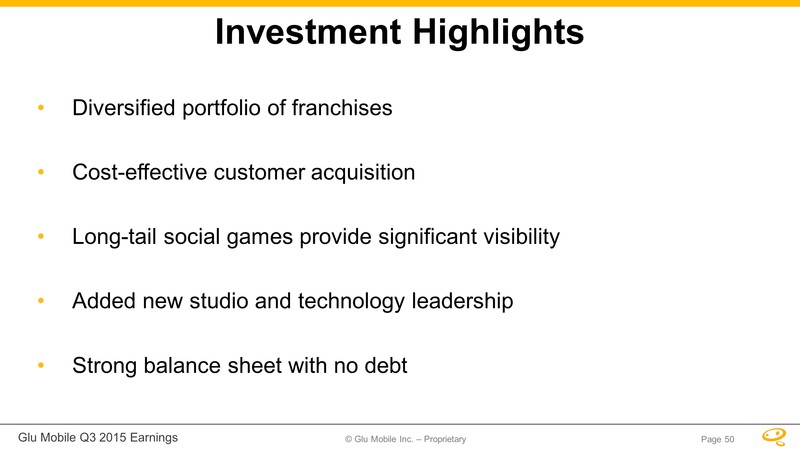
Glu Mobile Q3 2015 Earnings
© Glu Mobile Inc. – Proprietary Page 50 Investment Highlights
Diversified portfolio of franchises Cost-effective customer acquisition
Long-tail social games provide significant visibility Added new studio
and technology leadership Strong balance sheet with no debt
© Glu Mobile Inc. –
Proprietary Glu Mobile Q3 2015 Earnings Page 51 Non-GAAP Reconciliations
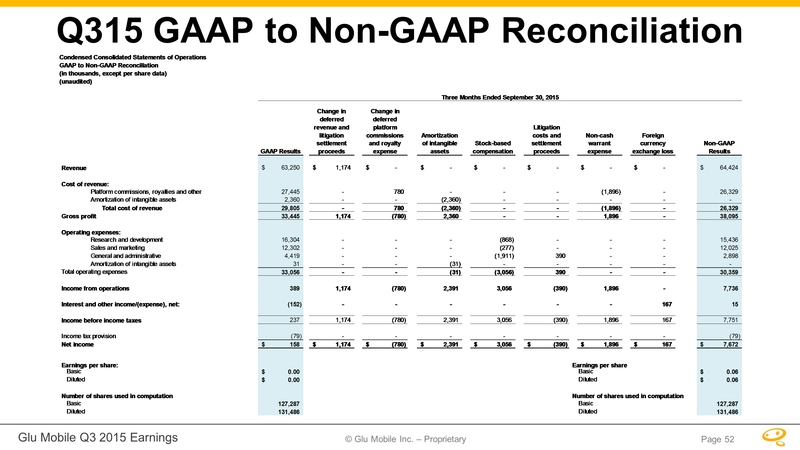
Q315 GAAP to Non-GAAP
Reconciliation Condensed Consolidated Statements of Operations GAAP to
Non-GAAP Reconciliation (in thousands, except per share data)
(unaudited) GAAP Results Change in deferred revenue and litigation
settlement proceeds Change in deferred platform commissions and royalty
expense Amortization of intangible assets Stock-based compensation
Litigation costs and settlement proceeds Non-cash warrant expense
Foreign currency exchange loss Non-GAAP Results Revenue $ 6 3,250 $
1,174 $ - $ - $ - $ - $ - $ - $ 64,424 Cost of revenue: Platform
commissions, royalties and other 27,445 - 780 - - - (1,896) - 26,329
Amortization of intangible assets 2,360 - - (2,360) - - - - - Total cost
of revenue 29,805 - 780 (2,360) - - (1,896) - 26,329 Gross profit 33,445
1,174 (780) 2,360 - - 1,896 - 38,095 Operating expenses: Research and
development 16,304 - - - (868) - - - 15,436 Sales and marketing 12,302 -
- - (277) - - - 12,025 General and administrative 4,419 - - - (1,911)
390 - - 2,898 Amortization of intangible assets 31 - - (31) - - - - -
Total operating expenses 33,056 - - (31) (3,056) 390 - - 30,359 Income
from operations 389 1,174 (780) 2,391 3,056 (390) 1,896 - 7,736 Interest
and other income/(expense), net: (152) - - - - - - 167 15 Income before
income taxes 237 1,174 (780) 2,391 3,056 (390) 1,896 167 7,751 Income
tax provision ( 79) - - - - - - - (79) Net income $ 158 $ 1,174 $ (780)
$ 2,391 $ 3,056 $ (390) $ 1,896 $ 167 $ 7,672 Earnings per share:
Earnings per share Basic $ 0.00 Basic $ 0.06 Diluted $ 0.00 Diluted $
0.06 Number of shares used in computation Number of shares used in
computation Basic 1 27,287 Basic 1 27,287 Diluted 1 31,486 Diluted 1
31,486 52
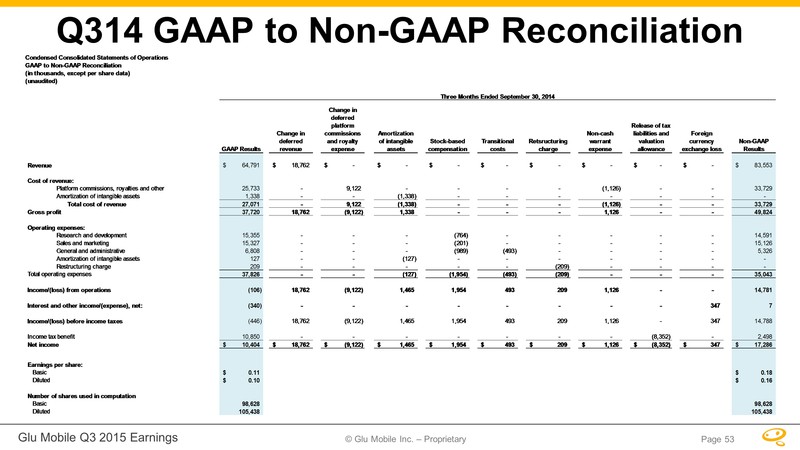
Glu Mobile Q3 2015 Earnings
© Glu Mobile Inc. – Proprietary Page 53 Q314 GAAP to Non-GAAP
Reconciliation Condensed Consolidated Statements of OperationsGAAP to
Non-GAAP Reconciliation(in thousands, except per share
data)(unaudited)GAAP ResultsChange in deferred revenueChange in deferred
platform commissions and royalty expenseAmortization of intangible
assetsStock-based compensation Transitional costsRetsructuring
chargeNon-cash warrant expenseRelease of tax liabilities and valuation
allowanceForeign currency exchange lossNon-GAAP ResultsRevenue64,791$
18,762$ -$ -$ -$ -$ -$ -$ -$ -$ 83,553$ Cost of revenue:Platform
commissions, royalties and other25,733 - 9,122 - - - - (1,126) - -
33,729 Amortization of intangible assets1,338 - - (1,338) - - - - - - -
Total cost of revenue27,071 - 9,122 (1,338) - - - (1,126) - - 33,729
Gross profit37,720 18,762 (9,122) 1,338 - - - 1,126 - - 49,824 Operating
expenses:Research and development15,355 - - - (764) - - - - - 14,591
Sales and marketing15,327 - - - (201) - - - - - 15,126 General and
administrative6,808 - - - (989) (493) - - - - 5,326 Amortization of
intangible assets127 - - (127) - - - - - - - Restructuring charge209 - -
- - - (209) - - - - Total operating expenses37,826 - - (127) (1,954)
(493) (209) - - - 35,043 Income/(loss) from operations(106) 18,762
(9,122) 1,465 1,954 493 209 1,126 - - 14,781 Interest and other
income/(expense), net:(340) - - - - - - - - 347 7 Income/(loss) before
income taxes(446) 18,762 (9,122) 1,465 1,954 493 209 1,126 - 347 14,788
Income tax benefit10,850 - - - - - - - (8,352) - 2,498 Net income10,404$
18,762$ (9,122)$ 1,465$ 1,954$ 493$ 209$ 1,126$ (8,352)$ 347$ 17,286$
Earnings per share: Basic0.11$ 0.18$ Diluted0.10$ 0.16$ Number of shares
used in computation Basic98,628 98,628 Diluted105,438 105,438 Three
Months Ended September 30, 2014
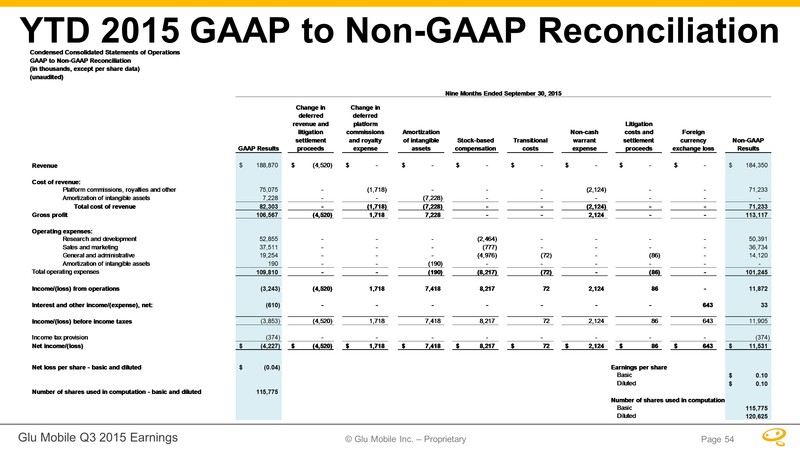
Glu Mobile Q3 2015 Earnings
© Glu Mobile Inc. – Proprietary Page 54 YTD 2015 GAAP to Non-GAAP
Reconciliation Condensed Consolidated Statements of OperationsGAAP to
Non-GAAP Reconciliation(in thousands, except per share
data)(unaudited)GAAP ResultsChange in deferred revenue and litigation
settlement proceedsChange in deferred platform commissions and royalty
expenseAmortization of intangible assetsStock-based compensation
Transitional costsNon-cash warrant expenseLitigation costs and
settlement proceedsForeign currency exchange lossNon-GAAP
ResultsRevenue188,870$ (4,520)$ -$ -$ -$ -$ -$ -$ -$ 184,350$ Cost of
revenue:Platform commissions, royalties and other75,075 - (1,718) - - -
(2,124) - - 71,233 Amortization of intangible assets7,228 - - (7,228) -
- - - - - Total cost of revenue82,303 - (1,718) (7,228) - - (2,124) - -
71,233 Gross profit106,567 (4,520) 1,718 7,228 - - 2,124 - - 113,117
Operating expenses:Research and development52,855 - - - (2,464) - - - -
50,391 Sales and marketing37,511 - - - (777) - - - - 36,734 General and
administrative19,254 - - - (4,976) (72) - (86) - 14,120 Amortization of
intangible assets190 - - (190) - - - - - - Total operating
expenses109,810 - - (190) (8,217) (72) - (86) - 101,245 Income/(loss)
from operations(3,243) (4,520) 1,718 7,418 8,217 72 2,124 86 - 11,872
Interest and other income/(expense), net:(610) - - - - - - - 643 33
Income/(loss) before income taxes(3,853) (4,520) 1,718 7,418 8,217 72
2,124 86 643 11,905 Income tax provision(374) - - - - - - - - (374) Net
income/(loss)(4,227)$ (4,520)$ 1,718$ 7,418$ 8,217$ 72$ 2,124$ 86$ 643$
11,531$ Net loss per share - basic and diluted(0.04)$ Earnings per
shareBasic0.10$ Diluted0.10$ Number of shares used in computation -
basic and diluted115,775 Number of shares used in
computationBasic115,775 Diluted120,625 Nine Months Ended September 30,
2015
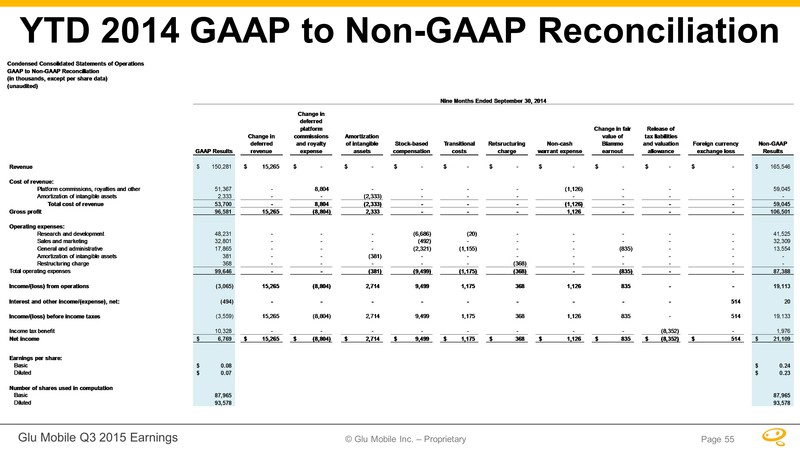
Glu Mobile Q3 2015 Earnings
© Glu Mobile Inc. – Proprietary Page 55 YTD 2014 GAAP to Non-GAAP
Reconciliation Condensed Consolidated Statements of OperationsGAAP to
Non-GAAP Reconciliation(in thousands, except per share
data)(unaudited)GAAP ResultsChange in deferred revenueChange in deferred
platform commissions and royalty expenseAmortization of intangible
assetsStock-based compensation Transitional costsRetsructuring
chargeNon-cash warrant expenseChange in fair value of Blammo
earnoutRelease of tax liabilities and valuation allowanceForeign
currency exchange lossNon-GAAP ResultsRevenue150,281$ 15,265$ -$ -$ -$
-$ -$ -$ -$ -$ -$ 165,546$ Cost of revenue:Platform commissions,
royalties and other51,367 - 8,804 - - - - (1,126) - - - 59,045
Amortization of intangible assets2,333 - - (2,333) - - - - - - - - Total
cost of revenue53,700 - 8,804 (2,333) - - - (1,126) - - - 59,045 Gross
profit96,581 15,265 (8,804) 2,333 - - - 1,126 - - - 106,501 Operating
expenses:Research and development48,231 - - - (6,686) (20) - - - - -
41,525 Sales and marketing32,801 - - - (492) - - - - - - 32,309 General
and administrative17,865 - - - (2,321) (1,155) - - (835) - - 13,554
Amortization of intangible assets381 - - (381) - - - - - - - -
Restructuring charge368 - - - - - (368) - - - - - Total operating
expenses99,646 - - (381) (9,499) (1,175) (368) - (835) - - 87,388
Income/(loss) from operations(3,065) 15,265 (8,804) 2,714 9,499 1,175
368 1,126 835 - - 19,113 Interest and other income/(expense), net:(494)
- - - - - - - - - 514 20 Income/(loss) before income taxes(3,559) 15,265
(8,804) 2,714 9,499 1,175 368 1,126 835 - 514 19,133 Income tax
benefit10,328 - - - - - - - - (8,352) - 1,976 Net income6,769$ 15,265$
(8,804)$ 2,714$ 9,499$ 1,175$ 368$ 1,126$ 835$ (8,352)$ 514$ 21,109$
Earnings per share: Basic0.08$ 0.24$ Diluted0.07$ 0.23$ Number of shares
used in computation Basic87,965 87,965 Diluted93,578 93,578 Nine Months
Ended September 30, 2014
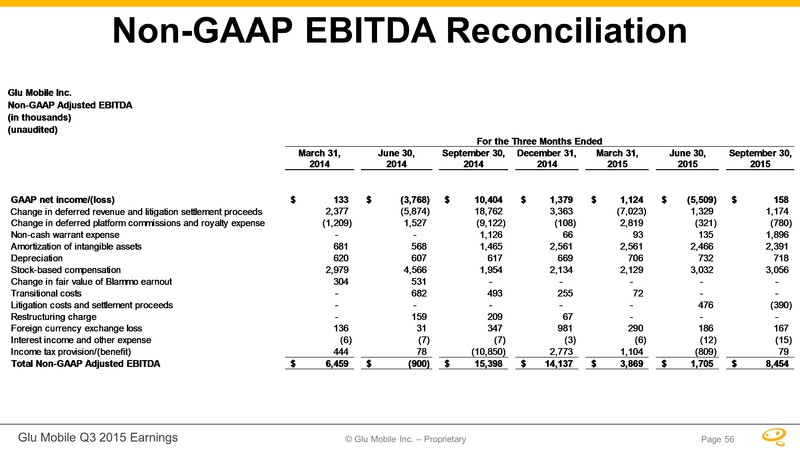
Glu Mobile Q3 2015 Earnings
© Glu Mobile Inc. – Proprietary Page 56 Non-GAAP EBITDA Reconciliation
Glu Mobile Inc.Non-GAAP Adjusted EBITDA(in thousands)(unaudited)March
31,June 30,September 30,December 31,March 31,June 30,September
30,2014201420142014201520152015GAAP net income/(loss)133$ (3,768)$
10,404$ 1,379$ 1,124$ (5,509)$ 158$ Change in deferred revenue and
litigation settlement proceeds 2,377 (5,874) 18,762 3,363 (7,023) 1,329
1,174 Change in deferred platform commissions and royalty expense(1,209)
1,527 (9,122) (108) 2,819 (321) (780) Non-cash warrant expense- - 1,126
66 93 135 1,896 Amortization of intangible assets681 568 1,465 2,561
2,561 2,466 2,391 Depreciation620 607 617 669 706 732 718 Stock-based
compensation 2,979 4,566 1,954 2,134 2,129 3,032 3,056 Change in fair
value of Blammo earnout304 531 - - - - - Transitional costs- 682 493 255
72 - - Litigation costs and settlement proceeds - - - - - 476 (390)
Restructuring charge- 159 209 67 - - - Foreign currency exchange loss136
31 347 981 290 186 167 Interest income and other expense(6) (7) (7) (3)
(6) (12) (15) Income tax provision/(benefit)444 78 (10,850) 2,773 1,104
(809) 79 Total Non-GAAP Adjusted EBITDA6,459$ (900)$ 15,398$ 14,137$
3,869$ 1,705$ 8,454$ For the Three Months Ended
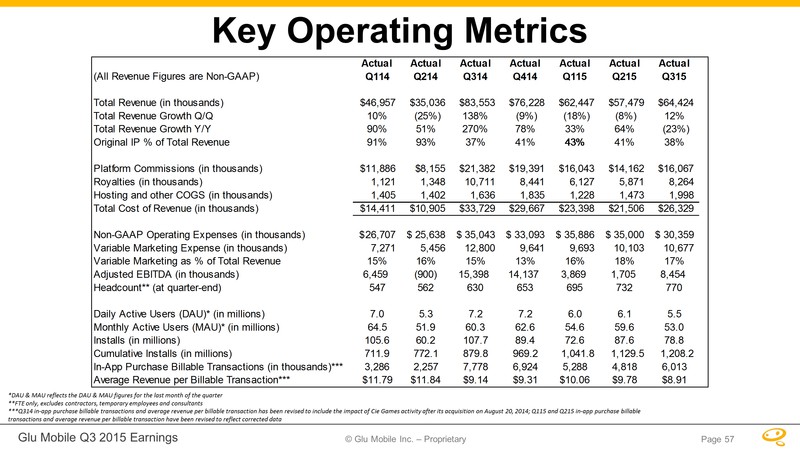
Glu Mobile Q3 2015 Earnings
© Glu Mobile Inc. – Proprietary Page 57 Key Operating Metrics *DAU & MAU
reflects the DAU & MAU figures for the last month of the quarter **FTE
only, excludes contractors, temporary employees and consultants ***Q314
in-app purchase billable transactions and average revenue per billable
transaction has been revised to include the impact of Cie Games activity
after its acquisition on August 20, 2014; Q115 and Q215 in-app purchase
billable transactions and average revenue per billable transaction have
been revised to reflect corrected data
ActualActualActualActualActualActualActual(All Revenue Figures are
Non-GAAP)Q114Q214Q314Q414Q115Q215Q315Total Revenue (in thousands)$46,957
$35,036 $83,553 $76,228 $62,447 $57,479 $64,424 Total Revenue Growth
Q/Q10%(25%)138%(9%)(18%)(8%)12%Total Revenue Growth
Y/Y90%51%270%78%33%64%(23%)Original IP % of Total
Revenue91%93%37%41%43%41%38%Platform Commissions (in thousands)$11,886
$8,155 $21,382 $19,391 $16,043 $14,162 $16,067 Royalties (in
thousands)1,121 1,348 10,711 8,441 6,127 5,871 8,264 Hosting and other
COGS (in thousands)1,405 1,402 1,636 1,835 1,228 1,473 1,998 Total Cost
of Revenue (in thousands)$14,411 $10,905 $33,729 $29,667 $23,398 $21,506
$26,329 Non-GAAP Operating Expenses (in thousands)26,707$ 25,638$
35,043$ 33,093$ 35,886$ 35,000$ 30,359$ Variable Marketing Expense (in
thousands)7,271 5,456 12,800 9,641 9,693 10,103 10,677 Variable
Marketing as % of Total Revenue15%16%15%13%16%18%17%Adjusted EBITDA (in
thousands)6,459(900)15,39814,1373,8691,7058,454Headcount** (at
quarter-end)547562630653695732770Daily Active Users (DAU)* (in
millions)7.05.37.27.26.06.15.5Monthly Active Users (MAU)* (in
millions)64.551.960.362.654.659.653.0Installs (in
millions)105.660.2107.789.472.687.678.8Cumulative Installs (in
millions)711.9772.1879.8969.21,041.8 1,129.5 1,208.2 In-App Purchase
Billable Transactions (in
thousands)***3,2862,2577,7786,9245,2884,8186,013Average Revenue per
Billable Transaction***$11.79$11.84$9.14$9.31$10.06$9.78$8.91
Glu Mobile (NASDAQ:GLUU)
Historical Stock Chart
From Mar 2024 to Apr 2024

Glu Mobile (NASDAQ:GLUU)
Historical Stock Chart
From Apr 2023 to Apr 2024
