ITT Educational Beats Earnings & Rev Est. - Analyst Blog
April 26 2013 - 7:50AM
Zacks
ITT Educational Services Inc.' (ESI) earnings
of $1.33 per share in the first quarter of 2013 surpassed the Zacks
Consensus Estimate of $1.28 by 3.9%. However, earnings
declined 44.1% from the year-ago earnings of $2.38 per share. The
double-digit decline in revenues took a toll on the bottom
line.
Quarterly revenues totaled $287.7 million, down 15.8% from the
prior-year quarter due to weak enrollments. However, total revenue
surpassed the Zacks Consensus Estimate of $276 million by 4.2%.
ITT Educational reported total enrollment of 61,039 students for
first quarter of 2013, down 14.2% year over year. New enrollments
also witnessed a drop of 3.6% to 17,412 students in the quarter due
to the weak performance of criminal justice, electronics and
network administration programs. The company’s revenue per student
increased 1.0% from the prior-year quarter to $4,712.
During the quarter, student persistence rates declined 90 basis
points (bps) to 71.5% due to a 17.8% dip in the number of
continuing students. Student persistence rate is calculated by
dividing the number of continuing students in any academic term by
total student enrollment in the immediately preceding academic
term.
The company reported operating earnings of $52.7 million in the
first quarter of 2013, down 47.6% from the prior-year quarter due
to a weak top line and higher bad debt expenses. Operating margin
dipped 1,110 bps to 18.3%.
Cost of educational services in first quarter of 2013 came in at
$125.2 million, down 7.2% year over year, owing to decline in
compensation costs and course supplies expenses due to reduced
student enrollment. However, as a percentage of revenues, cost of
educational services increased 400 bps to 43.5% owing to a decline
in revenues, rise in bad debt expenses and media advertising cost,
partially offset by a decline in compensation expenses and other
scholarship related expenditure.
Student services and administrative (SSA) expenses remained flat
at $106.3 million in the first quarter of 2013. However, as a
percentage of revenues, SSA expenses increased 580 bps to 36.9%
owing to lower revenues and higher bad debt expenses.
Fiscal 2013 Outlook
For 2013, the company maintained its prior guidance. Earnings per
share are expected in the range of $3.50 – $4.00. The company
expects new student enrollment growth in the range of (5.0%) – 5%.
Revenue per student in 2013 is expected to decline in the range of
(6.0%) to (4.0%). The company intends to introduce new associate
degree programs in software development technology, industrial
engineering technology, medical assistance and administration at
some of the campuses in the Jun and Sept 2013 academic session.
The company expects earnings before interest, taxes,
depreciation and amortization (EBITDA) to range between $165
million to $190 million in fiscal 2013.
ITT Educational Services carries a Zacks Rank #4 (Sell).
Interestingly another education company, Apollo Group,
Inc. (APOL) surpassed the top- and bottom-line estimates
when it reported its results for the second quarter of fiscal 2013
on Mar 25. We believe that Apollo may have beaten the top- and
bottom-line estimates on the back of cost savings resulting from
its restructuring efforts.
Education stocks such as New Oriental Education &
Technology Group (EDU) and Xueda Education
Group (XUE) are currently performing well and are worth
considering. Xueda Education Group carries a Zacks Rank #1 (Strong
Buy), whereas New Oriental Education & Technology Group holds a
Zacks Rank #2 (Buy).
APOLLO GROUP (APOL): Free Stock Analysis Report
NEW ORIENTAL ED (EDU): Free Stock Analysis Report
ITT EDUCATIONAL (ESI): Free Stock Analysis Report
XUEDA EDUC-ADR (XUE): Free Stock Analysis Report
To read this article on Zacks.com click here.
Zacks Investment Research
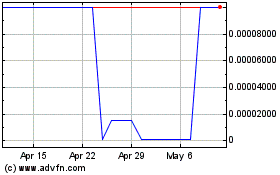
ITT Educational Services (CE) (USOTC:ESINQ)
Historical Stock Chart
From Mar 2024 to Apr 2024

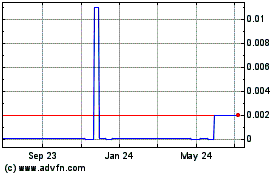
ITT Educational Services (CE) (USOTC:ESINQ)
Historical Stock Chart
From Apr 2023 to Apr 2024
