0001026214falseX100010262142023-11-012023-11-01
UNITED STATES
SECURITIES AND EXCHANGE COMMISSION
WASHINGTON, D.C. 20549
FORM 8-K
CURRENT REPORT
Pursuant to Section 13 or 15(d) of the Securities Exchange Act of 1934
Date of Report (Date of earliest event reported): November 1, 2023
Federal Home Loan Mortgage Corporation
(Exact name of registrant as specified in its charter)
Freddie Mac
| | | | | | | | | | | | | | |
Federally chartered
corporation | | 001-34139 | | 52-0904874 |
(State or other jurisdiction of
incorporation) | | (Commission
File Number) | | (IRS Employer
Identification No.) |
| | | | | | | | | | | | | | | | | | | | |
| 8200 Jones Branch Drive
| | | | |
| McLean, | Virginia | | | | 22102-3110 |
| (Address of principal executive offices) | | | | (Zip Code) |
Registrant’s telephone number, including area code: (703) 903-2000
(Former name or former address, if changed since last report)
Check the appropriate box below if the Form 8-K filing is intended to simultaneously satisfy the filing obligation of the registrant under any of the following provisions (see General Instruction A.2. below):
| | | | | |
| ☐ | Written communications pursuant to Rule 425 under the Securities Act (17 CFR 230.425) |
| | | | | |
| ☐ | Soliciting material pursuant to Rule 14a-12 under the Exchange Act (17 CFR 240.14a-12) |
| | | | | |
| ☐ | Pre-commencement communications pursuant to Rule 14d-2(b) under the Exchange Act (17 CFR 240.14d-2(b)) |
| | | | | |
| ☐ | Pre-commencement communications pursuant to Rule 13e-4(c) under the Exchange Act (17 CFR 240.13e-4(c)) |
Securities registered pursuant to Section 12(b) of the Act: | | | | | | | | |
| Title of each class | Trading Symbol(s) | Name of each exchange on which registered |
| None | N/A | N/A |
Indicate by check mark whether the registrant is an emerging growth company as defined in Rule 405 of the Securities Act of 1933 (§230.405 of this chapter) or Rule 12b-2 of the Securities Exchange Act of 1934 (§240.12b-2 of this chapter).
Emerging growth company ☐
If an emerging growth company, indicate by check mark if the registrant has elected not to use the extended transition period for complying with any new or revised financial accounting standards provided pursuant to Section 13(a) of the Exchange Act. ☐
Item 2.02. Results of Operations and Financial Condition.
On November 1, 2023, Freddie Mac (formally known as the Federal Home Loan Mortgage Corporation) announced its results of operations for the quarter ended September 30, 2023. A copy of the related press release for the quarter ended September 30, 2023 is being filed as Exhibit 99.1 to this report and is incorporated herein by reference. In addition, a copy of the Third Quarter 2023 Financial Results Supplement is being furnished as Exhibit 99.2 to this report and is incorporated herein by reference.
Exhibit 99.1 submitted herewith shall be deemed to be “filed” for purposes of Section 18 of the Securities Exchange Act of 1934.
Exhibit 99.2 submitted herewith shall not be deemed to be “filed” for purposes of Section 18 of the Securities Exchange Act of 1934, or otherwise subject to the liabilities of Section 18, nor shall it be deemed to be incorporated by reference into any disclosure document relating to Freddie Mac, except to the extent, if any, expressly set forth by specific reference in such document.
Item 9.01. Financial Statements and Exhibits.
(d) Exhibits.
The exhibits listed in the Exhibit Index below are being filed or furnished as part of this Current Report on Form 8-K:
| | | | | | | | |
| Exhibit Number | | Description of Exhibit |
| | | |
| 99.1 | |
|
| 99.2 | | |
| 104 | | Cover Page Interactive Data File - the cover page XBRL tags are embedded within the Inline XBRL document |
__________________________________________________________________________________________________________
Freddie Mac Form 8-K
SIGNATURE
Pursuant to the requirements of the Securities Exchange Act of 1934, the registrant has duly caused this report to be signed on its behalf by the undersigned hereunto duly authorized.
| | | | | | | | |
| FEDERAL HOME LOAN MORTGAGE CORPORATION |
| |
| By: | /s/ | Christian M. Lown |
| | Christian M. Lown |
| | Executive Vice President - Chief Financial Officer |
Date: November 1, 2023
__________________________________________________________________________________________________________
Freddie Mac Form 8-K
Freddie Mac Reports Net Income of $2.7 Billion for Third Quarter 2023
Making Home Possible for 389,000 Households in Third Quarter 2023
•Financed 271,000 mortgages, with 56% of eligible loans being affordable to low- to moderate-income families, and enabled 108,000 first-time homebuyers to purchase a home.
•Financed 118,000 rental units, with 90% of eligible units being affordable to low- to moderate-income families.
Third Quarter 2023 Financial Results
| | | | | | | | | | | | | | | | | | | | |
Market Liquidity Provided - $98 Billion | | Homes and Rental Units Financed - 389,000 | |
Net Worth - $44.7 Billion
| | Total Mortgage Portfolio - $3.5 Trillion |
| | | | | | | | | | | | | | |
| Consolidated | | •Net income of $2.7 billion, an increase of 104% year-over-year, with the increase primarily driven by a credit reserve release in Single-Family in the current period compared to a credit reserve build in Single-Family in the prior period. •Net revenues of $5.7 billion, an increase of 10% year-over-year, driven by higher net interest income and non-interest income. •Benefit for credit losses of $0.3 billion, primarily driven by increases in house price appreciation in Single-Family. •New business activity of $85 billion, down 30% year-over-year, as both home purchase activity and refinance activity slowed due to higher mortgage interest rates. •Mortgage portfolio of $3.0 trillion, up 2% year-over-year, as portfolio growth has moderated in recent periods due to the slowdown in new business activity. •Serious delinquency rate of 0.55%, down from 0.67% at September 30, 2022. •Completed approximately 18,000 loan workouts. •62% of mortgage portfolio covered by credit enhancements. •New business activity of $13 billion, down 7% year-over-year, as higher mortgage interest rates have reduced demand for multifamily financing. •Mortgage portfolio of $432 billion, up 4% year-over-year, as portfolio growth has moderated in recent periods due to the slowdown in new business activity. •Delinquency rate of 0.24%, up from 0.13% at September 30, 2022. •95% of mortgage portfolio covered by credit enhancements. | | “Freddie Mac delivered solid third quarter earnings while supporting the U.S. housing finance system. Fifteen years after entering conservatorship, Freddie Mac is a stronger, more focused company. Year to date, Freddie Mac has helped make home possible for more than 719,000 single-family homeowners and 292,000 renters and remains strongly committed to the mission of making owning or renting a home affordable and accessible for families across the country.”
Michael J. DeVito Chief Executive Officer |
| |
Net Revenues $5.7 Billion Net Income $2.7 Billion Comprehensive Income $2.7 Billion | | |
| | |
Single-Family | | |
| |
Net Revenues $4.9 Billion Net Income $2.3 Billion Comprehensive Income $2.3 Billion | | |
| | |
Multifamily | | |
| |
Net Revenues $0.8 Billion Net Income $0.4 Billion Comprehensive Income $0.4 Billion | | |
Freddie Mac Third Quarter 2023 Financial Results
November 1, 2023
Page 2
McLean, VA — Freddie Mac (OTCQB: FMCC) today reported net income of $2.7 billion for the third quarter of 2023, an increase of 104% year-over-year, with the increase primarily driven by a credit reserve release in Single-Family in the current period compared to a credit reserve build in Single-Family in the prior period.
Net revenues were $5.7 billion, up 10% year-over-year, driven by higher net interest income and non-interest income. Net interest income was $4.7 billion, up 4% year-over-year, primarily driven by higher investments net interest income as a result of higher short-term interest rates, partially offset by lower deferred fee income due to slower mortgage prepayment activity. Non-interest income was $0.9 billion, up 50% year-over year, primarily driven by higher guarantee income in Multifamily and higher net investment gains.
Benefit for credit losses was $0.3 billion for the third quarter of 2023, primarily driven by a credit reserve release in Single-Family due to increases in observed and forecasted house price appreciation, partially offset by a credit reserve build in Multifamily due to deterioration in overall loan performance. The provision for credit losses of $1.8 billion for the third quarter of 2022 was primarily driven by a credit reserve build in Single-Family due to deterioration in housing market conditions, including lower observed and forecasted house price appreciation.
Non-interest expense was $2.6 billion, up 41% year-over-year, primarily driven by an accrual of $0.3 billion for an adverse judgment at trial and a decrease in credit enhancement recoveries due to a decline in expected credit losses on covered loans.
Summary of Consolidated Statements of Income and Comprehensive Income | | | | | | | | | | | | | | | | | | | | | | | | | | | | | | | | |
(Dollars in millions) | | 3Q 2023 | | 2Q 2023 | | Change | | 3Q 2022 | | Change |
| Net interest income | | $4,749 | | $4,523 | | $226 | | $4,554 | | $195 |
| Non-interest income | | 941 | | 816 | | 125 | | 627 | | 314 |
| Net revenues | | 5,690 | | 5,339 | | 351 | | 5,181 | | | 509 |
| (Provision) benefit for credit losses | | 263 | | 537 | | (274) | | (1,796) | | | 2,059 |
| Non-interest expense | | (2,576) | | (2,204) | | (372) | | (1,825) | | (751) |
| Income before income tax expense | | 3,377 | | 3,672 | | (295) | | 1,560 | | | 1,817 |
| Income tax expense | | (692) | | (728) | | 36 | | (247) | | | (445) |
| Net income | | 2,685 | | 2,944 | | (259) | | 1,313 | | 1,372 |
| Other comprehensive income (loss), net of taxes and reclassification adjustments | | 19 | | (54) | | 73 | | (181) | | | 200 |
| Comprehensive income | | $2,704 | | $2,890 | | ($186) | | $1,132 | | $1,572 |
|
| Conservatorship metrics (in millions) | | | | | | | | | | |
| Net worth | | $44,661 | | $41,957 | | $2,704 | | $35,230 | | $9,431 |
| Senior preferred stock liquidation preference | | 114,605 | | 111,715 | | 2,890 | | 106,746 | | 7,859 |
| Remaining Treasury funding commitment | | 140,162 | | 140,162 | | — | | 140,162 | | — |
| Cumulative dividend payments to Treasury | | 119,680 | | 119,680 | | — | | 119,680 | | — |
| Cumulative draws from Treasury | | 71,648 | | 71,648 | | — | | 71,648 | | — |
| | | | | | | | | | |
| | | | | | | | | | |
| | | | | | | | | | |
| | | | | | | | | | |
| | | | | | | | | | |
| | | | | | | | | | |
| | | | | | | | | | |
| | | | | | | | | | |
| | | | | | | | | | |
| | | | | | | | | | |
| | | | | | | | | | |
| | | | | | | | | | |
| | | | | | | | | | |
| | | | | | | | | | |
| | | | | | | | | | |
| | | | | | | | | | |
| | | | | | | | | | |
| | | | | | | | | | |
| | | | | | | | | | |
| | | | | | | | | | |
Freddie Mac Third Quarter 2023 Financial Results
November 1, 2023
Page 3
| | |
| Single-Family Segment |
| Financial Results |
Net Revenues
(In billions)
Comprehensive Income
(In billions)
| | | | | | | | | | | | | | | | | | | | | | | | | | | | | | | | |
| (Dollars in millions) | | 3Q 2023 | | 2Q 2023 | | Change | | 3Q 2022 | | Change |
| Net interest income | | $4,534 | | $4,295 | | $239 | | $4,363 | | $171 |
| Non-interest income | | 393 | | 65 | | 328 | | 58 | | 335 |
| Net revenues | | 4,927 | | 4,360 | | 567 | | 4,421 | | 506 |
| (Provision) benefit for credit losses | | 304 | | 638 | | (334) | | (1,784) | | 2,088 |
| Non-interest expense | | (2,310) | | (2,028) | | (282) | | (1,653) | | (657) |
| Income before income tax expense | | 2,921 | | 2,970 | | (49) | | 984 | | 1,937 |
| Income tax expense | | (598) | | (589) | | (9) | | (141) | | (457) |
| Net income | | 2,323 | | 2,381 | | (58) | | 843 | | 1,480 |
| Other comprehensive income (loss), net of taxes and reclassification adjustments | | (6) | | 2 | | (8) | | (39) | | 33 | |
| Comprehensive income | | $2,317 | | $2,383 | | ($66) | | $804 | | $1,513 |
Third Quarter 2023
Net income of $2.3 billion, up 176% year-over-year.
•Net revenues were $4.9 billion, up 11% year-over year. Net interest income was $4.5 billion, up 4% year-over-year, primarily driven by higher investments net interest income as a result of higher short-term interest rates, partially offset by lower deferred fee income due to slower mortgage prepayment activity.
•Benefit for credit losses was $0.3 billion for the third quarter of 2023, primarily driven by a credit reserve release due to increases in observed and forecasted house price appreciation. The provision for credit losses of $1.8 billion for the third quarter of 2022 was primarily driven by a deterioration in housing market conditions, including lower observed and forecasted house price appreciation.
•Non-interest expense was $2.3 billion for the third quarter of 2023, up 40% year-over-year, primarily driven by an allocation of $250 million for the accrual for an adverse judgment at trial and a decrease in credit enhancement recoveries due to a decline in expected credit losses on covered loans.
Freddie Mac Third Quarter 2023 Financial Results
November 1, 2023
Page 4
| | |
| Single-Family Segment |
| Business Results |
New Business Activity
(UPB in billions)
Mortgage Portfolio
(UPB in billions)
| | | | | | | | | | | | | | | | | | | | | | | | | | | | | | | | |
| | 3Q 2023 | | 2Q 2023 | | Change | | 3Q 2022 | | Change |
| New Business Statistics: | | | | | | | | | | |
| Single-Family homes funded (in thousands) | | 271 | | | 258 | | | 13 | | 392 | | (121) |
| Purchase borrowers (in thousands) | | 233 | | | 217 | | | 16 | | 297 | | (64) |
| Refinance borrowers (in thousands) | | 38 | | | 41 | | | (3) | | 95 | | (57) |
Affordable to low- to moderate-income families (%)(1) | | 56 | | | 55 | | | 1 | | | 56 | | | — | |
First-time homebuyers (%)(2) | | 50 | | | 52 | | | (2) | | | 49 | | | 1 | |
| Average estimated guarantee fee rate (bps) | | 55 | | | 57 | | | (2) | | 54 | | 1 |
| Weighted average original loan-to-value (LTV) (%) | | 78 | | | 79 | | | (1) | | | 78 | | | — | |
| Weighted average original credit score | | 753 | | | 751 | | | 2 | | 747 | | 6 |
| UPB covered by new CRT issuance (in billions) | | $8 | | $56 | | ($48) | | $136 | | ($128) |
| Portfolio Statistics: | | | | | | | | | | |
| Average estimated guarantee fee rate (bps) | | 48 | | 48 | | — | | 48 | | — |
| Weighted average current LTV (%) | | 53 | | | 54 | | | (1) | | | 53 | | | — | |
| Weighted average current credit score | | 756 | | 756 | | — | | 756 | | — |
| Loan count (in millions) | | 13.7 | | 13.6 | | 0.1 | | 13.6 | | 0.1 |
| Credit-Related Statistics: | | | | | | | | | | |
| Loan workout activity (in thousands) | | 18 | | 20 | | (2) | | 28 | | (10) |
| Credit enhancement coverage (%) | | 62 | | | 62 | | | — | | | 61 | | | 1 | |
(1) Eligible loans acquired affordable to families earning at or below 120% of area median income (AMI).
(2) Calculated as a percentage of purchase borrowers with loans secured by primary residences.
Business Highlights
•The percentage of new acquisitions represented by purchase loans increased in the third quarter of 2023, compared to the third quarter of 2022, as refinance activity slowed due to higher mortgage interest rates. First-time homebuyers represented 50% of new single-family home purchase loans.
•The UPB of mortgage loans covered by CRT transactions issued during the third quarter of 2023 decreased compared to the third quarter of 2022 due to a decrease in loan acquisition activity in recent quarters and changes in business strategy and market conditions.
•Single-Family loan workout activity decreased to 18,000 from 28,000 in the third quarter of 2022, as the seriously delinquent loan population continued to decline.
•Credit enhancement coverage of the Single-Family mortgage portfolio increased to 62% at September 30, 2023, up from 61% at September 30, 2022.
Freddie Mac Third Quarter 2023 Financial Results
November 1, 2023
Page 5
| | |
| Multifamily Segment |
Financial Results |
Net Revenues
(In billions)
Net Income
(In billions)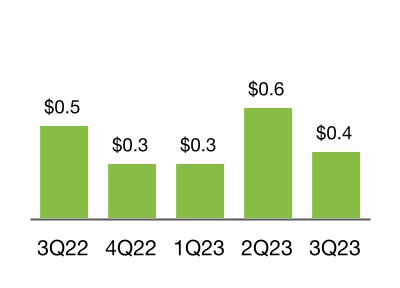
Comprehensive Income
(In billions)
| | | | | | | | | | | | | | | | | | | | | | | | | | | | | | | | |
(Dollars in millions) | | 3Q 2023 | | 2Q 2023 | | Change | | 3Q 2022 | | Change |
| Net interest income | | $215 | | $228 | | ($13) | | $191 | | $24 |
| Non-interest income | | 548 | | 751 | | (203) | | 569 | | (21) |
| Net revenues | | 763 | | 979 | | (216) | | 760 | | | 3 |
| (Provision) benefit for credit losses | | (41) | | (101) | | 60 | | (12) | | | (29) |
| Non-interest expense | | (266) | | (176) | | (90) | | (172) | | | (94) |
| Income before income tax expense | | 456 | | 702 | | (246) | | 576 | | | (120) |
| Income tax expense | | (94) | | (139) | | 45 | | (106) | | | 12 |
| Net income | | 362 | | 563 | | (201) | | 470 | | | (108) |
| Other comprehensive income (loss), net of taxes and reclassification adjustments | | 25 | | (56) | | 81 | | (142) | | | 167 |
| Comprehensive income | | $387 | | $507 | | ($120) | | $328 | | $59 |
Third Quarter 2023
Net income of $0.4 billion, down 23% year-over-year.
•Net revenues remained $0.8 billion, essentially unchanged year-over-year.
•Provision for credit losses was $41 million in the third quarter of 2023, driven by a credit reserve build due to deterioration in overall loan performance.
•Non-interest expense was $0.3 billion, up 55% year-over-year, primarily driven by an allocation of $63 million for the accrual for an adverse judgment at trial.
Freddie Mac Third Quarter 2023 Financial Results
November 1, 2023
Page 6
| | |
| Multifamily Segment |
| Business Results |
New Business Activity
(UPB in billions)
Mortgage Portfolio
(UPB in billions)
| | | | | | | | | | | | | | | | | | | | | | | | | | | | | | | | |
| | 3Q 2023 | | 2Q 2023 | | Change | | 3Q 2022 | | Change |
| New Business Statistics: | | | | | | | | | | |
Number of rental units financed (in thousands)(1) | | 118 | | 114 | | 4 | | 150 | | (32) |
Affordable to low-income families (%)(2) | | 66 | | | 67 | | | (1) | | | 75 | | | (9) | |
Affordable to low- to moderate-income families (%)(3) | | 90 | | | 90 | | | — | | | 96 | | | (6) | |
| Weighted average original LTV (%) | | 60 | | | 58 | | | 2 | | | 59 | | 1 | |
| Weighted average original debt service coverage ratio | | 1.26 | | 1.27 | | (0.01) | | 1.31 | | (0.05) |
| UPB covered by new CRT issuance (in billions) | | $17 | | $16 | | $1 | | $11 | | $6 |
| Portfolio Statistics: | | | | | | | | | | |
| Average guarantee fee rate charged (bps) | | 46 | | 45 | | 1 | | 43 | | 3 |
| Credit-Related Statistics: | | | | | | | | | | |
| Credit enhancement coverage (%) | | 95 | | | 94 | | | 1 | | | 95 | | | — | |
(1) Includes rental units financed by supplemental loans.
(2) Eligible units acquired affordable to families earning at or below 80% of AMI.
(3) Eligible units acquired affordable to families earning at or below 120% of AMI.
Business Highlights
•The company provided financing for 118,000 multifamily rental units. 66% of the eligible multifamily rental units financed were affordable to low-income families.
•The Multifamily delinquency rate increased to 0.24% at September 30, 2023 primarily driven by an increase in delinquent loans in our senior housing and small balance loan portfolios. 94% of the delinquent loans in the Multifamily mortgage portfolio have credit enhancement coverage, while 95% of all loans in the Multifamily mortgage portfolio have credit enhancement coverage.
•The UPB of mortgage loans covered by new CRT transactions increased in the third quarter of 2023, compared to the third quarter of 2022, primarily due to the issuance of Multifamily Credit Insurance Pool (MCIP) and Structured Credit Risk (SCR) Trust note transactions. There were no MCIP or SCR Trust note transactions in the third quarter of 2022.
Freddie Mac Third Quarter 2023 Financial Results
November 1, 2023
Page 7
About Freddie Mac’s Conservatorship
Since September 2008, Freddie Mac has been operating under conservatorship with FHFA as Conservator. The support provided by Treasury pursuant to the Purchase Agreement enables the company to maintain access to the debt markets and have adequate liquidity to conduct its normal business operations. The amount of funding available to Freddie Mac under the Purchase Agreement was $140.2 billion at September 30, 2023.
Pursuant to the Purchase Agreement, Freddie Mac will not be required to pay a dividend to Treasury on the senior preferred stock until it has built sufficient capital to meet the capital requirements and buffers set forth in the Enterprise Regulatory Capital Framework. As a result, the company was not required to pay a dividend to Treasury on the senior preferred stock in September 2023. As the company builds capital during this period, the quarterly increases in its Net Worth Amount have been, or will be, added to the aggregate liquidation preference of the senior preferred stock. The liquidation preference of the senior preferred stock increased to $114.6 billion on September 30, 2023 based on the increase in the Net Worth Amount during the second quarter of 2023, and will increase to $117.3 billion on December 31, 2023 based on the increase in the Net Worth Amount during the third quarter of 2023.
Additional Information
For more information, including information related to Freddie Mac’s financial results, conservatorship, and related matters, see the company’s Quarterly Report on Form 10-Q for the quarter ended September 30, 2023 and the company’s Third Quarter 2023 Financial Results Supplement. These documents are available on the Investor Relations page of the company’s website at www.FreddieMac.com.
Additional information about Freddie Mac and its business is also set forth in the company’s other filings with the SEC, which are available on the Investor Relations page of the company’s website at www.FreddieMac.com and the SEC’s website at www.sec.gov. Freddie Mac encourages all investors and interested members of the public to review these materials for a more complete understanding of the company’s financial results and related disclosures.
Webcast Announcement
Management will host a conference call at 9 a.m. Eastern Time on November 1, 2023 to share the company’s results with the media. The conference call will be concurrently webcast. To access the audio webcast, use the following link: https://edge.media-server.com/mmc/p/eokmx68e. The replay will be available on the company’s website at www.FreddieMac.com for approximately 30 days. All materials related to the call will be available on the Investor Relations page of the company’s website at www.FreddieMac.com.
| | | | | |
| |
| Media Contact: Frederick Solomon (703) 903-3861 | Investor Contact: Mahesh Lal (571) 382-4732 |
| |
* * * *
This press release contains forward-looking statements, which may include statements pertaining to the conservatorship, the company’s current expectations and objectives for its Single-Family and Multifamily segments, its efforts to assist the housing market, liquidity and capital management, economic and market conditions and trends including, but not limited to, changes in observed and forecasted house price appreciation, its market share, the effect of legislative and regulatory developments and new accounting guidance, the credit quality of loans the company owns or guarantees, the costs and benefits of the company’s CRT transactions, banking crises or failures, the effects of natural disasters, other catastrophic events, and significant climate change effects and actions taken in response thereto on its business, results of operations, and financial condition. Forward-looking statements involve known and unknown risks and uncertainties, some of which are beyond the company’s control. Management’s expectations for the company’s future necessarily involve a number of assumptions, judgments, and estimates, and various factors, including changes in economic and market conditions, liquidity, mortgage spreads, credit outlook, actions by the U.S. government (including FHFA, Treasury, and Congress) and state and local governments, changes in the fiscal and monetary policies of the Federal Reserve, the impact of any downgrade in our credit ratings or those of the U.S. government, and the impacts of legislation or regulations and new or amended accounting guidance, that could cause actual results to differ materially from these expectations. These assumptions, judgments, estimates, and factors are discussed in the company’s Annual Report on Form 10-K for the year ended December 31, 2022, Quarterly Report on Form 10-Q for the quarters ended March 31, 2023, June 30, 2023, and September 30, 2023, and Current Reports on Form 8-
Freddie Mac Third Quarter 2023 Financial Results
November 1, 2023
Page 8
K, which are available on the Investor Relations page of the company’s website at www.FreddieMac.com and the SEC’s website at www.sec.gov. The company undertakes no obligation to update forward-looking statements it makes to reflect events or circumstances occurring after the date of this press release.
Freddie Mac makes home possible for millions of families and individuals by providing mortgage capital to lenders. Since its creation by Congress in 1970, the company has made housing more accessible and affordable for homebuyers and renters in communities nationwide. The company is building a better housing finance system for homebuyers, renters, lenders, and taxpayers. Learn more at FreddieMac.com, Twitter @FreddieMac and Freddie Mac’s blog FreddieMac.com/blog.
Freddie Mac Third Quarter 2023 Financial Results
November 1, 2023
Page 9
FREDDIE MAC
Condensed Consolidated Statements of Income and Comprehensive Income (Unaudited)
| | | | | | | | | | | | | | | | | | | | |
| | |
(In millions, except share-related amounts) | | 3Q 2023 | | 2Q 2023 | | 3Q 2022 |
| Net interest income | | | | | | |
| Interest income | | $26,799 | | $25,755 | | $21,894 |
| Interest expense | | (22,050) | | | (21,232) | | | (17,340) | |
| Net interest income | | 4,749 | | | 4,523 | | | 4,554 | |
| Non-interest income | | | | | | |
| Guarantee income | | 301 | | | 309 | | | 125 | |
| Investment gains, net | | 555 | | | 411 | | | 415 | |
| Other income | | 85 | | | 96 | | | 87 | |
| Non-interest income | | 941 | | | 816 | | | 627 | |
| Net revenues | | 5,690 | | | 5,339 | | | 5,181 | |
| (Provision) benefit for credit losses | | 263 | | | 537 | | | (1,796) | |
| Non-interest expense | | | | | | |
| Salaries and employee benefits | | (418) | | | (405) | | | (387) | |
| Credit enhancement expense | | (634) | | | (590) | | | (542) | |
| Benefit for (decrease in) credit enhancement recoveries | | (103) | | | (108) | | | 210 | |
| Legislative assessments expense | | (757) | | | (751) | | | (753) | |
| Other expense | | (664) | | | (350) | | | (353) | |
| Non-interest expense | | (2,576) | | | (2,204) | | | (1,825) | |
| Income before income tax expense | | 3,377 | | | 3,672 | | | 1,560 | |
| Income tax expense | | (692) | | | (728) | | | (247) | |
| Net income | | 2,685 | | | 2,944 | | | 1,313 | |
| Other comprehensive income (loss), net of taxes and reclassification adjustments | | 19 | | | (54) | | | (181) | |
| Comprehensive income | | $2,704 | | $2,890 | | $1,132 |
| Net income | | $2,685 | | $2,944 | | $1,313 |
| Amounts attributable to senior preferred stock | | (2,704) | | (2,890) | | (1,132) |
| Net income attributable to common stockholders | | ($19) | | $54 | | $181 |
| Net income per common share | | ($0.01) | | $0.02 | | $0.06 |
| Weighted average common shares (in millions) | | 3,234 | | | 3,234 | | | 3,234 | |
Freddie Mac Third Quarter 2023 Financial Results
November 1, 2023
Page 10
FREDDIE MAC
Condensed Consolidated Balance Sheets (Unaudited) | | | | | | | | | | | | | | |
| | September 30, | | December 31, |
(In millions, except share-related amounts) | | 2023 | | 2022 |
| Assets | | | | |
Cash and cash equivalents (includes $655 and $707 of restricted cash and cash equivalents) | | $5,354 | | $6,360 |
| Securities purchased under agreements to resell | | 115,161 | | | 87,295 | |
| Investment securities, at fair value | | 39,443 | | | 38,701 | |
Mortgage loans held-for-sale (includes $8,071 and $3,218 at fair value) | | 13,905 | | | 12,197 | |
Mortgage loans held-for-investment (net of allowance for credit losses of $6,948 and $7,391 and includes $1,309 and $1,214 at fair value) | | 3,060,822 | | | 3,022,318 | |
| Accrued interest receivable, net | | 9,526 | | | 8,529 | |
| Deferred tax assets, net | | 4,875 | | | 5,777 | |
Other assets (includes $5,798 and $5,890 at fair value) | | 22,555 | | | 27,156 | |
| Total assets | | $3,271,641 | | $3,208,333 |
| Liabilities and equity | | | | |
| Liabilities | | | | |
| Accrued interest payable | | $8,451 | | $7,309 |
Debt (includes $2,597 and $3,047 at fair value) | | 3,202,097 | | | 3,145,832 | |
Other liabilities (includes $1,128 and $759 at fair value) | | 16,432 | | | 18,174 | |
| Total liabilities | | 3,226,980 | | | 3,171,315 | |
| Commitments and contingencies | | | | |
| Equity | | | | |
Senior preferred stock (liquidation preference of $114,605 and $107,878) | | 72,648 | | | 72,648 | |
| Preferred stock, at redemption value | | 14,109 | | | 14,109 | |
Common stock, $0.00 par value, 4,000,000,000 shares authorized, 725,863,886 shares issued and 650,059,553 shares outstanding | | — | | | — | |
| | | | |
| Retained earnings | | (38,042) | | | (45,666) | |
| AOCI, net of taxes, related to: | | | | |
| Available-for-sale securities | | (71) | | | (84) | |
| Other | | (98) | | | (104) | |
| Total AOCI, net of taxes | | (169) | | | (188) | |
Treasury stock, at cost, 75,804,333 shares | | (3,885) | | | (3,885) | |
| Total equity | | 44,661 | | | 37,018 | |
| Total liabilities and equity | | $3,271,641 | | $3,208,333 |
The table below presents the carrying value and classification of the assets and liabilities of consolidated variable interest entities (VIEs) on the company's condensed consolidated balance sheets. |
| | September 30, | | December 31, |
| (In millions) | | 2023 | | 2022 |
| Assets: | | | | |
Cash and cash equivalents (includes $566 and $610 of restricted cash and cash equivalents) | | $567 | | $611 | |
| Securities purchased under agreements to resell | | 10,786 | | 9,703 | |
| Investment securities, at fair value | | 82 | | 126 |
| Mortgage loans held-for-investment, net | | 3,019,212 | | 2,971,601 |
| Accrued interest receivable, net | | 8,594 | | 7,944 | |
| Other assets | | 5,536 | | | 5,019 | |
| Total assets of consolidated VIEs | | $3,044,777 | | $2,995,004 |
| Liabilities: | | | | |
| Accrued interest payable | | $7,280 | | $6,619 |
| Debt | | 3,027,175 | | 2,979,070 |
| | | | |
| | | | |
| Total liabilities of consolidated VIEs | | $3,034,455 | | $2,985,689 |

© Freddie Mac Third Quarter 2023 Financial Results Supplement November 1, 2023 Exhibit 99.2

© Freddie Mac 2 Financial Highlights $5.2 $4.8 $4.8 $5.3 $5.7 $1.3 $1.8 $2.0 $2.9 $2.7 Net revenues Net income 3Q22 4Q22 1Q23 2Q23 3Q23 Net revenues and net income $ Billions ▪ Net income of $2.7 billion for the third quarter of 2023, an increase of 104% year-over-year, with the increase primarily driven by a credit reserve release in Single-Family in the current period compared to a credit reserve build in Single-Family in the prior period. ▪ Net revenues of $5.7 billion for the third quarter of 2023, an increase of 10% year-over-year, driven by higher net interest income and non-interest income.

© Freddie Mac 3 $3,387 $3,415 $3,415 $3,431 $3,456 $2,971 $2,986 $2,989 $3,004 $3,024 $416 $429 $426 $427 $432 Single-Family mortgage portfolio Multifamily mortgage portfolio 09/30/22 12/31/22 03/31/23 06/30/23 09/30/23 Mortgage Portfolio Balances Mortgage portfolio1 UPB in $ Billions 2% YoY increase 4% YoY increase 2% YoY increase ▪ Total mortgage portfolio increased 2% year-over-year to $3.5 trillion, driven by a 2% increase in the Single- Family mortgage portfolio and a 4% increase in the Multifamily mortgage portfolio.

© Freddie Mac 4 $44.7 $114.6 $140.2 Net worth Senior preferred stock liquidation preference Remaining Treasury funding commitment As of September 30, 2023 Conservatorship Matters Pursuant to the Purchase Agreement, Freddie Mac will not be required to pay a dividend to Treasury until it has built sufficient capital to meet the capital requirements and buffers set forth in the Enterprise Regulatory Capital Framework (ERCF). Draws and dividend payments $ Billions Net worth, liquidation preference, and Treasury funding commitment $ Billions $71.6 $119.7 Cumulative draws from Treasury Cumulative dividend payments to Treasury As of September 30, 2023 2

© Freddie Mac 5 National home prices increased by an average of 5.2% over the past year 6.70% 6.42% 6.32% 6.71% 7.31% 2.47% 4.06% 4.63% 5.07% 5.32% 30-year mortgage rate, based on Primary Mortgage Market Survey (PMMS) SOFR 09/30/22 12/31/22 03/31/23 06/30/23 09/30/23 Key Economic Indicators Quarterly ending interest rates SOFR interest rates are 30-day average rates.

© Freddie Mac 6 $2,971 $2,986 $2,989 $3,004 $3,024 3Q22 4Q22 1Q23 2Q23 3Q23 0.79% 0.94% 0.76% 0.88% 0.99% 0.20% 0.24% 0.20% 0.21% 0.24% 0.67% 0.66% 0.62% 0.56% 0.55% One month past due Two months past due Seriously delinquent 3Q22 4Q22 1Q23 2Q23 3Q23 $121 $75 $59 $83 $85 $98 $63 $51 $73 $76 $23 $12 $10 $9 54 51 55 57 55 Home purchase Refinance 3Q22 4Q22 1Q23 2Q23 3Q23 Single-Family Financial Highlights and Key Metrics $4.4 $4.2 $4.2 $4.4 $4.9 $0.8 $1.5 $1.7 $2.4 $2.3 Net revenues Net income 3Q22 4Q22 1Q23 2Q23 3Q23 Net revenues and net income $ Billions 2% YoY increase Mortgage portfolio UPB in $ Billions Average estimated guarantee fee rate on new acquisitions (bps)3 Delinquency rates New business activity UPB in $ Billions $8

© Freddie Mac 7 78% 78% 79% 79% 78% 3Q22 4Q22 1Q23 2Q23 3Q23 80% 84% 86% 88% 89% 16% 12% 9% 8% 8%4% 4% 5% 4% Home purchase Cash-out refinance Other refinance 3Q22 4Q22 1Q23 2Q23 3Q23 747 747 749 751 753 3Q22 4Q22 1Q23 2Q23 3Q23 19% 22% 23% 26% 29% 3Q22 4Q22 1Q23 2Q23 3Q23 New business activity with debt-to-income ratio > 45% Weighted average original loan-to-value ratio (OLTV) Weighted average original credit score Single-Family Loan Purchase Credit Characteristics Loan purpose 3%

© Freddie Mac 8 UPB covered by new CRT issuance $ Billions $136 $58 $15 $56 $8 3Q22 4Q22 1Q23 2Q23 3Q23 Mortgage portfolio with credit enhancement UPB in $ Billions Single-Family Credit Risk Transfer $1,803 $1,832 $1,840 $1,864 $1,865 61% 61% 62% 62% 62% UPB Percentage 09/30/22 12/31/22 03/31/23 06/30/23 09/30/23

© Freddie Mac 9 $14 $29 $6 $13 $13 3Q22 4Q22 1Q23 2Q23 3Q23 0.13% 0.24% 0.15% 0.21% 0.99% 0.55% Freddie Mac (60+ day) FDIC insured institutions (90+ day) MF CMBS market (60+ day) 3Q22 4Q22 1Q23 2Q23 3Q23 Multifamily delinquency rates $416 $429 $426 $427 $432 3Q22 4Q22 1Q23 2Q23 3Q23 Multifamily Financial Highlights and Key Metrics $0.8 $0.6 $0.6 $1.0 $0.8 $0.5 $0.3 $0.3 $0.6 $0.4 Net revenues Net income 3Q22 4Q22 1Q23 2Q23 3Q23 (89 %) New business activity $ Billions 4% YoY increase The delinquency rate for FDIC insured institutions is as of June 30, 2023 (latest available information). Certain MF CMBS market delinquency rates have been updated to reflect revised historical data. Mortgage portfolio UPB in $ Billions Net revenues and net income $ Billions

© Freddie Mac 10 Acquisitions of units by area median income (AMI) (% of eligible units acquired) 44% 34% 44% 38% 36% 31% 33% 25% 29% 30% 21% 28% 22% 23% 24% 4% 5% 9% 10% 10% ≤60% >60% to ≤80% >80% to ≤120% >120% 3Q22 4Q22 1Q23 2Q23 3Q23 1.31 1.25 1.27 1.27 1.26 59% 58% 57% 58% 60% Weighted average ODSCR Weighted average OLTV ratio 3Q22 4Q22 1Q23 2Q23 3Q23 Multifamily New Business Characteristics (89 %) Weighted average original debt service coverage ratio (ODSCR) and weighted average OLTV ratio

© Freddie Mac 11 $394 $398 $396 $402 $410 95% 93% 93% 94% 95% UPB Percentage 09/30/22 12/31/22 03/31/23 06/30/23 09/30/23 Mortgage portfolio with credit enhancement UPB in $ Billions $11 $16 $8 $16 $17 3Q22 4Q22 1Q23 2Q23 3Q23 Multifamily Credit Risk Transfer UPB covered by new CRT issuance $ Billions

© Freddie Mac 12 28 22 24 20 18 6 6 7 6 5 12 10 11 9 7 10 6 6 5 6 Forbearance and other Payment deferral plans Loan modifications 3Q22 4Q22 1Q23 2Q23 3Q23 Number of families Freddie Mac helped to own or rent a home4 In Thousands Housing Market Support 542 504 250 372 389 95 52 33 41 38 297 200 157 217 233 150 252 60 114 118 Single-Family refinance borrowers Single-Family home purchase borrowers Multifamily rental units 3Q22 4Q22 1Q23 2Q23 3Q23 Other includes repayment plans and foreclosure alternatives. 6 Number of Single-Family loan workouts5 In Thousands 6 6

© Freddie Mac 13 Endnotes 1 Based on unpaid principal balances (UPB) of mortgage loans held-for-investment, mortgage loans held-for-sale, and mortgage loans underlying our mortgage-related guarantees. 2 Includes the initial $1 billion liquidation preference of the senior preferred stock issued to Treasury in September 2008, the $71.6 billion of draws from Treasury, and the $42.0 billion in increases to our Net Worth Amount pursuant to the Purchase Agreement. 3 Represents the estimated average rate of guarantee fees for new acquisitions during the period assuming amortization of upfront fees using the estimated life of the related loans rather than the original contractual maturity date of the related loans. Net of the legislated 10 basis point fee remitted to Treasury pursuant to the Temporary Payroll Tax Cut Continuation Act of 2011 as extended by the Infrastructure Investment and Jobs Act. 4 Based on the company’s purchases of loans and issuances of mortgage-related securities. For the periods presented, a single-family borrower may be counted more than once if the company purchased more than one loan (purchase or refinance mortgage) relating to the same borrower. For Multifamily, rental units include units financed by supplemental loans. 5 Consists of both home retention actions and foreclosure alternatives. 6 Categories are not mutually exclusive, and a borrower in one category may also be included in another category in the same or another period. For example, a borrower helped through a home retention action in one period may subsequently lose his or her home through a foreclosure alternative in a later period.

© Freddie Mac 14 Safe Harbor Statements Freddie Mac obligations Freddie Mac’s securities are obligations of Freddie Mac only. The securities, including any interest or return of discount on the securities, are not guaranteed by and are not debts or obligations of the United States or any federal agency or instrumentality other than Freddie Mac. No offer or solicitation of securities This presentation includes information related to, or referenced in the offering documentation for, certain Freddie Mac securities, including offering circulars and related supplements and agreements. Freddie Mac securities may not be eligible for offer or sale in certain jurisdictions or to certain persons. This information is provided for your general information only, is current only as of its specified date and does not constitute an offer to sell or a solicitation of an offer to buy securities. The information does not constitute a sufficient basis for making a decision with respect to the purchase or sale of any security. All information regarding or relating to Freddie Mac securities is qualified in its entirety by the relevant offering circular and any related supplements. Investors should review the relevant offering circular and any related supplements before making a decision with respect to the purchase or sale of any security. In addition, before purchasing any security, please consult your legal and financial advisors for information about and analysis of the security, its risks and its suitability as an investment in your particular circumstances. Forward-looking statements Freddie Mac's presentations may contain forward-looking statements, which may include statements pertaining to the conservatorship, the company’s current expectations and objectives for its Single-Family and Multifamily segments, its efforts to assist the housing market, liquidity and capital management, economic and market conditions and trends including, but not limited to, changes in observed and forecasted house price appreciation, its market share, the effect of legislative and regulatory developments and new accounting guidance, the credit quality of loans the company owns or guarantees, the costs and benefits of the company’s CRT transactions, bank crises or failures, the effects of natural disasters, other catastrophic events, and significant climate change effects and actions taken in response thereto on its business, results of operations, and financial condition. Forward-looking statements involve known and unknown risks and uncertainties, some of which are beyond the company’s control. Management’s expectations for the company’s future necessarily involve a number of assumptions, judgments, and estimates, and various factors, including changes in economic and market conditions, liquidity, mortgage spreads, credit outlook, actions by the U.S. government (including FHFA, Treasury, and Congress) and state and local governments, changes in the fiscal and monetary policies of the Federal Reserve, the impact of any downgrade in our credit ratings or those of the U.S. government, and the impacts of legislation or regulations and new or amended accounting guidance, that could cause actual results to differ materially from these expectations. These assumptions, judgments, estimates and factors are discussed in the company’s Annual Report on Form 10-K for the year ended December 31, 2022, Quarterly Reports on Form 10-Q for the quarters ended March 31, 2023, June 30, 2023, and September 30, 2023, and Current Reports on Form 8-K, which are available on the Investor Relations page of the company’s website at www.freddiemac.com and the SEC’s website at www.sec.gov. The company undertakes no obligation to update forward-looking statements it makes to reflect events or circumstances occurring after the date of this presentation.
v3.23.3
| X |
- DefinitionBoolean flag that is true when the XBRL content amends previously-filed or accepted submission.
| Name: |
dei_AmendmentFlag |
| Namespace Prefix: |
dei_ |
| Data Type: |
xbrli:booleanItemType |
| Balance Type: |
na |
| Period Type: |
duration |
|
| X |
- DefinitionFor the EDGAR submission types of Form 8-K: the date of the report, the date of the earliest event reported; for the EDGAR submission types of Form N-1A: the filing date; for all other submission types: the end of the reporting or transition period. The format of the date is YYYY-MM-DD.
| Name: |
dei_DocumentPeriodEndDate |
| Namespace Prefix: |
dei_ |
| Data Type: |
xbrli:dateItemType |
| Balance Type: |
na |
| Period Type: |
duration |
|
| X |
- DefinitionThe type of document being provided (such as 10-K, 10-Q, 485BPOS, etc). The document type is limited to the same value as the supporting SEC submission type, or the word 'Other'.
| Name: |
dei_DocumentType |
| Namespace Prefix: |
dei_ |
| Data Type: |
dei:submissionTypeItemType |
| Balance Type: |
na |
| Period Type: |
duration |
|
| X |
- DefinitionAddress Line 1 such as Attn, Building Name, Street Name
| Name: |
dei_EntityAddressAddressLine1 |
| Namespace Prefix: |
dei_ |
| Data Type: |
xbrli:normalizedStringItemType |
| Balance Type: |
na |
| Period Type: |
duration |
|
| X |
- Definition
+ References
+ Details
| Name: |
dei_EntityAddressCityOrTown |
| Namespace Prefix: |
dei_ |
| Data Type: |
xbrli:normalizedStringItemType |
| Balance Type: |
na |
| Period Type: |
duration |
|
| X |
- DefinitionCode for the postal or zip code
| Name: |
dei_EntityAddressPostalZipCode |
| Namespace Prefix: |
dei_ |
| Data Type: |
xbrli:normalizedStringItemType |
| Balance Type: |
na |
| Period Type: |
duration |
|
| X |
- DefinitionName of the state or province.
| Name: |
dei_EntityAddressStateOrProvince |
| Namespace Prefix: |
dei_ |
| Data Type: |
dei:stateOrProvinceItemType |
| Balance Type: |
na |
| Period Type: |
duration |
|
| X |
- DefinitionA unique 10-digit SEC-issued value to identify entities that have filed disclosures with the SEC. It is commonly abbreviated as CIK. Reference 1: http://www.xbrl.org/2003/role/presentationRef
-Publisher SEC
-Name Exchange Act
-Number 240
-Section 12
-Subsection b-2
| Name: |
dei_EntityCentralIndexKey |
| Namespace Prefix: |
dei_ |
| Data Type: |
dei:centralIndexKeyItemType |
| Balance Type: |
na |
| Period Type: |
duration |
|
| X |
- DefinitionIndicate if registrant meets the emerging growth company criteria. Reference 1: http://www.xbrl.org/2003/role/presentationRef
-Publisher SEC
-Name Exchange Act
-Number 240
-Section 12
-Subsection b-2
| Name: |
dei_EntityEmergingGrowthCompany |
| Namespace Prefix: |
dei_ |
| Data Type: |
xbrli:booleanItemType |
| Balance Type: |
na |
| Period Type: |
duration |
|
| X |
- DefinitionCommission file number. The field allows up to 17 characters. The prefix may contain 1-3 digits, the sequence number may contain 1-8 digits, the optional suffix may contain 1-4 characters, and the fields are separated with a hyphen.
| Name: |
dei_EntityFileNumber |
| Namespace Prefix: |
dei_ |
| Data Type: |
dei:fileNumberItemType |
| Balance Type: |
na |
| Period Type: |
duration |
|
| X |
- DefinitionTwo-character EDGAR code representing the state or country of incorporation.
| Name: |
dei_EntityIncorporationStateCountryCode |
| Namespace Prefix: |
dei_ |
| Data Type: |
dei:edgarStateCountryItemType |
| Balance Type: |
na |
| Period Type: |
duration |
|
| X |
- DefinitionThe exact name of the entity filing the report as specified in its charter, which is required by forms filed with the SEC. Reference 1: http://www.xbrl.org/2003/role/presentationRef
-Publisher SEC
-Name Exchange Act
-Number 240
-Section 12
-Subsection b-2
| Name: |
dei_EntityRegistrantName |
| Namespace Prefix: |
dei_ |
| Data Type: |
xbrli:normalizedStringItemType |
| Balance Type: |
na |
| Period Type: |
duration |
|
| X |
- DefinitionThe Tax Identification Number (TIN), also known as an Employer Identification Number (EIN), is a unique 9-digit value assigned by the IRS. Reference 1: http://www.xbrl.org/2003/role/presentationRef
-Publisher SEC
-Name Exchange Act
-Number 240
-Section 12
-Subsection b-2
| Name: |
dei_EntityTaxIdentificationNumber |
| Namespace Prefix: |
dei_ |
| Data Type: |
dei:employerIdItemType |
| Balance Type: |
na |
| Period Type: |
duration |
|
| X |
- DefinitionLocal phone number for entity.
| Name: |
dei_LocalPhoneNumber |
| Namespace Prefix: |
dei_ |
| Data Type: |
xbrli:normalizedStringItemType |
| Balance Type: |
na |
| Period Type: |
duration |
|
| X |
- DefinitionBoolean flag that is true when the Form 8-K filing is intended to satisfy the filing obligation of the registrant as pre-commencement communications pursuant to Rule 13e-4(c) under the Exchange Act. Reference 1: http://www.xbrl.org/2003/role/presentationRef
-Publisher SEC
-Name Exchange Act
-Number 240
-Section 13e
-Subsection 4c
| Name: |
dei_PreCommencementIssuerTenderOffer |
| Namespace Prefix: |
dei_ |
| Data Type: |
xbrli:booleanItemType |
| Balance Type: |
na |
| Period Type: |
duration |
|
| X |
- DefinitionBoolean flag that is true when the Form 8-K filing is intended to satisfy the filing obligation of the registrant as pre-commencement communications pursuant to Rule 14d-2(b) under the Exchange Act. Reference 1: http://www.xbrl.org/2003/role/presentationRef
-Publisher SEC
-Name Exchange Act
-Number 240
-Section 14d
-Subsection 2b
| Name: |
dei_PreCommencementTenderOffer |
| Namespace Prefix: |
dei_ |
| Data Type: |
xbrli:booleanItemType |
| Balance Type: |
na |
| Period Type: |
duration |
|
| X |
- DefinitionBoolean flag that is true when the Form 8-K filing is intended to satisfy the filing obligation of the registrant as soliciting material pursuant to Rule 14a-12 under the Exchange Act. Reference 1: http://www.xbrl.org/2003/role/presentationRef
-Publisher SEC
-Name Exchange Act
-Section 14a
-Number 240
-Subsection 12
| Name: |
dei_SolicitingMaterial |
| Namespace Prefix: |
dei_ |
| Data Type: |
xbrli:booleanItemType |
| Balance Type: |
na |
| Period Type: |
duration |
|
| X |
- DefinitionBoolean flag that is true when the Form 8-K filing is intended to satisfy the filing obligation of the registrant as written communications pursuant to Rule 425 under the Securities Act. Reference 1: http://www.xbrl.org/2003/role/presentationRef
-Publisher SEC
-Name Securities Act
-Number 230
-Section 425
| Name: |
dei_WrittenCommunications |
| Namespace Prefix: |
dei_ |
| Data Type: |
xbrli:booleanItemType |
| Balance Type: |
na |
| Period Type: |
duration |
|
Federal Home Loan Mortgage (QB) (USOTC:FREJP)
Historical Stock Chart
From Apr 2024 to May 2024
 Charts.")
Federal Home Loan Mortgage (QB) (USOTC:FREJP)
Historical Stock Chart
From May 2023 to May 2024
 Charts.")