UNITED STATES
SECURITIES AND EXCHANGE COMMISSION
Washington, D.C. 20549
SCHEDULE TO
Tender Offer Statement under Section 14(d)(1) or 13(e)(1)
of the Securities Exchange Act of 1934
Euronav NV
(Name of Subject Company)
Compagnie Maritime Belge NV
(Name of Filing Person) (Offeror)
Ordinary Shares, no par value
(Title of Class of Securities)
B38564108
(CUSIP Number
of Class of Securities)
Ludovic Saverys
Chief Financial Officer
Compagnie Maritime Belge NV
De Gerlachekaai 20
2000
Antwerp, Belgium
Telephone: +32 3 247 59 11
With a Copy to:
Robert E. Lustrin, Esq.
Reed Smith LLP
599
Lexington Avenue
New York, NY 10022-7650
Telephone: (212) 521-5400
(Name, Address, and Telephone Number of Person Authorized to Receive Notices and Communications on Behalf of Filing Persons)
CALCULATION OF FILING FEE
|
|
|
| Transaction Valuation* |
|
Amount of Filing Fee* |
| Not applicable |
|
Not applicable |
| |
| * |
A filing fee is not required in connection with this filing as it relates solely to preliminary communications
made before the commencement of a tender offer. |
| ☐ |
Check the box if any part of the fee is offset as provided by Rule
0-11(a)(2) and identify the filing with which the offsetting fee was previously paid. Identify the previous filing by registration statement number, or the Form or Schedule and the date of its filing.
|
|
|
|
|
|
|
|
| Amount Previously Paid: |
|
None |
|
Filing Party: |
|
Not applicable |
| Form of Registration No.: |
|
Not applicable |
|
Date Filed: |
|
Not applicable |
| ☒ |
Check the box if the filing relates solely to preliminary communications made before the commencement of a
tender offer. |
Check the appropriate boxes below to designate any transactions to which the statement relates:
| |
☒ |
third-party tender offer subject to Rule 14d-1 |
| |
☐ |
issuer tender offer subject to Rule 13e-4 |
| |
☐ |
going-private transaction subject to Rule 13e-3 |
| |
☐ |
amendment to Schedule 13D under Rule 13d-2 |
Check the following box if the filing is a final amendment reporting the results of the tender offer.
If applicable, check the appropriate box(es) below to designate the appropriate rule provision(s) relied upon:
| |
☐ |
Rule 13e-4(i) (Cross-Border Issuer Tender Offer) |
| |
☒ |
Rule 14d-1(d) (Cross-Border Third-Party Tender Offer)
|
This Tender Offer Statement on Schedule TO relates solely to preliminary communications made
before the commencement of a planned tender offer by Compagnie Maritime Belge NV, a public limited liability company (“naamloze vennootschap”) under Belgian law (the “Offeror”) to acquire all outstanding
Ordinary Shares, no par value (the “Ordinary Shares”), of Euronav NV, a public limited liability company (“naamloze vennootschap”) under Belgian law (the “Issuer”) not owned by CMB or its
affiliates.
Additional Information and Where to Find It
The tender offer by the Offeror referred to herein has not yet commenced. Each of the presentation filed herewith as Exhibit 99.1 and the
article filed herewith as Exhibit 99.2 is for informational purposes only, and is neither an offer to purchase nor a solicitation of an offer to sell any Ordinary Shares of the Issuer or any other securities, nor is it a substitute for the Tender
Offer Statement on Schedule TO and other necessary filings that the Offeror will file with the Securities and Exchange Commission (the “Commission”), and the Solicitation/Recommendation Statement on Schedule
14D-9 and other necessary filings that the Issuer will file with the Commission, at the time the tender offer is commenced. Any solicitation and offer to buy Ordinary Shares will only be made pursuant to an
offer to purchase and related tender offer materials. At the time the tender offer is commenced, the Offeror will file with the Commission a Tender Offer Statement on Schedule TO and other necessary filings, and in connection therewith, the Issuer
will file with the Commission a Solicitation/Recommendation Statement on Schedule 14D-9 and other necessary filings.
The Tender Offer Statement (including an offer to purchase, a related letter of transmittal and certain other offer documents) and the
Solicitation/Recommendation Statement on Schedule 14D-9 will contain important information. U.S. Holders of Ordinary Shares are urged to read these documents carefully when they become available because they
will contain important information that U.S. Holders of Ordinary Shares should consider before making any decision with respect to the tender offer.
When the tender offer is commenced, the offer to purchase, the related letter of transmittal and the solicitation/recommendation statement and
other filings related to the offer will be made available for free at the Commission’s website at www.sec.gov. U.S. Holders of Ordinary Shares also may obtain free copies of the Tender Offer Statement and other offer documents that the Offeror
will file with the Commission by contacting the information agent for the tender offer that will be named in the Tender Offer Statement and the Solicitation/Recommendation Statement.
Forward-Looking Statements
This Schedule
TO and the exhibit filed herewith may contain “forward-looking statements”, many of which are beyond the Offeror’s ability to control or predict. These include, without limitation, forward-looking statements related to the
Offeror’s commencement of the tender offer. Words such as “anticipate,” “believe,” “estimate,” “expect,” “forecast,” “intend,” “may,” “plan,” “project,”
“predict,” “should,” “would” and “will” and variations of such words and similar expressions are intended to identify such forward-looking statements. Such statements are based on the Offeror’s
expectations as of the date they were first made and involve risks and uncertainties that could cause actual results to differ materially from those expressed or implied in these forward-looking statements. Readers are cautioned not to place undue
reliance on these forward-looking statements, which speak only as of their dates. Unless as otherwise stated or required by applicable law, the Offeror undertakes no obligation and does not intend to update these forward-looking statements, whether
as a result of new information, future events or otherwise. All forward-looking statements in this Schedule TO and the exhibits filed herewith are qualified in their entirety by this cautionary statement.
Item 12. Exhibits
|
|
|
| Exhibit No. |
|
Description |
|
|
| 99.1 |
|
Presentation dated January 12, 2024 for the Issuer’s Capital Markets Day relating to its planned acquisition of CMB.TECH NV |
|
|
| 99.2 |
|
Tradewinds article dated January 12, 2024 |

Exhibit 99.1

Forward-looking statements (1/2) This presentation includes certain
statements, expectations, estimates and projections provided by Euronav NV (the “Company”) and certain other sources believed by the Company to be reliable, and statements of the Company’s beliefs and intentions about future
events. The statements included in the presentation that are not historical facts are forward-looking statements within the meaning of the Private Securities Litigation Reform Act of 1995. In some cases, you can identify forward-looking statements
by terms such as “may,” “will,” “should,” “expect,” “plan,” “anticipate,” “could,” “intend,” “target,” “project,”
“contemplate,” “believe,” “estimate,” “predict,” “potential,” or “continue,” or the negative of these terms or other similar expressions, although not all forward-looking
statements contain these words. Such statements, expectations, estimates and projections reflect various assumptions by the Company concerning anticipated results and are subject to significant business, economic and competitive uncertainties and
contingencies, and known and unknown risks, many of which are beyond the Company’s control and are impossible to predict. Accordingly, there can be no assurance that such statements, expectations, estimates and projections will be realized.
Any forecast made or contained herein and actual results will likely vary and those variations may be material. The Company makes no representation or warranty as to the accuracy or completeness of such statements, expectations, estimates and
projections contained in this presentation or that any forecast made or contained herein will be achieved. Our forward-looking statements are subject to certain risks and uncertainties, which include, but are not limited to, the following: •
The transaction pursuant to which the Company has agreed to purchase CMB.TECH from CMB NV may not occur as expected or at all. • The global clean energy transition may not accelerate as expected, including in the shipping industry. •
Governmental and regulatory focus on a zero-carbon future in accordance with current target dates may not continue without delay or abatement or may be changed. • The shipping industry may not adopt hydrogen and ammonia as a primary fuel
source for ocean-going vessels or any adoption may take longer than expected. • The obsolescence and scrapping of older vessels that are powered by traditional fuels that emit carbon and their replacement may not occur as expected or at all.
• CMB.TECH’s hydrogen and ammonia engine and fuel technology may not be successfully applied in longer haul routes. • The business divisions of CMB.TECH may not be successfully integrated into the Company’s business. •
The delivery of CMB.TECH’s vessels on order may not occur as expected or without unanticipated costs. • Charters at attractive or expected rates may not be available for the Company’s vessels upon expiration of current charters or
upon delivery of newbuildings on order. • CMB.TECH may not complete as expected various hydrogen and ammonia projects upon which the Company’s business plans are based around the world both at sea and ashore as expected. •
Continuing demand for transportation of crude oil may not sustain charter rates for VLCCs and Suezmax tankers and the expected reduction in supply of such vessels due to scrapping or obsolescence may not occur. • Improving supply and demand
dynamics over the next several years in the dry bulk shipping sectors may not occur as expected. • A recovery and growth over the next several years in the chemical tanker sector of the shipping industry may not occur as expected. •
Demand for eco-friendly container vessels may decline. • Continued increases for demand for service vessels is the offshore wind industry may not occur as expected. • The impact of general economic and geopolitical factors on the
shipping industry. • Other statements and projections relating to the Company’s business objectives and plans may not occur as expected. In addition, certain industry data and information contained in this presentation has been derived
from industry sources. The Company has not undertaken any independent investigation to confirm the accuracy or completeness of such data and information, some of which may be based on estimates and subjective judgments. Accordingly, the Company
makes no representation or warranty as to such accuracy or completeness. This presentation speaks only as of today’s date, and the Company does not undertake to update any forward-looking statements to reflect future events or circumstances.
Information about the Company The Company is subject to the information and reporting requirements of the Securities Exchange Act of 1934, as amended, applicable to foreign private issuers and in accordance therewith is required to file reports and
other information with the SEC relating to its business, financial condition, and other matters. The Company’s Annual Report on Form 20-F for the fiscal year ended December 31, 2022 (the “Form 20-F”) and other filings are available
at the SEC’s website at http://www.sec.gov. We refer you to Item 3.D. (Risk Factors) in the Form 20-F for a discussion of certain risks of the Company’s business activities, financial condition, results of operations and prospects
relating to its ownership and operation of crude oil tankers. © 2024 – CMB.TECH 2

Forward-looking statements (2/2) Additional information CMB N has
announced previously that it will conduct a mandatory tender offer for all of the Company shares that it and its affiliates do not already own. The tender offer has not yet commenced. This presentation is for informational purposes only, and is
neither an offer to purchase nor a solicitation of an offer to sell any ordinary shares of Euronav NV or any other securities, nor is it a substitute for (i) the prospectus of CMB NV and the response memorandum of the supervisory board of Euronav NV
to be approved by the Belgian Financial Services and Markets Authority or (ii) the Tender Offer Statement on Schedule TO and other necessary filings that CMB NV will file with the Securities and Exchange Commission (the “Commission”),
and the Solicitation/Recommendation Statement on Schedule 14D-9 and other necessary filings that Euronav NV will file with the Commission, at the time the tender offer is commenced. Any solicitation and offer to buy ordinary shares of Euronav NV
will only be made pursuant to a public takeover bid within the meaning of the Belgian Law of 1 April 2007 and the Belgian Royal Decree of 27 April 2007 on public takeover bids addressed to shareholders of Euronav NV wherever located (the
“Belgian Offer”) and a concurrent offer to purchase and related tender offer materials in accordance with applicable U.S. federal securities laws addressed to U.S. holders (within the meaning of Rule 14d-1(d) under the Securities
Exchange Act of 1934, as amended) of Euronav NV’s ordinary shares (the “U.S. Offer ). At the time the tender offer is commenced, CMB NV will file with the Commission a Tender Offer Statement on Schedule TO and other necessary filings,
and in connection therewith, Euronav NV will file with the Commission a Solicitation/Recommendation Statement on Schedule 14D-9 and other necessary filings. The prospectus of CMB NV and the response memorandum of the supervisory board of Euronav NV
will contain important information in relation to the Belgian offer. Shareholders of Euronav NV are urged to read these documents carefully when they become available because they will contain important information that shareholders of Euronav NV
should consider before making any decision with respect to the Belgian Offer. The Tender Offer Statement (including an offer to purchase, a related letter of transmittal and certain other offer documents) and the Solicitation/Recommendation
Statement on Schedule 14D-9 will contain important information in relation to the U.S. Offer. U.S. holders of Euronav NV’s ordinary shares are urged to read these documents carefully when they become available because they will contain
important information that U.S. holders of Euronav NV’s ordinary shares should consider before making any decision with respect to the tender offer U.S. Offer. When the tender offer is commenced, (i) the prospectus and the response memorandum
will be made available for free at the website of Euronav NV, and (ii) the offer to purchase, the related letter of transmittal and the solicitation/recommendation statement and other filings related to the offer will be made available for free at
the Commission’s website at www.sec.gov. U.S. holders of Euronav’s ordinary shares also may obtain free copies of the Tender Offer Statement and other offer documents that the Offeror will file with the Commission by contacting the
information agent for the tender offer that will be named in the Tender Offer Statement and the Solicitation/Recommendation Statement. © 2024 – CMB.TECH 3

Presentation topics 1. CMB.TECH transaction 2. Creating the reference in
sustainable shipping 3. Value creation 4. Business units and markets 5. Annex - focus section on hydrogen market and shipping, fleet list © 2024 – CMB.TECH 4

© 2024 – CMB.TECH

Euronav company profile nd 2 largest quoted crude oil tanker company
Euronav in numbers (1) ▪ Euronav is the world’s second largest independent quoted crude Type # of vessels Average age oil tanker company (dwt) engaged in the ocean transportation and storage of crude oil NH 3 17 3 VLCC 9.9 years ▪
Sustainability is a core value at Euronav 22 4 Suezmax 7.8 years (2) ▪ Fleet rejuvenation and future-proof newbuilding program at the heart of its long-term value creation strategy Ship on water 2 FSO Under construction (3) Each $5k per day
uplift in VLCC and Suezmax rates improves EBITDA by $70m $ 770 million Shareholder return Stock listed platform $ 350million since 2015 $ 210 million BASE $ 70 million $1.5bn $200m $3.5 bn + $ 5,000 + $ 15,000 + $ 25,000 + $ 55,000 Cash dividends
Share buyback Market Cap Uplift in rates: per day per day per day per day on 14/12/2023 Industry-leading shareholder returns, tier 1 customer portfolio, and at the centre of the on-going energy transition. Older tanker tonnage provides excellent
opportunities to recycle capital into more future-proof (tanker) tonnage. (1) Age calculation: new building fleet set at 0 years. (1) (2) Age calculation: new building fleet set at 0 For purposes of this presentation, “future-proof”
means owning and operating efficient low-carbon emitting ships and/or ships powered by hydrogen and/or ships powered by ammonia. (3) These firms have not consented to the use of their names in this presentation, nor have they endorsed the
transaction or made any recommendations relating thereto. © 2024 – CMB.TECH 6 Storage Trading

CMB.TECH company profile Marine CMB.TECH marine in numbers CMB.TECH is a
division of the CMB Group that designs, builds and operates a future-proof fleet powered by hydrogen and ammonia: Total of 60+46 vessels Crew Transfer Vessels (CTV) (1) Dry-Bulk carriers powered by NH with an average age of 0.17 years 3 powered by
MDO and H 2 Commissioning service operation vessels (CSOV) powered by H 2 (2) Chemical tankers powered by NH Category 3 Tugboats powered by H 2 Ferry units powered by H 2+26 2+6 1+4 3 2 52+10 Container vessels powered by NH 3 off-shore wind dry-bulk
chemical container other Energy H2 Infra Industry Technology & Dev NH 3 Technology and infrastructure A well-equipped technology Design and retrofit of port 35 50 21 to produce and distribute green centre powered by highly and industrial
applications to ammonia ready conventional dual fuel hydrogen H and NH , which we believe run on hydrogen – in skilled engineers specialized in 2 3 ammonia fitted will be the fuel of the future cooperation with leading H systems 2 OEMs and
port operators CMB.TECH’s business model is to own/lease out or sell assets to customers looking for low/zero carbon solutions. CMB.TECH solves the chicken and egg discussion by offering H and NH molecules, either through own production or by
sourcing it from third party producers. 2 3 (1) (2) Age calculation: new building fleet set at 0, excluding CTV’s (Avg. age 8.9 years) Data format: fleet on the water + new building orders Note: Bocimar, Bochem and Delphis are the trade names
of CMB’s dry bulk carrier, chemical tankers and container vessel divisions, respectively. In the Transaction, CMB will give Euronav a worldwide royalty-free license to use these names for $ 0. © 2024 – CMB.TECH 7

Financial terms: enterprise value to equity value bridge The Acquisition
Price for 100% of the shares in CMB.TECH is $ 1.150 billion in cash. Approximate enterprise value of $ 3.649 billion and an equity value of $ 1.150 billion Financial terms The transaction includes $ 2.496 billion roll-over debt (bank, leasing and
shipyard liabilities). This includes: Net existing financial debt of $ 510 million Total nominal outstanding capital commitments of $ 1.986 billion – to be paid over the coming 3 years: (i) $ 1.625 billion has been secured and will be rolled
over; (ii) remaining unfunded capital commitment of $ 361 million will come from Euronav’s own cash. The Acquisition Price will be financed by Euronav from the cash proceeds of the sale of 24 VLCCs fleet to Frontline plc Financing by Euronav
(which was announced by Euronav on 9 October 2023) (1) $ 22 (1) $ 89 In $ millions $ 181 $ 510 $ 679 Unfunded – comes 67 Vessels $ 361 from Euronav cash $ 394 8 Vessels 5 Vessels $ 441 $ 1,625 Secured – rolled $ 3,649 over $ 1,986 $
1,888 28 Vessels $ 1,153 Dry Bulk Container Chemical Off-Shore Industry H2 Infrastructure (-) Overheads (-) Net Debt (-) Net Debt Enterprise Equity Value FMV FMV FMV Wind, Others DCF DCF and HQ Costs Net Existing Finacial Total Nominal Value FMV DCF
Debt 0utstanding Capital Commitments Note: Based on valuations as of 28/11/2023. Fair Market Value (FMV) sources: Arrow, BRS, Howe Robinson, Maersk Broker, SSY, and Hagland Shipbrokers. Others: Tugboats & Ferries. These firms have not consented
to the use of their names in this presentation, nor have they endorsed the transaction or made any recommendations relating thereto. Discounted cash Flow (DCF): intrinsic and prospective method valuing the business until end of holding period
through its future free cash flows discounted using the weighted average cost of capital (WACC) to obtain Enterprise Value (EV). © 2024 – CMB.TECH 8
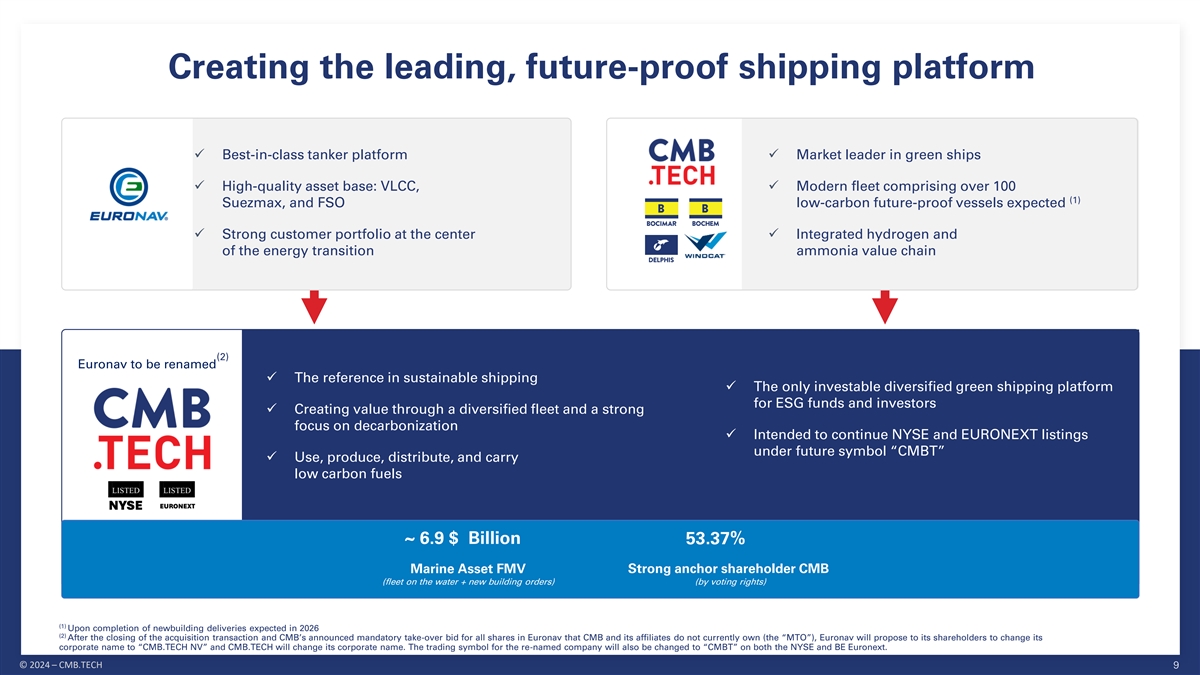
Creating the leading, future-proof shipping platform ✓
Best-in-class tanker platform✓ Market leader in green ships ✓ High-quality asset base: VLCC,✓ Modern fleet comprising over 100 (1) Suezmax, and FSO low-carbon future-proof vessels expected ✓ Strong customer portfolio at
the center✓ Integrated hydrogen and of the energy transition ammonia value chain (2) Euronav to be renamed ✓ The reference in sustainable shipping ✓ The only investable diversified green shipping platform for ESG funds and
investors ✓ Creating value through a diversified fleet and a strong focus on decarbonization ✓ Intended to continue NYSE and EURONEXT listings under future symbol “CMBT” ✓ Use, produce, distribute, and carry low
carbon fuels ~ 6.9 $ Billion 53.37% Marine Asset FMV Strong anchor shareholder CMB (fleet on the water + new building orders) (by voting rights) (1) Upon completion of newbuilding deliveries expected in 2026 (2) After the closing of the acquisition
transaction and CMB’s announced mandatory take-over bid for all shares in Euronav that CMB and its affiliates do not currently own (the “MTO”), Euronav will propose to its shareholders to change its corporate name to
“CMB.TECH NV” and CMB.TECH will change its corporate name. The trading symbol for the re-named company will also be changed to “CMBT” on both the NYSE and BE Euronext. © 2024 – CMB.TECH 9

Expected timing SGM - Special SGM - Special Shareholder Meeting
Shareholder Meeting Shareholders approve conditionality of (i) SGM scheduled on 7 February 2023 to Frontline’s acquisition of 24 VLCC for $ approve CMB.TECH transaction 2.35 billion and (ii) termination of (pursuant to Art. 7:152 CCA)
arbitration case against Frontline plc / Famatown Finance Ltd, following which Expected closing of the transaction CMB acquired Frontline’s 26.12% stake for $ 18.43 and a new Euronav Targeted approval date of MTO Prospectus Euronav intends to
change Supervisory Board and Management Convening of SGM to approve CMB expects to launch MTO for Euronav name to CMB.TECH CMB.TECH transaction Board was installed (CMBT NYSE / BE EURONEXT) on 14 February 2024 09 October 2023 21/22 November 2023 22
December 2023 February 2024 15 March 2024 Capital Market Day 12 January 2024 Agreement Announcement of Close Mandatory CMB.TECH transaction Take-Over Bid CMB and Frontline plc/ Famatown As a consequence of exceeding the 30% Euronav and CMB announced
that Finance Ltd, reach an agreement on a threshold in November 2023 – CMB will they entered into a SPA for the transaction that puts an end to the offer all shareholders $ 17.86, i.e. $ acquisition of 100% of the share in deadlock arising
from their entrenched 18.43 minus dividend of $ 0.57 paid in CMB.TECH differences over the future strategy of December 2023 (1) the company Target for Euronav to remain listed on NYSE and EURONEXT (1) The offer price may be further reduced by the
gross amount of any future dividends distributions paid by Euronav to its shareholders with an ex-dividend date prior to the end of acceptance period in settlement date of the MTO. © 2024 – CMB.TECH 10

After the closing of the acquisition transaction and CMB’s
announced mandatory take-over bid for all shares in Euronav that CMB and its affiliates do not currently own (the “MTO”), Euronav will propose to its shareholders to change its corporate name to “CMB.TECH NV” and CMB.TECH
will change its corporate name. The trading symbol for the re-named company will also be changed to “CMBT” on both the NYSE and BE Euronext. Further reference made to CMB.TECH in this presentation is forward-looking and describes the
Company and its business plans after the renaming from Euronav NV to CMB.TECH NV, as the context requires. Further reference to Euronav will be as the crude oil tanker business unit of CMB.TECH (CMBT), as the context requires.

CMB.TECH (CMBT) has a strong, experienced management team with a
successful track record The founders of CMB.TECH and driving Alexander Saverys force behind the rapid technological Chief Executive Officer advancements which result in proprietary H and NH technologies Alexander Saverys serves on the Management
Board of Euronav as Chief 2 3 Executive Officer as of 22 November 2023. He founded Delphis in 2004, a short sea container shipping company. He became director of CMB in 2006 and is Chief Executive Officer of CMB since Combined they hold over 100
years of September 2014. shipping experience – financial, commercial, and operational Michael Saverys Michael Saverys Ludovic Saverys Have been instrumental to the Chief Chartering Officer Chief Financial Officer Chief Chartering Officer
success and growth of Euronav and Ludovic Saverys joined Euronav on the Michael Saverys joined Euronav on the CMB.TECH during the last decade Management Board as Chief Financial Officer as Management Board as Chief Chartering Officer on of 22
November 2023. 22 November 2023. He is also the CFO of CMB and the General In 2009 he joined CMB as Chartering Director of Manager of Saverco NV. He was on EURN board Bocimar International, and he is a member of the from 2015 to 2021. Board and
Executive Committee of CMB NV. Ambitious strategy for CMBT to be a leading green shipping growth stock – Maxime Van Eecke Benoit Timmermans on both NYSE and EURONEXT Chief Commercial Officer Chief Strategy Officer Maxime Van Eecke joined
Euronav on the Benoit Timmermans joined Euronav on the Management Board as Chief Commercial Officer Management Board as Chief Strategy Officer on 22 on 22 November 2023. November 2023. Clear vision on how to become the reference in green shipping
– and to He started as Legal Counsel for the CMB group in He is in charge of the Chemical division and zero 2005 and became MD of Delphis in 2014. In 2021 carbon fuel procurement. He is an executive board provide real ESG investment he was
appointed CCO of the CMB group. He is member of CMB NV. opportunities an executive board member of CMB NV. Source: Public information © 2024 – CMB.TECH 12

Euronav and CMB’s value creating pathways cross again CMB
Technologies MV Hydroville was CMB acquires Windcat CMB.TECH and Ohlthaver & was added to the christened in Workboats from List Group create Cleanergy group Antwerp Seacor Marine Solutions Namibia JV Euronav Luxembourg is formed between CMB
founds CMB acquires The Saverys CMB.TECH orders $ CMB rebuilds Compagnie Nationale de the subsidiary Delphis family take 3 billion of H and ownership in Navigation (CNN) and 2 Bochem CMB private NH powered ships Euronav to 24.97% Compagnie Maritime
3 CMB acquires Belge (CMB) 26,12% stake of Famatown/Frontline, Euronav sells 24 VLCCs for $ 2.35 billion 2007 2017 2019 2020 2022 2014 2015 1991 1995 1997 2004 2023 2024 Saverys family 2004 2013 2015 2018 2020 2021 Announcement acquires controlling
CMB.TECH stake in CMB transaction Euronav becomes Euronav Euronav concludes Euronav concludes First CDP Euronav fleet Agreement between the tanker division acquires Tanklog the merger with the acquisition of 15 submission rejuvenation CMB and of CMB
Gener8 Maritime VLCCs of Maersk Oil gaining B rating program Frontline/Famatown Tankers to solve the structural deadlock First bond issue for Euronav demerges from CMB The Company successfully EURN $150m in Oslo and starts trading on Euronext
concludes its IPO on the under the ticker EURN New York Stock Exchange © 2024 – CMB.TECH 13

Investment highlights CMB.TECH (CMBT) Creating THE reference platform
in sustainable shipping • CMB.TECH builds, owns, operates the largest pool of large marine applications that run on hydrogen and ammonia • Proven and scalable CMB.TECH technology of monofuel and dual fuel combustion engines that use
hydrogen and ammonia Grey-to-green that becomes available for the combined fleet solution for the • Tier 1 customer portfolio located at the center of the energy transition maritime industry • Ensuring availability of hydrogen and
ammonia fuel to its customers, either through own production or by sourcing it from third party producers • Diversification across different shipping types enables to invest for the future through shipping cycles: 41+7 oil tankers, 2+26
dry-bulk vessels, 52+10 offshore wind vessels, 1+4 container vessels, 2+6 chemical tankers, and 3 other segment (H2 tug & H2 ferry) Diversified, young ~ 6.9 $ Billion • Exposed to attractive end markets and to different contract types
(balancing operational gearing with steady cashflows) and growing fleet (2) Marine Asset FMV • Extensive current project pipeline of 53 committed new building vessels for delivery – and a pipeline of + 125 vessels • Modern and
growing fleet to meet tomorrow’s sustainability requirements • Positioned for the global fuel transition Ideally positioned in • At the center of the on-going energy transition. Older tanker tonnage provides excellent opportunity
to recycle capital the growing market into more future-proof (tanker) tonnage of sustainable • Increasing premium on TC rates for ecological vessels shipping (1) • Significant addressable market where over time 118,928 merchant vessels
are expected to be replaced by low carbon emitting ships 53.37% • CMBT a NYSE and EURONEXT listed growth stock rewarding its shareholders CMB as anchor • Successfully grown and developed CMB.TECH since it was founded in 2015 under the
CMB umbrella Strong anchor shareholder shareholder CMB • At the helm when Euronav became the tanker division of CMB in 1997 and primordial for its succes during the years thereafter (by voting rights) (1) UNCTAD Handbook of Statistics 2023 (2)
Fair Market Value (FMV) sources: Arrow, BRS, Howe Robinson, Maersk Broker, SSY, Vessels Value and Hagland Shipbrokers – FVM entails fleet on the water + new building orders . Data format: fleet on the water + new building orders. These firms
have not consented to the use of their names and logos in this presentation, nor have they endorsed the transaction or made any recommendations relating thereto. © 2024 – CMB.TECH 14
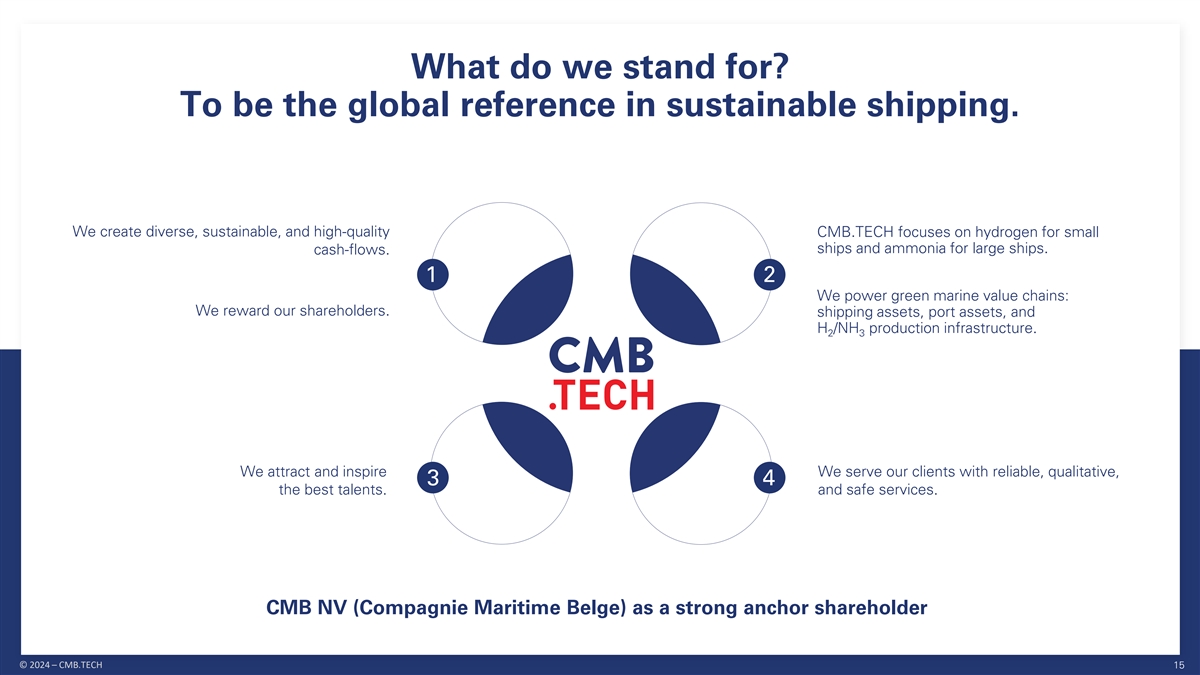
What do we stand for? To be the global reference in sustainable
shipping. We create diverse, sustainable, and high-quality CMB.TECH focuses on hydrogen for small ships and ammonia for large ships. cash-flows. 1 2 We power green marine value chains: We reward our shareholders. shipping assets, port assets, and H
/NH production infrastructure. 2 3 We attract and inspire We serve our clients with reliable, qualitative, 3 4 the best talents. and safe services. CMB NV (Compagnie Maritime Belge) as a strong anchor shareholder © 2024 – CMB.TECH
15

CMB.TECH (CMBT) company profile Marine CMB.TECH marine in numbers
Design, building and operate a future-proof fleet powered by hydrogen and ammonia: Total of 101+53 vessels Tugboats powered by H 2 (1) Dry-Bulk carriers powered by NH with an average age of 4.59 years 3 Ferry units powered by H 2 Crew Transfer
Vessels (CTV) powered by MDO and H (2) 2 Category Chemical tankers powered by NH 3 Commissioning service operation vessels (CSOV) powered by H 2 Suezmax tankers / VLCC tankers 52+10 41+7 2+26 2+6 1+4 3 Container vessels powered by NH Floating
Storage and Offloading units 3 off-shore wind oil dry-bulk chemical container other Storage tankers (FSO) Energy H2 Infra Industry Technology & Dev NH 3 Design and retrofit of port A well-equipped technology Technology and infrastructure 95 38
21 and industrial applications centre powered by highly to produce and distribute conventional ammonia ready dual fuel hydrogen to run on hydrogen – in skilled engineers specialized in green H and NH , the fuel 2 3 ammonia fitted cooperation
with leading H systems of the future 2 OEMs and port operators CMB.TECH’s business model is designed to enable the grey-to-green transition of the maritime industry with a focus on hydrogen for small ships and ammonia for large ships –
whilst creating value for our shareholders, serving customers with reliable, qualitative and safe services, and attracting and inspiring the best talents. (1) Age calculation: new building fleet set at 0, excluding CTV’s (Avg. age 8.9 years)
(2) Data format: fleet on the water + new building orders © 2024 – CMB.TECH 16

Marine – the leading diversified green shipping platform Oil
Tankers Dry-bulk vessels Container vessels Chemical Tankers Off-shore wind + + + + 41+7 2+26 1+4 2+6 52+10 <1 y Avg. CSOV 9.2 years 3,455 <1 years 1,888 <1 years 441 <1 years 394 679 Avg. age FMV $ millions Avg. age FMV $ millions Avg.
age FMV $ millions Avg. age FMV $ millions 8.9 y Avg. CTV FMV $ millions Energy type Energy type Energy type Energy type Energy type NH NH NH NH NH 3 3 3 3 3 45 3 0 4 0 0 46 22 2 5 0 8 0 0 17 Conventional NH Ammonia ready Dual-fuel hydrogen # number
of vessels 3 In-house expertise to seize new opportunities across end-markets whilst pursuing a fuel transition of the fleet towards ammonia and hydrogen ~6.9 $billion 101+53 >3,000 >450 4.59 >70 >15y Combined FMV Vessels seafarers
shore-based staff average fleet age engineers experience in H2 Fair Market Value (FMV) sources: Arrow, BRS, Howe Robinson, Maersk Broker, SSY, and Hagland Shipbrokers – basis fleet on the water + new building orders. These firms have not
consented to the use of their names and logos in this presentation, nor have they endorsed the transaction or made any recommendations relating thereto. Sum of the fleet composition is current fleet and committed newbuilds. Data format Vessels
Count: fleet on the waters + new building orders © 2024 – CMB.TECH 17

Flywheel strategy of the CMB.TECH marine division CMB.TECH is ideally
positioned to tap into each step of the energy transition ... with a clear vision on value creation towards low carbon shipping ... for stakeholders Low carbon Hydrogen and Ammonia molecules Integration across entire value chain in (Engine
technology & Production) sustainable shipping (H / NH ) 2 3 Diversify cashflows which allows to Enabler of NH /H Enabler to decarbonize 3 2 invest through shipping cycles production shipping of goods (cfr. offshore wind) (fuel + engine)
Capitalize on fleet size and strategic investments in infrastructure Contributing cash to business and shareholders Oil tanker business + accelerated Offshore industry with CSOVs, Diversified green shipping decarbonization + growth of CTVs, Tugboats
business powered by NH /H 3 2 energy tanker industry Low carbon shipping of goods Powered by CMB.TECH © 2024 – CMB.TECH 18

Future-proof and commercial attractive vessels hitting the water Firm
newbuilding orders of dual fuel NH 3 2 + 6 x 25.000dwt chemical tankers 2 + 24 x 210.000 dwt Newcastlemax bulkers 1 + 3 x 6.000 TEU ice class 1A reefer container ships NH as a fuel (ready) NH as a fuel (ready/fitted) NH as a fuel (ready) 3 3 3 +3
VLCC tankers +4 Suezmax tankers Hydrotug NH as a fuel (ready/fitted) NH as a fuel (ready) dual fuel 65t BP tractor tug 3 3 © 2024 – CMB.TECH 19
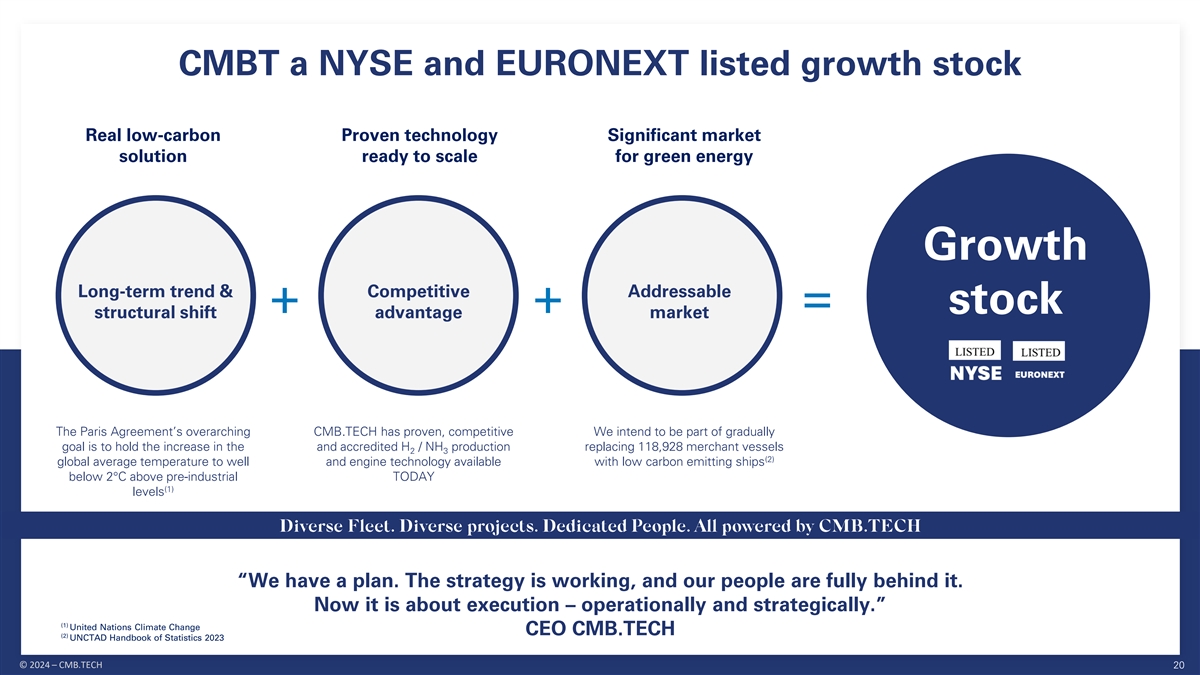
CMBT a NYSE and EURONEXT listed growth stock Real low-carbon Proven
technology Significant market solution ready to scale for green energy Growth Long-term trend & Competitive Addressable + + = stock structural shift advantage market The Paris Agreement’s overarching CMB.TECH has proven, competitive We
intend to be part of gradually goal is to hold the increase in the and accredited H / NH production replacing 118,928 merchant vessels 2 3 (2) global average temperature to well and engine technology available with low carbon emitting ships below
2°C above pre-industrial TODAY (1) levels “We have a plan. The strategy is working, and our people are fully behind it. Now it is about execution – operationally and strategically.” (1) United Nations Climate Change CEO
CMB.TECH (2) UNCTAD Handbook of Statistics 2023 © 2024 – CMB.TECH 20

Governments have stepped up their commitment to policy action th EU
Green China's 14 U.S. Inflation IMO GHG Deal and Five-Year Reduction Act strategy 2023 EU Fit for 55 Plan CMB.TECH targets new capital deployment of 3-5 $ billion over the next five years GREEN MARINE AMMONIA ASSETS GREEN MARINE HYDROGEN ASSETS
© 2024 – CMB.TECH 21

EU ETS and FuelEU can offer significant competitive advantage EU ETS
and FuelEU maritime cost comparison Start today – pilot projects offer a compelling commercial case € 4,00 FuelEU Maritime penalties can only be reduced significantly € 3,50 ✓ by changing fuel technologies FuelEU Maritime
effectively rewards early adopters by the potential to offset -80% € 3,00 ✓ an entire fleet or pool’s penalties with just a few over-performing vessels € 2,50 A pool of ten container vessels could avoid around € 226
million in FuelEU Maritime ✓ penalties over five years (2030-2034) if they are joined by a single vessel fueled with e- ammonia: x 6 € 2,00 NH € 1,50 3 x10 x1 x10 2030 € 38 million 2030 2031 € 42 million € 1,00
2031 2032 € 45 million 2032 2033 € 49 million 2033 2034 € 52 million 2034 € 0,50 -14,5% Total € 226 million Total 0 € -2% € - Rough Order Magnitude (ROM) € 30 million cost saving taking additional
fuelex green NH , capex NH engine, 3 3 2025 2030 2035 2040 2045 2050 2055 and EU ETS into account Fuel EU EU ETS Assumptions Assumptions • Large handy bulk carrier emitting 9,725 tonnes of CO2 equivalents (CO2e) on voyages to and from the EU,
• 60% of cargoes heading to EU/EAA discharge/load ports, 19k TEU container vessel, 215 days per year at sea, average sailing consumption 170 T VLFSO and 1,399 CO2e tonnes on intra-EU voyages or at berth in EU ports per day • EUA Carbon
Price: $ 92.63 /ton• To calculate the GHGIE intensity limit, 2020 reference value is set to 91.16 [gCO2eq/MJ] • To calculate the GHGIE intensity limit, 2020 reference value is set to 91.16 [gCO2eq/MJ] • VLSFO's well-to-wake carbon
intensity is set to 91.40 [gCO2eq/MJ] • VLSFO's well-to-wake carbon intensity is set to 91.40 [gCO2eq/MJ]• Green ammonia’s CMB.TECH dual fuel engine: well-to-wake carbon intensity is set as 9-15 [gCO2eq/MJ] • VLFSO 91.4 with
target at 85.69 in 2030: gap of 5,71 11:1 ratio • E-Ammonia 15 with target at 85.69 in 2030: surplus of 63,6 (1) Own calculations based on Llyod's Register case study. Llyod’s Register has not consented to the use of its name and data in
this presentation, nor has it endorsed the transaction or made any recommendation relating thereto. © 2024 – CMB.TECH 22 (1) LR indicative panamax Millions Wait and see Pilot project
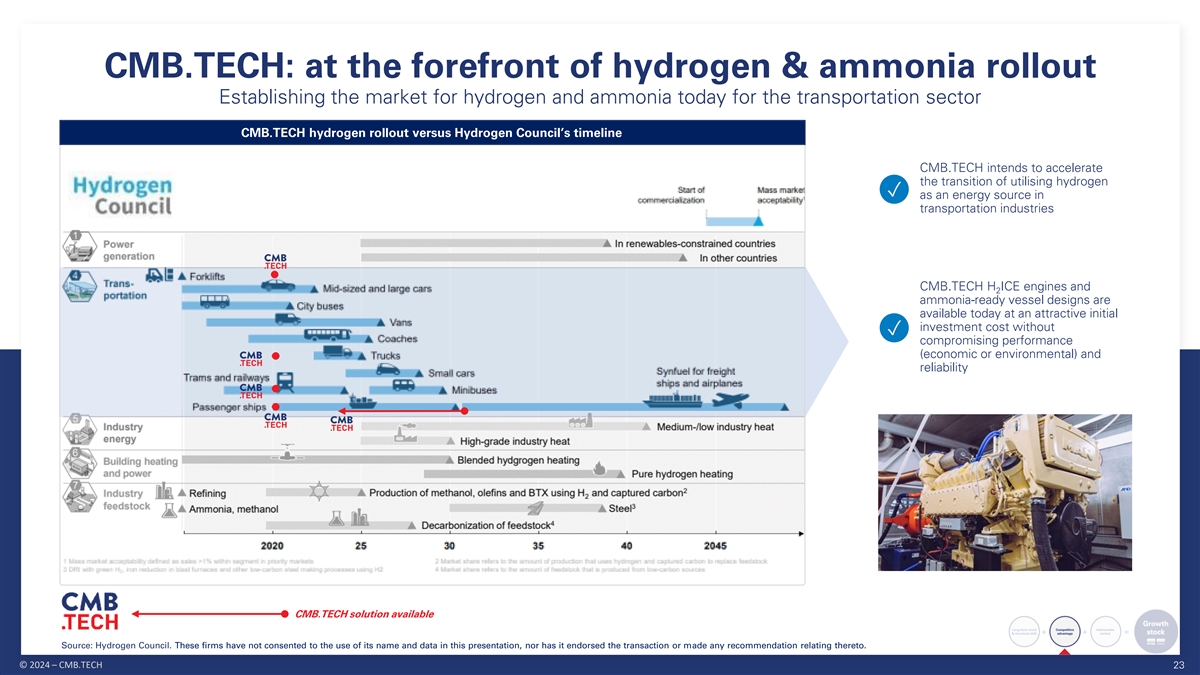
CMB.TECH: at the forefront of hydrogen & ammonia rollout
Establishing the market for hydrogen and ammonia today for the transportation sector CMB.TECH hydrogen rollout versus Hydrogen Council’s timeline CMB.TECH intends to accelerate the transition of utilising hydrogen ✓ as an energy source
in transportation industries CMB.TECH H ICE engines and 2 ammonia-ready vessel designs are available today at an attractive initial investment cost without ✓ compromising performance (economic or environmental) and reliability CMB.TECH
solution available Source: Hydrogen Council. These firms have not consented to the use of its name and data in this presentation, nor has it endorsed the transaction or made any recommendation relating thereto. © 2024 – CMB.TECH
23

Proven technology with a significant addressable market (1) (1) The
current CMBT marine client base CMBT industry clients and partners (1) . These firms have not consented to the use of their names in this presentation, nor have they endorsed the transaction or made any recommendations relating thereto © 2024
– CMB.TECH 24

Grow current CMB.TECH market position Current pipeline of approximately
120 marine projects and 5 H infra projects worldwide – and growing by the day 2 Marine – H powered H Infrastructure Marine – NH powered 2 2 3 20 H tugboats Own production of 185,000 tons pa of green 2 20 NH Ultramax bulkers 3
ammonia in Namibia 20 Hydrocats 20 NH 4,000-10,000 TEU container vessels 3 Offtake agreement of: 10 H CSOV’s 2 10 NH LR2 tankers 100,000 ton per annum of green ammonia Europe 3 10 H 5,000 dwt 500,000 to 750,000 ton per annum of blue ammonia
USA 2 10 NH 25,000 dwt chemical tankers 3 280,000 to 560,000 ton per annum of blue ammonia USA 1,000 T pa of green hydrogen Europe 83 99 6 +5 +74 +94 60 4 60 34 14 1 1 9 5 Delivered / For delivery / Under Total Delivered / For delivery / Off-take
Total Delivered / For delivery / Under Total acquired under development Acquired Under agreements acquired under development construction construction under construction development Note: Under development includes tenders, feasibility studies,
currently under discussion and similar © 2024 – CMB.TECH 25


Financial terms: enterprise value to equity value bridge The
Acquisition Price for 100% of the shares in CMB.TECH is $ 1.150 billion in cash. Approximate enterprise value of $ 3.649 billion and an equity value of $ 1.150 billion Financial terms The transaction includes $ 2.496 billion roll-over debt (bank,
leasing and shipyard liabilities). This includes: Net existing financial debt of $ 510 million Total nominal outstanding capital commitments of $ 1.986 billion – to be paid over the coming 3 years: (i) $ 1.625 billion has been secured and will
be rolled over; (ii) remaining unfunded capital commitment of $ 361 million will come from Euronav’s own cash. The Acquisition Price will be financed by Euronav from the cash proceeds of the sale of 24 VLCCs fleet to Frontline plc Financing by
Euronav (which was announced by Euronav on 9 October 2023) (1) $ 22 (1) $ 89 In $ millions $ 181 $ 510 $ 679 Unfunded – comes 67 Vessels $ 361 from Euronav cash $ 394 8 Vessels 5 Vessels $ 441 $ 1,625 Secured – rolled $ 3,649 over $
1,986 $ 1,888 28 Vessels $ 1,153 Dry Bulk Container Chemical Off-Shore Industry H2 Infrastructure (-) Overheads (-) Net Debt (-) Net Debt Enterprise Equity Value FMV FMV FMV Wind, Others DCF DCF and HQ Costs Net Existing Finacial Total Nominal Value
FMV DCF Debt 0utstanding Capital Commitments Note: Based on valuations as of 28/11/2023. Fair Market Value (FMV) sources: Arrow, BRS, Howe Robinson, Maersk Broker, SSY, and Hagland Shipbrokers. Others: Tugboats & Ferries. These firms have not
consented to the use of their names in this presentation, nor have they endorsed the transaction or made any recommendations relating thereto. Discounted cash Flow (DCF): intrinsic and prospective method valuing the business until end of holding
period through its future free cash flows discounted using the weighted average cost of capital (WACC) to obtain Enterprise Value (EV). © 2024 – CMB.TECH 27
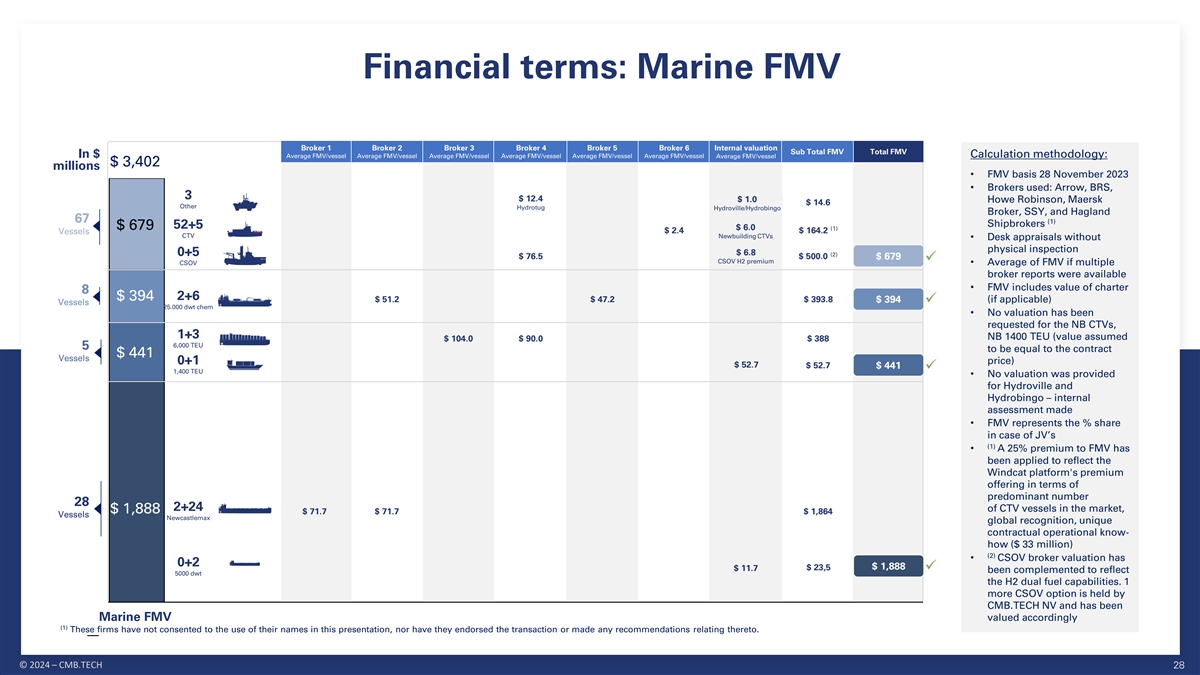
Financial terms: Marine FMV Broker 1 Broker 2 Broker 3 Broker 4 Broker
5 Broker 6 Internal valuation Sub Total FMV Total FMV In $ Calculation methodology: Average FMV/vessel Average FMV/vessel Average FMV/vessel Average FMV/vessel Average FMV/vessel Average FMV/vessel Average FMV/vessel $ 3,402 millions • FMV
basis 28 November 2023 • Brokers used: Arrow, BRS, 3 $ 12.4 $ 1.0 Howe Robinson, Maersk $ 14.6 Other Hydrotug Hydroville/Hydrobingo Broker, SSY, and Hagland 67 (1) Shipbrokers 52+5 $ 679 $ 6.0 (1) $ 2.4 $ 164.2 Vessels CTV Newbuilding CTVs
• Desk appraisals without physical inspection $ 6.8 0+5 (2) $ 76.5 $ 500.0 $ 679 CSOV H2 premium CSOV• Average of FMV if multiple broker reports were available • FMV includes value of charter 8 2+6 $ 394 $ 51.2 $ 47.2 $ 393.8 $ 394
(if applicable) Vessels 25.000 dwt chem • No valuation has been requested for the NB CTVs, 1+3 NB 1400 TEU (value assumed $ 104.0 $ 90.0 $ 388 6,000 TEU 5 to be equal to the contract $ 441 Vessels price) 0+1 $ 52.7 $ 52.7 $ 441 1,400 TEU
• No valuation was provided for Hydroville and Hydrobingo – internal assessment made • FMV represents the % share in case of JV’s (1) • A 25% premium to FMV has been applied to reflect the Windcat platform's premium
offering in terms of predominant number 28 2+24 of CTV vessels in the market, $ 1,888 $ 71.7 $ 71.7 $ 1,864 Vessels Newcastlemax global recognition, unique contractual operational know- how ($ 33 million) (2) • CSOV broker valuation has 0+2 $
23,5 $ 1,888 $ 11.7 been complemented to reflect 5000 dwt the H2 dual fuel capabilities. 1 more CSOV option is held by CMB.TECH NV and has been Marine FMV valued accordingly (1) These firms have not consented to the use of their names in this
presentation, nor have they endorsed the transaction or made any recommendations relating thereto. © 2024 – CMB.TECH 28

Financial terms: Industry DCF Business plan (in $ millions) Equity
value (in $ millions) $ million 2024E 2025E 2026E (# units) WACC 10.5% 18.0 35.9 39.5 Truck (75 #) (150 #) (165 #) Perpetual growth rate 2.5% 0.2 0.6 0.8 Generator Present value of Free Cash Flow 116 (10 #) (30 #) (36 #) Present value of Terminal
Value 65 0.8 0.8 6.1 Port Equipment (5 #) (5 #) (40 #) 3.2 7.4 12.6 Behydro Enterprise value of $ 181 million (in $ millions) (9 #) (21 #) (36 #) - 0.8 Locomotive - Perpetual Growth Rate (%) (2 #) (4 #) Total Revenue 22.1 44.7 59.8 -0.4% -0.2% -
+0.2% +0.4% OPEX -15.2 -31.1 -40.9 2.1% 2.3% 2.5% 2.7% 2.9% -0.4% 10.1% 192 193 195 198 200 EBITDA 0.8 7.4 12.6 -0.2% 10.3% 184 186 188 190 192 EBIT 0.8 7.4 12.3 - 10.5% 178 179 181 183 185 NOPAT 0.6 5.5 9.3 +0.2% 10.7% 171 173 174 176 178 Free Cash
Flow 0.6 2.8 4.1 +0.4% 10.9% 165 167 168 170 171 Discounted Cash Flow 0.6 2.4 3.2 Calculation methodology & comments: • Valuation as of 31 December 2023• Financials in group share for Engineering (100%), Truck (100%), Generator
(100%), BeHydro (50%), Port equipment (100%) and Locomotive (50%); Capex mainly represents acquisition; • Normative year reached in 2044 (20-year DCF) • EV=EqV as debt free cash free • Perpetual growth rate (PGR) of 2,5% in line
with peers average • Macroeconomic assumption 2% inflation on the costs of allocated FTEs from Engineering division • Normative EBITDA margin of 19% in line with best-in class industrial margins • Net working capital variation
assumed to be nil for all segments • WACC of 10.5% based on bottom-up calculation • Terminal Value: calculated using the Gordon Shapiro formula © 2024 – CMB.TECH 29 WACC (%)
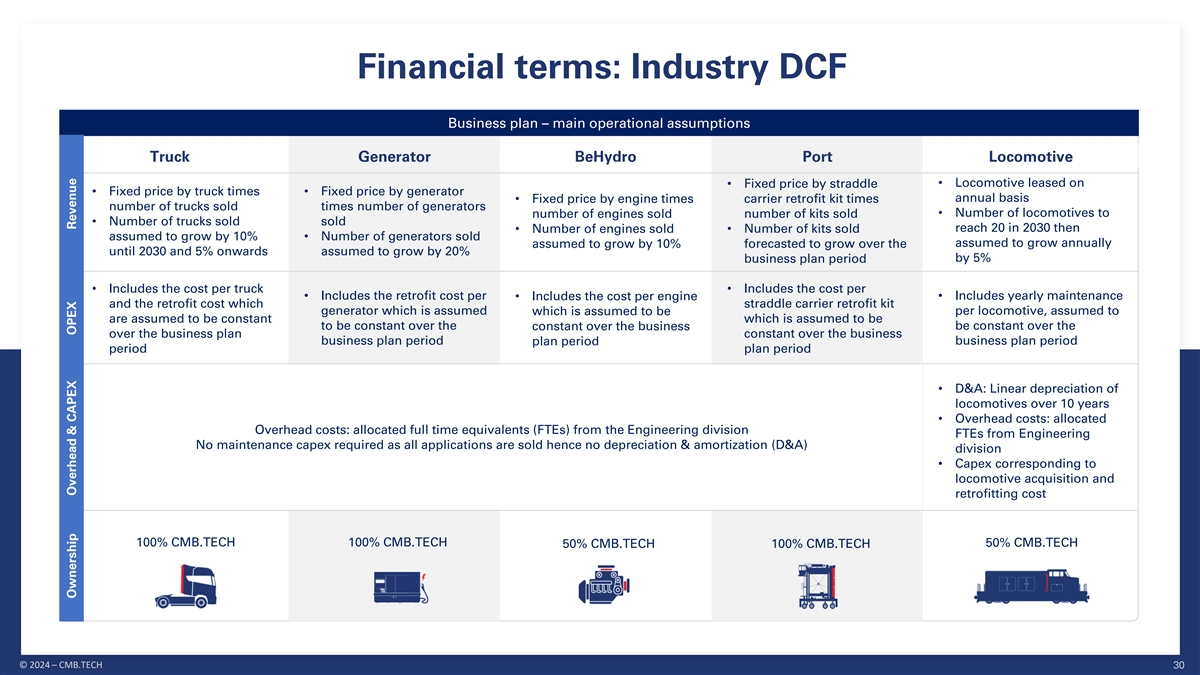
Financial terms: Industry DCF Business plan – main operational
assumptions Truck Generator BeHydro Port Locomotive • Fixed price by straddle • Locomotive leased on • Fixed price by truck times • Fixed price by generator • Fixed price by engine times carrier retrofit kit times
annual basis number of trucks sold times number of generators number of engines sold number of kits sold• Number of locomotives to • Number of trucks sold sold • Number of engines sold • Number of kits sold reach 20 in 2030
then assumed to grow by 10% • Number of generators sold assumed to grow by 10% forecasted to grow over the assumed to grow annually until 2030 and 5% onwards assumed to grow by 20% business plan period by 5% • Includes the cost per truck
• Includes the cost per • Includes the retrofit cost per • Includes the cost per engine • Includes yearly maintenance and the retrofit cost which straddle carrier retrofit kit generator which is assumed which is assumed to be
per locomotive, assumed to are assumed to be constant which is assumed to be to be constant over the constant over the business be constant over the over the business plan constant over the business business plan period plan period business plan
period period plan period • D&A: Linear depreciation of locomotives over 10 years • Overhead costs: allocated Overhead costs: allocated full time equivalents (FTEs) from the Engineering division FTEs from Engineering No maintenance
capex required as all applications are sold hence no depreciation & amortization (D&A) division • Capex corresponding to locomotive acquisition and retrofitting cost 100% CMB.TECH 100% CMB.TECH 50% CMB.TECH 100% CMB.TECH 50% CMB.TECH
© 2024 – CMB.TECH 30 Ownership Overhead & CAPEX OPEX Revenue

Financial terms: H2 infra DCF Business plan (in $ millions) Equity
value (in $ millions) Business plan (in $ million) Equity value (in $ million) WACC 24E-29E 12.0% $ million 2024E 2025E 2026E 2027E 2028E 2029E 2030E 2031E WACC 30E-31E 9.0% Perpetual growth rate 2.5% PV2Fuel pilot - - 1.3 1.3 1.3 1.4 1.4 1.4
Present value of Free Cash Flow -126 Present value of Terminal Value 215 PV2Fuel - - - - - 117.8 120.2 122.6 Refueling station 1.5 1.4 1.4 1.4 1.4 1.3 1.3 1.3 Enterprise value of $ 89 million (in $ millions) Total Revenue 1.5 1.4 2.7 2.7 2.8 120.5
122.9 125.3 Perpetual Growth Rate (%) OPEX -1.0 -1.3 -1.8 -1.7 -1.7 -18.5 -18.6 -19.0 -0.2% -0.1% - +0.1% +0.2% 2.3% 2.4% 2.5% 2.6% 2.7% EBITDA -0.9 -1.5 -0.7 -0.6 -0.6 100.3 102.5 104.5 -0.5% 8.5% 140 144 149 154 158 EBIT -1.1 -1.7 -1.5 -1.4 -1.3
73.1 75.3 77.3 -0.25% 8.8% 110 114 118 122 126 - 9.0% 82 85 89 92 96 NOPAT -1.1 -1.7 -1.5 -1.4 -1.3 49.7 51.2 52.6 +0.25 9.3% 56 59 62 65 69 Free Cash Flow -20.1 -71.0 -277.4 -300.0 -132.0 76.9 78.4 79.8 % +0.5% 9.5% 32 35 37 40 43 Discounted CF
-19.0 -60.4 -214.7 -213.6 -87.4 47.9 44.8 41.8 Calculation methodology & comments:• Financials in group share for PV2Fuel pilot (49%), PV2Fuel (25%) and Refueling station (100%) • Valuation as of 31 December 2023 • EV=EqV as
debt free cash free • Normative year reached in 2044 (20-year DCF) • Implied tax rate resulting from H2 Infra consolidated cash-flows • Perpetual growth rate (PGR) of 2,5% in line with selected peers average • Macroeconomic
assumptions: 2% inflation on the costs of allocated FTEs • Normative EBITDA margin of 84.6% in line with the average EBITDA margin since from Engineering division, opex inflation of 1%, and inflation on green FCF breakeven in 2029E until the
end of the forecast period ammonia’s price of 2% • Rolling WACC retained: 12.0% in 2024E and 9.0% from 2030E onwards • Net working capital variation assumed to be nil for all segments • Terminal Value: calculated using the
Gordon Shapiro formula © 2024 – CMB.TECH 31 WACC (%)

Financial terms: H2 infra DCF Business plan – main operational
assumptions PV2Fuel Pilot PV2Fuel Refueling Station • Volume of hydrogen produced times hydrogen price • Green ammonia price per kg times volume produced• Green ammonia price per kg times volume produced which is assumed flat from
2029E onwards • Includes fixed and variable costs (electricity, water and • Includes the various costs associated with the • Includes the various costs associated with the facilities other) facilities • Maintenance costs
D&A: Linear depreciation of the equipment Overhead costs: allocated FTEs from Engineering division • Capex includes group’s share of investment• Capex includes group’s share of investment• Capex includes
group’s share of investment Replacement • Replacement and maintenance capex are treated as opex • Replacement and maintenance capex are treated as and maintenance capex are treated as opex hence no hence no additional depreciation
opex hence no additional depreciation additional depreciation • Total capex of circa $ 40 million (excluding subsidy)• Total capex of approximately $ 2.8 billion • Total capex of approximately $ 4.4 million • Front End
Engineering Design (FEED) phase on-going • Construction ongoing, delivery expected June 2024• Final Investment Decision (FID) – Q4 2024• Delivered & in operation • In operation expected 2029 • 49%
CMB.TECH• 25% CMB.TECH• 100% CMB.TECH © 2024 – CMB.TECH 32 Ownership Status CAPEX Overhead OPEX Revenue

Fairness opinion: agreed valuation versus fairness opinion 22 89 181
2,496 3,649 3,402 1,153 • Overall, the Enterprise Value is aligned between the internal valuation (-) Overheads excersize, and the fairness opinion Industry H Infrastructure Enterprise 2 Equity Value Marine FMV and HQ Costs (-) Net Debt
performed by Degroof Petercam DCF DCF Value DCF • Differing methodology in regard of the capital commitments (discounted 1,327 capital commitments versus capital commitments) 3,377 3,648 2,321 215 57 0 Note: Based on valuations as of
28/11/2023. Fair Market Value (FMV) sources: Arrow, BRS, Howe Robinson, Maersk Broker, SSY, and Hagland Shipbrokers. Others: Tugboats & Ferries. These firms have not consented to the use of their names in this presentation, nor have they
endorsed the transaction or made any recommendations relating thereto. Discounted Cash Flow (DCF) © 2024 – CMB.TECH 33 Degroof Petercam valuation Agreed valuation

Fairness opinion Extract out of the fairness opinion (1) performed by
Degroof Petercam • Estimated Equity Value of CMB.TECH based (3) on the DCF valuation method within the range (1) of $ 1,157-1,449 million with a midpoint of $ 1,302 million. • Secondary method, the NAV, yields a valuation (2) range of $
1,105-1,435 million with a midpoint of $ 1,327 million • Based on the aforementioned valuation range for the primary and secondary valuation method, Degroof Petercam concluded that the Acquisition Price is within its valuation range •
Hence, in the context of the intended Acquisition announced on all the shares of CMB.TECH, Degroof Petercam is of the opinion that the Acquisition Price is fair to Euronav shareholders CMB.TECH acquisition price is at the lower end of the valuation
range (1) Fairness opinion of Degroof Petercam is available at Euronav’s website: https://www.euronav.com/media/67615/20231222_project-cmb2_valuation-opinion_.pdf (2) Based on the maximum and minimum of the upper and lower limits of each
sensitivity (3) WACC = weighted-average cost of capital © 2024 – CMB.TECH 34

CMB.TECH company profile 44+6 3 52+5 3 CTV Other CTV Other 0+5 2+24
CSOV Newcastlemax 0+4 0+8 25.000 dwt chem Newcastlemax 2+6 0+2 2 years 25.000 dwt chem 5000 dwt 0+12 0+1 1+3 6,000 TEU 6,000 TEU 1,400 TEU (2) (1) 60+46 FMV $ 3,402 million 47+30 ~FMV $ 1,787 million Cleanergy Solutions Namibia kicks off
construction works for Africa's first public 2023 refuelling station with onsite green hydrogen production 2023 Delivery of the world’s first hydrogen powered tugboat, Hydrotug, powered by 2 x 2MW BeHydro engines 2023 ATS & CMB.TECH launch
World's First Hydrogen Dual Fuel Straddle Carrier 2023 WinGD and CMB.TECH agree to co-develop large ammonia-fuelled two-stroke engines 2022 Opening CMB.TECH dual fuel workshop 2022 Volvo Penta & CMB.TECH partner on dual fuel hydrogen engines
2022 BeHydro launches 100% hydrogen engines for heavy-duty applications 2021 CMB, ITOCHU Corporation and Nippon Coke & Engineering Company join forces to build a company dedicated to local hydrogen production 2021 Launch of hydrogen-powered
truck & launch of hydrogen-powered excavator 2021 Launch of first multimodal hydrogen refuelling station 2020 Delivery of Asia’s first hydrogen powered ferry, HydroBingo, powered by 2020 CMB.TECH’s converted Volvo Penta D13 engines
BeHydro launches the first hydrogen-powered dual-fuel engine 2017 Delivery of the world’s first hydrogen powered ship, Hydroville, powered by CMB.TECH’s converted Volvo Penta D4 engines Time (1) Based on Vessels Value data of 01/01/2022.
CTV valuation based on 28/11/2023. (2) Based on valuations as of 28/11/2023. Fair Market Value (FMV) sources: Arrow Valuations Ltd. (“Arrow”), Barry Rogliano Salles International S.A. (“BRS”), Howe Robinson Partners UK Ltd
(“Howe Robinson”), Maersk Broker Advisory Services A/S (“Maersk Broker”), SSY Valuation Services Ltd. (“SSY”), and Hagland Shipbrokers ApS (“Hagland Shipbrokers”). These firms have not consented to the
use of their names in this presentation, nor have they endorsed the transaction or made any recommendations relating thereto. © 2024 – CMB.TECH 35 H2 infra and industry Marine Technology performance and scalability Q4 2021 Q4 2023

CMB.TECH is committed to creating value Building, owning, and operating
high-specification assets that generate predictable and A uncorrelated cash flows Targeting long-term contracts with blue-chip counterparties – where risks and rewards are B being shared between all parties Solving our customers’ scope 3
emission challenges by providing low carbon maritime C transportation assets A Targeting a large market cap, large trading liquidity, and to remain forward-looking on ESG Providing investment opportunities in the energy transition of the maritime
value chain B Creating investment opportunities for long-term buy-and-hold stories, and for partners C looking to smoothen the inherent cyclical volatility of shipping earnings Greening end-to-end Long-term contracts Investment Dual fuel mix
flexibility Opp ortunit y for Opportunity the supply chain of and predictable and reliability – ready green to invest opportunities for the our customers cash-flow today investments with impact long-term © 2024 – CMB.TECH
36

P&L break-even levels versus actual Time Charter Equivalent (TCE)
In $ per vessel per day 10,115 7,228 9,121 10,720 18,461 29,432 29,750 27,677 50,912 85,962 75,847 22,204 18,556 19,030 32,451 29,800 15,500 6,450 6,350 5,550 Newcastlemax bulk carrier 6000 TEU container vessel 25K DWT chemical tanker CSOV FSO - TC
OPEX OPEX OPEX OPEX OPEX (1) P&L break-even 2024 / day P&L break-even 2024 / day P&L break-even 2024 / day P&L break-even 2024 / day P&L break-even 2024 / day Actual Q4 2023 TCE / day Actual Q4 2023 TCE / day Actual Q4 2023 TCE /
day Forecast TCE / day Estimate Q4 2023 TCE / day TCE calculations: • Actual Q4 2023: Newcastlemax bulk carrier, 25K DWT chemical tanker • Actual Q3 2023: FSO, VLCC, and 13,038 14,693 Suezmax 21,874 21,976 • 6000 TEU container
vessel: all fixed under long-term time charter (10 39,475 42,708 46,617 38,192 years) • CSOV TCE rate is based on forecast 26,437 23,499 time charter rate (incl. other income) 24,743 20,732 • P&L break-even for 2024: includes 8,300
8,600 8,500 9,250 OPEX (incl. insurance and ship mgt fees), depreciation, interests, special VLCC - spot Suezmax - spot VLCC -TC Suezmax - TC expenses, arrangement fees & pool fees OPEX OPEX OPEX OPEX Comments P&L break-even 2024 / day
P&L break-even 2024 / day P&L break-even 2024 / day P&L break-even 2024 / day (1) • FSO’s are depreciated to nil value Estimate Q4 2023 TCE / day Estimate Q4 2023 TCE / day Estimate Q4 2023 TCE / day Estimate Q4 2023 TCE /
day under Qatar’s depreciation schedule, Note: The charter rate, financial and operating data included herein is provided for illustrative purposes only, is not based on historical finacial data and has not been reviewed by Euronav’s
auditors. all other vessels are depreciated over 20 years to scrap value © 2024 – CMB.TECH 37

P&L break-even levels versus TCE analyst consensus In $ per vessel
per day 1,394 10,840 9,216 12,096 10,720 34,300 29,750 29,750 19,950 19,950 41,667 41,667 86,687 85,962 31,950 18,556 75,847 32,451 22,204 19,030 Newcastlemax bulk carrier 6000 TEU container vessel 25K DWT chemical tanker CSOV FSO - TC P&L
break-even 2024 / day P&L break-even 2024 / day P&L break-even 2024 / day P&L break-even 2024 / day P&L break-even 2024 / day Time Charter Rate 2024 / day Consensus 2024 TCE / day Consensus 2024 TCE / day Consensus 2024 TCE / day
Time Charter Rate 2024 / day Time Charter Rate 2025 / day Consensus 2025 TCE / day Consensus 2025 TCE / day Consensus 2025 TCE / day Time Charter Rate 2025 / day (1) TCE consensus : • Newcastlemax: Fearnleys, DNB and Arctic, corrected for pool
points 15,380 21,176 • 6000 TEU: time charter rates 2024, 33,738 28,155 2025, 2026 • 25 dwt chemical tanker: time charter 60,175 48,887 46,140 45,919 38,735 38,879 47,690 rates for 4/8 vessels 49,090 • CSOV: Fearnleys, DNB and
Arctic 23,499 24,743 26,437 20,732 • FSO TC, VLCC TC, Suezmax TC: time charter rates 2024, 2025, and 2026 (if applicable) VLCC - spot Suezmax - spot VLCC -TC Suezmax - TC • VLCC and Suezmax: Gibson, Braemar SSY, BRS, Clarksons (adjusted
for P&L break-even 2024 / day P&L break-even 2024 / day P&L break-even 2024 / day P&L break-even 2024 / day scrubber and eco) Consensus 2024 TCE / day Consensus 2024 TCE / day Consensus 2024 TCE / day Consensus 2024 TCE / day
Consensus 2025 TCE / day Consensus 2025 TCE / day Consensus 2025 TCE / day Consensus 2025 TCE / day (1) Average of the different TCE rates. These firms have not consented to the use of their names and data in this presentation, nor have they
endorsed the transaction or made any recommendations relating thereto. Note: The charter rate, financial and operating data included herein is provided for illustrative purposes only, is not based on historical finacial data and has not been
reviewed by Euronav’s auditors. © 2024 – CMB.TECH 38

Available days In days Newcastlemax bulk carriers 6000 TEU container
vessels 25K DWT chemical tankers CSOV 0 0 0 0 0 0 0 0 0 0 822 733 732 1,460 1,460 1,460 2,243 5,187 8,842 953 1,460 1,460 1,613 447 2024 2025 2026 2024 2025 2026 2024 2025 2026 2024 2025 2026 Open days Fixed days FSO VLCC Suezmax Total 0 0 0 0 0 303
671 984 3,652 4,939 1,832 4,921 14,861 19,922 6,278 26,400 5,608 7,707 5,759 6,117 8,368 732 732 732 2024 2025 2026 2024 2025 2026 2024 2025 2026 2024 2025 2026 Open days Fixed days 19,782 24,861 30,052 days days days Assumptions: • Open days
and fixed days provide the total available days - aligned with newbuilding delivery schedules © 2024 – CMB.TECH 39

(1) Illustrative balance sheet : Euronav, CMB.TECH, and combined CMB -
CMB.TECH Elimination Other EURONAV CMB.TECH COMBINED CMB.TECH Illustrative in k USD receivable participation & consolidation 15/02/2024 15/02/2024 15/02/2024 acquisition price 15/02/2024 settlement receivable entries ASSETS NON-CURRENT ASSETS
1,840,681 991,094 2,831,775 1,150,000 0 -361,371 -788,629 2,831,775 Vessels 1,711,995 426,344 2,138,339 2,138,339 Assets under construction 82,264 525,233 607,497 607,497 CMB,TECH participation 0 0 0 1,150,000 -1,150,000 0 Other non-current assets
46,422 39,517 85,939 788,629 -788,629 85,939 CURRENT ASSETS 2,066,938 49,696 2,116,634 -1,150,000 0 -65,000 0 901,634 Trade and other receivables 242,496 39,899 282,395 65,000 -65,000 282,395 Cash and cash equivalents 1,823,642 0 1,823,642
-1,150,000 -65,000 0 608,642 Other current assets 800 9,797 10,597 10,597 TOTAL ASSETS 3,907,619 1,040,790 4,948,409 0 0 -426,371 -788,629 3,733,409 EQUITY and LIABILITIES EQUITY 2,843,007 361,371 3,204,378 0 0 -361,371 -788,629 2,054,378 Equity
attributable to equity holders of the Company 2,843,007 361,371 3,204,378 -361,371 -788,629 2,054,378 Non-controlling interest 0 0 0 0 NON-CURRENT LIABILITIES 737,290 552,446 1,289,736 0 0 0 0 1,289,736 Loans and borrowings 735,302 552,334 1,287,636
1,287,636 Other non-current liabilaties 1,988 112 2,100 2,100 CURRENT LIABILITIES 327,322 126,973 454,296 0 0 -65,000 0 389,296 Loans and borrowings 254,199 113,051 367,250 -65,000 302,250 Trade and other payables 70,313 13,570 83,883 83,883 Other
current liabilities 2,811 352 3,163 3,163 TOTAL EQUITY and LIABILITIES 3,907,619 1,040,790 4,948,409 0 0 -426,371 -788,629 3,733,409 (1) The Balance Sheet is provided for illustrative purposes only, is not a pro forma, is not based on historical
financial data and has not been reviewed by Euronav’s auditors. © 2024 – CMB.TECH 40

Disciplined capital allocation strategy Delivering returns to
Reinvesting in core business shareholders Sufficient working capital, Focus on leveraging solid asset performance, proven NH /H 03 3 2 01 and a favorable technology to become leader in our industry. capitalization structure. CMBT is a growth stock
We concentrate on with above-average building up our revenue, revenue and earnings even if it comes at the growth potential. cost of delaying increased profitability. Investing in growth and Maintaining balance sheet development strength 02 04
© 2024 – CMB.TECH 41

Current valuation presents attractive entry point Asset transfer
CMB.TECH transaction Upside NAV Acquisition Price for 100% of the shares in CMB.TECH is $ 1.150 billion in cash. Frontline will acquire 24 VLCC for $ 2.35 $/share 18.43 17.86 Enterprise value of $ 3.649 billion and billion – i.e. a transaction
at NAV an equity value of $ 1.153 billion Financed with $ 1.150 billion cash and $ Assets and liabilities are being replaced Significant growth in 2.496 billion roll-over debt (bank, leasing by cash and shipyard liabilities) energy transition
Potential industry/H Assets are added for cash 2 and liabilities. spin-offs Exposure to strong 09 October 2023 22 November 2023 12 December 2023 February 2024 current tanker cycle Strong project pipeline Oil tanker asset recycle opportunities
Agreement Q3 2023 dividend within portfolio Dividend payment to shareholders Agreement between CMB and of $ 0.57 Frontline/Famatown to solve the structural deadlock 18.43 17.86 At the time of the agreement, Base NAV the Euronav fleet is valued by 3
independent brokers © 2024 – CMB.TECH 42

CMB.TECH’s diversified green fleet fuels future CMBT growth (1)
SFDR Article 8 and 9 equity funds have received Asset prices and cycle showing that high tanker values 3.4x the cumulative inflows vs. non-ESG counterparts (Article give opportunity to recycle capital in the future-proof fleet 6) since 2019 SFDR
Article 6 Grey-to-Green Transition Future-proof Oil tanker LPG/LNG fleet Chem tanker SFDR Article 8 Dry Container Offshore Grey fleet SFDR Article 9 Time Inflow of capital (1) The Sustainable Finance Disclosure Regulation (SFDR) is a European
regulation introduced to improve transparency in the market for sustainable investment products, to prevent greenwashing and to increase transparency around sustainability claims made by financial market participants. © 2024 – CMB.TECH 43
TCE level

Our value proposition for investors LISTED.. LISTED.. EURONEXT NYSE
ACCESS TO ENERGY TRANSITION IN A LARGE LIQUID TOP RANKED BY TIER 1 ESG RATING AGENCIES ✓✓ STOCK BUSINESS MODEL FOCUSED ON LONG-TERM VALUE ✓✓ 3 CONSECUTIVE YEARS “B” RATING FOR CDP CREATION DIVERSIFIED FLEET,
DIVERSE END-MARKETS CURRENT VALUATION PRESENTS ATTRACTIVE ✓✓ ENTRY POINT TIER 1 CLIENTS, HIGH CONTRACTED VALUE STRONG ANCHOR SHAREHOLDER ENSURING ✓✓ STABILITY (1) (1) These firms have not consented to the use of their
names and logos in this presentation, nor have they endorsed the transaction or made any recommendations relating thereto. © 2024 – CMB.TECH 44


(1) A swift, just and equitable transition Oil demand scenarios (in
mb/d) NetZero scenario – VLCC tonnage requirements (# vessels) Million barrels per day # vessels VLCC orderbook stood >40% as percent of fleet 105 900 between 2006-2011. These VLCC’s will start ageing out of the fleet in the coming
years, boosting the supply-side story from ~2026 95 800 onward 85 700 75 75 ~2035: supply & demand tipping- 600 point and upscaling of regulations 65 21 (EU ETS/Fuel EU, IMO) 500 54 55 400 45 27 35 300 27 25 200 15 New Momentum Net Zero required
VLCC # 100 Accelerated Available VLCC – no new building 5 NetZero Available VLCCs – 25 new buildings per annum 0 2020 2025E 2030E 2035E 2040E 2045E 2050E 2015 2020 2025E 2030E 2035E 2040E 2045E 2050E (1) United Nations Climate Change
Conference (COP28) closed with an agreement that signals the “beginning of the end” of the fossil fuel era by laying the ground for a swift, just and equitable transition, underpinned by deep emissions cuts and scaled-up finance Source:
own calculations – basis BP, TotalEnergies, Equinor and IEA crude oil demand scenarios, Bloomberg. These firms have not consented to the use of their names and data in this presentation, nor have they endorsed the transaction or made any
recommendations relating thereto. © 2024 – CMB.TECH 47

The opportunity to recycle older tanker tonnage over time 10-year old
tanker asset value (in $ million) Regulatory frameworks expected impacts on (older) tanker tonnage VLCC 10 year $ million asset value Suezmax 10 year Number of ships Fuel EU/EU ETS 75 Euronav conventional fleet 42 Natural decline in Euronav
futureproof fleet Secondhand VLCC asset 70 Euronav conventional values are at a 14-year high, VLCC Newbuilding x1.2 38 fleet (20-year age cut-off) or at an all-time high if one excludes the 2005-2008 65 x1.4 VLCC 5 year 34 super cycle Growing
combined x1.6 60 Fuel EU, EU 30 ETS cost 55 26 22 50 x1.3 18 45 14 40 Accelerated recycling of older tonnage. 10 Future-proof tonnage on order: 3 x 35 ammonia powered ECO VLCC, and 6 4 x ECO Suezmax 30 2 0 year 0 2025E 2030E 2035E 2040E 2045E 2050E
2055E 2014 2015 2016 2017 2018 2019 2020 2021 2022 2023 year Source: own calculations – based on Evercorse ISI, Clarkson Research, Poten & Partners, BIMCO, Llyod’s Register. These firms have not consented to the use of their names
and data in this presentation, nor have they endorsed the transaction or made any recommendations relating thereto. © 2024 – CMB.TECH 48

Crude oil tankers Opec+ production cuts are delaying the short-term
demand story, but very compelling supply dynamics (1) Stock listed Crude Oil Tanker Fleet (VLCC & Suezmax) Euronav Fleet Fleet positioned for upcycle 15 17+3 22+4 2 Total DWT million VLCC ▪ The second biggest publicly listed crude oil VLCC
Suezmax Storage platform (dwt capacity perspective) Total DWT million Suezmax 10 ▪ Trading fleet of 17 VLCC and 22 Suezmax on the water 11 9.2 years 3,455 7 ▪ Future-proof tonnage on order: 3 x ammonia Avg. age FMV $ millions 6 6 powered
ECO VLCC, and 4 x ECO Suezmax 4 ▪ 2 long-term FSO contracts (2032), 2 T/C contracts Energy Type 4 3 3 7 VLCC, 5 T/C + profit share contracts Suezmax 4 4 2 4 3 ▪ High exposure and operational gearing into the NH 3 2 1 spot market FRO EUR
DHT INSW TNK NAT OET 45 3 0 Market Overview Order book Growing oil market imbalances drive tanker improvements Multi-year low crude tanker orderbook in combination with aging tonnage, fuels vessel valuation • Global oil consumption is expected
to hit a new record of 102.9 MBPD in 2024 • The tanker orderbook is now standing at 5.9% in total, with crude standing at 3.8% • Opec+ production cuts are delaying the crude transportation demand story • Currently, the fleet above
20 years of age comprises 13.8% in the crude space. Fast forward to the beginning of 2026 with the current fleet and age profile, expected to be • Modest crude ton-mile growth of 3% in 2024 24.5% • The age composition of the fleet
suggests that vessels will likely be scrapped • New oil supply is coming mainly from the Americas while new refinery capacity is added mainly in Asia, causing longer sailing distances It is expected that lack of tonnage entering the market,
combined with a gradual recovery in oil demand should result in a tight market. Utilization is still slowly moving upwards, and rates should improve going forward (1) Frontline and Euronav fleet figures give effect to the vessel sale. Basis fleet on
the water + new building orders. Source: IAE, Arctic, Clarksons. Fair Market Value (FMV) sources: Arrow, BRS, Howe Robinson, Maersk Broker, SSY, and Hagland Shipbrokers – basis fleet on the water + new building orders. These firms have not
consented to the use of their names and data in this presentation, nor have they endorsed the transaction or made any recommendations relating thereto. © 2024 – CMB.TECH 49


Dry-bulk vessels The supply/demand balance should remain stable in 2024
and is expected to tighten into 2025 Order book and utilization CMB.TECH Bocimar fleet Long-term dry-bulk vessel supply backdrop appears supportive overall 2+24 0+2 Newbuilding program aligned with the • In October 2023, the current Capesize
orderbook was 20 million DWT, a mere improving utilization levels (2024e-2026e) 5% of the Capesize fleet. Over all the different classes, a net supply growth of 3.0% in 2023, and 2.5%, 1.1%, and 0.4% the years 2024e through 2026e Newcastlemax 5.000
dwt• 26 super-eco 210,000 DWT Newcastlemax bulk carriers being delivered between July 2023 and • Lower fleet growth will help maintaining market balance. Basis market and order September 2026 (Qingdao Beihai shipyard) book, utilization
curve is forecasted at 85.1% in 2023, and to be 85.5%, 87.0%, • NH ready and NH fitted as soon as engine 3 3 and 87,9% in the years 2024 through 2026e <1 years 1,888 technology is available (as of second half 2025) Avg. age Avg. FMV $
• By 2027 (year after last Newcastlemax delivery) 70% of the capesize fleet (180 millions • Future-proof fleet with increasing commercial dwt or 782 vessels) is expected to be 15 years and more value in a changing regulatory landscape
Energy Type • Most fuel-efficient large dry-bulk vessels in the • By 2030 70% of the capesize fleet is expected to be 18 years and older world NH 3 • Current trading patterns suggest that only very specific clients can trade
vessels • 2 x 5,000 dwt coasters H powered 2 4 older than 15 years in Port Hedland (less than 1% of the fleet) and above 18 22 2 years no more capes are trading West Australia at all Newcastlemax Baby Cape > 20 years by 2030 Market Overview
618 Cape VLOC 34 Long term improved economic conditions is expected to in crease utilization as of ‘24 499 • Net demand estimated at -0.1% for 2023, and 3.0%, 2.9%, and 1.5% for 2024e through 117 2026, mainly driven by a forecasted
increasing demand for iron ore, grains, and minor bulks 467 309 307 in the period 240 106 • Iron ore shipments are estimated to grow 3.0% from 2023 to 2025 201 157 40 • Between 2023 and 2025, grain shipments may increase by 5.1% due to
maize 116 121 62 59 81 shipments growth in 2024 wheat volumes recovery in 2025 152 60 11 81 2 23 83 2 71 54 57 • 46 27 Bauxite trade up by 8 % in 2023 and forecasted to keep growing by 5-6% per year 3 4 6 8 • Other market supporting
factors : slower vessels speeds and increased EST time as 1993-2003 2004-2007 2008-2011 2012-2015 2016-2019 2020-2023 2024-2027E newbuilding environmental regulations impact, re-routing due to Panama Canal droughts Source: Cleaves, BIMCO, Clarksons.
Fair Market Value (FMV) sources: Arrow, BRS, Howe Robinson, Maersk Broker, SSY, and Hagland Shipbrokers – basis fleet on the water + new building orders. These firms have not consented to the use of their names and data in this presentation,
nor have they endorsed the transaction or made any recommendations relating thereto. © 2024 – CMB.TECH 51

Dry-bulk vessels Most fuel-efficient large bulkers in the world AND NH
ready 3 Capesize fleet compliance with IMO CII West Australia - China rountrip (in Ton LFSO) A C E +53.4% 71% B D 1,074 An estimated ~59% of existing Capesize bulkers will have a non-compliant CII rating (D or E) in 2023, growing to ~70% in 2026 and
~89% in 2031, based on 2019 performance 40% 888 30% 30% 29% 25% 19% 18% 37% 29% 18% 700 12% 10% 2% 8% 8% 7% 6% 5% 2019 2023 2026 2030 Mineral Maureen Mineral Qingdao Mineral Belgie Beihai HHI 2012, 206 dwt Yangfan 2020, 206 dwt 2023, 210 dwt
•• For ships that achieve a D rating for three consecutive years, or an E rating CMB.TECH’s Newcastlemax fleet fleet is expected to comply with EEDI/EEXI by a in a single year, a corrective action plan must be developed and
authorized / clear margin, while a large share of the Capesize fleet is likely to install energy approved by flag state or RO (Classification Society) power limitations to achieve compliance • Speed reductions are inevitable for non-compliant
vessels, resulting in • Cargo owners will likely seek to reduce their emissions throughout their value strengthened market fundamentals chains (scope 3), resulting in a chase for top-rated vessels (with low carbon dual fuel capabilities)
Source: Clarksons and own calculations. Clarksons has not consented to the use of their names and data in this presentation, nor have they endorsed the transaction or made any recommendations relating thereto. © 2024 – CMB.TECH
52


Chemical tankers Accelerated recovery expected to be aided by favorable
supply-side dynamics CMB.TECH Bochem fleet Order book Supportive supply side with a significant number of 2+6 vessels abov 20-years old (16%) Newbuilding program under favorable long-term charter contracts with Stolt Tankers ▪ Orderbook is at
historical low levels: total orderbook (in DWT) at 4.1% of the current core chemical tankers fleet (max 50% epoxy capacity and at least 14 segregations) ▪ Chemical tankers 8 super-eco 25,000 DWT chemical tankers NH 3 ready (CMJL Dingheng
shipyard) ▪ Average fleet age is 13 years, and 16% of the fleet is currently 20 years or older ▪ Limited yard capacity and long lead times for advanced chemical tankers suggest limited ▪ Future-proof fleet with increasing
commercial <1 years 394 1 fleet growth coming two-four years (first slots H2 26 / H1 27) value in a changing regulatory landscape Avg. age FMV $ millions ▪ Resulting in highly attractive supply side with fleet growth estimates of 0-2.5%
▪ Best-in-class 25.000 dwt on the water in 2023-26e Energy Type ▪ In addition, share of swing tonnage lifting chemicals remain at low levels (2023e) (cfr. strong product tanker market) NH 3 5 Market Overview Fleet employment 2024E and
2028E Chemical tanker demand is expected to grow Attractive long-term Bochem 2023 2024 2025 2026 2027 outlook for chemical tankers H1 H2 H1 H2 H1 H2 H1 H2 H1 H2 ▪ The global chemical tankers market is characterized by steady growth driven by
Houston Jun-23 increasing demand for chemical transportation▪ Fleet orders were Rotterdam Oct-23 concluded at attractive Casablanca Apr-24 point in the cycle ensuring ▪ In the main chemical export hubs production capacity grows faster
than consumption, Shanghai Jun-24 long-term attractive likely resulting in continued increases in exports going forward (cfr. US and MEG area) New Orleans Jul-24 returns. Robust backlog Brisbane Sep-24 and counterparties TBN 2025 ▪ Some short
term macro-economic headwinds : (i) Chinese economy remains uncertain, TBN 2025 provides forward visibility: but with signs of improving, (ii) Production levels in Europe remain low for the time being; and (iii) Geopolitical tensions increase
further Spot Spot pool Fixed under 10 y T/C Source: SEB, SIN, ICIS. Fair Market Value (FMV) sources: Arrow, BRS, Howe Robinson, Maersk Broker, SSY, and Hagland Shipbrokers – basis fleet on the water + new building orders. The firms have not
consented to the use of their names and data in this presentation, nor have they endorsed the transaction or made any recommendations relating thereto. © 2024 – CMB.TECH 54

Chemical tankers Steady volume growth in the medium term, whilst
tonne-miles increase due to trade flow disruption & support by European import demand. Inflationary impacts on demand to linger but freight likely to be supported by fleet contraction SP Trade Volumes & Tonne-Mile Development Chemical Tanker
Fleet Development Chemical Tanker Fleet Development Source: Clarksons Specialised Products Trade Snapshot & Chemical Tanker Age Profile – prepared for CMB.TECH, IMF. Clarksons has not consented to the use of their names and data in this
presentation, nor have they endorsed the transaction or made any recommendations relating thereto. © 2024 – CMB.TECH 55

Chemical tankers (1) Key chemical trade flows by 2022 & 2023
volumes (1) (1) MEG to FEA trade was the no.1 route of 2022/2023 , followed by intra-FEA & Intra-Europe volumes, FEA imported almost one-third of all chemical cargoes in 2022/2023 (1) 2023 volumes annualised basis Jan-Sept data. Source:
Clarksons Specialised Products Trade Snapshot & Chemical Tanker Age Profile – prepared for CMB.TECH, IMF. Clarksons has not consented to the use of their names and data in this presentation, nor have they endorsed the transaction or made
any recommendations relating thereto. © 2024 – CMB.TECH 56

Chemical tankers Chemical Tanker Fleet Age Profile – up to 55,000
DWT coated and stainless chemical tanker fleet In service fleet in numbers DWT distribution per build year Detail Values Total number of 3,205 ships Sum of DWT 52 (millions) Confirmed order 8% book (by DWT) Avaerage age 16.5 (Years) No. of coated
1,821 chemical units (1) No. of stainless 1,384 steel units (1) 2023 volumes annualised basis Jan-Sept data. Source: Clarksons Specialised Products Trade Snapshot & Chemical Tanker Age Profile – prepared for CMB.TECH, IMF. Clarksons has
not consented to the use of their names and data in this presentation, nor have they endorsed the transaction or made any recommendations relating thereto. © 2024 – CMB.TECH 57


Container vessels High orderbook points to challenging markets in
2024-2025 but eco ships in demand CMB.TECH Delphis fleet Order book 1+3 0+1 Newbuilding program under favourable Supply to outpace demand in both 2024 and 2025 long-term charter contracts with CMA-CGM ▪ Contracting of new ships continues at a
faster than normal pace. Capacity ▪ 6,000 TEU 1,400 TEU 4 super-eco 6,000 TEU ice class container feeder delivered during 2024 and 2025 is expected to reach 5.0 million TEU vessels (6,000 TEU with 1,150 reefer points) NH 3 ▪ Recycling of
ships remains low. It is expected to gather momentum during 2024 ready (Qingdao Yangfan Shipbuilding Co. Ltd.) and 720,000 TEU is forecast to be recycled during 2024 and 2025 combined <1 years 441 ▪ 1 x 1,400 TEU dual fuel NH (Qingdao
Yangfan 3 Avg. age FMV $ millions Shipbuilding Co. Ltd.)▪ The fleet is expected to grow 8.8% in 2024 and 6.4% in 2025. Due to lower congestion and slower sailing speed, supply is forecast to grow 6.8% in 2024 ▪ Future-proof fleet with
increasing commercial and 6.4% in 2024 Energy Type value in a changing regulatory landscape ▪ Fleet expansion is heavily skewed towards larger segments, whilst relatively ▪ Optimised Design providing trade flexibility and NH 3
operational efficiency (cfr. biggest ice-class ships oldest fleet today is 1-8k TEU in the world with compact dimensions for 5 versatile global trading) Market Overview Fleet employment 2024E and 2028E The weakening that began in 2022 and took hold
in 2023 is expected to Many uncertainties remain on the demand side continue also in 2024 and 2025 – however – CMB.TECH has strong contract ▪ The International Monetary Fund forecasts that the global economy will grow by 2.9% in
coverage & forward visibility 2024 and 3.2% in 2025 ▪ Robust backlog and counterparties provides forward visibility: 2023 2024 2025 2026 2027 ▪ Yet, the global manufacturing PMI has been below 50.0 for past eight months indicating a
H1 H2 H1 H2 H1 H2 H1 H2 H1 H2 slowing activity. In addition, the inventory to sales ratio for most sectors are back to 2019 CMA CGM Masai Mara Jun-23 Fixed under levels, indicating that inventory adjustments may have come to an end CMA CGM Zingaro
Jan-24 10 y T/C CMA CGM Etosha Jun-24 ▪ Growth in head-haul and regional trade volumes is expected to recover. We expect CMA CGM Dolomites Aug-24 Fixed under demand growth between 3.0% and 4.0% in 2024 and between 3.5% and 4.5% in 2025 TBN
1,400 TEU 2026 15 y T/C Source: BIMCO, Clarksons. Fair Market Value (FMV) sources: Arrow, BRS, Howe Robinson, Maersk Broker, SSY, and Hagland Shipbrokers – basis fleet on the water + new building orders. The firms have not consented to the use
of their names and data in this presentation, nor have they endorsed the transaction or made any recommendations relating thereto. © 2024 – CMB.TECH 60
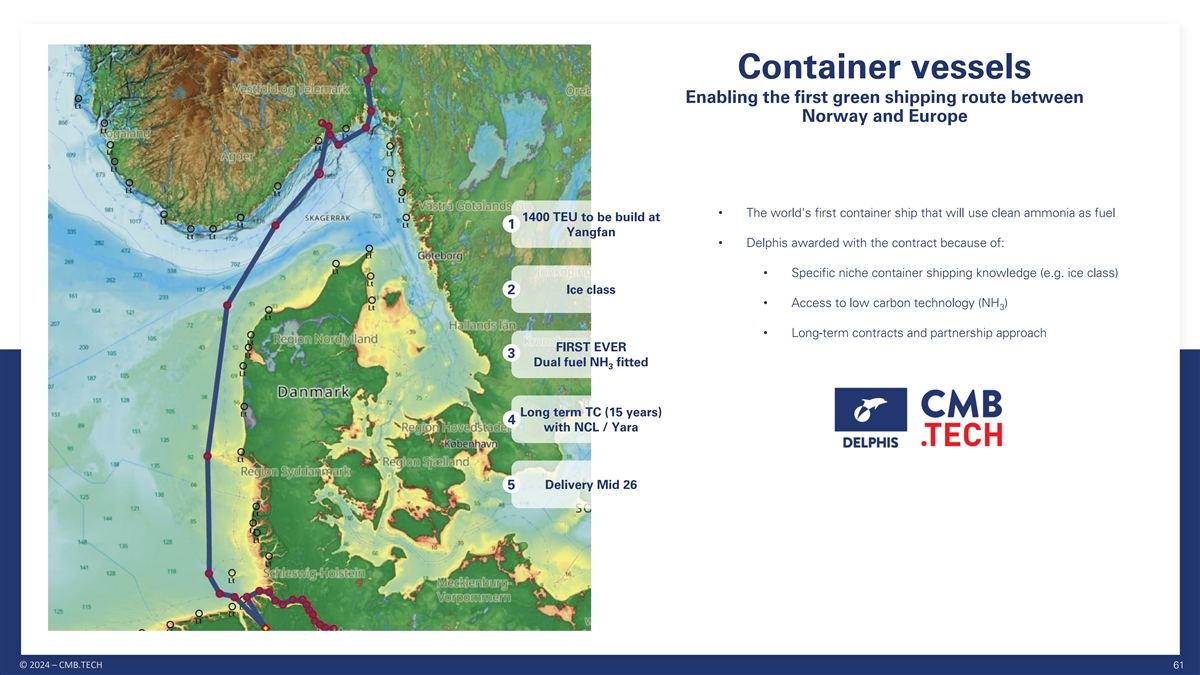
Container vessels Enabling the first green shipping route between
Norway and Europe • The world's first container ship that will use clean ammonia as fuel 1400 TEU to be build at 1 Yangfan • Delphis awarded with the contract because of: • Specific niche container shipping knowledge (e.g. ice
class) Ice class 2 • Access to low carbon technology (NH ) 3 • Long-term contracts and partnership approach FIRST EVER 3 Dual fuel NH fitted 3 Long term TC (15 years) 4 with NCL / Yara Delivery Mid 26 5 © 2024 – CMB.TECH
61


Offshore wind market Windcat Fleet 52+5 0+5 CTV CSOV <1 years Avg.
Age CSOV 8.9 years Avg. Age CTV Energy type 679 FMV mio $ 16 42 Windcat future-proof fleet positioned to benefit from positive offshore wind industry outlook • Windcat is expanding its commissioning service operation vessels (CSOV) fleet with
currently 5 hydrogen-powered CSOV’s on order (and one additional option) th • Upon delivery of the NB’s, Windcat’s CSOV fleet will be the 3 largest Tier 1 CSOV fleet that is stock listed • Future-proof fleet powered by
H at the heart of the sustainable transition 2 Fair Market Value (FMV) sources: Arrow, BRS, Howe Robinson, Maersk Broker, SSY, and Hagland Shipbrokers – basis fleet on the water + new building orders. The firms have not consented to the use of
their names and data in this presentation, nor have they endorsed the transaction or made any recommendations relating thereto. © 2024 – CMB.TECH 63

Overview personnel transfer solutions Commissioning & •
Offshore wind personnel can be transferred to Type Service Operations Helicopter Crew Transfer Vessel wind farms in multiple ways Vessel • (C)SOVs are preferred for projects further offshore # personnel 8-26 40-90 6-8 as they can accommodate
personnel nearby the wind farm Cargo capacity 0-10 tons 0-2,500 tons n.a. • Helicopters are a lesser used alternative for fast and small assignments • CTVs are the most cost-efficient solution in most Speed 20-30 knots 10-15 knots ~150
knots situations with very few limitations Optimal distance 0-100 km 50-150 km 30-70 km from shore Weather Up to 1.5 - 2m wave height (Hs) Up to 3- 3.5m wave height (Hs) Wind limitation limitations Direct vessel transfer – push on Motion
Compensated Gangway Transfer method Helicopter Hoist Dynamic Positioning ✓Potential cost-efficient solution: personnel costs decrease as a ✓The cost-efficient solution for ✓Can provide fast passenger result of reduced transit
time for wind farms up to 100km transfers in order to minimise projects farther from shore from shore costly downtime ✓SOVs can both transfer ✓CTVs can both transfer passengers and cargo, and × Requires the wind turbine to be
passengers and cargo accommodate crew personnel temporarily shut down up to four weeks ✓Quick distribution of × Only able to transfer personnel, ✓Transferring to turbines using personnel over multiple wind no cargo compensated
gangway possible turbines in higher sea states × Expensive solution × Limited in working hours ✓Higher day rates and fuel consumption © 2024 – CMB.TECH 64 Attributes

Offshore wind market CSOV market demand is expected to increase 3x by
the end of the decade and current orderbook remains insufficient Market Overview CSOV CSOV Rates in ‘000 $/day – 2020 to 2026E Strong growth expected in # of turbines, resulting in high demand for CSOVs – supporting the strong
outlook for CSOV economics ▪ ‘000 $ per day In comparison to Q3 2022, the CSOV market has seen a fixed rate increase of around 15- 28.6% 25% on average. Most vessel owners proposed (and fixed) their CSOVs in the third 50 quarter of 2023
at rate levels between € 39-48,000 per day (mostly for deployment in 2024). 45 ▪ Vessel rates for fixtures/charter proposals for 2024 are ranging around similar levels. Charterers have started their tender activity for 2024/2025 earlier
than in previous years, 40 driven by an expected tight market for the foreseeable future ▪ Scheduled newbuilding deliveries remains significantly below the growing demand for 35 CSOV’s for offshore wind turbine installations, in
addition, delays and unscheduled work at the existing wind farms result in additional work for CSOVs 30 Market Overview CTV’s 25 Slowly rising utilization rates support 2024/2025 economics 20 ▪ European CTV market has been very busy in
the spring/summer season with mostly all CTVs being on charter throughout the summer, and most vessels being still on charter by 15 the end of Q3 2023. ▪ High dayrates observed in the spot market, with rates of up to € 6,000 for 24 Pax
CTVs 10 (24/7), and 12 Pax CTVs ranging from € 2,200 to around € 4,000 per day (12/7). 5 ▪ Tendering for 2024 season has already started as well, and some Owners are already seeing limited availability for 2024 0 2020 2021 2022
2023e 2024e 2025e 2026e Source: Clarksons Offshore & Renewables, Fearnley Offshore Supply. The firms have not consented to the use of their names and data in this presentation, nor have they endorsed the transaction or made any recommendations
relating thereto. © 2024 – CMB.TECH 65

Offshore wind market Windcat Elevation class Platform features •
Length 89m, beam 20m, operational draught approx. 5.3 m • 90 cabins; maximum 120 POB. • 4x 1780 kW Schottel SPR-D 98º azimuthing thrusters • Large open work deck 550 m2 • Large warehouse with ample space for containers:
500 m2; easily accessible from work deck; including container handling system Equipment features Future Fuel • 3D motion compensated gangway with elevator, 3D • IMO Tier III Diesel-electric power generation, motion compensated offshore
crane supported by hybrid battery • Helicopter deck 21m • Dual fuel hydrogen MAN generator set installed • Potential upgrade of main engines to dual fuel hydrogen © 2024 – CMB.TECH 66


Why CMB.TECH believes in hydrogen and ammonia Batteries Photo-Voltaic
panels Wind-Energy Nuclear Bio-fuel & HVO LNG Ships require a large energy More interesting for slow sailing Hydrotreated Vegetable Oil still buffer, resulting in a battery The ship’s surface is not big vessels. Deck space is challenging,
Currently, too expensive, not emits carbon. Carbon neutrality Due to methane slip during production, size which is too large, too enough to even provide 10% is very dependent on origins of but with a projected saving insurable, requires too much
storage & combustion, heavy and too expensive. of the required power during specialized personnel. biomass. Challenging to produce of 10-30% the technology itself is GHG effect saving is negligible, not Currently there are no means daylight. not
sufficient to reach the IMO at large scale at an affordable making it better than the fuel it to charge this battery during limit of 50% GHG reduction. cost. Competition from other replaces. port call. harder to abate industries. E-fuels
(synthetically produced from H ) 2 Hydrogen Ammonia E-LNG E-methanol LOHC Efficient hydrogen carrier as 1x nitrogen can Same as LNG, it remains a carbon Starting point of any green fuel as it can be (Liquid organic hydrogen carrier) bond 3x hydrogen
molecules. emitter if used as fuel and made by just using green electricity to LOHC is an easy and safe way to store Hazard complexity due to its toxicity. methane slip issues remain. If the power an electrolyser which splits water Same as with LNG,
it emits hydrogen in a liquid oil (6,5%wt). However, Blue ammonia can be made from natural CO doesn’t originate from an into H and O . However, due to its storing 2 CO during combustion. rd 2 2 2 about 1/3 of the energy is lost for the gas, if
the CO is captured and stored during acceptable source of biomass or properties it becomes challenging if a large 2 endothermic reaction to release the production. Cheap alternative in the from direct air capture, it is unclear energy storage is
required. hydrogen from the carrier. transition towards green fuels. what this fuel really saves. Energy density Fuel equivalent for Net Weight Gross Weight Net Volume CO tank-to-wake 2 a typical voyage [ton] [ton] [m³] [ton] MGO* 700 749 777
2,205 H (compressed 300bar) 233 13,000 11,650 0 2 Zero carbon H (liquid -253°C) 233 420 3,281 0 2 fuels Ammonia (liquid -33°C) 1,694 2,044 2,320 0 LNG (liquid -162°C) 577 965 1,351 1,587 Methanol 1,616 1,791 2,015 2,214 LOHC (4,5wt%
effective) 5,177 5,695 5,384 0 (*) 700ton of MGO is a typical fuel consumption for a Newcastlemax bulk carrier sailing between Australia - China © 2024 – CMB.TECH 68

With strategic partnerships and co-development with OEMs, CMB.TECH has
access to the first marine H & NH powered engines 2 3 H engines – Medium speed (4-stroke) NH engines – Low speed (2-stroke) 2 3 (1) (1) • Together with WinGD a 2-stroke low-speed engine series is being developed• Since
2018, CMB.TECH is developing in a joint venture with ABC Engines • The WinGD X-DF-A dual-fuel ammonia engines have already been successfully a series of hydrogen powered medium engines tested at the development centre showing that NO and N O
emissions are • Both dual and mono fuel engines have x 2 2 within the latest emission regulations and can easily be neutralized by an been developed and brought to market emission aftertreatment• The power ranges from 700kW up to 2600kW
• CMB.TECH’s deep-sea ships will be fitted with these engines as off beginning 2026, allowing zero emission shipping H engines – High speed (4-stroke) 2 • In 2020, CMB.TECH initiated the • Hydroville was the first
marine class (1) cooperation with MAN to convert a approved dual fuel ship in the world (1) V12 engine to be used onboard powered by 2x Volvo Penta engine Hydrocat converted by CMB.TECH • Now, the first type approved dual fuel • Since
2017, CMB.TECH and Volvo engine will be brought to the market Penta have successfully converted a which has adapted hardware to enhance D4, D8 and D13 engine to run in dual the dual fuel performance fuel mode (up to 735kW) (735kW up to 1250kW) (1)
These firms have not consented to the use of their names and logos in this presentation, nor have they endorsed the transaction or made any recommendations relating thereto. © 2024 – CMB.TECH 69

CMB.TECH’s Technology & Development Centre has 15 years of
experience with H technology which is recognised by multiple OEMs 2 • The first tests with hydrogen combustion were conducted in 2008 • 25 years of experience as engineering and design team with a proven track record working on complex
and international projects • Since 2012 the dual fuel hydrogen-diesel technology was developed. The technology was further validated and finetuned on various engines and resulted in more than 100x applications which were tested in the field.
The majority of the converted vehicles were testing in a commercial, real-life environment • We have a uniquely skilled calibration team experienced in H combustion, which 2 has access to multiple dyno test cells fitted with the latest
emission after treatment measurement equipment • Highly skilled engineering team which can deliver a project from concept up to the production level and who worked on a long list of world’s first • Onsite capabilities at the
T&D Centre: • Test rig area with pressure test equipment • Hydrogen equipped dyno test cells • Hardware in the loop test rig • Engine build & prototyping workshops • Electrical & electronics build lab
• Fabrication & model studio © 2024 – CMB.TECH 70

CMB.TECH Industry develops land-based industrial equipment that is
deployed in port areas • Heavy-duty and long endurance (up to 21h/day) industry favouring the use of dual H production 2 fuel technology. Suitable equipment are: or H import 2 1. Trucks 2. Port and cargo handling equipment 3. Locomotives Port
Area CMB.TECH local dual fuel workshops 4. Power gensets 5. BeHydro Engines (1) • Given our established partnerships with BeHydro, Volvo Penta and Ford , a vast majority of solutions can be offered to this niche market where often fuel cell
applications have a limited use • From the equipment side, we are working with renowned partners with whom we 5 1 are designing multiple cargo handlers that can offer a robust, cost-effective and low carbon port operations • Due to its
long history in maritime, CMB.TECH has easy access to all major ports in the world 4 2 • CMB.TECH’s dual fuel technology allows the set-up of local dual fuel workshops • These hotspots will function as flywheel for CMB.TECH’s
marine hydrogen powered tugs, coasters, multi-functional port utility vessels, etc 3 (1) These firms have not consented to the use of their names and logos in this presentation, nor have they endorsed the transaction or made any recommendations
relating thereto. © 2024 – CMB.TECH 71

CMB.TECH Industry is an enabler for hydrogen supply and support
services in port areas and offers rapid scalability © 2024 – CMB.TECH 72

1. Dual-fuel hydrogen-diesel trucks Advantage The conversion Conversion
of the truck is done by The truck can always continue its operation 2x technicians on 3x days. on the proven diesel platform if H runs out or The conversion entails the installation of 6x 2 if there is no H refuelling station available. Type III
tanks on a frame which is bolted to 2 the chassis of the truck. Phase 1: Supervisory conversion Conversion is realized without the need for hardware or software changes on the current diesel Result engine. World harmonized emissions tests witnessed
by (1) TUV Rheinland show following savings in dual fuel mode: Transient Cycle (WHTC): Stationary Cycle (WHSC): 18,3% of CO savings 21,6% of CO savings 2 2 Phase 2: Integrated conversion Currently we are conducting enhanced testing, together with
the OEM to modify both the software and the hardware of the engine, to push the emission’s savings further. It is expected that an 80% CO savings can be achieved while driving at the highway 2 at 90km/h with full load. From a customer
perspective, H co-combustion has no compromise in range, payload, robustness, and durability, while having the ability to 2 offer a great emission reduction. Its cost and flexibility answers today’s needs of logistics companies for a low
threshold technology (1) These firms have not consented to the use of their names and logos in this presentation, nor have they endorsed the transaction or made any recommendations relating thereto. © 2024 – CMB.TECH 73

2. Dual-fuel hydrogen-diesel cargo handlers • As ports are
standardized around the ships, the cargo handlers have the same philosophy. What works in Antwerp will also work in Rotterdam, Hamburg, etc. • Cargo handlers often can’t drive on public roads, thereby requiring dual fuel technology in
case the HRS is out for maintenance • CMB.TECH is currently working on a yard tractor, Roro tractor and a hybrid straddle carrier which will be equipped with the dual fuel technology. • Preparations for a dual fuel RTG (rubber-tired
gantry) and reach stacker project have already been initiated. • The Volvo Penta D8 is the major workhorse in many cargo handlers. The emission savings realized by CMB.TECH's dual fuel technology are >80% CO at the sweet 2 spot of this
engine. © 2024 – CMB.TECH 74

3. Dual-fuel hydrogen-diesel locomotives • Railways are hard to
fully electrify in port areas. Especially where the electric overhead lines cannot be used for safety reasons. Furthermore on container terminals containers, the carriages are loaded from the top. • CMB.TECH’s combustion technology
allows the use of the zero-emission technology and can be implemented in the locomotive drivetrain with minimal engineering, keeping the robustness and simplicity • To showcase the potential of the technology for long haul transport, CMB.TECH
is working on the HyRail project where 2x locomotives are converted to operate with green H fuel in dual-fuel 2 mode. The project includes the design, build, test, commissioning and operation of the locomotive and H fuel tender car 2 • The
dual fuel technology implemented uses the BeHydro V12 medium speed engine which base engine is already widely used in railway. This engine is also compatible with the GE's 7FDL12 engine making it an ideal engine for repowering projects. • In
Africa alone there are 4000x locomotives that are nearing end of life, offering great forward potential HyRail project for long haul for the BeHydro engines. (1) • Our high-speed engines Volvo Penta D8 and MAN V12 engines are also suitable for
the smaller sized locomotives, typically used for shunting applications. • Dual fuel capability is key in order to kickstart the energy transition in railway. Our dual fuel technology can later on be converted to monofuel hydrogen and is
compatible with the hybridization of locomotives. Shunting locomotive concept with BeHydro engine (1) These firms have not consented to the use of their names and logos in this presentation, nor have they endorsed the transaction or made any
recommendations relating thereto. © 2024 – CMB.TECH 75

4. Hydrogen powered gensets (dual-fuel and monofuel) Gensets •
Since 2018 CMB.TECH has put mono and dual fuel gensets into operation to power events (such as COP26) and has sold a dozen of them to Ziero, Aggreko, (1) PlusZero and NENS-power for showcasing the technology. (1) • In 2023, we have partnered
up with e-power (land-based) and DBR (marine), who are packaging our mono/dual fuel engines into a commercial applications which are offered to the market. Power barge • Feasibility has already been conducted and new regulations force ports to
offer cold ironing technology to the ships before 2030. • A mobile power barge could offer the flexibility to supply ships with clean power, everywhere at any time. • No need for expensive grid upgrade nor the investments into expensive
power electronics for delivering the right Frequency/Voltage. • The power barge can also be used as a floating refuelling station for H powered 2 ships. The hydrogen genset can also be installed on shore to cut emissions. (1) These firms have
not consented to the use of their names and logos in this presentation, nor have they endorsed the transaction or made any recommendations relating thereto. © 2024 – CMB.TECH 76


H Infra: flywheel for both marine and industry divisions 2
CMB.TECH’s H infra division offers hydrogen and ammonia fuel to its customers, either through its own production or by sourcing it from third party producers. 2 Within H infra, the necessary technology and infrastructure is designed, developed
and operated to produce and distribute green hydrogen and ammonia. 2 • CMB.TECH has built the world’s first maritime & public H refueling station with onsite green H production which 2 2 Maritime & public H 2 can be dispensed to
trucks, cars, trailers, and ships (1.2 MW PEM electrolyser) production & refueling • Thanks to the Antwerp production and refuelling station, CMB.TECH has gained valuable experience and insights on station Antwerp costs, operational and
technical issues that will be used in future projects. • CMB.TECH has developed a 40ft 500bar trailer to facilitate remote refueling for all of our applications. This enables us to support the customers of our Marine & Industry division
with the supply of hydrogen. Mobile refueller • This trailer can refuel 3 x CTVs, 20 x trucks or 15 x straddle carriers. Two trailers are in operation, and two trailers are being delivered Q1 2024 • Access to cheap ammonia by developing
a green NH production project in a country with abundant availability of 3 sun. PV2Fuel Namibia • Selection of Namibia: stable country, significant solar potential, availability of port infrastructure, and abundant land availability (1)
• Cooperation with Namibian partner Olthaver & List to incooperate local know-how into project • The PV2Fuel strategy is to start small with a realistic and concrete approach. Construction works are ongoing for our first phase, a
hydrogen production project. • Using renewable wind power to produce H at sea to refuel ships. 2 Offshore • Solution supports growth of Windcat refueling station • Project in feasibility phase (1) These firms have not consented to
the use of their names and logos in this presentation, nor have they endorsed the transaction or made any recommendations relating thereto. © 2024 – CMB.TECH 78

Visual impression H Infra 2 Ongoing construction of Hydrogen production
and refuelling station in Namibia Refuelling operation of Hydrocat with mobile refueller Hydrogen production and refuelling station in Antwerp Artistic impression of offshore refuelling station © 2024 – CMB.TECH 79
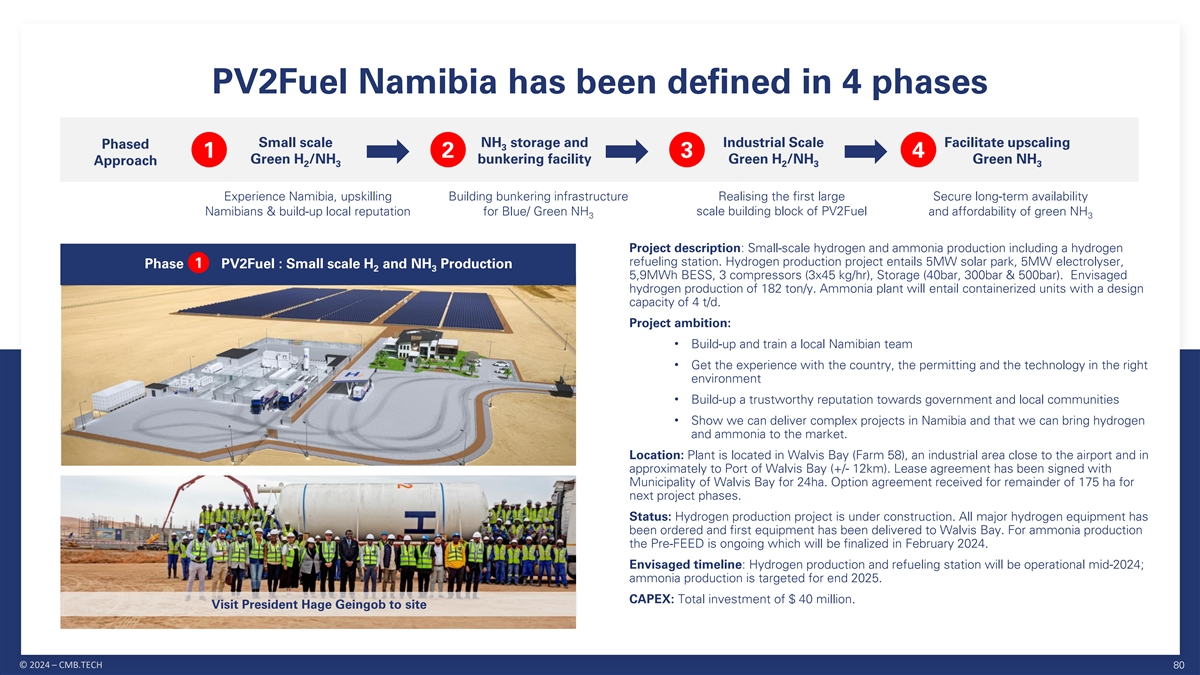
PV2Fuel Namibia has been defined in 4 phases Small scale NH storage and
Industrial Scale Facilitate upscaling Phased 3 1 2 3 4 Green H /NH bunkering facility Green H /NH Green NH Approach 2 3 2 3 3 Experience Namibia, upskilling Building bunkering infrastructure Realising the first large Secure long-term availability
scale building block of PV2Fuel Namibians & build-up local reputation for Blue/ Green NH and affordability of green NH 3 3 Project description: Small-scale hydrogen and ammonia production including a hydrogen refueling station. Hydrogen
production project entails 5MW solar park, 5MW electrolyser, Phase 1 PV2Fuel : Small scale H and NH Production 2 3 5,9MWh BESS, 3 compressors (3x45 kg/hr), Storage (40bar, 300bar & 500bar). Envisaged hydrogen production of 182 ton/y. Ammonia
plant will entail containerized units with a design capacity of 4 t/d. Project ambition: • Build-up and train a local Namibian team • Get the experience with the country, the permitting and the technology in the right environment •
Build-up a trustworthy reputation towards government and local communities • Show we can deliver complex projects in Namibia and that we can bring hydrogen and ammonia to the market. Location: Plant is located in Walvis Bay (Farm 58), an
industrial area close to the airport and in approximately to Port of Walvis Bay (+/- 12km). Lease agreement has been signed with Municipality of Walvis Bay for 24ha. Option agreement received for remainder of 175 ha for next project phases. Status:
Hydrogen production project is under construction. All major hydrogen equipment has been ordered and first equipment has been delivered to Walvis Bay. For ammonia production the Pre-FEED is ongoing which will be finalized in February 2024. Envisaged
timeline: Hydrogen production and refueling station will be operational mid-2024; ammonia production is targeted for end 2025. CAPEX: Total investment of $ 40 million. Visit President Hage Geingob to site © 2024 – CMB.TECH 80

NH storage and bunkering facility to kickstart 3 the usage for shipping
Project description: An import/ export ammonia terminal including bunkering facilities with a storage capacity of 40.000 tons. The terminal can be integrated into the exiting Phase 2 PV2Fuel: NH Terminal 3 jetty operated by Namcor by adding NH
loading lines and NH loading arm. 3 3 Project ambition: • Create an ammonia bunkering and storage hub to kickstart the usage of ammonia as a bunker fuel for shipping • Create a unique gateway to clean-fuels customers from a location
where green ammonia can be produced at the lowest cost Status: Front-End Engineer Design (FEED) ongoing. Non-binding MOU signed with Namcor for the existing Jetty Envisaged timeline: Operational 2026 Visual impression NH tank terminal 3 Location:
Terminal will be located in the North Porth of Walvis Bay close to the existing Jetty. Option agreement received from Namport for an area of 113ha. CAPEX estimation: $ 200 million Existing Jetty © 2024 – CMB.TECH 81

Once the technology is proven, PV2Fuel can be scaled up which will
result in a low-cost NH production 3 3 4 Phase PV2Fuel: NH Production Phase PV2Fuel: NH Upscaling 3 3 • Once the technology, the business model and framework agreements with suppliers, • Project description: Industrial scale green
ammonia production based on 930MWp governments, contractors are proven, the technology is ready for scale up. As solar plant, 500MW electrolyser (CF of 41%) and a total estimated ammonia CMB.TECH we can support this upscaling based on our
experience. production of 185kton/y • The utilisation rate of the electrolyser will drive the LCOA much less, as the cost of the electrolyser is expected to decrease drastically in the near future. • Project ambition:• It is
expected that once production can be scaled further, green ammonia can be competitive with blue and grey ammonia. • Secure long-term availability of green ammonia at low-cost for our fleet by developing and investing, in cooperation with other
companies, in a first industrial-scale green NH project. 3 Namibia Project area • Acquire the knowledge on green NH production cost for future offtake 3 agreements • Facilitate the upscaling to several multi-GW scale projects in the
region to support the world’s demand for clean fuels. Arandis (2000ha) 3a • Status: PRE-FEED engineering finalized by Technip Energies and preparing Invitation to Bid for FEED engineering. 2 1 Walvis Bay 3b (113ha) Farm 58 •
Envisaged timeline: Operational 2028 (175ha) • Location: Solar park and electrolysers will be located in Arandis. Produced hydrogen will be transported to Farm 58 via pipeline where it will be used to produce NH . 3 NH pipeline (5km 18”)
3 Farm 58 will be connected with the tank terminal via an ammonia pipeline. NH pipeline (12km 6”) 3 H pipeline (80km 18”) Project location 2 10km • CAPEX estimation : $ 2.55 billion SCALE © 2024 – CMB.TECH 82


Future energy demand: accelerating efficiency and reducing fossil fuel
dependency Global consumption shifts away from fossil fuels to decrease carbon footprint Total final consumption by fuels Total energy consumption by fuel in 2050 in two different scenarios 700 Key takeaways 600 Other ▪ In a net zero scenario,
total energy supply shifts away from unabated fossil fuels Other while supply from low-emissions sources 500 increases Gas Hydrogen/Ammonia H 2▪ Electrification becomes more prevalent, resulting in a cleaner power sector 400 Other▪ Key
trends shaping the future of energy: Batteries ▪ Diminished significance of Gas hydrocarbons 300 Oil ▪ Swift growth of renewable energy CCS sources 200 ▪ Amplified adoption of electrification Oil ▪ Escalating utilization of
low-carbon Coal hydrogen 100 Green electricity Coal Brown electricity ▪ By 2050, the hydrogen (and by extension, Brown electricity ammonia) market could be 20 times larger Green electricity Green electricity than it is today 0 2018 2050 - IAE
Current Policies Scenario 2050 - 1.5°C target Sources: IEA, Bloomberg, Fearnleys. These firms have not consented to the use of their names and data in this presentation, nor have they endorsed the transaction or made any recommendations
relating thereto. © 2024 – CMB.TECH 86 Exajoules

Clean Hydrogen growth potential: energy demand supplied from hydrogen
to witness north of 25% CAGR next 30 years Global energy demand supplied from Hydrogen (MT) approx. 3,200 GW incremental 660 approx. 1,300 GW incremental Power generation Mobility 385 Core industries approx. 500 GW incremental Building and industry
heat New industry 140 feedstock 90 Existing industry use 2020 2030E 2040E 2050E Existing industry use New industry feedstock Building and industry heat Mobility Power generation Sources: IEA, Hydrogen Council. These firms have not consented to the
use of their names and data in this presentation, nor have they endorsed the transaction or made any recommendations relating thereto. © 2024 – CMB.TECH 87

Growth trajectory supported by national strategies: worldwide efforts
to combat climate change (1) 16% 25% 2% 4% 18% As % of GDP world Representing approximately 66% worldwide GDP Net-zero emission by Re-entered in the Committed to becoming Reaching net-zero GHG Commitment to reach Vision / Goal 2050 (one of top 3
global Paris Agreement climate-neutral by 2050 emissions by 2050 carbon-neutrality by 2060 clean H producers) 2 By 2050, hydrogen demand in Clean hydrogen has the Hydrogen is seen as a key By 2050, Hydrogen could 14% hydrogen in the the US could
reach 63 million potential to deliver up to technology for becoming meet 18% of total global energy mix, or 500 GW of Hydrogen strategy MT (14% of final energy 30% of end-use energy carbon-neutral energy demand renewable electrolysers demand) by
2050 Publishments Current CMB presence Sources: World Bank, National strategies /. Note: (1) Data as of 2022. These firms have not consented to the use of their names and data in this presentation, nor have they endorsed the transaction or made any
recommendations relating thereto. © 2024 – CMB.TECH 88

Long-haul hydrogen transportation will be likely in the form of Ammonia
Volume (MtH /yr) 2 Repurposed pipeline 1.5 New pipeline Ammonia Key takeaways Liquid H 2 NH 3 H 2 • Transportation infrastructures eye ammonia as a safer, cost-effective means NH H 3 to export hydrogen in large quantities 2 Liquid Gas Liquid
• Ammonia boasts high volumetric H 2 density (17.6 wt%) and a 1.5x higher 1.0 120 18.6 LHV (MJ/kg) heating value compared to pure liquid H , 2 making it an attractive option 3 12.7 7.5 8.5 Volumetric density (GJ/m ) • Its stability and
lower energy requirement for liquefaction add to its appeal over pure H 2 700 1 Storage pressure (bar) 1 • Ammonia leverages established synthesis technology and existing supply chains, 0.5 streamlining its integration 20 -253 -34 Storage
temperature (°C) • The potential for ammonia extends to transportation, notably in marine bunkering, as engine manufacturers work on dual-fuel systems incorporating Handling / Conversion complexity + + + + + ammonia for ships' internal
combustion engines 1 000 5 000 10 000 Distance (km) Sources: Roland Berger, Wood Mackenzie, Irena. These firms have not consented to the use of their names and data in this presentation, nor have they endorsed the transaction or made any
recommendations relating thereto. © 2024 – CMB.TECH 89

Alternative fuel adoption in today’s maritime industry is shaping
tomorrow’s conventional fuel independence by 2050 (1) Alternative fuel uptake in the world fleet by gross tonnage Expectations of the main shipping players on the future fuel sources 100% Ships in operation Ships on order 4% 8% 15% 90% 28% 36%
93.5% 48.7% H 2 80% 70% + 6.5% 51.3% 60% Conventional fuel Alternative fuel Conventional fuel Alternative fuel 50% • A fuel technology transition is already underway in the maritime industry and 40% gathering pace while the search for
solutions continues • For ships in operation, 6.52% of tonnage can now operate on alternative fuels, 30% compared to 5.5% last year • The uptake of methanol and LPG is starting to be effective, together with the first 20% hydrogen-fueled
newbuilds 10% • Several demonstration projects for ammonia-fueled ships are also ongoing nowadays and some preparation for potential conversion to ammonia propulsion has been done at the newbuild stage 0% 2025 2030 2035 2040 2045 2050 •
The uptake of vessels capable of operating with ammonia as a primary fuel is expected to gather pace in the coming years with the development of the Oil based LNG LPG Methanol Biofuels Ammonia/Hydrogen technology Sources: DNV, McKinsey &
Company, Mærsk Mc-Kinney Møller Center / Note: (1) As of July 2023. These firms have not consented to the use of their names and data in this presentation, nor have they endorsed the transaction or made any recommendations relating
thereto. © 2024 – CMB.TECH 90

Fleet List (1/3) 0+2 6,000 TEU 2+24 1+3 1,400 TEU 0+1 Newcastlemax
5.000 dwt # Ship's name Built Type Size Shipyard H2/NH3 # Ship's name Built Type Size Shipyard H2/NH3 1 CMA CGM Masai Mara Jun-23 Container vessel 6.000 TEU Yangfan Shipyard Super-Eco (MAN); NH3 Ready 1 Mineral Belgie Jul-23 Newcastlemax bulk
carrier 210.000 dwt Qingdao Beihai Super-Eco (MAN) 2 CMA CGM Zingaro Jan-24 Container vessel 6.000 TEU Yangfan Shipyard Super-Eco (MAN); NH3 Ready 2 Mineral Nederland Aug-23 Newcastlemax bulk carrier 210.000 dwt Qingdao Beihai Super-Eco (MAN) 3 CMA
CGM Etosha Jun-24 Container vessel 6.000 TEU Yangfan Shipyard Super-Eco (MAN); NH3 Ready 3 Mineral Luxembourg Jan-24 Newcastlemax bulk carrier 210.000 dwt Qingdao Beihai Super-Eco (MAN) 4 CMA CGM Dolomites Aug-24 Container vessel 6.000 TEU Yangfan
Shipyard Super-Eco (MAN); NH3 Ready 4 Mineral France Jan-24 Newcastlemax bulk carrier 210.000 dwt Qingdao Beihai Super-Eco (MAN) 5 TBN 1.400 TEU 2026 Container vessel 1.400 TEU Yangfan Shipyard Super-Eco (WinGD); NH3 FITTED 5 Mineral Deutschland
May-24 Newcastlemax bulk carrier 210.000 dwt Qingdao Beihai Super-Eco (MAN); NH3 Ready 6 Mineral Italia Jul-24 Newcastlemax bulk carrier 210.000 dwt Qingdao Beihai Super-Eco (MAN); NH3 Ready 7 Mineral Danmark Jul-24 Newcastlemax bulk carrier 210.000
dwt Qingdao Beihai Super-Eco (MAN); NH3 Ready 8 Mineral Eire Aug-24 Newcastlemax bulk carrier 210.000 dwt Qingdao Beihai Super-Eco (MAN); NH3 Ready 9 Mineral Hellas Sep-24 Newcastlemax bulk carrier 210.000 dwt Qingdao Beihai Super-Eco (MAN); NH3
Ready 10 Mineral Espana Oct-24 Newcastlemax bulk carrier 210.000 dwt Qingdao Beihai Super-Eco (MAN); NH3 Ready 11 Mineral Portugal Nov-24 Newcastlemax bulk carrier 210.000 dwt Qingdao Beihai Super-Eco (WINGD); NH3 Ready Chemical tankers 2+6 12
Mineral Osterreich Dec-24 Newcastlemax bulk carrier 210.000 dwt Qingdao Beihai Super-Eco (WINGD); NH3 Ready # Ship's name Built Type Size Shipyard H2/NH3 13 Mineral Sverige Mar-25 Newcastlemax bulk carrier 210.000 dwt Qingdao Beihai Super-Eco
(WINGD); NH3 Ready 1 Bochem Houston Jun-23 Chemical tanker 25.000 dwt CMJL Dingheng Super-Eco (MAN); NH3 Ready 14 Mineral Suomi May-25 Newcastlemax bulk carrier 210.000 dwt Qingdao Beihai Super-Eco (WINGD); NH3 Ready 2 Bochem Rotterdam Oct-23
Chemical tanker 25.000 dwt CMJL Dingheng Super-Eco (MAN); NH3 Ready 15 Mineral Polska Jul-25 Newcastlemax bulk carrier 210.000 dwt Qingdao Beihai Super-Eco (WINGD); NH3 Ready 3 Bochem Casablanca Apr-24 Chemical tanker 25.000 dwt CMJL Dingheng
Super-Eco (MAN); NH3 Ready 16 Mineral Cesko Sep-25 Newcastlemax bulk carrier 210.000 dwt Qingdao Beihai Super-Eco (WINGD); NH3 Ready 4 Bochem Shanghai Jun-24 Chemical tanker 25.000 dwt CMJL Dingheng Super-Eco (MAN); NH3 Ready 5 Bochem New Orleans
Jul-24 Chemical tanker 25.000 dwt CMJL Dingheng Super-Eco (MAN); NH3 Ready 17 Mineral Slovensko Sep-25 Newcastlemax bulk carrier 210.000 dwt Qingdao Beihai Super-Eco (WINGD); NH3 FITTED 6 Bochem Brisbane Sep-24 Chemical tanker 25.000 dwt CMJL
Dingheng Super-Eco (MAN); NH3 Ready 18 Mineral Slovenija Oct-25 Newcastlemax bulk carrier 210.000 dwt Qingdao Beihai Super-Eco (WINGD); NH3 FITTED 7 Bochem TBN 2025 Chemical tanker 25.000 dwt CMJL Dingheng Super-Eco (MAN); NH3 Ready 19 Mineral Malta
Nov-25 Newcastlemax bulk carrier 210.000 dwt Qingdao Beihai Super-Eco (WINGD); NH3 FITTED 8 Bochem TBN 2025 Chemical tanker 25.000 dwt CMJL Dingheng Super-Eco (MAN); NH3 Ready 20 Mineral Kypros Dec-25 Newcastlemax bulk carrier 210.000 dwt Qingdao
Beihai Super-Eco (WINGD); NH3 FITTED 21 Mineral Eesti Jan-26 Newcastlemax bulk carrier 210.000 dwt Qingdao Beihai Super-Eco (WINGD); NH3 FITTED 22 Mineral Latvija Mar-26 Newcastlemax bulk carrier 210.000 dwt Qingdao Beihai Super-Eco (WINGD); NH3
FITTED 23 Mineral Lietuva Mar-26 Newcastlemax bulk carrier 210.000 dwt Qingdao Beihai Super-Eco (WINGD); NH3 FITTED 24 Mineral Magyar May-26 Newcastlemax bulk carrier 210.000 dwt Qingdao Beihai Super-Eco (WINGD); NH3 FITTED Other 3 25 Mineral
Romania Jun-26 Newcastlemax bulk carrier 210.000 dwt Qingdao Beihai Super-Eco (WINGD); NH3 FITTED # Ship's name Built Type Size Shipyard H2/NH3 26 Mineral Balgariya Sep-26 Newcastlemax bulk carrier 210.000 dwt Qingdao Beihai Super-Eco (WINGD); NH3
FITTED 1 Hydroville 2017 Ferry 16 pax BW Seacat Volvo Penta H2 fitted 27 TBN 5.000 dwt 2026 General cargo 5.000 dwt Dung Quat Super-Eco ; H2 FITTED 2 HydroBingo 2020 Ferry 80 pax TFC Volvo Penta H2 fitted 28 TBN 5.000 dwt 2026 General cargo 5.000
dwt Dung Quat Super Eco ; H2 FITTED 3 HydroTug 2023 Tugboat 65 tbp Armon Shipyard BeHydro H2 fitted © 2024 – CMB.TECH 92

52+5 0+5 Fleet List (2/3) CTV CSOV # Ship's name Built Type Size
Shipyard H2/NH3 # Ship's name Built Type Size Shipyard H2/NH3 34 Windcat 39 15/01/2016 CTV 3,2 Dok en Scheepsbouw Woudsend Volvo D16 1 Windcat 1 24/02/2004 CTV 3 AF Theriault Volvo D16 35 Windcat 40 20/04/2017 CTV 3,5 Dok en Scheepsbouw Woudsend MTU
8V 2 Windcat 2 26/04/2005 CTV 1 AF Theriault Volvo D12 36 Windcat 41 22/01/2018 CTV 3,5 Dok en Scheepsbouw Woudsend MTU 8V 3 Windcat 3 29/03/2005 CTV 1 AF Theriault Volvo D12 37 Windcat 42 29/06/2018 CTV 3.5 Dok en Scheepsbouw Woudsend MTU 8V 4
Windcat 4 02/11/2005 CTV 1 AF Theriault Volvo D12 38 Windcat 43 19/11/2018 CTV 3.5 Dok en Scheepsbouw Woudsend MTU 8V 5 Windcat 6 11/07/2007 CTV 2 AF Theriault Volvo D16 39 Windcat 44 25/04/2019 CTV 3.5 Dok en Scheepsbouw Woudsend MTU 8V 6 Windcat 7
30/05/2007 CTV 2 Island Boats Inc Volvo D16 40 Windcat 45 15/09/2019 CTV 3.5 Dok en Scheepsbouw Woudsend MTU 8V 7 Windcat 10 19/05/2008 CTV 3XLR AF Theriault Volvo D16 41 Windcat 46 20/03/2020 CTV 3.5 Dok en Scheepsbouw Woudsend MTU 8V 8 Windcat 11
22/07/2008 CTV 3XL AF Theriault Volvo D16 42 Windcat 47 30/09/2020 CTV 3.5 Dok en Scheepsbouw Woudsend MTU 8V 9 Windcat 14 30/03/2009 CTV 3 Dok en Scheepsbouw Woudsend Volvo D16 10 Windcat 15 30/03/2009 CTV 3XLR Dok en Scheepsbouw Woudsend Volvo D16
43 Windcat 48 25/10/2021 CTV H2 Dok en Scheepsbouw Woudsend MAN H2 fitted 11 Windcat 16 01/10/2008 CTV 3 AF Theriault Volvo D16 44 Windcat 49 15/07/2021 CTV 3.5 Dok en Scheepsbouw Woudsend MAN H2 ready 45 Windcat 50 31/03/2022 CTV 3.5 Dok en
Scheepsbouw Woudsend MTU 8V 12 Windcat 17 02/03/2009 CTV 3XLR AF Theriault Volvo D16 46 Windcat 51 10/05/2022 CTV 3.5 Dok en Scheepsbouw Woudsend MTU 8V 13 Windcat 18 11/05/2009 CTV 3XLR AF Theriault Volvo D16 14 Windcat 19 24/03/2008 CTV 3XLR AF
Theriault Volvo D16 47 Windcat 52 12/01/2022 CTV 3.5 Neptune Shipyards MAN H2 ready 15 Windcat 20 07/09/2009 CTV 3 Dok en Scheepsbouw Woudsend Volvo D16 48 Windcat 53 14/07/2022 CTV 3,5 Neptune Shipyards MAN H2 ready 49 Windcat 54 09/12/2022 CTV 3,5
Neptune Shipyards MAN H2 ready 16 Windcat 21 25/02/2010 CTV 3 AF Theriault MTU 8V 17 Windcat 22 05/02/2010 CTV 3XL Dok en Scheepsbouw Woudsend Volvo D16 50 Windcat 55 09/01/2023 CTV 3,5 Kuipers Wouds. MAN H2 fitted 18 Windcat 23 25/05/2010 CTV 3 AF
Theriault MTU 8V 51 Windcat 56 01/01/2024 CTV 3,5 Neptune Shipyards MAN H2 ready 19 Windcat 24 09/06/2010 CTV 3XLR Dok en Scheepsbouw Woudsend MTU 8V 52 Windcat 57 01/03/2024 CTV 3,5 Dok en Scheepsbouw Woudsend MAN H2 ready 20 Windcat 25 01/12/2010
CTV 3 Dok en Scheepsbouw Woudsend MTU 8V 63 Windcat 58 01/08/2024 CTV 5 Dok en Scheepsbouw Woudsend MAN H2 fitted 21 Windcat 26 06/04/2011 CTV 3 Dok en Scheepsbouw Woudsend MTU 8V 54 Windcat 59 01/11/2024 CTV 5 Neptune Shipyards MAN H2 ready 22
Windcat 27 06/04/2011 CTV 3 AF Theriault MTU 8V 55 Windcat 60 01/12/2024 CTV 5 Dok en Scheepsbouw Woudsend MAN H2 fitted 23 Windcat 28 15/03/2012 CTV 3 Dok en Scheepsbouw Woudsend MTU 8V 56 Windcat 101 01/04/2011 CTV 4 Bloemsma & van Bremen MTU
8V 24 Windcat 29 18/08/2011 CTV 3XL AF Theriault MTU 8V 57 Dorothea 21/02/2011 CTV X South Boats Special Projects Scania D16 Windcat 30 25/10/2012 CTV 3RW Dok en Scheepsbouw Woudsend Volvo D16 25 # Ship's name Built Type Size Shipyard H2/NH3 26
Windcat 31 10/04/2013 CTV 3RW Dok en Scheepsbouw Woudsend Volvo D16 27 Windcat 32 09/07/2013 CTV 3RW Dok en Scheepsbouw Woudsend Volvo D16 1 CSOV 552205 May-25 CSOV 120 pax Damen Vietnam H2 powered 28 Windcat 33 14/12/2013 CTV 3RW Dok en Scheepsbouw
Woudsend Volvo D16 2 CSOV 552206 Jul-25 CSOV 120 pax Damen Vietnam H2 powered 29 Windcat 34 18/10/2013 CTV 3.2XL Dok en Scheepsbouw Woudsend Volvo D16 3 CSOV 552207 Oct-25 CSOV 120 pax Damen Vietnam H2 powered 30 Windcat 35 02/04/2014 CTV 3,2 Dok en
Scheepsbouw Woudsend Volvo D16 4 CSOV XXX 2026 CSOV 120 pax Damen Vietnam H2 powered 31 Windcat 36 15/09/2014 CTV 3,2 Dok en Scheepsbouw Woudsend Volvo D16 5 CSOV XXX 2026 CSOV 120 pax Damen Vietnam H2 powered 32 Windcat 37 20/02/2015 CTV 3.2XL Dok
en Scheepsbouw Woudsend Volvo D16 (*) CSOV XXX Option 2026 CSOV 120 pax Damen Vietnam H2 powered 33 Windcat 38 05/07/2015 CTV 3,2 Dok en Scheepsbouw Woudsend Volvo D16 © 2024 – CMB.TECH 93

Fleet List (3/3) Suezmax 22+4 17+3 VLCC Ship's name Built Type Size
Shipyard # Ship's name Built Type Size Shipyard # 1 Brest 2024 Suezmax 156,851 Hyundai Samho Heavy Industries Co., Ltd. Aegean 2016 VLCC 299,999 Hyundai 1 2 Bristol 2024 Suezmax 156,851 Hyundai Samho Heavy Industries Co., Ltd. Alsace 2012 VLCC
320,350 Samsung 2 3 Brugge 2023 Suezmax 156,851 Hyundai Samho Heavy Industries Co., Ltd. Antigone 2015 VLCC 299,421 Hyundai 3 4 Cap Corpus Christi 2018 Suezmax 156,600 Hyundai Daishan 2007 VLCC 306,005 Daewoo 4 5 Cap Felix 2008 Suezmax 158,765
Samsung Dalma 2007 VLCC 306,543 Daewoo 5 6 Cap Lara 2007 Suezmax 158,826 Samsung Dia 2015 VLCC 299,999 Daewoo 6 7 Cap Pembroke 2018 Suezmax 156,600 Hyundai Donoussa 2016 VLCC 299,999 Daewoo 7 8 Cap Port Arthur 2018 Suezmax 156,600 Hyundai Hakata
2010 VLCC 302,550 Universal 8 9 Cap Quebec 2018 Suezmax 156,600 Hyundai Hakone 2010 VLCC 302,624 Universal 9 10 Cap Theodora 2008 Suezmax 158,819 Samsung Hirado 2011 VLCC 302,550 Universal 10 11 Cap Victor 2007 Suezmax 158,853 Samsung Hojo 2013 VLCC
302,965 JMU 11 12 Captain Michael 2012 Suezmax 157,648 Samsung Ilma 2012 VLCC 314,000 Hyundai 12 13 Cedar 2022 Suezmax 157,310 Daehan Shipbuilding Co. Ltd. Ingrid 2012 VLCC 314,000 Hyundai 13 14 Cypress 2022 Suezmax 157,310 Daehan Shipbuilding
Co.,Ltd. Iris 2012 VLCC 314,000 Hyundai 15 Fraternity 2009 Suezmax 157,714 Samsung 14 Nectar 2008 VLCC 307,284 Dalian 16 H5088 2024 Suezmax 156,790 DH Shipbuilding Co., Ltd. 15 Newton 2009 VLCC 307,284 Dalian 17 H5089 2024 Suezmax 156,790 DH
Shipbuilding Co., Ltd. 16 Noble 2008 VLCC 307,284 Dalian 18 HXXXX 2026 Suezmax DH Shipbuilding Co., Ltd. 17 19 HXXXX 2026 Suezmax DH Shipbuilding Co., Ltd. TK300K-1 2026 VLCC 319,000 Qingdao Beihai Shipyard 18 20 Maria 2012 Suezmax 157,523 Samsung
TK300K-2 2026 VLCC 319,000 Qingdao Beihai Shipyard 19 21 Sapphira 2008 Suezmax 150,205 Universal TK300K-3 2026 VLCC 319,000 Qingdao Beihai Shipyard 20 22 Selena 2007 Suezmax 150,205 Universal 23 Sienna 2007 Suezmax 150,205 Universal 24 Sofia 2010
Suezmax 165,000 Hyundai 25 Statia 2006 Suezmax 150,205 Universal Storage 2 26 Stella 2011 Suezmax 165,000 Hyundai # Ship's name Built Type Size Shipyard 1 FSO Africa 2002 FSO 432,023 Daewoo 2 FSO Asia 2002 FSO 432,023 Daewoo © 2024 –
CMB.TECH 94
Exhibit 99.2
Alexander Saverys positions new Euronav as the ‘only investable green shipping platform’
Belgian executive explains why family rejected Frontline merger and its aims for the combination with eco-shipowner CMB.Tech
12 January 2024 10:20 GMT UPDATED 12 January 2024 11:18 GMT
By Gary Dixon in London
Alexander Saverys, chief
executive of Compagnie Maritime Belge (CMB) and Euronav, doubled down on his shipowning family’s green mission in an speech to shareholders on Friday.
Euronav is addressing investors today as it looks to reinvent itself after resolving an 18-month takeover tussle with
John Fredriksen this autumn in which 24 ships went to Frontline in the largest big-tanker sale and purchase deal ever.
US and Belgium-listed tanker owner Euronav is buying CMB’s low-carbon shipping operation CMB.Tech for $1.15bn to
create a fleet of 154 vessels worth $7bn.
Saverys told investors and media at Euronav’s capital markets day in Antwerp: “It is our aim to
create the new CMB.Tech, the reference in sustainable shipping, creating value through a diversified fleet and a strong focus on decarbonisation.
“We will use, produce, distribute and, in the medium run, transport and carry low-carbon fuels.”
Saverys believes the combined group can be “the only investable diversified green shipping platform for ESG funds”.
Shareholders will vote on the deal on 7 February, with 15 March eyed as a closing date. The new merged company, to be called CMB.Tech, will own
ships across the tanker, bulker, container and offshore wind sectors.
“A lot has been said and written about CMB, CMB.Tech and Euronav in the past
18 months,” Saverys told the meeting.
“The content ranged from relatively accurate to totally off the mark. We understand it has been difficult
to assess what a new diversification and decarbonisation strategy for Euronav means without having access to more information.
“And I will not dwell
on the reasons why we could not provide you with this information, because this would involve too much lawyer talk and we had enough of that over the past months.”
Value creation is key
He explained why the Saverys
family did not believe in a merger with Frontline or a pure-play crude oil tanker company.
“It’s actually quite simple. Value creation,” he said.
“We believe that a diversified shipping group with a strong focus on decarbonisation will create more value than a pure-play tanker company. This does
not mean we will exit the tanker markets. We still see opportunities there, but not as a pure-play.”
Saverys also addressed the question of why the
$2.35bn proceeds from selling 24 VLCCs to Frontline is not being handed over as dividends.
“We believe that we will create more value by reinvesting
this money rather than just pay a huge dividend. This does not mean we are against dividends. We see dividends as a value creator, but not the only value creator,” he said.
The family’s privately owned CMB has a 49% stake in Euronav, which requires it to offer to take over the rest of the stock.
Saverys called the mandatory bid price fair but not overly generous.
“We do it because the law says so,” he said.
Exit
route offered
“The bid has the tremendous advantage of offering all of you an exit at a decade-high price should you want to sell.”
The same applies to the offer by Euronav for CMB.Tech, he explained.
“Ladies and gentlemen, after today, you should ask yourself one question,” Saverys concluded.
“Do I believe in what the Euronav and CMB.Tech team is telling me today? Do I believe that holding a stock of a company that is a reference green
shipping stock will offer more value than continuing to be a company dependent 100% on the transport of crude oil?
“If the answer is yes, I gladly
welcome you to take a front seat on board of our big fleet of ships — destination: zero-carbon shipping.” (Copyright)
Euronav NV (NYSE:EURN)
Historical Stock Chart
From Apr 2024 to May 2024

Euronav NV (NYSE:EURN)
Historical Stock Chart
From May 2023 to May 2024
