false
0001035983
0001035983
2024-02-23
2024-02-23
iso4217:USD
xbrli:shares
iso4217:USD
xbrli:shares
UNITED STATES
SECURITIES AND EXCHANGE COMMISSION
Washington, D.C. 20549
FORM 8-K
CURRENT
REPORT
Pursuant
to Section 13 OR 15(d) of The Securities Exchange Act of 1934
Date of Report (Date of
earliest event reported) February 23, 2024
Comfort Systems USA, Inc.
(Exact name of registrant as specified in
its charter)
| Delaware |
|
1-13011 |
|
76-0526487 |
| (State or other jurisdiction |
|
(Commission |
|
(IRS Employer |
| of incorporation) |
|
File Number) |
|
Identification No.) |
| 675 Bering Drive, Suite 400 |
|
|
| Houston, Texas |
|
77057 |
| (Address of principal executive offices) |
|
(Zip Code) |
Registrant’s telephone number,
including area code (713) 830-9600
(Former name or former address,
if changed since last report.)
Check the appropriate box below if the Form 8-K filing
is intended to simultaneously satisfy the filing obligation of the registrant under any of the following provisions:
¨ Written communications
pursuant to Rule 425 under the Securities Act (17 CFR 230.425)
¨ Soliciting material
pursuant to Rule 14a-12 under the Exchange Act (17 CFR 240.14a-12)
¨ Pre-commencement communications
pursuant to Rule 14d-2(b) under the Exchange Act (17 CFR 240.14d-2(b))
¨ Pre-commencement communications
pursuant to Rule 13e-4(c) under the Exchange Act (17 CFR 240.13e-4(c))
Securities registered pursuant to Section
12(b) of the Act:
|
Title
of each class |
|
Trading
Symbol(s) |
|
Name
of each exchange on which registered |
| Common Stock, $0.01 par value |
|
FIX |
|
New York Stock Exchange |
Indicate by check mark whether the registrant is an emerging
growth company as defined in Rule 405 of the Securities Act of 1933 (§230.405 of this chapter) or Rule 12b-2 of the Securities
Exchange Act of 1934 (§240.12b-2 of this chapter).
Emerging growth company ¨
If an emerging growth company, indicate by check mark if the
registrant has elected not to use the extended transition period for complying with any new or revised financial accounting standards
provided pursuant to Section 13(a) of the Exchange Act. ¨
ITEM 7.01 Regulation FD Disclosure
On February 23, 2024, Comfort Systems USA, Inc., a Delaware corporation (the “Company”), a leading provider of commercial,
industrial and institutional heating, ventilation, air conditioning and electrical contracting services, posted to the “Investor”
section of its Internet website (www.comfortsystemsusa.com) an investor presentation slideshow. The Company intends to use this slideshow
in making presentations to analysts, potential investors, and other interested parties.
The information included in
the investor presentation includes financial information determined by methods other than in accordance with accounting principles generally
accepted in the United States of America (“GAAP”). The Company’s management uses these non-GAAP measures in its analysis
of the Company’s performance. The Company believes that the presentation of certain non-GAAP measures provides useful supplemental
information that is essential to a proper understanding of the operating results of the Company’s core businesses. These non-GAAP
disclosures should not be viewed as a substitute for operating results determined in accordance with GAAP, nor are they necessarily comparable
to non-GAAP performance measures that may be presented by other companies.
The
information in this Form 8-K being furnished under Item 7.01 shall not be deemed to be “filed” for the purposes of Section
18 of the Securities Exchange Act of 1934, as amended (the “Exchange Act”), or otherwise subject to the liabilities of such
section, nor shall such information be deemed incorporated by reference in any filing under the Securities Act of 1933, as amended, or
the Exchange Act, except as shall be expressly set forth by specific reference in such a filing. The investor presentation contains
forward-looking statements within the meaning of applicable securities laws and regulations. These statements are based on the Company’s
expectations and involve risks and uncertainties that could cause the Company’s actual results to differ materially from those set
forth in the statements. These risks are discussed in the Company’s filings with the Securities and Exchange Commission, including
an extensive discussion of these risks in the Company’s Annual Report on Form 10-K for the year ended December 31, 2023.
A copy of the presentation
is furnished herewith as Exhibit 99.1.
ITEM 9.01 Financial Statements and Exhibits
(d) Exhibits.
SIGNATURES
Pursuant to the requirements of the Securities Exchange
Act of 1934, the Registrant has duly caused this report to be signed on its behalf by the undersigned hereunto duly authorized.
| |
|
COMFORT SYSTEMS USA, INC. |
| |
|
|
| |
By: |
/s/ Laura F. Howell |
| |
|
Laura F. Howell |
| |
|
Senior Vice President and General Counsel |
Date: February 23, 2024
Exhibit 99.1
Quality People. Building Solutions. NYSE: FIX February 23, 2024

SAFE HARBOR Certain statements and information in this presentation may constitute forward - looking statements within the meaning of applicab le securities laws and regulations. The words “believe,” “expect,” “anticipate,” “plan,” “intend,” “foresee,” “should,” “would,” “could,” or oth er similar expressions are intended to identify forward - looking statements, which are generally not historic in nature. These forward - looking statements are based o n the current expectations and beliefs of Comfort Systems USA, Inc. and its subsidiaries (collectively, the “Company”) concerning future developments an d t heir effect on the Company. While the Company’s management believes that these forward - looking statements are reasonable as and when made, there can be no a ssurance that future developments affecting the Company will be those that it anticipates, and the Company’s actual results of operations, financi al condition and liquidity, and the development of the industry in which the Company operates, may differ materially from those made in or suggested by the f orw ard - looking statements contained in this presentation. In addition, even if our results of operations, financial condition and liquidity, and the d eve lopment of the industry in which we operate, are consistent with the forward - looking statements contained in this presentation, those results or developments may not be indicative of our results or developments in subsequent periods. All comments concerning the Company’s expectations for future revenue and ope rat ing results are based on the Company’s forecasts for its existing operations and do not include the potential impact of any future acquisitions. The C omp any’s forward - looking statements involve significant risks and uncertainties (some of which are beyond the Company’s control) and assumptions that cou ld cause actual future results to differ materially from the Company’s historical experience and its present expectations or projections. Important factors that could cause actual results to differ materially from those in the forward - looking statements include, bu t are not limited to: the use of incorrect estimates for bidding a fixed - price contract; undertaking contractual commitments that exceed the Company’s lab or resources; failing to perform contractual obligations efficiently enough to maintain profitability; national or regional weakness in construction a cti vity and economic conditions; rising inflation and fluctuations in interest rates; shortages of labor and specialty building materials or material increase s t o the cost thereof; the Company’s business being negatively affected by health crises or outbreaks of disease, such as epidemics or pandemics (and related impa cts , such as supply chain disruptions); financial difficulties affecting projects, vendors, customers, or subcontractors; the Company’s backlog failing to translate into actual revenue or profits; failure of third party subcontractors and suppliers to complete work as anticipated; difficulty in obtaining, or in cre ased costs associated with, bonding and insurance; impairment to goodwill; errors in the Company’s cost - to - cost input method of accounting; the result of co mpetition in the Company’s markets; the Company’s decentralized management structure; material failure to comply with varying state and local law s, regulations or requirements; debarment from bidding on or performing government contracts; retention of key management; seasonal fluctuation s i n the demand for mechanical and electrical systems; the imposition of past and future liability from environmental, safety, and health regulat ion s including the inherent risk associated with self - insurance; adverse litigation results; an increase in our effective tax rate; a material information techno logy failure or a material cyber security breach; risks associated with acquisitions, such as challenges to our ability to integrate those companies into our int ernal control environment; our ability to manage growth and geographically - dispersed operations; our ability to obtain financing on acceptable terms; extreme w eather conditions (such as storms, droughts, extreme heat or cold, wildfires and floods), including as a result of climate change, and any resulting reg ula tions or restrictions related thereto; and other risks detailed in our reports filed with the Securities and Exchange Commission (the “SEC”). For additional information regarding known material factors that could cause the Company’s results to differ from its project ed results, please see its filings with the SEC, including its Annual Report on Form 10 - K, Quarterly Reports on Form 10 - Q, and Current Reports on Form 8 - K. Readers are cautioned not to place undue reliance on forward - looking statements, which speak only as of the date hereof. The Company undertakes no obligat ion to publicly update or revise any forward - looking statements after the date they are made, whether because of new information, future events, or otherw ise. NON - GAAP MEASURES Certain measures in this presentation are not measures calculated in accordance with generally accepted accounting principles (“ GAAP”). They should not be considered a replacement for GAAP results. Non - GAAP financial measures appearing in these slides are identified in the footnote. See the Appendices for a reconciliation of these non - GAAP measures to the most comparable GAAP financial measures.
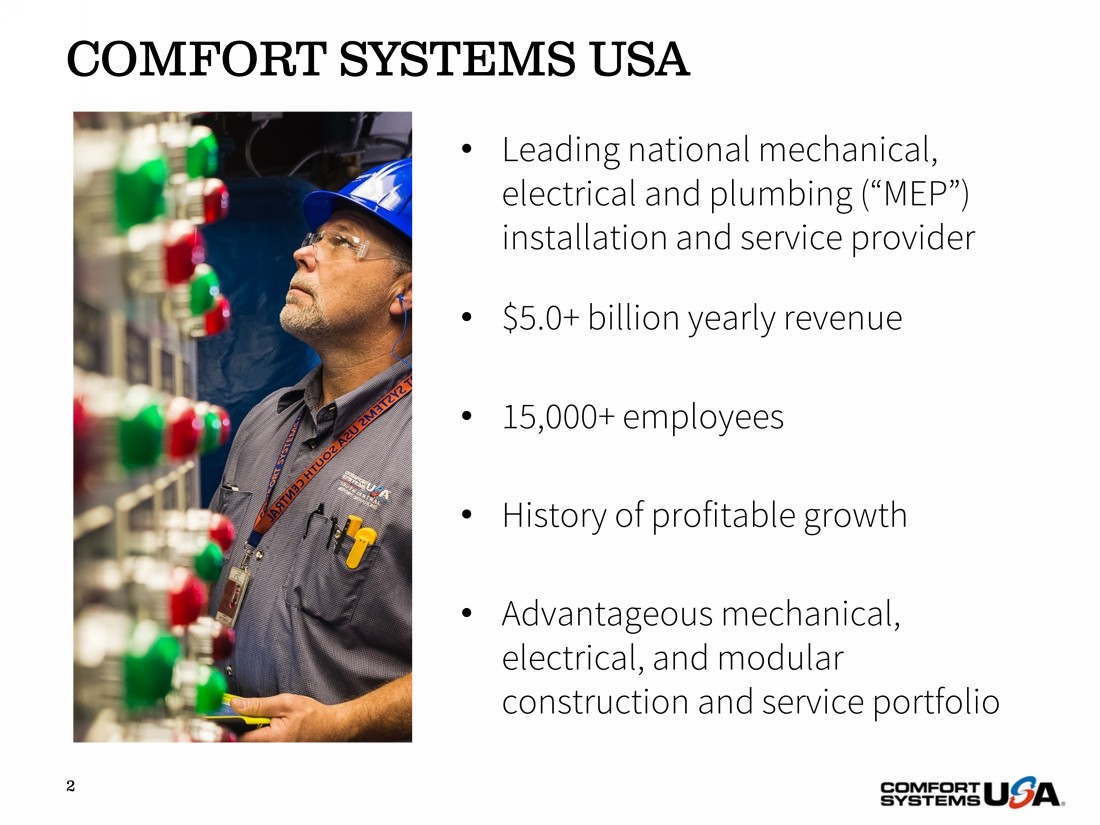
COMFORT SYSTEMS USA 2 • Leading national mechanical, electrical and plumbing (“MEP”) installation and service provider • $5.0+ billion yearly revenue • 15,000+ employees • History of profitable growth • Advantageous mechanical, electrical, and modular construction and service portfolio
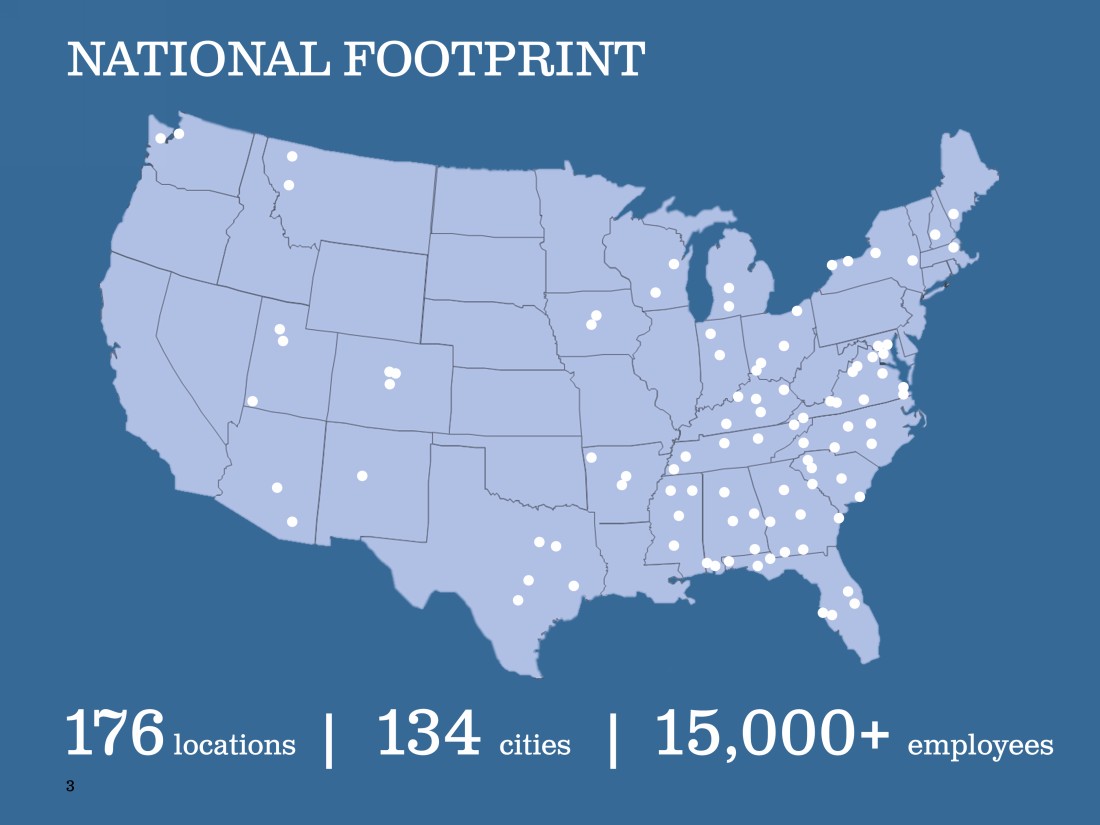
NATIONAL FOOTPRINT 3 176 locations | 134 cities | 15,000+ employees
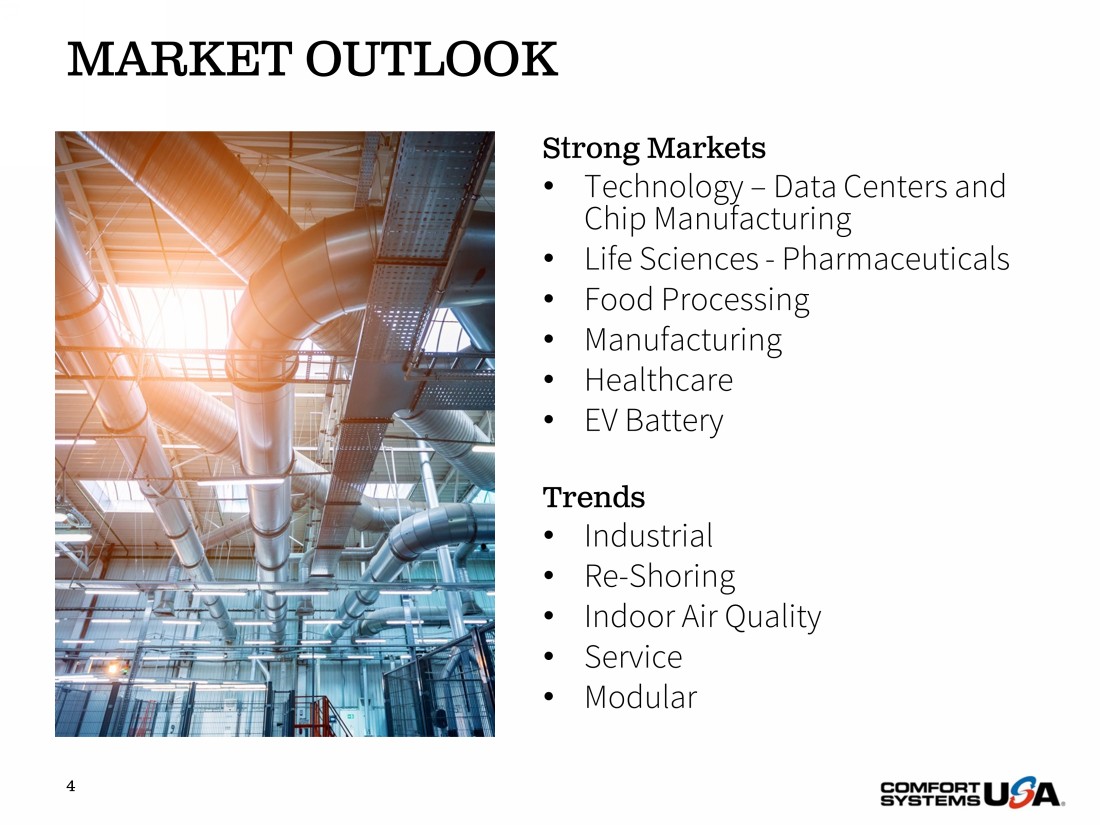
MARKET OUTLOOK 4 Strong Markets • Technology – Data Centers and Chip Manufacturing • Life Sciences - Pharmaceuticals • Food Processing • Manufacturing • Healthcare • EV Battery Trends • Industrial • Re - Shoring • Indoor Air Quality • Service • Modular
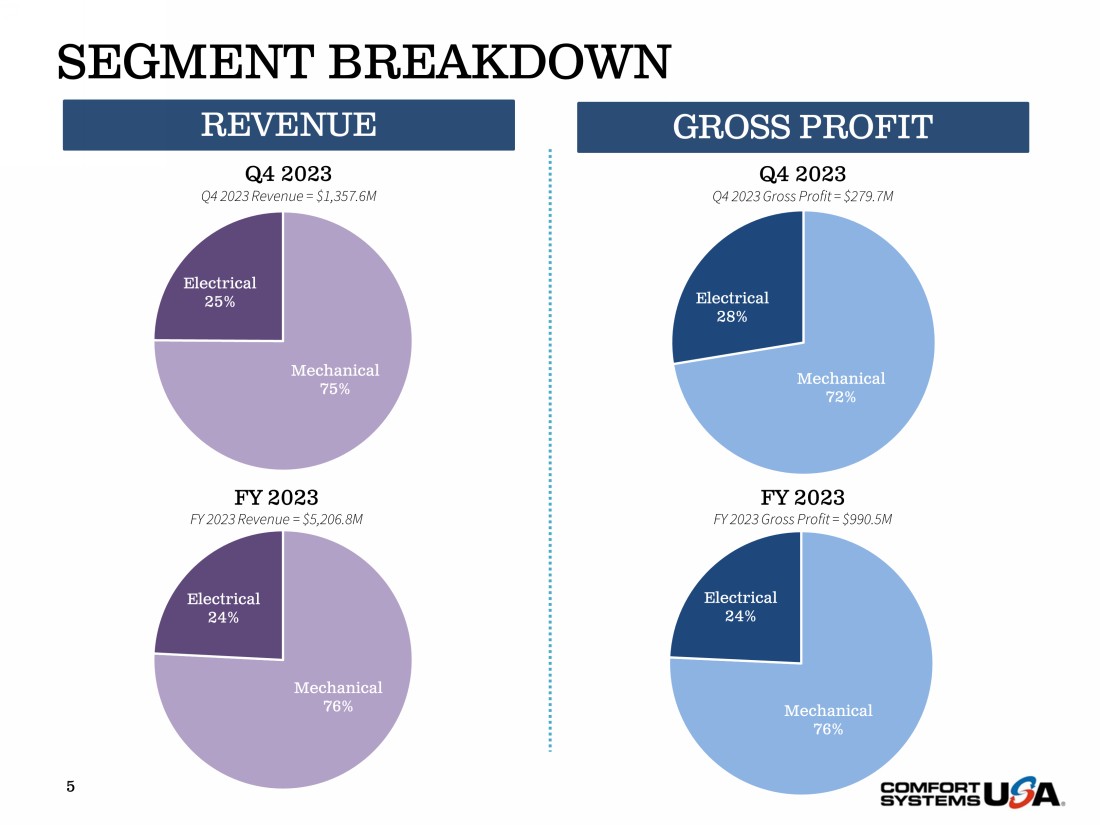
Mechanical 75% Electrical 25% SEGMENT BREAKDOWN 5 REVENUE Mechanical 72% Electrical 28% GROSS PROFIT Q4 2023 Gross Profit = $279.7M Mechanical 76% Electrical 24% Mechanical 76% Electrical 24% Q4 2023 FY 2023 FY 2023 Gross Profit = $990.5M Q4 2023 Revenue = $1,357.6M Q4 2023 FY 2023 FY 2023 Revenue = $5,206.8M
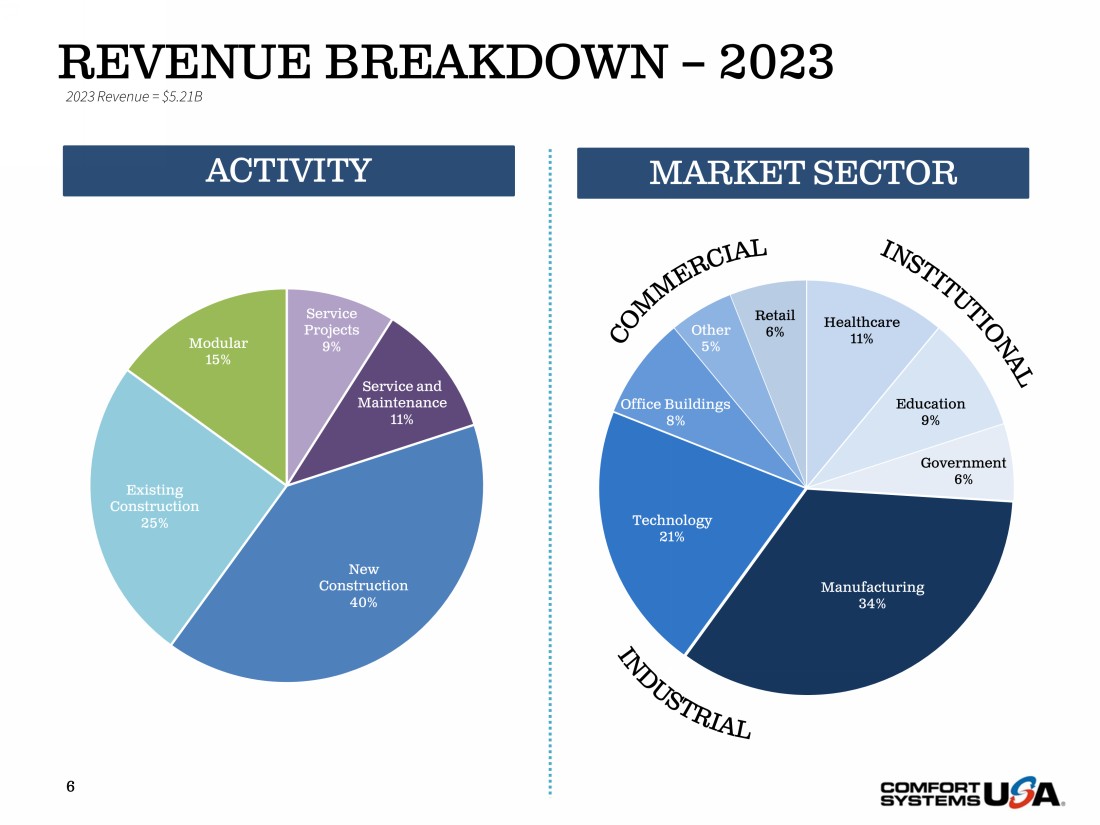
Service Projects 9% Service and Maintenance 11% New Construction 40% Existing Construction 25% Modular 15% REVENUE BREAKDOWN – 2023 6 ACTIVITY 2023 Revenue = $5.21B Healthcare 11% Education 9% Government 6% Manufacturing 34% Technology 21% Office Buildings 8% Other 5% Retail 6% MARKET SECTOR
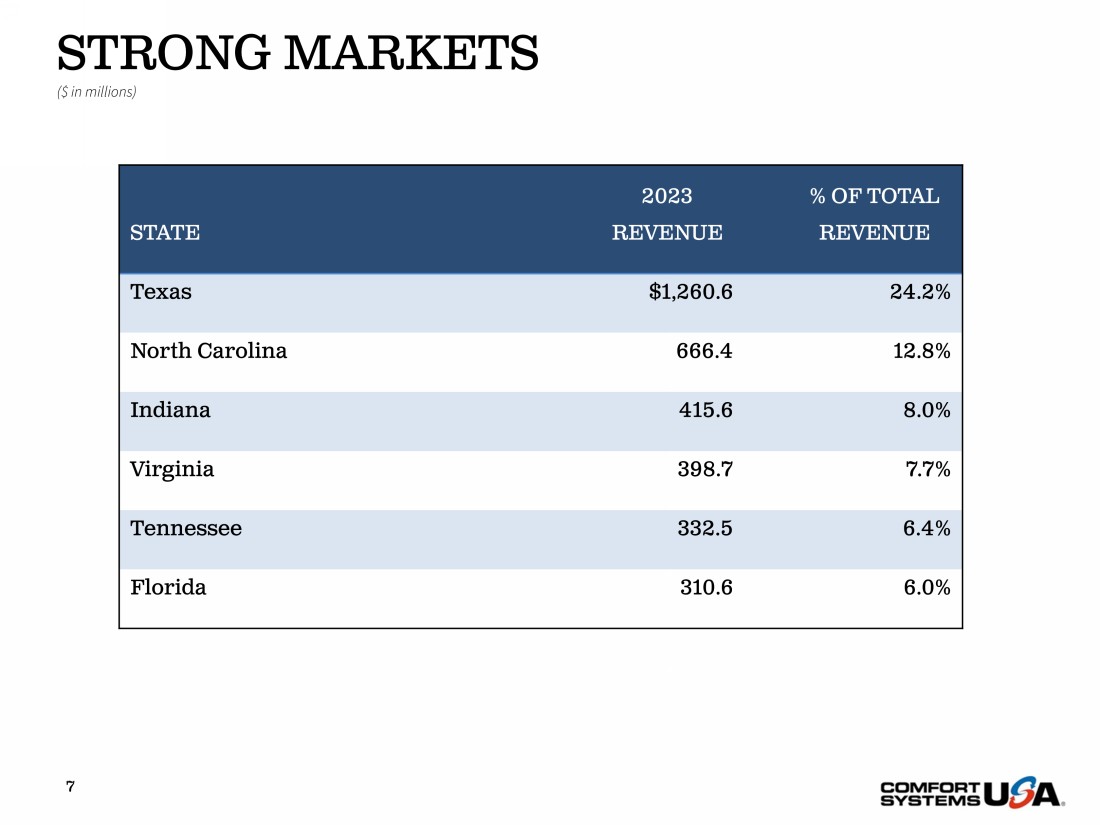
STRONG MARKETS ($ in millions) 7 2023 % OF TOTAL STATE REVENUE REVENUE Texas $1,260.6 24.2% North Carolina 666.4 12.8% Indiana 415.6 8.0% Virginia 398.7 7.7% Tennessee 332.5 6.4% Florida 310.6 6.0%

CONSTRUCTION BACKLOG 8 $763 $948 $1,166 $1,602 $1,511 $2,312 $4,064 $5,157 $- $1,000 $2,000 $3,000 $4,000 $5,000 $6,000 2016 2017 2018 2019 2020 2021 2022 2023 ($ in millions)

SERVICE MAINTENANCE BASE 9 $111 $116 $123 $127 $130 $147 $161 $165 $0 $20 $40 $60 $80 $100 $120 $140 $160 $180 2016 2017 2018 2019 2020 2021 2022 2023 ($ in millions)
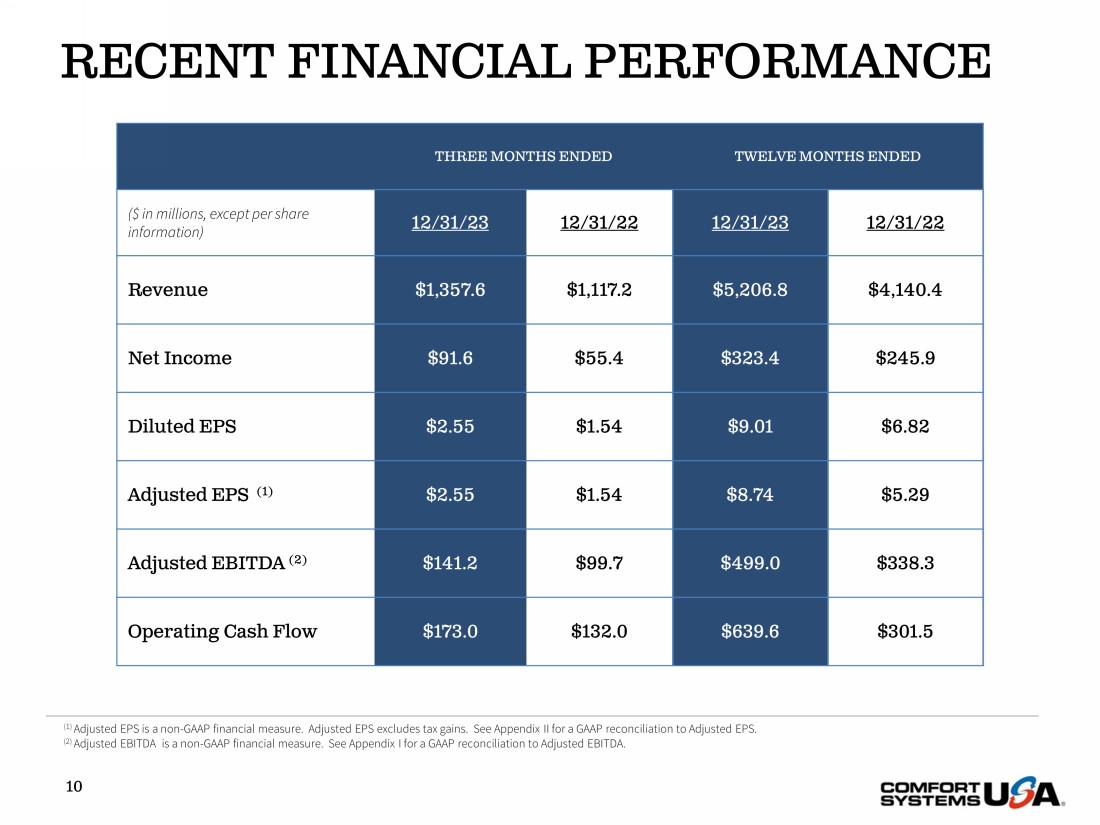
RECENT FINANCIAL PERFORMANCE 10 THREE MONTHS ENDED TWELVE MONTHS ENDED ($ in millions, except per share information) 12/31/23 12/31/22 12/31/23 12/31/22 Revenue $1,357.6 $1,117.2 $5,206.8 $4,140.4 Net Income $91.6 $55.4 $323.4 $245.9 Diluted EPS $2.55 $1.54 $9.01 $6.82 Adjusted EPS (1) $2.55 $1.54 $8.74 $5.29 Adjusted EBITDA (2) $141.2 $99.7 $499.0 $338.3 Operating Cash Flow $173.0 $132.0 $639.6 $301.5 (1) Adjusted EPS is a non - GAAP financial measure. Adjusted EPS excludes tax gains. See Appendix II for a GAAP reconciliation to Ad justed EPS. (2) Adjusted EBITDA is a non - GAAP financial measure. See Appendix I for a GAAP reconciliation to Adjusted EBITDA.
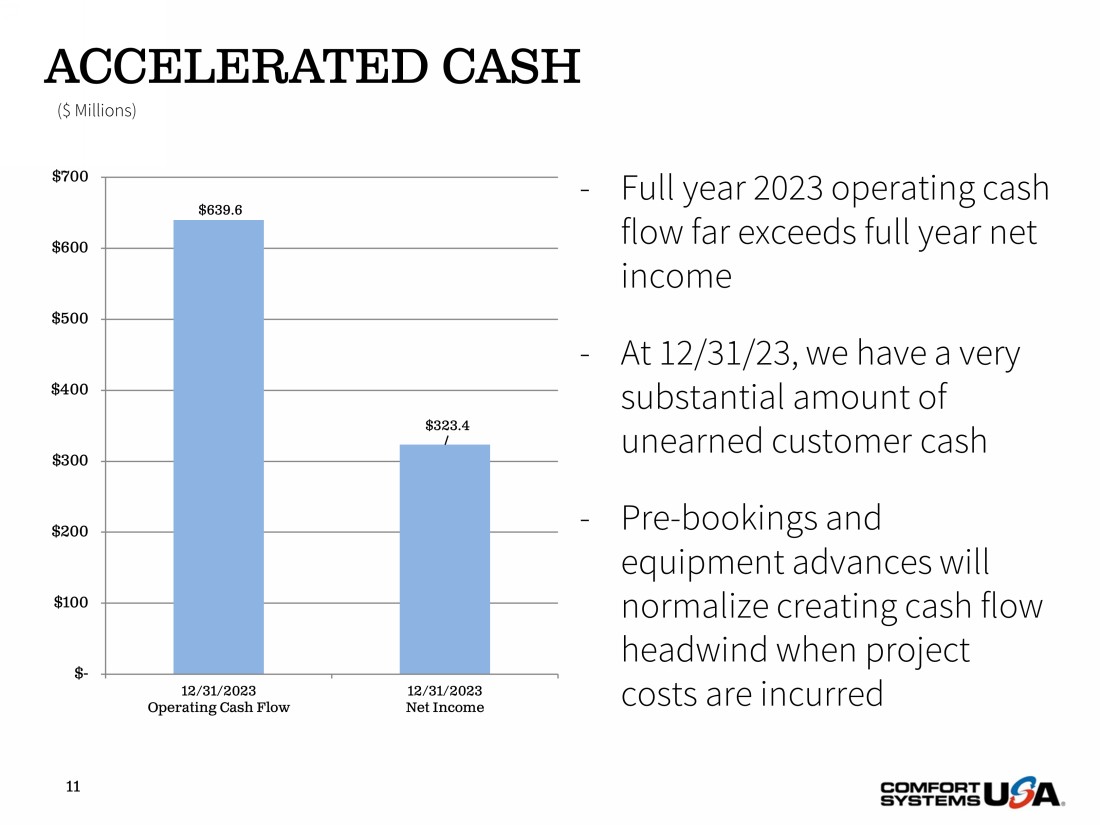
ACCELERATED CASH 11 $639.6 $323.4 $- $100 $200 $300 $400 $500 $600 $700 12/31/2023 Operating Cash Flow 12/31/2023 Net Income ($ Millions) - Full year 2023 operating cash flow far exceeds full year net income - At 12/31/23, we have a very substantial amount of unearned customer cash - Pre - bookings and equipment advances will normalize creating cash flow headwind when project costs are incurred

FINANCIAL STRENGTH • Positive free cash flow for 25 consecutive years • Increased dividend for 11 consecutive years • Debt/TTM EBITDA = 0.09 • $205.2 M cash at December 31, 2023 • $44.2 M total debt at December 31, 2023 • Debt capacity – No borrowings at 12/31/23 – $850M senior credit facility – 2027 maturity 12

13 CAPITAL ALLOCATION ($ in thousands) $82,524 75% $15,839 14% $11,774 11% AVERAGE 2007 - 2023 Acquisitions Share Repurchases Dividends
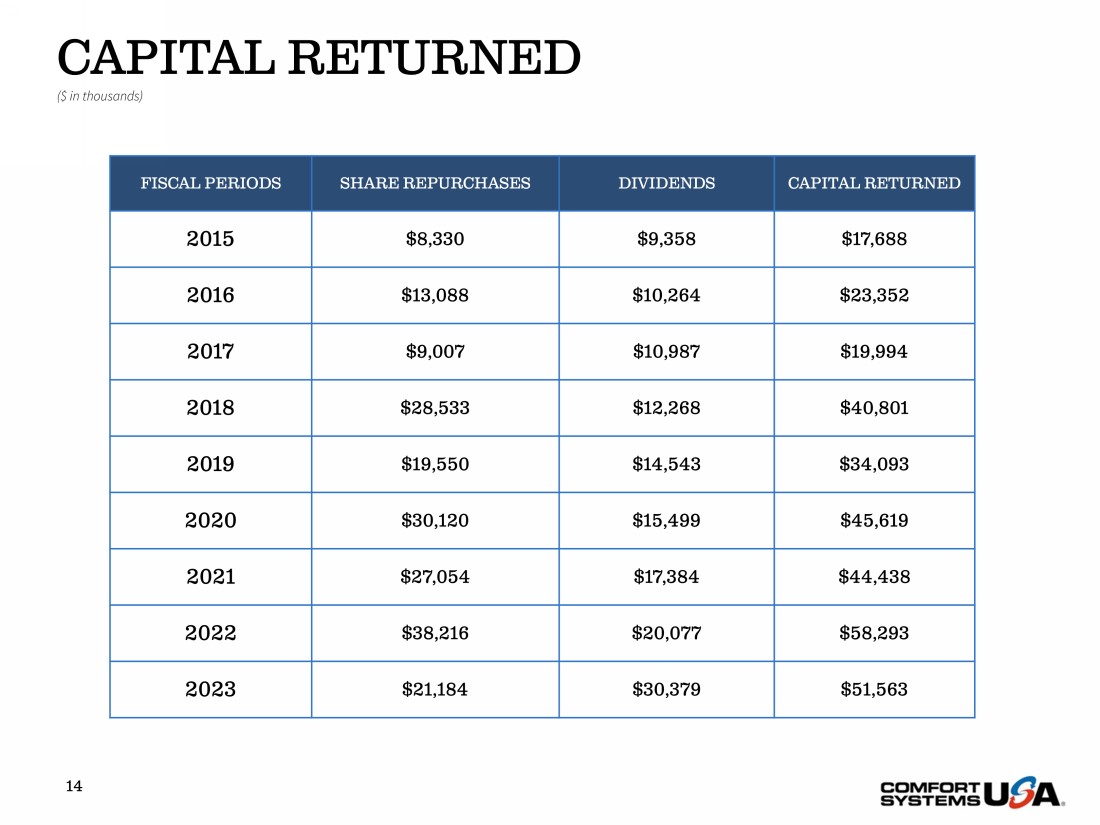
14 CAPITAL RETURNED ($ in thousands) FISCAL PERIODS SHARE REPURCHASES DIVIDENDS CAPITAL RETURNED 2015 $8,330 $9,358 $17,688 2016 $13,088 $10,264 $23,352 2017 $9,007 $10,987 $19,994 2018 $28,533 $12,268 $40,801 2019 $19,550 $14,543 $34,093 2020 $30,120 $15,499 $45,619 2021 $27,054 $17,384 $44,438 2022 $38,216 $20,077 $58,293 2023 $21,184 $30,379 $51,563

MODULAR OFF - SITE CONSTRUCTION 15
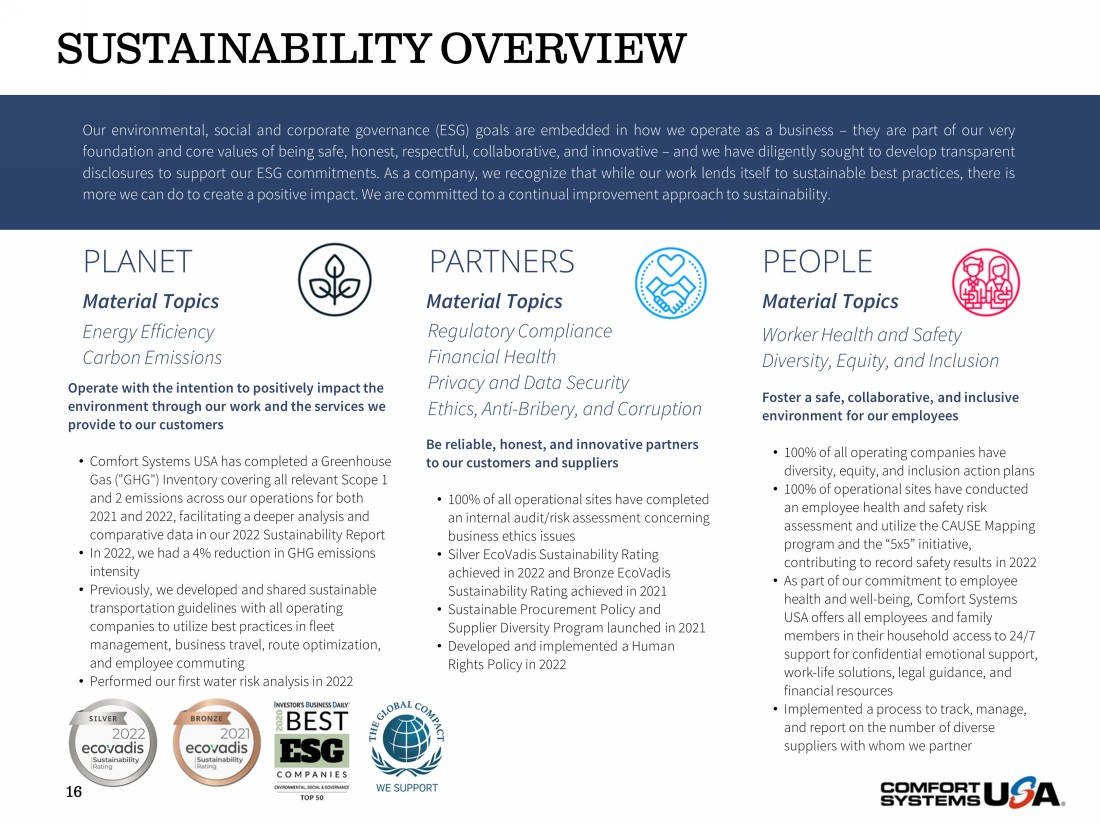
Foster a safe, collaborative, and inclusive environment for our employees • 100% of all operating companies have diversity, equity, and inclusion action plans • 100% of operational sites have conducted an employee health and safety risk assessment and utilize the CAUSE Mapping program and the “5x5” initiative, contributing to record safety results in 2022 • As part of our commitment to employee health and well - being, Comfort Systems USA offers all employees and family members in their household access to 24/7 support for confidential emotional support, work - life solutions, legal guidance, and financial resources • Implemented a process to track, manage, and report on the number of diverse suppliers with whom we partner Our environmental, social and corporate governance (ESG) goals are embedded in how we operate as a business – they are part of our very foundation and core values of being safe, honest, respectful, collaborative, and innovative – and we have diligently sought to develop transparent disclosures to support our ESG commitments . As a company, we recognize that while our work lends itself to sustainable best practices, there is more we can do to create a positive impact . We are committed to a continual improvement approach to sustainability . PEOPLE PARTNERS PLANET Be reliable, honest, and innovative partners to our customers and suppliers • 100% of all operational sites have completed an internal audit/risk assessment concerning business ethics issues • Silver EcoVadis Sustainability Rating achieved in 2022 and Bronze EcoVadis Sustainability Rating achieved in 2021 • Sustainable Procurement Policy and Supplier Diversity Program launched in 2021 • Developed and implemented a Human Rights Policy in 2022 Operate with the intention to positively impact the environment through our work and the services we provide to our customers • Comfort Systems USA has completed a Greenhouse Gas ("GHG") Inventory covering all relevant Scope 1 and 2 emissions across our operations for both 2021 and 2022, facilitating a deeper analysis and comparative data in our 2022 Sustainability Report • In 2022, we had a 4% reduction in GHG emissions intensity • Previously, we developed and shared sustainable transportation guidelines with all operating companies to utilize best practices in fleet management, business travel, route optimization, and employee commuting • Performed our first water risk analysis in 2022 Energy Efficiency Carbon Emissions Regulatory Compliance Financial Health Privacy and Data Security Ethics, Anti - Bribery, and Corruption Worker Health and Safety Diversity, Equity, and Inclusion Material Topics Material Topics Material Topics SUSTAINABILITY OVERVIEW 16
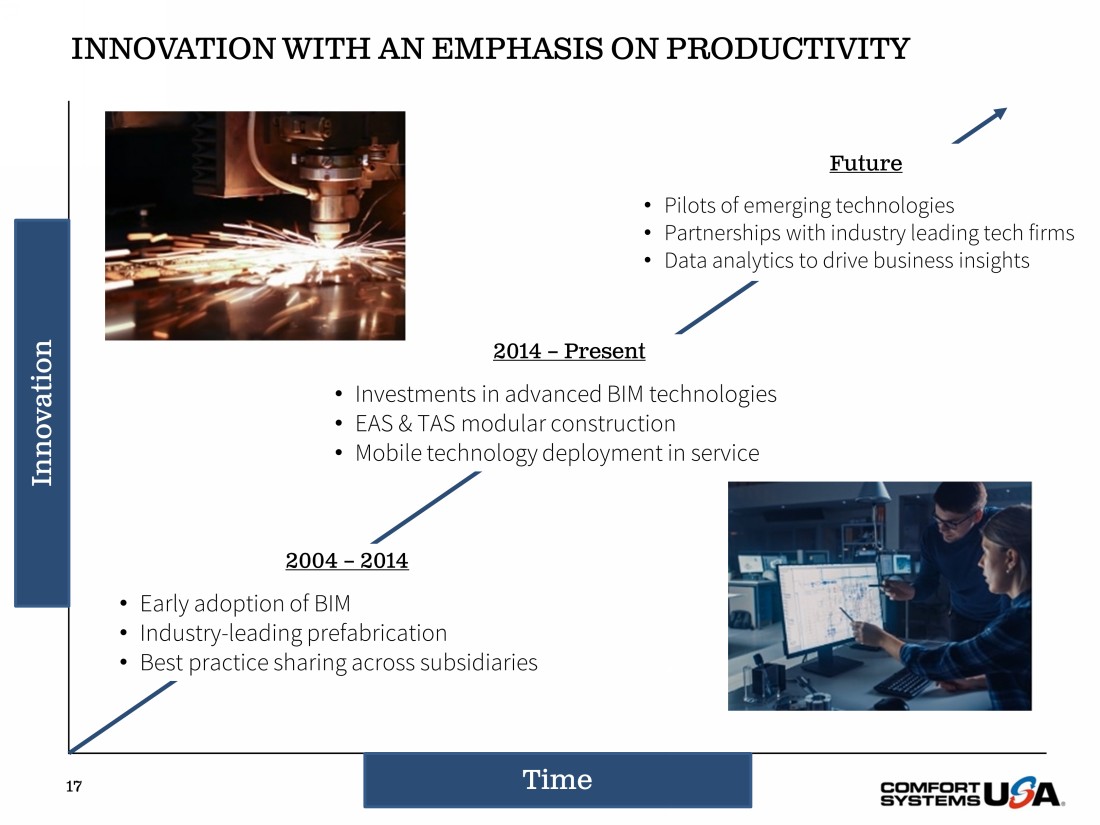
Time Innovation INNOVATION WITH AN EMPHASIS ON PRODUCTIVITY 2004 – 2014 • Early adoption of BIM • Industry - leading prefabrication • Best practice sharing across subsidiaries 2014 – Present • Investments in advanced BIM technologies • EAS & TAS modular construction • Mobile technology deployment in service Future • Pilots of emerging technologies • Partnerships with industry leading tech firms • Data analytics to drive business insights 17
18 Be safe Be honest Be respectful Be innovative Be collaborative OUR VALUES

OUR STRENGTH 19 • Consistent free cash flow • Strong Balance Sheet • Acquisition record • Attractive geographies • Leading innovation • Profitable growth
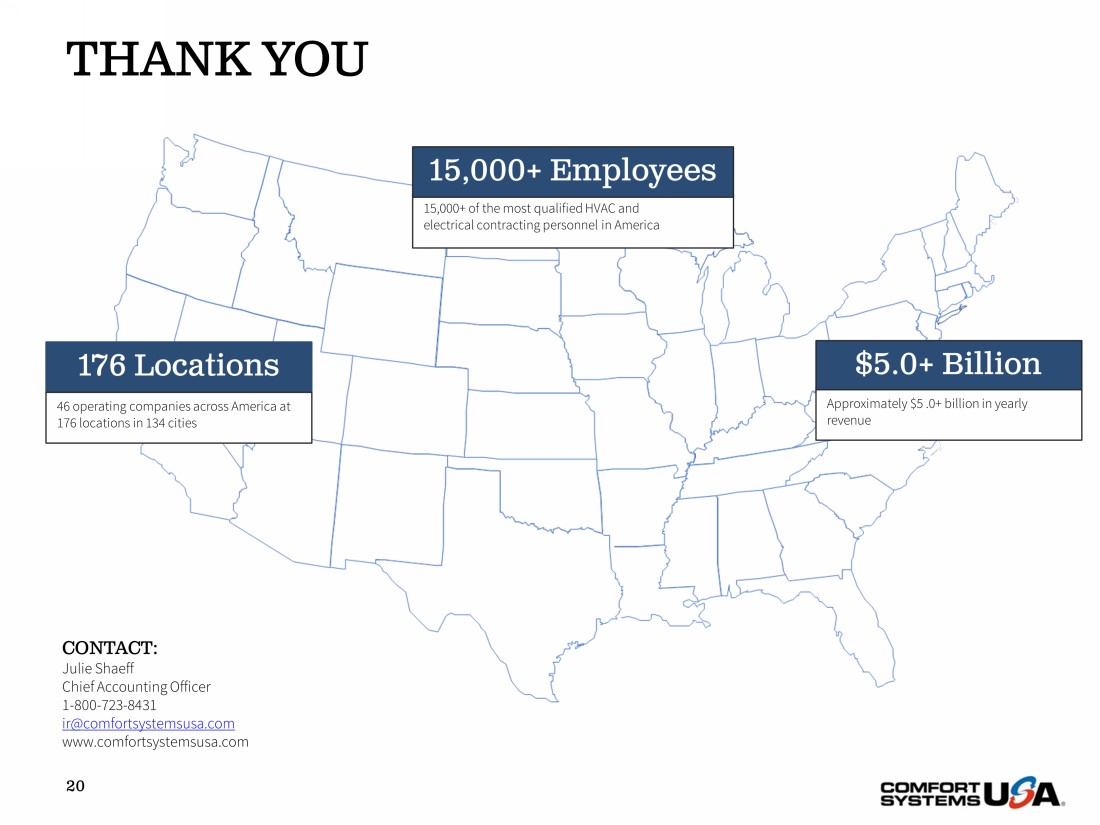
THANK YOU 20 176 Locations 46 operating companies across America at 176 locations in 134 cities 15,000+ of the most qualified HVAC and electrical contracting personnel in America 15,000+ Employees $5.0+ Billion Approximately $5 .0+ billion in yearly revenue CONTACT: Julie Shaeff Chief Accounting Officer 1 - 800 - 723 - 8431 ir@comfortsystemsusa.com www.comfortsystemsusa.com

APPENDIX I – GAAP RECONCILIATION TO ADJUSTED EBITDA 21 Three Months Ended December 31, Twelve Months Ended December 31, ($ in thousands) 2023 2022 2023 2022 Net Income $91,581 $55,424 $323,398 $245,947 Provision (Benefit) for Income Taxes 20,148 14,775 64,796 (10,089) Other Income, net (201) (33) (202) (134) Changes in the Fair Value of Contingent Earn - out Obligations 9,400 5,349 23,607 4,819 Interest Expense (Income), net (650) 4,556 6,789 13,306 Gain on Sale of Assets (619) (473) (2,302) (1,585) Tax - related SG&A costs — — 1,345 4,665 Amortization 11,131 11,193 43,404 47,795 Depreciation 10,445 8,909 38,162 33,552 Adjusted EBITDA $141,235 $99,700 $498,997 $338,276 Note: The Company defines adjusted earnings before interest, taxes, depreciation, and amortization (“Adjusted EBITDA”) as ne t i ncome, provision for income taxes, other expense (income), net, changes in the fair value of contingent earn - out obligations, interest expense (income), net, gain on sale of assets, goodwill i mpairment, other one - time expenses or gains and depreciation and amortization. Other companies may define Adjusted EBITDA differently. Adjusted EBITDA is presented because it is a financia l m easure that is frequently requested by third parties. However, Adjusted EBITDA is not considered under generally accepted accounting principles as a primary measure of an entity’s financia l r esults, and accordingly, Adjusted EBITDA should not be considered an alternative to operating income, net income, or cash flows as determined under generally accepted accounting principles an d a s reported by the Company.
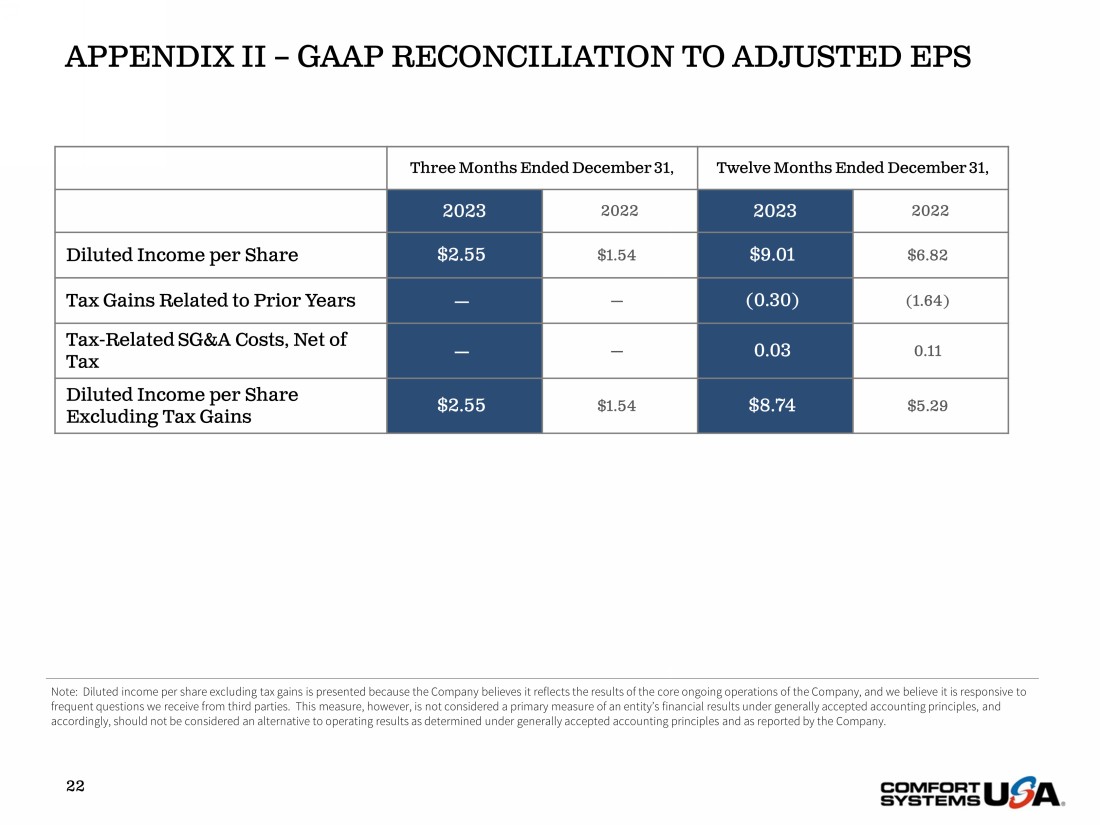
APPENDIX II – GAAP RECONCILIATION TO ADJUSTED EPS 22 Three Months Ended December 31, Twelve Months Ended December 31, 2023 2022 2023 2022 Diluted Income per Share $2.55 $1.54 $9.01 $6.82 Tax Gains Related to Prior Years — — (0.30) (1.64) Tax - Related SG&A Costs, Net of Tax — — 0.03 0.11 Diluted Income per Share Excluding Tax Gains $2.55 $1.54 $8.74 $5.29 Note: Diluted income per share excluding tax gains is presented because the Company believes it reflects the results of the cor e ongoing operations of the Company, and we believe it is responsive to frequent questions we receive from third parties. This measure, however, is not considered a primary measure of an entity’s fin ancial results under generally accepted accounting principles, and accordingly, should not be considered an alternative to operating results as determined under generally accepted accounting p rin ciples and as reported by the Company.
v3.24.0.1
Cover
|
Feb. 23, 2024 |
| Cover [Abstract] |
|
| Document Type |
8-K
|
| Amendment Flag |
false
|
| Document Period End Date |
Feb. 23, 2024
|
| Entity File Number |
1-13011
|
| Entity Registrant Name |
Comfort Systems USA, Inc.
|
| Entity Central Index Key |
0001035983
|
| Entity Tax Identification Number |
76-0526487
|
| Entity Incorporation, State or Country Code |
DE
|
| Entity Address, Address Line One |
675 Bering Drive
|
| Entity Address, Address Line Two |
Suite 400
|
| Entity Address, City or Town |
Houston
|
| Entity Address, State or Province |
TX
|
| Entity Address, Postal Zip Code |
77057
|
| City Area Code |
713
|
| Local Phone Number |
830-9600
|
| Written Communications |
false
|
| Soliciting Material |
false
|
| Pre-commencement Tender Offer |
false
|
| Pre-commencement Issuer Tender Offer |
false
|
| Title of 12(b) Security |
Common Stock, $0.01 par value
|
| Trading Symbol |
FIX
|
| Security Exchange Name |
NYSE
|
| Entity Emerging Growth Company |
false
|
| X |
- DefinitionBoolean flag that is true when the XBRL content amends previously-filed or accepted submission.
| Name: |
dei_AmendmentFlag |
| Namespace Prefix: |
dei_ |
| Data Type: |
xbrli:booleanItemType |
| Balance Type: |
na |
| Period Type: |
duration |
|
| X |
- DefinitionFor the EDGAR submission types of Form 8-K: the date of the report, the date of the earliest event reported; for the EDGAR submission types of Form N-1A: the filing date; for all other submission types: the end of the reporting or transition period. The format of the date is YYYY-MM-DD.
| Name: |
dei_DocumentPeriodEndDate |
| Namespace Prefix: |
dei_ |
| Data Type: |
xbrli:dateItemType |
| Balance Type: |
na |
| Period Type: |
duration |
|
| X |
- DefinitionThe type of document being provided (such as 10-K, 10-Q, 485BPOS, etc). The document type is limited to the same value as the supporting SEC submission type, or the word 'Other'.
| Name: |
dei_DocumentType |
| Namespace Prefix: |
dei_ |
| Data Type: |
dei:submissionTypeItemType |
| Balance Type: |
na |
| Period Type: |
duration |
|
| X |
- DefinitionAddress Line 1 such as Attn, Building Name, Street Name
| Name: |
dei_EntityAddressAddressLine1 |
| Namespace Prefix: |
dei_ |
| Data Type: |
xbrli:normalizedStringItemType |
| Balance Type: |
na |
| Period Type: |
duration |
|
| X |
- DefinitionAddress Line 2 such as Street or Suite number
| Name: |
dei_EntityAddressAddressLine2 |
| Namespace Prefix: |
dei_ |
| Data Type: |
xbrli:normalizedStringItemType |
| Balance Type: |
na |
| Period Type: |
duration |
|
| X |
- Definition
+ References
+ Details
| Name: |
dei_EntityAddressCityOrTown |
| Namespace Prefix: |
dei_ |
| Data Type: |
xbrli:normalizedStringItemType |
| Balance Type: |
na |
| Period Type: |
duration |
|
| X |
- DefinitionCode for the postal or zip code
| Name: |
dei_EntityAddressPostalZipCode |
| Namespace Prefix: |
dei_ |
| Data Type: |
xbrli:normalizedStringItemType |
| Balance Type: |
na |
| Period Type: |
duration |
|
| X |
- DefinitionName of the state or province.
| Name: |
dei_EntityAddressStateOrProvince |
| Namespace Prefix: |
dei_ |
| Data Type: |
dei:stateOrProvinceItemType |
| Balance Type: |
na |
| Period Type: |
duration |
|
| X |
- DefinitionA unique 10-digit SEC-issued value to identify entities that have filed disclosures with the SEC. It is commonly abbreviated as CIK. Reference 1: http://www.xbrl.org/2003/role/presentationRef
-Publisher SEC
-Name Exchange Act
-Number 240
-Section 12
-Subsection b-2
| Name: |
dei_EntityCentralIndexKey |
| Namespace Prefix: |
dei_ |
| Data Type: |
dei:centralIndexKeyItemType |
| Balance Type: |
na |
| Period Type: |
duration |
|
| X |
- DefinitionIndicate if registrant meets the emerging growth company criteria. Reference 1: http://www.xbrl.org/2003/role/presentationRef
-Publisher SEC
-Name Exchange Act
-Number 240
-Section 12
-Subsection b-2
| Name: |
dei_EntityEmergingGrowthCompany |
| Namespace Prefix: |
dei_ |
| Data Type: |
xbrli:booleanItemType |
| Balance Type: |
na |
| Period Type: |
duration |
|
| X |
- DefinitionCommission file number. The field allows up to 17 characters. The prefix may contain 1-3 digits, the sequence number may contain 1-8 digits, the optional suffix may contain 1-4 characters, and the fields are separated with a hyphen.
| Name: |
dei_EntityFileNumber |
| Namespace Prefix: |
dei_ |
| Data Type: |
dei:fileNumberItemType |
| Balance Type: |
na |
| Period Type: |
duration |
|
| X |
- DefinitionTwo-character EDGAR code representing the state or country of incorporation.
| Name: |
dei_EntityIncorporationStateCountryCode |
| Namespace Prefix: |
dei_ |
| Data Type: |
dei:edgarStateCountryItemType |
| Balance Type: |
na |
| Period Type: |
duration |
|
| X |
- DefinitionThe exact name of the entity filing the report as specified in its charter, which is required by forms filed with the SEC. Reference 1: http://www.xbrl.org/2003/role/presentationRef
-Publisher SEC
-Name Exchange Act
-Number 240
-Section 12
-Subsection b-2
| Name: |
dei_EntityRegistrantName |
| Namespace Prefix: |
dei_ |
| Data Type: |
xbrli:normalizedStringItemType |
| Balance Type: |
na |
| Period Type: |
duration |
|
| X |
- DefinitionThe Tax Identification Number (TIN), also known as an Employer Identification Number (EIN), is a unique 9-digit value assigned by the IRS. Reference 1: http://www.xbrl.org/2003/role/presentationRef
-Publisher SEC
-Name Exchange Act
-Number 240
-Section 12
-Subsection b-2
| Name: |
dei_EntityTaxIdentificationNumber |
| Namespace Prefix: |
dei_ |
| Data Type: |
dei:employerIdItemType |
| Balance Type: |
na |
| Period Type: |
duration |
|
| X |
- DefinitionLocal phone number for entity.
| Name: |
dei_LocalPhoneNumber |
| Namespace Prefix: |
dei_ |
| Data Type: |
xbrli:normalizedStringItemType |
| Balance Type: |
na |
| Period Type: |
duration |
|
| X |
- DefinitionBoolean flag that is true when the Form 8-K filing is intended to satisfy the filing obligation of the registrant as pre-commencement communications pursuant to Rule 13e-4(c) under the Exchange Act. Reference 1: http://www.xbrl.org/2003/role/presentationRef
-Publisher SEC
-Name Exchange Act
-Number 240
-Section 13e
-Subsection 4c
| Name: |
dei_PreCommencementIssuerTenderOffer |
| Namespace Prefix: |
dei_ |
| Data Type: |
xbrli:booleanItemType |
| Balance Type: |
na |
| Period Type: |
duration |
|
| X |
- DefinitionBoolean flag that is true when the Form 8-K filing is intended to satisfy the filing obligation of the registrant as pre-commencement communications pursuant to Rule 14d-2(b) under the Exchange Act. Reference 1: http://www.xbrl.org/2003/role/presentationRef
-Publisher SEC
-Name Exchange Act
-Number 240
-Section 14d
-Subsection 2b
| Name: |
dei_PreCommencementTenderOffer |
| Namespace Prefix: |
dei_ |
| Data Type: |
xbrli:booleanItemType |
| Balance Type: |
na |
| Period Type: |
duration |
|
| X |
- DefinitionTitle of a 12(b) registered security. Reference 1: http://www.xbrl.org/2003/role/presentationRef
-Publisher SEC
-Name Exchange Act
-Number 240
-Section 12
-Subsection b
| Name: |
dei_Security12bTitle |
| Namespace Prefix: |
dei_ |
| Data Type: |
dei:securityTitleItemType |
| Balance Type: |
na |
| Period Type: |
duration |
|
| X |
- DefinitionName of the Exchange on which a security is registered. Reference 1: http://www.xbrl.org/2003/role/presentationRef
-Publisher SEC
-Name Exchange Act
-Number 240
-Section 12
-Subsection d1-1
| Name: |
dei_SecurityExchangeName |
| Namespace Prefix: |
dei_ |
| Data Type: |
dei:edgarExchangeCodeItemType |
| Balance Type: |
na |
| Period Type: |
duration |
|
| X |
- DefinitionBoolean flag that is true when the Form 8-K filing is intended to satisfy the filing obligation of the registrant as soliciting material pursuant to Rule 14a-12 under the Exchange Act. Reference 1: http://www.xbrl.org/2003/role/presentationRef
-Publisher SEC
-Name Exchange Act
-Section 14a
-Number 240
-Subsection 12
| Name: |
dei_SolicitingMaterial |
| Namespace Prefix: |
dei_ |
| Data Type: |
xbrli:booleanItemType |
| Balance Type: |
na |
| Period Type: |
duration |
|
| X |
- DefinitionTrading symbol of an instrument as listed on an exchange.
| Name: |
dei_TradingSymbol |
| Namespace Prefix: |
dei_ |
| Data Type: |
dei:tradingSymbolItemType |
| Balance Type: |
na |
| Period Type: |
duration |
|
| X |
- DefinitionBoolean flag that is true when the Form 8-K filing is intended to satisfy the filing obligation of the registrant as written communications pursuant to Rule 425 under the Securities Act. Reference 1: http://www.xbrl.org/2003/role/presentationRef
-Publisher SEC
-Name Securities Act
-Number 230
-Section 425
| Name: |
dei_WrittenCommunications |
| Namespace Prefix: |
dei_ |
| Data Type: |
xbrli:booleanItemType |
| Balance Type: |
na |
| Period Type: |
duration |
|
Comfort Systems USA (NYSE:FIX)
Historical Stock Chart
From Mar 2024 to Apr 2024

Comfort Systems USA (NYSE:FIX)
Historical Stock Chart
From Apr 2023 to Apr 2024
