Form 8-K - Current report
October 13 2023 - 8:30AM
Edgar (US Regulatory)
0000920427false00009204272023-10-132023-10-13
SECURITIES AND EXCHANGE COMMISSION
WASHINGTON, D.C. 20549
FORM 8-K
CURRENT REPORT PURSUANT
TO SECTION 13 OR 15(d) OF THE
SECURITIES EXCHANGE ACT OF 1934
October 13, 2023
Date of Report (Date of earliest event reported)

UNITY BANCORP, INC.
(Exact Name of Registrant as Specified in its Charter)
New Jersey
(State or Other Jurisdiction of Incorporation)
| |
1-12431 | 22-3282551 |
(Commission File Number) | (IRS Employer Identification No.) |
64 Old Highway 22
Clinton, NJ 08809
(Address of Principal Executive Office)
(908) 730-7630
(Registrant’s Telephone Number, Including Area Code)
Check the appropriate box below if the Form 8-K filing is intended to simultaneously satisfy the filing obligation of the registrant under any of the following provisions:
| |
☐ | Written communications pursuant to Rule 425 under the Securities Act (17 CFR 230.425) |
☐ | Soliciting material pursuant to Rule 14a12 under the Exchange Act (17 CFR 240.14a-12) |
☐ | Pre-commencement communications pursuant to Rule 14d-2(b) under the Exchange Act (17 CFR 240.14d-2(b)) |
☐ | Pre-commencement communications pursuant to Rule 13e-4(c) under the Exchange Act (17 CFR 240.13e-4(c)) |
Securities registered pursuant to Section 12(b) of the Act:
| | |
Title of each class | Trading Symbol(s) | Name of each exchange on which registered |
Common stock | UNTY | NASDAQ |
Indicate by check mark whether the registrant is an emerging growth company as defined in Rule 405 of the Securities Act of 1933 (§230.405 of this chapter) or Rule 12b-2 of the Securities Exchange Act of 1934 (§240.12b-2 of this chapter).
Emerging growth company ☐
If an emerging growth company, indicate by check mark if the registrant has elected not to use the extended transition period for complying with any new or revised financial accounting standards provided pursuant to Section 13(a) of the Exchange Act. ☐
Item 2.02 Results of Operation and Financial Condition
The Registrant issued a press release on October 13, 2023 announcing results for the three and nine months September 30, 2023, the full text of which is incorporated by reference to this Item.
Item 9.01 Financial Statements and Exhibits
(d) Exhibits
Exhibit 99.1Press release issued by the Registrant on October 13, 2023.
SIGNATURES
Pursuant to the requirements of the Securities Exchange Act of 1934, the Registrant has duly caused this Report to be signed on its behalf by the undersigned hereunto duly authorized.
| | |
| UNITY BANCORP, INC. |
| (Registrant) |
| |
Date: October 13, 2023 | |
| By: | /s/ George Boyan |
| | George Boyan |
| | Executive Vice President and Chief Financial Officer |
Exhibit 99.1
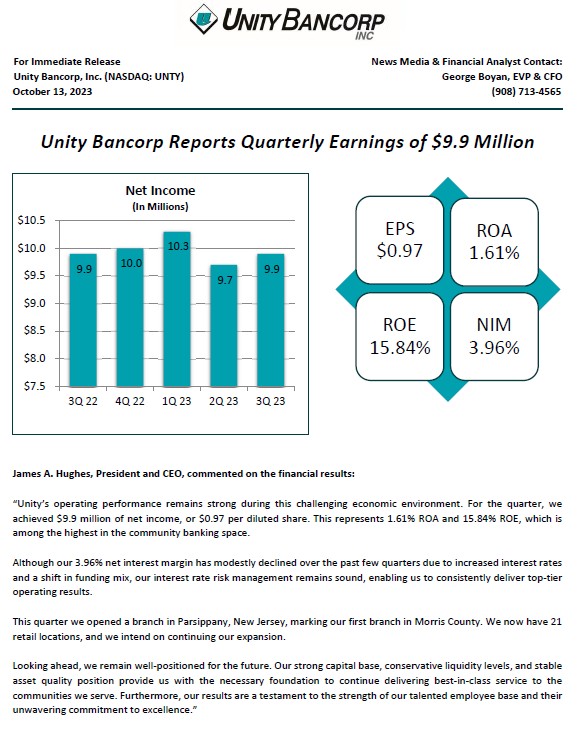
Clinton, NJ -- Unity Bancorp, Inc. (NASDAQ: UNTY), parent company of Unity Bank, reported net income of $9.9 million, or $0.97 per diluted share, for the quarter ended September 30, 2023, compared to net income of $9.7 million, or $0.95 per diluted share for the quarter ended June 30, 2023. This represents a 2.6% increase in net income and a 2.1% increase in net income per diluted share. For the nine months ended September 30, 2023, Unity reported net income of $29.9 million or $2.88 per diluted share, compared to net income of $28.5 million or $2.67 per diluted share for the nine months ended September 30, 2022. This represents a 5.0% increase in net income and a 7.9% increase in net income per diluted share.
Third Quarter Earnings Highlights
| ● | Net interest income, our primary driver of earnings, was $23.5 million for each of the quarters ended September 30, 2023 and June 30, 2023. Net interest margin (“NIM”) decreased 8 basis points to 3.96% for the quarter ended September 30, 2023, compared to the quarter ended June 30, 2023. The decrease was primarily due to the cost of interest-bearing liabilities increasing faster than the yield of interest-earning assets. |
| ● | The provision for credit losses was $0.5 million for the quarter ended September 30, 2023, compared to $0.8 million for the quarter ended June 30, 2023. The decrease was primarily driven by slower loan growth for the comparative periods. |
| ● | Non interest income was $2.0 million for the quarter ended September 30, 2023, compared to $2.1 million for the quarter ended June 30, 2023. The $0.1 million decrease was primarily due to no gains on SBA loan sales and lower service and loan fee income. The decrease was partially offset by increased BOLI income, which was largely driven by $0.6 million in non-taxable realized gains associated with two separate claims. |
| ● | Non interest expense was $12.0 million for the quarter ended September 30, 2023, compared to $11.8 million for the quarter ended June 30, 2023. The increase was primarily driven by higher compensation and other expenses and was partially offset by normalized FDIC insurance cost. |
| ● | The effective tax rate was 23.7% for the quarter ended September 30, 2023, compared to 26.0% for the quarter ending June 30, 2023. The reduction in the current quarter is primarily due to the aforementioned BOLI payouts. Further, Unity Bancorp maintains a captive insurance subsidiary, Unity Risk Management Inc. Treasury recently issued proposed regulations which, if adopted in their current form, may adversely impact the ability of the Company to achieve tax benefits under this arrangement. Management is closely monitoring these developments and is anticipating regulatory resolution in Q4 2023. The captive insurance subsidiary currently saves between an estimated $0.3 million to $0.4 million of federal tax expenses per year. |
Balance Sheet Highlights
| ● | Total gross loans modestly increased $66.6 million, or 3.2%, from December 31, 2022, primarily due to increases in commercial loans and residential mortgage loans. These increases were partially offset by decreases in the residential construction loan category. |
| ● | As of September 30, 2023, the allowance for credit losses as a percentage of gross loans was 1.19%. |
| ● | Total deposits increased $97.4 million, or 5.4%, from December 31, 2022. As of September 30, 2023, 17.3% of total deposits were uninsured or uncollateralized. Further, the Company’s deposit base was 45.4% retail, 26.1% business, 18.0% municipal, and 10.5% Brokered CDs. The Company’s deposit composition as of September 30, 2023, consisted of 29.1% in savings deposits, 22.6% in noninterest bearing demand deposits, 32.5% time deposits and 15.8% in interest-bearing demand deposits. |
| ● | As of September 30, 2023, the loan to deposit ratio was approximately 115.3%, which is above the Company’s target threshold of 110%. Consistent with the prior quarter and to bring the ratio in line with the Company’s target, Unity is intentionally reducing non-owner occupied CRE lending volumes and continues to execute upon its retail banking deposit gathering strategies. |
| ● | As of September 30, 2023, investments comprised 5.3% of total assets. Available for sale debt securities (“AFS”) were $92.1 million or 3.6% of total assets. Held to maturity (“HTM”) debt securities were $36.0 million or 1.4% of total assets. As of September 30, 2023, pre-tax net unrealized losses on AFS and HTM were $6.5 million and $8.8 million, respectively. These pre-tax unrealized losses represent approximately 5.8% of the Bancorp’s Tier 1 capital. Equity securities were $8.0 million or 0.3% of total assets as of September 30, 2023. |
| ● | Borrowed funds increased $5.6 million from December 31, 2022. Borrowed funds were entirely comprised of borrowings from the FHLB. |
| ● | Shareholders’ equity was $252.4 million as of September 30, 2023, compared to $239.2 million as of December 31, 2022. The $13.2 million increase was primarily driven by 2023 earnings, partially offset by share repurchase and dividend payments. In the third quarter of 2023, Unity Bancorp repurchased 43,384 shares for approximately $1.0 million, or a weighted average price of $23.85 per share. |
| ● | Book value per common share was $24.95 as of September 30, 2023, compared to $22.60 as of December 31, 2022. |
| ● | Below is a summary of the Company’s regulatory capital ratios: |
| o | Community Bank Leverage Ratio: 10.76% at September 30, 2023, compared to 10.49% at June 30, 2023 and 10.88% at December 31, 2022. |
| o | Common Equity Tier 1 Capital Ratio: 12.16% at September 30, 2023. |
| o | Tier 1 Capital Ratio: 12.64% at September 30, 2023. |
| o | Total Capital Ratio: 13.88% at September 30, 2023. |
| ● | At September 30, 2023, the Company held $161.4 million of cash and cash equivalents. Further, the Company maintained approximately $548.5 million of funding available from various funding sources, including the FHLB, FRB Discount Window, and other lines of credit. Total available funding plus cash on hand represented 217.8% of uninsured or uncollateralized deposits. |
| ● | As of September 30, 2023, nonperforming assets were $18.2 million, compared to $9.1 million of nonperforming assets as of December 31, 2022. As of September 30, 2023, over 70% of nonperforming loans consisted of residential mortgage loans and residential construction loans, which are well reserved. The Company diligently reviews nonperforming assets and potential problem credits, taking proactive measures to promptly address and resolve any issues. |
Other Highlights
| ❖ | In September 2023, Unity Bank opened a new full-service branch in Parsippany, the first location in Morris County, New Jersey and the third new retail banking site since December 2022. |
| ❖ | In July 2023, Unity Bancorp was selected for the national Top 25 ranking published by Bank Director magazine for the second consecutive year. Unity Bancorp was 13th nationally on the ranking of the largest 300 publicly traded banks and 7th nationally for banks in the $1 billion to $5 billion asset category. |
| ❖ | In September 2023, Unity Bancorp was selected for the Piper Sandler 2023 Bank & Thrift Sm-All Star List. The list identifies top performing small-cap banks and thrifts across the country and recognizes companies exceeding certain growth, profitability, credit quality and capital thresholds. Unity Bancorp was rated 30th on the listing and was last recognized on the list in 2019. |
Unity Bancorp, Inc. is a financial services organization headquartered in Clinton, New Jersey, with approximately $2.6 billion in assets and $1.9 billion in deposits. Unity Bank, the Company’s wholly owned subsidiary, provides financial services to retail, corporate and small business customers through its robust branch network located in Bergen, Hunterdon, Middlesex, Morris, Ocean, Somerset, Union and Warren Counties in New Jersey and Northampton County in Pennsylvania. For additional information about Unity, visit our website at www.unitybank.com , or call 800-618-BANK.
This news release contains certain forward-looking statements, either expressed or implied, which are provided to assist the reader in understanding anticipated future financial performance. These statements may be identified by use of the words “believe”, “expect”, “intend”, “anticipate”, “estimate”, “project” or similar expressions. These statements involve certain risks, uncertainties, estimates and assumptions made by management, which are subject to factors beyond the Company’s control and could impede its ability to achieve these goals. These factors include those items included in our Annual Report on Form 10-K under the heading “Item IA-Risk Factors” as amended or supplemented by our subsequent filings with the SEC, as well as general economic conditions, trends in interest rates, the ability of our borrowers to repay their loans, our ability to manage and reduce the level of our nonperforming assets, results of regulatory exams, and the impact of COVID-19 on the Bank, its employees and customers, among other factors.
UNITY BANCORP, INC.
SUMMARY FINANCIAL HIGHLIGHTS
September 30, 2023
| | | | | | | | | | | | | | | |
| | | | | | | | | | | | September 30, 2023 vs. | |
| | | | | | | | | | | | June 30, 2023 | | September 30, 2022 | |
(In thousands, except percentages and per share amounts) | | September 30, 2023 | | June 30, 2023 | | September 30, 2022 | | | % | | % | |
BALANCE SHEET DATA | | | | | | | | | | | | | | | |
Total assets | | $ | 2,563,006 | | $ | 2,552,301 | | $ | 2,339,537 | | | 0.4 | % | 9.6 | % |
Total deposits | | | 1,884,910 | | | 1,849,528 | | | 1,796,597 | | | 1.9 | | 4.9 | |
Total gross loans | | | 2,173,190 | | | 2,167,367 | | | 1,942,414 | | | 0.3 | | 11.9 | |
Total securities | | | 136,091 | | | 137,061 | | | 136,871 | | | (0.7) | | (0.6) | |
Total shareholders' equity | | | 252,384 | | | 244,073 | | | 230,234 | | | 3.4 | | 9.6 | |
Allowance for credit losses | | | 25,918 | | | 25,988 | | | 23,861 | | | (0.3) | | 8.6 | |
| | | | | | | | | | | | | | | |
FINANCIAL DATA - QUARTER TO DATE | | | | | | | | | | | | | | | |
Income before provision for income taxes | | $ | 13,047 | | $ | 13,109 | | $ | 13,267 | | | (0.5) | | (1.7) | |
Provision for income taxes | | | 3,097 | | | 3,409 | | | 3,325 | | | (9.2) | | (6.9) | |
Net income | | $ | 9,950 | | $ | 9,700 | | $ | 9,942 | | | 2.6 | | 0.1 | |
| | | | | | | | | | | | | | | |
Net income per common share - Basic | | $ | 0.98 | | $ | 0.96 | | $ | 0.94 | | | 2.1 | | 4.3 | |
Net income per common share - Diluted | | | 0.97 | | | 0.95 | | | 0.93 | | | 2.1 | | 4.3 | |
| | | | | | | | | | | | | | | |
PERFORMANCE RATIOS - QUARTER TO DATE | | | | | | | | | | | | | | | |
Return on average assets | | | 1.61 | % | | 1.60 | % | | 1.85 | % | | | | | |
Return on average equity | | | 15.84 | | | 16.19 | | | 17.39 | | | | | | |
Efficiency ratio ** | | | 46.68 | | | 45.54 | | | 39.59 | | | | | | |
Net interest margin | | | 3.96 | | | 4.04 | | | 4.61 | | | | | | |
Noninterest expense to average assets | | | 1.94 | | | 1.93 | | | 1.87 | | | | | | |
| | | | | | | | | | | | | | | |
FINANCIAL DATA - YEAR TO DATE | | | | | | | | | | | | | | | |
Income before provision for income taxes | | $ | 39,946 | | | | | $ | 37,786 | | | | | 5.7 | |
Provision for income taxes | | | 10,009 | | | | | | 9,285 | | | | | 7.8 | |
Net income | | $ | 29,937 | | | | | $ | 28,501 | | | | | 5.0 | |
| | | | | | | | | | | | | | | |
Net income per common share - Basic | | $ | 2.92 | | | | | $ | 2.72 | | | | | 7.4 | |
Net income per common share - Diluted | | | 2.88 | | | | | | 2.67 | | | | | 7.9 | |
| | | | | | | | | | | | | | | |
PERFORMANCE RATIOS - YEAR TO DATE | | | | | | | | | | | | | | | |
Return on average assets | | | 1.64 | % | | | | | 1.83 | % | | | | | |
Return on average equity | | | 16.38 | | | | | | 17.45 | | | | | | |
Efficiency ratio ** | | | 45.59 | | | | | | 42.64 | | | | | | |
Net interest margin | | | 4.06 | | | | | | 4.37 | | | | | | |
Noninterest expense to average assets | | | 1.93 | | | | | | 2.00 | | | | | | |
| | | | | | | | | | | | | | | |
SHARE INFORMATION | | | | | | | | | | | | | | | |
Market price per share | | $ | 23.43 | | $ | 23.59 | | $ | 25.11 | | | (0.7) | | (6.7) | |
Dividends paid | | | 0.12 | | | 0.12 | | | 0.11 | | | - | | 9.1 | |
Book value per common share | | | 24.95 | | | 24.12 | | | 21.86 | | | 3.4 | | 14.1 | |
Average diluted shares outstanding (QTD) | | | 10,258 | | | 10,203 | | | 10,714 | | | 0.5 | | (4.3) | |
| | | | | | | | | | | | | | | |
CAPITAL RATIOS | | | | | | | | | | | | | | | |
Total equity to total assets | | | 9.85 | % | | 9.56 | % | | 9.84 | % | | | | | |
Community bank leverage ratio | | | 10.76 | | | 10.49 | | | 10.85 | | | | | | |
| | | | | | | | | | | | | | | |
CREDIT QUALITY AND RATIOS | | | | | | | | | | | | | | | |
Nonperforming assets | | $ | 18,307 | | $ | 16,466 | | $ | 8,033 | | | 11.2 | | 127.9 | |
QTD annualized net (chargeoffs)/recoveries to QTD average loans | | | (0.11) | % | | (0.18) | % | | (0.11) | % | | | | | |
Allowance for credit losses to total loans | | | 1.19 | | | 1.20 | | | 1.23 | | | | | | |
Nonperforming loans (gross SBA guarantee) to total loans | | | 0.84 | | | 0.76 | | | 0.41 | | | | | | |
Nonperforming assets (gross SBA guarantee) to total assets | | | 0.71 | | | 0.65 | | | 0.34 | | | | | | |
**The efficiency ratio is a non-GAAP measure, calculated based on the noninterest expense divided by the sum of net interest income plus non interest income, excluding net gains and losses on securities.
UNITY BANCORP, INC.
CONSOLIDATED BALANCE SHEETS
September 30, 2023
| | | | | | | | | | | | | | | |
| | | | | | | | | | | | September 30, 2023 vs. | |
| | | | | | | | | | | | December 31, 2022 | | September 30, 2022 | |
(In thousands, except percentages) | | September 30, 2023 | | December 31, 2022 | | September 30, 2022 | | | % | | % | |
| | | | | | | | | | | | | | | |
ASSETS | | | | | | | | | | | | | | | |
Cash and due from banks | | $ | 26,224 | | $ | 19,699 | | $ | 24,959 | | | 33.1 | % | 5.1 | % |
Interest-bearing deposits | | | 135,223 | | | 95,094 | | | 138,421 | | | 42.2 | | (2.3) | |
Cash and cash equivalents | | | 161,447 | | | 114,793 | | | 163,380 | | | 40.6 | | (1.2) | |
Securities: | | | | | | | | | | | | | | | |
Debt securities available for sale, at market value | | | 92,122 | | | 95,393 | | | 92,500 | | | (3.4) | | (0.4) | |
Debt securities held to maturity, at book value | | | 35,956 | | | 35,760 | | | 35,897 | | | 0.5 | | 0.2 | |
Equity securities, at market value | | | 8,013 | | | 9,793 | | | 8,474 | | | (18.2) | | (5.4) | |
Total securities | | | 136,091 | | | 140,946 | | | 136,871 | | | (3.4) | | (0.6) | |
Loans: | | | | | | | | | | | | | | | |
SBA loans held for sale | | | 19,387 | | | 27,928 | | | 36,338 | | | (30.6) | | (46.6) | |
SBA loans held for investment | | | 40,873 | | | 38,468 | | | 30,747 | | | 6.3 | | 32.9 | |
SBA PPP loans | | | 2,507 | | | 5,908 | | | 6,706 | | | (57.6) | | (62.6) | |
Commercial loans | | | 1,276,156 | | | 1,187,543 | | | 1,106,059 | | | 7.5 | | 15.4 | |
Residential mortgage loans | | | 628,628 | | | 605,091 | | | 533,737 | | | 3.9 | | 17.8 | |
Consumer loans | | | 72,189 | | | 78,164 | | | 79,662 | | | (7.6) | | (9.4) | |
Residential construction loans | | | 133,450 | | | 163,457 | | | 149,165 | | | (18.4) | | (10.5) | |
Total loans | | | 2,173,190 | | | 2,106,559 | | | 1,942,414 | | | 3.2 | | 11.9 | |
Allowance for credit losses | | | (25,918) | | | (25,196) | | | (23,861) | | | 2.9 | | 8.6 | |
Net loans | | | 2,147,272 | | | 2,081,363 | | | 1,918,553 | | | 3.2 | | 11.9 | |
Premises and equipment, net | | | 19,783 | | | 20,002 | | | 19,094 | | | (1.1) | | 3.6 | |
Bank owned life insurance ("BOLI") | | | 25,223 | | | 26,776 | | | 26,634 | | | (5.8) | | (5.3) | |
Deferred tax assets | | | 13,249 | | | 12,345 | | | 12,910 | | | 7.3 | | 2.6 | |
Federal Home Loan Bank ("FHLB") stock | | | 19,882 | | | 19,064 | | | 14,398 | | | 4.3 | | 38.1 | |
Accrued interest receivable | | | 16,101 | | | 13,403 | | | 11,385 | | | 20.1 | | 41.4 | |
Goodwill | | | 1,516 | | | 1,516 | | | 1,516 | | | - | | - | |
Prepaid expenses and other assets | | | 22,442 | | | 14,740 | | | 34,796 | | | 52.3 | | (35.5) | |
Total assets | | $ | 2,563,006 | | $ | 2,444,948 | | $ | 2,339,537 | | | 4.8 | % | 9.6 | % |
| | | | | | | | | | | | | | | |
LIABILITIES AND SHAREHOLDERS' EQUITY | | | | | | | | | | | | |
Liabilities: | | | | | | | | | | | | | | | |
Deposits: | | | | | | | | | | | | | | | |
Noninterest-bearing demand | | $ | 425,436 | | $ | 494,184 | | $ | 497,752 | | | (13.9) | % | (14.5) | % |
Interest-bearing demand | | | 297,705 | | | 276,218 | | | 267,558 | | | 7.8 | | 11.3 | |
Savings | | | 548,325 | | | 591,826 | | | 682,756 | | | (7.4) | | (19.7) | |
Brokered time deposits | | | 197,636 | | | 189,644 | | | 154,563 | | | 4.2 | | 27.9 | |
Time deposits | | | 415,808 | | | 235,656 | | | 193,968 | | | 76.4 | | 114.4 | |
Total deposits | | | 1,884,910 | | | 1,787,528 | | | 1,796,597 | | | 5.4 | | 4.9 | |
Borrowed funds | | | 388,610 | | | 383,000 | | | 280,000 | | | 1.5 | | 38.8 | |
Subordinated debentures | | | 10,310 | | | 10,310 | | | 10,310 | | | - | | - | |
Accrued interest payable | | | 1,412 | | | 691 | | | 294 | | | 104.3 | | 380.3 | |
Accrued expenses and other liabilities | | | 25,380 | | | 24,192 | | | 22,102 | | | 4.9 | | 14.8 | |
Total liabilities | | | 2,310,622 | | | 2,205,721 | | | 2,109,303 | | | 4.8 | | 9.5 | |
Shareholders' equity: | | | | | | | | | | | | | | | |
Common stock | | | 99,741 | | | 97,204 | | | 96,493 | | | 2.6 | | 3.4 | |
Retained earnings | | | 182,557 | | | 156,958 | | | 148,174 | | | 16.3 | | 23.2 | |
Treasury stock, at cost | | | (25,954) | | | (11,675) | | | (11,633) | | | 122.3 | | 123.1 | |
Accumulated other comprehensive loss | | | (3,960) | | | (3,260) | | | (2,800) | | | 21.5 | | 41.4 | |
Total shareholders' equity | | | 252,384 | | | 239,227 | | | 230,234 | | | 5.5 | | 9.6 | |
Total liabilities and shareholders' equity | | $ | 2,563,006 | | $ | 2,444,948 | | $ | 2,339,537 | | | 4.8 | % | 9.6 | % |
| | | | | | | | | | | | | | | |
Shares issued | | | 11,411 | | | 11,289 | | | 11,236 | | | | | | |
Shares outstanding | | | 10,115 | | | 10,584 | | | 10,533 | | | | | | |
Treasury shares | | | 1,296 | | | 705 | | | 703 | | | | | | |
| | | | | | | | | | | | | | | |
*NM=Not meaningful | | | | | | | | | | | | | | | |
UNITY BANCORP, INC.
QTD CONSOLIDATED STATEMENTS OF INCOME
September 30, 2023
| | | | | | | | | | | | | | | | | | | | | | | |
| | | | | | | | | | | | September 30, 2023 vs. | |
| | For the three months ended | | | June 30, 2023 | | September 30, 2022 | |
(In thousands, except percentages and per share amounts) | | September 30, 2023 | | June 30, 2023 | | September 30, 2022 | | | $ | | % | | $ | | % | |
INTEREST INCOME | | | | | | | | | | | | | | | | | | | | | | | |
Interest-bearing deposits | | $ | 483 | | $ | 441 | | $ | 168 | | | $ | 42 | | | 9.5 | % | $ | 315 | | | 187.5 | % |
FHLB stock | | | 364 | | | 343 | | | 93 | | | | 21 | | | 6.1 | | | 271 | | | 291.4 | |
Securities: | | | | | | | | | | | | | | | | | | | | | | | |
Taxable | | | 1,848 | | | 1,798 | | | 1,397 | | | | 50 | | | 2.8 | | | 451 | | | 32.3 | |
Tax-exempt | | | 17 | | | 19 | | | 18 | | | | (2) | | | (10.5) | | | (1) | | | (5.6) | |
Total securities | | | 1,865 | | | 1,817 | | | 1,415 | | | | 48 | | | 2.6 | | | 450 | | | 31.8 | |
Loans: | | | | | | | | | | | | | | | | | | | | | | | |
SBA loans | | | 1,379 | | | 1,403 | | | 1,083 | | | | (24) | | | (1.7) | | | 296 | | | 27.3 | |
SBA PPP loans | | | 25 | | | 27 | | | 277 | | | | (2) | | | (7.4) | | | (252) | | | (91.0) | |
Commercial loans | | | 20,299 | | | 18,621 | | | 14,017 | | | | 1,678 | | | 9.0 | | | 6,282 | | | 44.8 | |
Residential mortgage loans | | | 8,462 | | | 8,532 | | | 5,912 | | | | (70) | | | (0.8) | | | 2,550 | | | 43.1 | |
Consumer loans | | | 1,525 | | | 1,471 | | | 1,075 | | | | 54 | | | 3.7 | | | 450 | | | 41.9 | |
Residential construction loans | | | 2,588 | | | 2,737 | | | 2,184 | | | | (149) | | | (5.4) | | | 404 | | | 18.5 | |
Total loans | | | 34,278 | | | 32,791 | | | 24,548 | | | | 1,487 | | | 4.5 | | | 9,730 | | | 39.6 | |
Total interest income | | | 36,990 | | | 35,392 | | | 26,224 | | | | 1,598 | | | 4.5 | | | 10,766 | | | 41.1 | |
INTEREST EXPENSE | | | | | | | | | | | | | | | | | | | | | | | |
Interest-bearing demand deposits | | | 1,429 | | | 1,349 | | | 320 | | | | 80 | | | 5.9 | | | 1,109 | | | 346.6 | |
Savings deposits | | | 3,178 | | | 2,501 | | | 878 | | | | 677 | | | 27.1 | | | 2,300 | | | 262.0 | |
Time deposits | | | 5,033 | | | 3,895 | | | 600 | | | | 1,138 | | | 29.2 | | | 4,433 | | | 738.8 | |
Borrowed funds and subordinated debentures | | | 3,817 | | | 4,125 | | | 688 | | | | (308) | | | (7.5) | | | 3,129 | | | 454.8 | |
Total interest expense | | | 13,457 | | | 11,870 | | | 2,486 | | | | 1,587 | | | 13.4 | | | 10,971 | | | 441.3 | |
Net interest income | | | 23,533 | | | 23,522 | | | 23,738 | | | | 11 | | | - | | | (205) | | | (0.9) | |
Provision for credit losses | | | 534 | | | 777 | | | 1,517 | | | | (243) | | | (31.3) | | | (983) | | | (64.8) | |
Net interest income after provision for credit losses | | | 22,999 | | | 22,745 | | | 22,221 | | | | 254 | | | 1.1 | | | 778 | | | 3.5 | |
NONINTEREST INCOME | | | | | | | | | | | | | | | | | | | | | | | |
Branch fee income | | | 278 | | | 228 | | | 336 | | | | 50 | | | 21.9 | | | (58) | | | (17.3) | |
Service and loan fee income | | | 385 | | | 491 | | | 543 | | | | (106) | | | (21.6) | | | (158) | | | (29.1) | |
Gain on sale of SBA loans held for sale, net | | | - | | | 586 | | | - | | | | (586) | | | (100.0) | | | - | | | - | |
Gain on sale of mortgage loans, net | | | 488 | | | 463 | | | 280 | | | | 25 | | | 5.4 | | | 208 | | | 74.3 | |
BOLI income | | | 679 | | | 84 | | | 170 | | | | 595 | | | 708.3 | | | 509 | | | 299.4 | |
Net securities losses | | | (123) | | | (164) | | | (576) | | | | 41 | | | 25.0 | | | 453 | | | 78.6 | |
Other income | | | 336 | | | 427 | | | 357 | | | | (91) | | | (21.3) | | | (21) | | | (5.9) | |
Total noninterest income | | | 2,043 | | | 2,115 | | | 1,110 | | | | (72) | | | (3.4) | | | 933 | | | 84.1 | |
NONINTEREST EXPENSE | | | | | | | | | | | | | | | | | | | | | | | |
Compensation and benefits | | | 7,440 | | | 7,271 | | | 6,471 | | | | 169 | | | 2.3 | | | 969 | | | 15.0 | |
Processing and communications | | | 705 | | | 663 | | | 708 | | | | 42 | | | 6.3 | | | (3) | | | (0.4) | |
Occupancy | | | 763 | | | 779 | | | 702 | | | | (16) | | | (2.1) | | | 61 | | | 8.7 | |
Furniture and equipment | | | 645 | | | 690 | | | 617 | | | | (45) | | | (6.5) | | | 28 | | | 4.5 | |
Professional services | | | 348 | | | 296 | | | 221 | | | | 52 | | | 17.6 | | | 127 | | | 57.5 | |
Advertising | | | 405 | | | 443 | | | 307 | | | | (38) | | | (8.6) | | | 98 | | | 31.9 | |
Other loan expenses | | | 125 | | | 45 | | | 109 | | | | 80 | | | 177.8 | | | 16 | | | 14.7 | |
Deposit insurance | | | 397 | | | 617 | | | 233 | | | | (220) | | | (35.7) | | | 164 | | | 70.4 | |
Director fees | | | 209 | | | 203 | | | 240 | | | | 6 | | | 3.0 | | | (31) | | | (12.9) | |
Loan collection expenses | | | 90 | | | 85 | | | 45 | | | | 5 | | | 5.9 | | | 45 | | | 100.0 | |
Other expenses | | | 868 | | | 659 | | | 411 | | | | 209 | | | 31.7 | | | 457 | | | 111.2 | |
Total noninterest expense | | | 11,995 | | | 11,751 | | | 10,064 | | | | 244 | | | 2.1 | | | 1,931 | | | 19.2 | |
Income before provision for income taxes | | | 13,047 | | | 13,109 | | | 13,267 | | | | (62) | | | (0.5) | | | (220) | | | (1.7) | |
Provision for income taxes | | | 3,097 | | | 3,409 | | | 3,325 | | | | (312) | | | (9.2) | | | (228) | | | (6.9) | |
Net income | | $ | 9,950 | | $ | 9,700 | | $ | 9,942 | | | $ | 250 | | | 2.6 | % | $ | 8 | | | 0.1 | % |
| | | | | | | | | | | | | | | | | | | | | | | |
Effective tax rate | | | 23.7 | % | | 26.0 | % | | 25.1 | % | | | | | | | | | | | | | |
| | | | | | | | | | | | | | | | | | | | | | | |
Net income per common share - Basic | | $ | 0.98 | | $ | 0.96 | | $ | 0.94 | | | | | | | | | | | | | | |
Net income per common share - Diluted | | | 0.97 | | | 0.95 | | | 0.93 | | | | | | | | | | | | | | |
| | | | | | | | | | | | | | | | | | | | | | | |
Weighted average common shares outstanding - Basic | | | 10,128 | | | 10,103 | | | 10,522 | | | | | | | | | | | | | | |
Weighted average common shares outstanding - Diluted | | | 10,258 | | | 10,203 | | | 10,714 | | | | | | | | | | | | | | |
*NM=Not meaningful | | | | | | | | | | | | | | | | | | | | | | | |
UNITY BANCORP, INC.
YTD CONSOLIDATED STATEMENTS OF INCOME
September 30, 2023
| | | | | | | | | | | | | | |
| | | | | | | | | | |
| | For the nine months ended September 30, | | | Current YTD vs. Prior YTD | |
(In thousands, except percentages and per share amounts) | | 2023 | | 2022 | | | $ | | % | |
INTEREST INCOME | | | | | | | | | | | | | | |
Interest-bearing deposits | | $ | 1,257 | | $ | 416 | | | $ | 841 | | | 202.2 | % |
FHLB stock | | | 1,037 | | | 176 | | | | 861 | | | 489.2 | |
Securities: | | | | | | | | | | | | | | |
Taxable | | | 5,385 | | | 3,164 | | | | 2,221 | | | 70.2 | |
Tax-exempt | | | 55 | | | 34 | | | | 21 | | | 61.8 | |
Total securities | | | 5,440 | | | 3,198 | | | | 2,242 | | | 70.1 | |
Loans: | | | | | | | | | | | | | | |
SBA loans | | | 4,186 | | | 2,933 | | | | 1,253 | | | 42.7 | |
SBA PPP loans | | | 129 | | | 1,546 | | | | (1,417) | | | (91.7) | |
Commercial loans | | | 56,320 | | | 37,928 | | | | 18,392 | | | 48.5 | |
Residential mortgage loans | | | 25,103 | | | 15,284 | | | | 9,819 | | | 64.2 | |
Consumer loans | | | 4,351 | | | 2,914 | | | | 1,437 | | | 49.3 | |
Residential construction loans | | | 7,911 | | | 6,018 | | | | 1,893 | | | 31.5 | |
Total loans | | | 98,000 | | | 66,623 | | | | 31,377 | | | 47.1 | |
Total interest income | | | 105,734 | | | 70,413 | | | | 35,321 | | | 50.2 | |
INTEREST EXPENSE | | | | | | | | | | | | | | |
Interest-bearing demand deposits | | | 3,761 | | | 682 | | | | 3,079 | | | 451.5 | |
Savings deposits | | | 7,632 | | | 1,635 | | | | 5,997 | | | 366.8 | |
Time deposits | | | 11,637 | | | 1,499 | | | | 10,138 | | | 676.3 | |
Borrowed funds and subordinated debentures | | | 11,740 | | | 1,199 | | | | 10,541 | | | 879.1 | |
Total interest expense | | | 34,770 | | | 5,015 | | | | 29,755 | | | 593.3 | |
Net interest income | | | 70,964 | | | 65,398 | | | | 5,566 | | | 8.5 | |
Provision for credit losses | | | 1,419 | | | 2,526 | | | | (1,107) | | | (43.8) | |
Net interest income after provision for credit losses | | | 69,545 | | | 62,872 | | | | 6,673 | | | 10.6 | |
NONINTEREST INCOME | | | | | | | | | | | | | | |
Branch fee income | | | 741 | | | 892 | | | | (151) | | | (16.9) | |
Service and loan fee income | | | 1,379 | | | 1,815 | | | | (436) | | | (24.0) | |
Gain on sale of SBA loans held for sale, net | | | 896 | | | 852 | | | | 44 | | | 5.2 | |
Gain on sale of mortgage loans, net | | | 1,195 | | | 1,231 | | | | (36) | | | (2.9) | |
BOLI income | | | 843 | | | 494 | | | | 349 | | | 70.6 | |
Net securities losses | | | (610) | | | (1,631) | | | | 1,021 | | | 62.6 | |
Other income | | | 1,131 | | | 2,446 | | | | (1,315) | | | (53.8) | |
Total noninterest income | | | 5,575 | | | 6,099 | | | | (524) | | | (8.6) | |
NONINTEREST EXPENSE | | | | | | | | | | | | | | |
Compensation and benefits | | | 21,801 | | | 19,790 | | | | 2,011 | | | 10.2 | |
Processing and communications | | | 2,172 | | | 2,166 | | | | 6 | | | 0.3 | |
Occupancy | | | 2,312 | | | 2,205 | | | | 107 | | | 4.9 | |
Furniture and equipment | | | 2,024 | | | 1,811 | | | | 213 | | | 11.8 | |
Professional services | | | 1,071 | | | 1,060 | | | | 11 | | | 1.0 | |
Advertising | | | 1,108 | | | 873 | | | | 235 | | | 26.9 | |
Other loan expenses | | | 298 | | | 238 | | | | 60 | | | 25.2 | |
Deposit insurance | | | 1,362 | | | 752 | | | | 610 | | | 81.1 | |
Director fees | | | 629 | | | 698 | | | | (69) | | | (9.9) | |
Loan collection expenses | | | 222 | | | 138 | | | | 84 | | | 60.9 | |
Other expenses | | | 2,175 | | | 1,454 | | | | 721 | | | 49.6 | |
Total noninterest expense | | | 35,174 | | | 31,185 | | | | 3,989 | | | 12.8 | |
Income before provision for income taxes | | | 39,946 | | | 37,786 | | | | 2,160 | | | 5.7 | |
Provision for income taxes | | | 10,009 | | | 9,285 | | | | 724 | | | 7.8 | |
Net income | | $ | 29,937 | | $ | 28,501 | | | $ | 1,436 | | | 5.0 | % |
| | | | | | | | | | | | | | |
Effective tax rate | | | 25.1 | % | | 24.6 | % | | | | | | | |
| | | | | | | | | | | | | | |
Net income per common share - Basic | | $ | 2.92 | | $ | 2.72 | | | | | | | | |
Net income per common share - Diluted | | | 2.88 | | | 2.67 | | | | | | | | |
| | | | | | | | | | | | | | |
Weighted average common shares outstanding - Basic | | | 10,255 | | | 10,491 | | | | | | | | |
Weighted average common shares outstanding - Diluted | | | 10,381 | | | 10,694 | | | | | | | | |
*NM=Not meaningful | | | | | | | | | | | | | | |
UNITY BANCORP, INC.
QUARTER TO DATE NET INTEREST MARGIN
September 30, 2023
| | | | | | | | | | | | | | | | | | | |
| | For the three months ended | |
(Dollar amounts in thousands, interest amounts and | | September 30, 2023 | | September 30, 2022 | |
interest rates/yields on a fully tax-equivalent basis) | | Average Balance | | Interest | | Rate/Yield | | Average Balance | | Interest | | Rate/Yield | |
ASSETS | | | | | | | | | | | | | | | | | | | |
Interest-earning assets: | | | | | | | | | | | | | | | | | | | |
Interest-bearing deposits | | $ | 34,597 | | $ | 483 | | | 5.54 | % | $ | 34,605 | | $ | 168 | | | 1.92 | % |
FHLB stock | | | 15,485 | | | 364 | | | 9.32 | | | 6,200 | | | 93 | | | 5.96 | |
Securities: | | | | | | | | | | | | | | | | | | | |
Taxable | | | 135,132 | | | 1,848 | | | 5.47 | | | 137,590 | | | 1,397 | | | 4.03 | |
Tax-exempt | | | 1,692 | | | 18 | | | 4.27 | | | 1,841 | | | 20 | | | 4.27 | |
Total securities (A) | | | 136,824 | | | 1,866 | | | 5.45 | | | 139,431 | | | 1,417 | | | 4.03 | |
Loans: | | | | | | | | | | | | | | | | | | | |
SBA loans | | | 60,108 | | | 1,379 | | | 9.18 | | | 65,941 | | | 1,083 | | | 6.52 | |
SBA PPP loans | | | 2,523 | | | 25 | | | 3.94 | | | 9,576 | | | 277 | | | 11.47 | |
Commercial loans | | | 1,266,185 | | | 20,299 | | | 6.27 | | | 1,069,917 | | | 14,017 | | | 5.20 | |
Residential mortgage loans | | | 628,544 | | | 8,462 | | | 5.39 | | | 504,787 | | | 5,912 | | | 4.65 | |
Consumer loans | | | 75,246 | | | 1,525 | | | 7.93 | | | 76,957 | | | 1,075 | | | 5.54 | |
Residential construction loans | | | 139,045 | | | 2,588 | | | 7.28 | | | 137,681 | | | 2,184 | | | 6.29 | |
Total loans (B) | | | 2,171,651 | | | 34,278 | | | 6.18 | | | 1,864,859 | | | 24,548 | | | 5.22 | |
Total interest-earning assets | | $ | 2,358,557 | | $ | 36,991 | | | 6.22 | % | $ | 2,045,095 | | $ | 26,226 | | | 5.09 | % |
| | | | | | | | | | | | | | | | | | | |
Noninterest-earning assets: | | | | | | | | | | | | | | | | | | | |
Cash and due from banks | | | 22,841 | | | | | | | | | 24,350 | | | | | | | |
Allowance for credit losses | | | (26,478) | | | | | | | | | (22,848) | | | | | | | |
Other assets | | | 100,428 | | | | | | | | | 83,168 | | | | | | | |
Total noninterest-earning assets | | | 96,791 | | | | | | | | | 84,670 | | | | | | | |
Total assets | | $ | 2,455,348 | | | | | | | | $ | 2,129,765 | | | | | | | |
| | | | | | | | | | | | | | | | | | | |
LIABILITIES AND SHAREHOLDERS' EQUITY | | | | | | | | | | | | | | | | | | | |
Interest-bearing liabilities: | | | | | | | | | | | | | | | | | | | |
Total interest-bearing demand deposits | | $ | 304,287 | | $ | 1,429 | | | 1.86 | % | $ | 269,486 | | $ | 320 | | | 0.47 | % |
Total savings deposits | | | 547,000 | | | 3,178 | | | 2.30 | | | 674,486 | | | 878 | | | 0.52 | |
Total time deposits | | | 597,664 | | | 5,033 | | | 3.34 | | | 310,842 | | | 600 | | | 0.77 | |
Total interest-bearing deposits | | | 1,448,951 | | | 9,640 | | | 2.64 | | | 1,254,814 | | | 1,798 | | | 0.57 | |
Borrowed funds and subordinated debentures | | | 300,608 | | | 3,817 | | | 4.97 | | | 108,135 | | | 688 | | | 2.53 | |
Total interest-bearing liabilities | | $ | 1,749,559 | | $ | 13,457 | | | 3.05 | % | $ | 1,362,949 | | $ | 2,486 | | | 0.72 | % |
| | | | | | | | | | | | | | | | | | | |
Noninterest-bearing liabilities: | | | | | | | | | | | | | | | | | | | |
Noninterest-bearing demand deposits | | | 429,321 | | | | | | | | | 516,898 | | | | | | | |
Other liabilities | | | 27,192 | | | | | | | | | 23,130 | | | | | | | |
Total noninterest-bearing liabilities | | | 456,513 | | | | | | | | | 540,028 | | | | | | | |
Total shareholders' equity | | | 249,276 | | | | | | | | | 226,788 | | | | | | | |
Total liabilities and shareholders' equity | | $ | 2,455,348 | | | | | | | | $ | 2,129,765 | | | | | | | |
| | | | | | | | | | | | | | | | | | | |
Net interest spread | | | | | $ | 23,534 | | | 3.17 | % | | | | $ | 23,740 | | | 4.37 | % |
Tax-equivalent basis adjustment | | | | | | (1) | | | | | | | | | (2) | | | | |
Net interest income | | | | | $ | 23,533 | | | | | | | | $ | 23,738 | | | | |
Net interest margin | | | | | | | | | 3.96 | % | | | | | | | | 4.61 | % |
| | | | | | | | | | | | | | | | | | | |
| (A) | Yields related to securities exempt from federal and state income taxes are stated on a fully tax-equivalent basis. They are reduced by the nondeductible portion of interest expense, assuming a federal tax rate of 21 percent and applicable state rates. |
| (B) | The loan averages are stated net of unearned income, and the averages include loans on which the accrual of interest has been discontinued. |
UNITY BANCORP, INC.
QUARTER TO DATE NET INTEREST MARGIN
September 30, 2023
| | | | | | | | | | | | | | | | | | | |
| | For the three months ended | |
(Dollar amounts in thousands, interest amounts and | | September 30, 2023 | | June 30, 2023 | |
interest rates/yields on a fully tax-equivalent basis) | | Average Balance | | Interest | | Rate/Yield | | Average Balance | | Interest | | Rate/Yield | |
ASSETS | | | | | | | | | | | | | | | | | | | |
Interest-earning assets: | | | | | | | | | | | | | | | | | | | |
Interest-bearing deposits | | $ | 34,597 | | $ | 483 | | | 5.54 | % | $ | 34,808 | | $ | 441 | | | 5.09 | % |
FHLB stock | | | 15,485 | | | 364 | | | 9.32 | | | 17,252 | | | 343 | | | 7.97 | |
Securities: | | | | | | | | | | | | | | | | | | | |
Taxable | | | 135,132 | | | 1,848 | | | 5.47 | | | 135,943 | | | 1,798 | | | 5.29 | |
Tax-exempt | | | 1,692 | | | 18 | | | 4.27 | | | 1,766 | | | 20 | | | 4.59 | |
Total securities (A) | | | 136,824 | | | 1,866 | | | 5.45 | | | 137,709 | | | 1,818 | | | 5.28 | |
Loans: | | | | | | | | | | | | | | | | | | | |
SBA loans | | | 60,108 | | | 1,379 | | | 9.18 | | | 61,744 | | | 1,403 | | | 9.09 | |
SBA PPP loans | | | 2,523 | | | 25 | | | 3.94 | | | 2,561 | | | 27 | | | 4.20 | |
Commercial loans | | | 1,266,185 | | | 20,299 | | | 6.27 | | | 1,225,761 | | | 18,621 | | | 6.01 | |
Residential mortgage loans | | | 628,544 | | | 8,462 | | | 5.39 | | | 622,283 | | | 8,532 | | | 5.48 | |
Consumer loans | | | 75,246 | | | 1,525 | | | 7.93 | | | 76,741 | | | 1,471 | | | 7.59 | |
Residential construction loans | | | 139,045 | | | 2,588 | | | 7.28 | | | 158,165 | | | 2,737 | | | 6.85 | |
Total loans (B) | | | 2,171,651 | | | 34,278 | | | 6.18 | | | 2,147,255 | | | 32,791 | | | 6.04 | |
Total interest-earning assets | | $ | 2,358,557 | | $ | 36,991 | | | 6.22 | % | $ | 2,337,024 | | $ | 35,393 | | | 6.07 | % |
| | | | | | | | | | | | | | | | | | | |
Noninterest-earning assets: | | | | | | | | | | | | | | | | | | | |
Cash and due from banks | | | 22,841 | | | | | | | | | 21,967 | | | | | | | |
Allowance for credit losses | | | (26,478) | | | | | | | | | (26,270) | | | | | | | |
Other assets | | | 100,428 | | | | | | | | | 103,234 | | | | | | | |
Total noninterest-earning assets | | | 96,791 | | | | | | | | | 98,931 | | | | | | | |
Total assets | | $ | 2,455,348 | | | | | | | | $ | 2,435,955 | | | | | | | |
| | | | | | | | | | | | | | | | | | | |
LIABILITIES AND SHAREHOLDERS' EQUITY | | | | | | | | | | | | | | | | | | | |
Interest-bearing liabilities: | | | | | | | | | | | | | | | | | | | |
Total interest-bearing demand deposits | | $ | 304,287 | | $ | 1,429 | | | 1.86 | % | $ | 312,149 | | $ | 1,349 | | | 1.73 | % |
Total savings deposits | | | 547,000 | | | 3,178 | | | 2.30 | | | 543,690 | | | 2,501 | | | 1.85 | |
Total time deposits | | | 597,664 | | | 5,033 | | | 3.34 | | | 533,612 | | | 3,895 | | | 2.93 | |
Total interest-bearing deposits | | | 1,448,951 | | | 9,640 | | | 2.64 | | | 1,389,451 | | | 7,745 | | | 2.24 | |
Borrowed funds and subordinated debentures | | | 300,608 | | | 3,817 | | | 4.97 | | | 339,599 | | | 4,125 | | | 4.81 | |
Total interest-bearing liabilities | | $ | 1,749,559 | | $ | 13,457 | | | 3.05 | % | $ | 1,729,050 | | $ | 11,870 | | | 2.75 | % |
| | | | | | | | | | | | | | | | | | | |
Noninterest-bearing liabilities: | | | | | | | | | | | | | | | | | | | |
Noninterest-bearing demand deposits | | | 429,321 | | | | | | | | | 440,289 | | | | | | | |
Other liabilities | | | 27,192 | | | | | | | | | 26,275 | | | | | | | |
Total noninterest-bearing liabilities | | | 456,513 | | | | | | | | | 466,564 | | | | | | | |
Total shareholders' equity | | | 249,276 | | | | | | | | | 240,341 | | | | | | | |
Total liabilities and shareholders' equity | | $ | 2,455,348 | | | | | | | | $ | 2,435,955 | | | | | | | |
| | | | | | | | | | | | | | | | | | | |
Net interest spread | | | | | $ | 23,534 | | | 3.17 | % | | | | $ | 23,523 | | | 3.32 | % |
Tax-equivalent basis adjustment | | | | | | (1) | | | | | | | | | (1) | | | | |
Net interest income | | | | | $ | 23,533 | | | | | | | | $ | 23,522 | | | | |
Net interest margin | | | | | | | | | 3.96 | % | | | | | | | | 4.04 | % |
| | | | | | | | | | | | | | | | | | | |
| (A) | Yields related to securities exempt from federal and state income taxes are stated on a fully tax-equivalent basis. They are reduced by the nondeductible portion of interest expense, assuming a federal tax rate of 21 percent and applicable state rates. |
| (B) | The loan averages are stated net of unearned income, and the averages include loans on which the accrual of interest has been discontinued. |
UNITY BANCORP, INC.
YEAR TO DATE NET INTEREST MARGIN
September 30, 2023
| | | | | | | | | | | | | | | | | | | |
| | For the nine months ended | |
(Dollar amounts in thousands, interest amounts and | | September 30, 2023 | | September 30, 2022 | |
interest rates/yields on a fully tax-equivalent basis) | | Average Balance | | Interest | | Rate/Yield | | Average Balance | | Interest | | Rate/Yield | |
ASSETS | | | | | | | | | | | | | | | | | | | |
Interest-earning assets: | | | | | | | | | | | | | | | | | | | |
Interest-bearing deposits | | $ | 34,068 | | $ | 1,257 | | | 4.93 | % | $ | 114,901 | | $ | 416 | | | 0.48 | % |
FHLB stock | | | 16,500 | | | 1,037 | | | 8.41 | | | 4,592 | | | 176 | | | 5.13 | |
Securities: | | | | | | | | | | | | | | | | | | | |
Taxable | | | 136,473 | | | 5,385 | | | 5.26 | | | 116,816 | | | 3,164 | | | 3.62 | |
Tax-exempt | | | 1,737 | | | 58 | | | 4.46 | | | 1,366 | | | 39 | | | 3.80 | |
Total securities (A) | | | 138,210 | | | 5,443 | | | 5.25 | | | 118,182 | | | 3,203 | | | 3.62 | |
Loans: | | | | | | | | | | | | | | | | | | | |
SBA loans | | | 62,802 | | | 4,186 | | | 8.89 | | | 64,438 | | | 2,933 | | | 6.08 | |
SBA PPP loans | | | 3,103 | | | 129 | | | 5.53 | | | 23,388 | | | 1,546 | | | 8.84 | |
Commercial loans | | | 1,230,752 | | | 56,320 | | | 6.03 | | | 1,009,122 | | | 37,928 | | | 5.03 | |
Residential mortgage loans | | | 621,971 | | | 25,103 | | | 5.38 | | | 456,354 | | | 15,284 | | | 4.48 | |
Consumer loans | | | 76,363 | | | 4,351 | | | 7.51 | | | 78,108 | | | 2,914 | | | 4.99 | |
Residential construction loans | | | 153,587 | | | 7,911 | | | 6.79 | | | 130,205 | | | 6,018 | | | 6.18 | |
Total loans (B) | | | 2,148,578 | | | 98,000 | | | 6.01 | | | 1,761,615 | | | 66,623 | | | 5.06 | |
Total interest-earning assets | | $ | 2,337,356 | | $ | 105,737 | | | 6.05 | % | $ | 1,999,290 | | $ | 70,418 | | | 4.71 | % |
| | | | | | | | | | | | | | | | | | | |
Noninterest-earning assets: | | | | | | | | | | | | | | | | | | | |
Cash and due from banks | | | 22,516 | | | | | | | | | 24,026 | | | | | | | |
Allowance for credit losses | | | (26,178) | | | | | | | | | (22,454) | | | | | | | |
Other assets | | | 104,883 | | | | | | | | | 80,656 | | | | | | | |
Total noninterest-earning assets | | | 101,221 | | | | | | | | | 82,228 | | | | | | | |
Total assets | | $ | 2,438,577 | | | | | | | | $ | 2,081,518 | | | | | | | |
| | | | | | | | | | | | | | | | | | | |
LIABILITIES AND SHAREHOLDERS' EQUITY | | | | | | | | | | | | | | | | | | | |
Interest-bearing liabilities: | | | | | | | | | | | | | | | | | | | |
Total interest-bearing demand deposits | | $ | 301,456 | | $ | 3,761 | | | 1.67 | % | $ | 263,139 | | $ | 682 | | | 0.35 | % |
Total savings deposits | | | 554,087 | | | 7,632 | | | 1.84 | | | 687,177 | | | 1,635 | | | 0.32 | |
Total time deposits | | | 539,395 | | | 11,637 | | | 2.88 | | | 292,484 | | | 1,499 | | | 0.69 | |
Total interest-bearing deposits | | | 1,394,938 | | | 23,030 | | | 2.21 | | | 1,242,800 | | | 3,816 | | | 0.41 | |
Borrowed funds and subordinated debentures | | | 327,382 | | | 11,740 | | | 4.73 | | | 72,724 | | | 1,199 | | | 2.21 | |
Total interest-bearing liabilities | | $ | 1,722,320 | | $ | 34,770 | | | 2.70 | % | $ | 1,315,524 | | $ | 5,015 | | | 0.51 | % |
| | | | | | | | | | | | | | | | | | | |
Noninterest-bearing liabilities: | | | | | | | | | | | | | | | | | | | |
Noninterest-bearing demand deposits | | | 445,862 | | | | | | | | | 525,405 | | | | | | | |
Other liabilities | | | 26,016 | | | | | | | | | 22,186 | | | | | | | |
Total noninterest-bearing liabilities | | | 471,878 | | | | | | | | | 547,591 | | | | | | | |
Total shareholders' equity | | | 244,379 | | | | | | | | | 218,403 | | | | | | | |
Total liabilities and shareholders' equity | | $ | 2,438,577 | | | | | | | | $ | 2,081,518 | | | | | | | |
| | | | | | | | | | | | | | | | | | | |
Net interest spread | | | | | $ | 70,967 | | | 3.35 | % | | | | $ | 65,403 | | | 4.20 | % |
Tax-equivalent basis adjustment | | | | | | (3) | | | | | | | | | (5) | | | | |
Net interest income | | | | | $ | 70,964 | | | | | | | | $ | 65,398 | | | | |
Net interest margin | | | | | | | | | 4.06 | % | | | | | | | | 4.37 | % |
| | | | | | | | | | | | | | | | | | | |
| (A) | Yields related to securities exempt from federal and state income taxes are stated on a fully tax-equivalent basis. They are reduced by the nondeductible portion of interest expense, assuming a federal tax rate of 21 percent and applicable state rates. |
| (B) | The loan averages are stated net of unearned income, and the averages include loans on which the accrual of interest has been discontinued. |
UNITY BANCORP, INC.
QUARTERLY ALLOWANCE FOR CREDIT LOSSES AND LOAN QUALITY SCHEDULES
September 30, 2023
| | | | | | | | | | | | | | | |
Amounts in thousands, except percentages | | September 30, 2023 | | June 30, 2023 | | March 31, 2023 | | December 31, 2022 | | September 30, 2022 |
ALLOWANCE FOR CREDIT LOSSES: | | | | | | | | | | | | | | | |
Balance, beginning of period | | $ | 25,988 | | $ | 26,201 | | $ | 25,196 | | $ | 23,861 | | $ | 22,858 |
Impact of the adoption of ASU 2016-13 ("CECL") | | | - | | | - | | | 847 | | | - | | | - |
Provision for credit losses charged to expense | | | 534 | | | 777 | | | 108 | | | 1,632 | | | 1,517 |
| | | 26,522 | | | 26,978 | | | 26,151 | | | 25,493 | | | 24,375 |
Less: Chargeoffs | | | | | | | | | | | | | | | |
SBA loans | | | 100 | | | - | | | 113 | | | 59 | | | - |
Commercial loans | | | 500 | | | - | | | - | | | - | | | 501 |
Residential mortgage loans | | | - | | | - | | | - | | | - | | | - |
Consumer loans | | | 52 | | | 225 | | | 120 | | | 300 | | | 50 |
Residential construction loans | | | - | | | 900 | | | - | | | - | | | - |
Total chargeoffs | | | 652 | | | 1,125 | | | 233 | | | 359 | | | 551 |
Add: Recoveries | | | | | | | | | | | | | | | |
SBA loans | | | 1 | | | 15 | | | - | | | - | | | 5 |
Commercial loans | | | 10 | | | 96 | | | 271 | | | 26 | | | 23 |
Residential mortgage loans | | | - | | | - | | | - | | | 2 | | | - |
Consumer loans | | | 37 | | | 24 | | | 12 | | | 34 | | | 9 |
Residential construction loans | | | - | | | - | | | - | | | - | | | - |
Total recoveries | | | 48 | | | 135 | | | 283 | | | 62 | | | 37 |
Net (chargeoffs)/recoveries | | | (604) | | | (990) | | | 50 | | | (297) | | | (514) |
Balance, end of period | | $ | 25,918 | | $ | 25,988 | | $ | 26,201 | | $ | 25,196 | | $ | 23,861 |
| | | | | | | | | | | | | | | |
LOAN QUALITY INFORMATION: | | | | | | | | | | | | | | | |
| | | | | | | | | | | | | | | |
Nonperforming loans: | | | | | | | | | | | | | | | |
SBA loans | | $ | 3,445 | | $ | 3,591 | | $ | 4,325 | | $ | 690 | | $ | 1,491 |
Commercial loans | | | 750 | | | 835 | | | 1,144 | | | 1,582 | | | 1,147 |
Residential mortgage loans | | | 10,530 | | | 8,607 | | | 5,565 | | | 3,361 | | | 3,404 |
Consumer loans | | | 130 | | | - | | | - | | | - | | | - |
Residential construction loans | | | 3,201 | | | 3,182 | | | 3,473 | | | 3,432 | | | 1,991 |
Total nonperforming loans | | | 18,056 | | | 16,215 | | | 14,507 | | | 9,065 | | | 8,033 |
OREO | | | 251 | | | 251 | | | 176 | | | - | | | - |
Nonperforming assets | | | 18,307 | | | 16,466 | | | 14,683 | | | 9,065 | | | 8,033 |
Less: Amount guaranteed by Small Business Administration | | | 3,098 | | | 3,201 | | | 3,625 | | | - | | | - |
Nonperforming assets, net of SBA guarantee | | | 15,209 | | | 13,265 | | | 11,058 | | | 9,065 | | | 8,033 |
| | | | | | | | | | | | | | | |
Loans 90 days past due & still accruing | | $ | 265 | | $ | - | | $ | - | | $ | - | | $ | 75 |
| | | | | | | | | | | | | | | |
Allowance for loan losses to: | | | | | | | | | | | | | | | |
Total loans at quarter end | | | 1.19 | % | | 1.20 | % | | 1.23 | % | | 1.20 | % | | 1.23 |
Total nonperforming loans | | | 141.57 | | | 157.83 | | | 178.44 | | | 277.95 | | | 297.04 |
Total nonperforming assets, net of SBA guarantee | | | 170.41 | | | 195.91 | | | 236.94 | | | 277.95 | | | 297.04 |
UNITY BANCORP, INC.
QUARTERLY FINANCIAL DATA
September 30, 2023
| | | | | | | | | | | | | | | | |
(In thousands, except %'s, employee, office and per share amounts) | | September 30, 2023 | | June 30, 2023 | | March 31, 2023 | | December 31, 2022 | | September 30, 2022 | |
SUMMARY OF INCOME: | | | | | | | | | | | | | | | | |
Total interest income | | $ | 36,990 | | $ | 35,392 | | $ | 33,353 | | $ | 30,325 | | $ | 26,224 | |
Total interest expense | | | 13,457 | | | 11,870 | | | 9,443 | | | 5,616 | | | 2,486 | |
Net interest income | | | 23,533 | | | 23,522 | | | 23,910 | | | 24,709 | | | 23,738 | |
Provision for credit losses | | | 534 | | | 777 | | | 108 | | | 1,632 | | | 1,517 | |
Net interest income after provision for credit losses | | | 22,999 | | | 22,745 | | | 23,802 | | | 23,077 | | | 22,221 | |
Total noninterest income | | | 2,043 | | | 2,115 | | | 1,417 | | | 1,946 | | | 1,110 | |
Total noninterest expense | | | 11,995 | | | 11,751 | | | 11,428 | | | 11,389 | | | 10,064 | |
Income before provision for income taxes | | | 13,047 | | | 13,109 | | | 13,791 | | | 13,634 | | | 13,267 | |
Provision for income taxes | | | 3,097 | | | 3,409 | | | 3,504 | | | 3,678 | | | 3,325 | |
Net income | | $ | 9,950 | | $ | 9,700 | | $ | 10,287 | | $ | 9,956 | | $ | 9,942 | |
| | | | | | | | | | | | | | | | |
Net income per common share - Basic | | $ | 0.98 | | $ | 0.96 | | $ | 0.98 | | $ | 0.94 | | $ | 0.94 | |
Net income per common share - Diluted | | | 0.97 | | | 0.95 | | | 0.96 | | | 0.93 | | | 0.93 | |
| | | | | | | | | | | | | | | | |
COMMON SHARE DATA: | | | | | | | | | | | | | | | | |
Market price per share | | $ | 23.43 | | $ | 23.59 | | $ | 22.81 | | $ | 27.33 | | $ | 25.11 | |
Dividends paid | | | 0.12 | | | 0.12 | | | 0.12 | | | 0.11 | | | 0.11 | |
Book value per common share | | | 24.95 | | | 24.12 | | | 23.34 | | | 22.60 | | | 21.86 | |
| | | | | | | | | | | | | | | | |
Weighted average common shares outstanding - Basic | | | 10,128 | | | 10,103 | | | 10,538 | | | 10,557 | | | 10,522 | |
Weighted average common shares outstanding - Diluted | | | 10,258 | | | 10,203 | | | 10,686 | | | 10,740 | | | 10,714 | |
Issued common shares | | | 11,411 | | | 11,387 | | | 11,335 | | | 11,289 | | | 11,236 | |
Outstanding common shares | | | 10,115 | | | 10,119 | | | 10,292 | | | 10,584 | | | 10,533 | |
Treasury shares | | | 1,296 | | | 1,268 | | | 1,043 | | | 705 | | | 703 | |
| | | | | | | | | | | | | | | | |
PERFORMANCE RATIOS (Annualized): | | | | | | | | | | | | | | | | |
Return on average assets | | | 1.61 | % | | 1.60 | % | | 1.72 | % | | 1.72 | % | | 1.85 | % |
Return on average equity | | | 15.84 | | | 16.19 | | | 17.14 | | | 16.82 | | | 17.39 | |
Efficiency ratio** | | | 46.68 | | | 45.54 | | | 44.56 | | | 43.24 | | | 39.59 | |
Noninterest expense to average assets | | | 1.94 | | | 1.93 | | | 1.91 | | | 1.96 | | | 1.87 | |
| | | | | | | | | | | | | | | | |
BALANCE SHEET DATA: | | | | | | | | | | | | | | | | |
Total assets | | $ | 2,563,006 | | $ | 2,552,301 | | $ | 2,475,851 | | $ | 2,444,948 | | $ | 2,339,537 | |
Total securities | | | 136,091 | | | 137,061 | | | 138,264 | | | 140,946 | | | 136,871 | |
Total loans | | | 2,173,190 | | | 2,167,367 | | | 2,130,919 | | | 2,106,559 | | | 1,942,414 | |
Allowance for credit losses | | | 25,918 | | | 25,988 | | | 26,201 | | | 25,196 | | | 23,861 | |
Total deposits | | | 1,884,910 | | | 1,849,528 | | | 1,823,921 | | | 1,787,528 | | | 1,796,597 | |
Total shareholders' equity | | | 252,384 | | | 244,073 | | | 240,459 | | | 239,227 | | | 230,234 | |
| | | | | | | | | | | | | | | | |
TAX EQUIVALENT YIELDS AND RATES: | | | | | | | | | | | | | | | | |
Interest-earning assets | | | 6.22 | % | | 6.07 | % | | 5.84 | % | | 5.48 | % | | 5.09 | % |
Interest-bearing liabilities | | | 3.05 | | | 2.75 | | | 2.27 | | | 1.44 | | | 0.72 | |
Net interest spread | | | 3.17 | | | 3.32 | | | 3.57 | | | 4.04 | | | 4.37 | |
Net interest margin | | | 3.96 | | | 4.04 | | | 4.19 | | | 4.47 | | | 4.61 | |
| | | | | | | | | | | | | | | | |
CREDIT QUALITY: | | | | | | | | | | | | | | | | |
Nonperforming assets | | $ | 18,307 | | $ | 16,466 | | $ | 14,683 | | $ | 9,065 | | $ | 8,033 | |
QTD annualized net (chargeoffs)/recoveries to QTD average loans | | | (0.11) | % | | (0.18) | % | | 0.01 | % | | (0.06) | % | | (0.11) | % |
Allowance for credit losses to total loans | | | 1.19 | | | 1.20 | | | 1.23 | | | 1.20 | | | 1.23 | |
Nonperforming loans to total loans | | | 0.84 | | | 0.76 | | | 0.68 | | | 0.43 | | | 0.41 | |
Nonperforming assets to total assets | | | 0.71 | | | 0.65 | | | 0.59 | | | 0.37 | | | 0.34 | |
| | | | | | | | | | | | | | | | |
CAPITAL RATIOS AND OTHER: | | | | | | | | | | | | | | | | |
Total equity to total assets | | | 9.85 | % | | 9.56 | % | | 9.71 | % | | 9.78 | % | | 9.84 | % |
Community bank leverage ratio, bancorp | | | 10.76 | | | 10.49 | | | 10.38 | | | 10.88 | | | 10.85 | |
| | | | | | | | | | | | | | | | |
Number of banking offices | | | 21 | | | 20 | | | 20 | | | 19 | | | 18 | |
Number of employees | | | 232 | | | 230 | | | 228 | | | 231 | | | 222 | |
** The efficiency ratio is a non-GAAP measure, calculated based on the noninterest expense divided by the sum of net interest income plus non interest income, excluding net gains and losses on securities.
v3.23.3
| X |
- DefinitionBoolean flag that is true when the XBRL content amends previously-filed or accepted submission.
| Name: |
dei_AmendmentFlag |
| Namespace Prefix: |
dei_ |
| Data Type: |
xbrli:booleanItemType |
| Balance Type: |
na |
| Period Type: |
duration |
|
| X |
- DefinitionFor the EDGAR submission types of Form 8-K: the date of the report, the date of the earliest event reported; for the EDGAR submission types of Form N-1A: the filing date; for all other submission types: the end of the reporting or transition period. The format of the date is YYYY-MM-DD.
| Name: |
dei_DocumentPeriodEndDate |
| Namespace Prefix: |
dei_ |
| Data Type: |
xbrli:dateItemType |
| Balance Type: |
na |
| Period Type: |
duration |
|
| X |
- DefinitionThe type of document being provided (such as 10-K, 10-Q, 485BPOS, etc). The document type is limited to the same value as the supporting SEC submission type, or the word 'Other'.
| Name: |
dei_DocumentType |
| Namespace Prefix: |
dei_ |
| Data Type: |
dei:submissionTypeItemType |
| Balance Type: |
na |
| Period Type: |
duration |
|
| X |
- DefinitionAddress Line 1 such as Attn, Building Name, Street Name
| Name: |
dei_EntityAddressAddressLine1 |
| Namespace Prefix: |
dei_ |
| Data Type: |
xbrli:normalizedStringItemType |
| Balance Type: |
na |
| Period Type: |
duration |
|
| X |
- Definition
+ References
+ Details
| Name: |
dei_EntityAddressCityOrTown |
| Namespace Prefix: |
dei_ |
| Data Type: |
xbrli:normalizedStringItemType |
| Balance Type: |
na |
| Period Type: |
duration |
|
| X |
- DefinitionCode for the postal or zip code
| Name: |
dei_EntityAddressPostalZipCode |
| Namespace Prefix: |
dei_ |
| Data Type: |
xbrli:normalizedStringItemType |
| Balance Type: |
na |
| Period Type: |
duration |
|
| X |
- DefinitionName of the state or province.
| Name: |
dei_EntityAddressStateOrProvince |
| Namespace Prefix: |
dei_ |
| Data Type: |
dei:stateOrProvinceItemType |
| Balance Type: |
na |
| Period Type: |
duration |
|
| X |
- DefinitionA unique 10-digit SEC-issued value to identify entities that have filed disclosures with the SEC. It is commonly abbreviated as CIK. Reference 1: http://www.xbrl.org/2003/role/presentationRef
-Publisher SEC
-Name Exchange Act
-Number 240
-Section 12
-Subsection b-2
| Name: |
dei_EntityCentralIndexKey |
| Namespace Prefix: |
dei_ |
| Data Type: |
dei:centralIndexKeyItemType |
| Balance Type: |
na |
| Period Type: |
duration |
|
| X |
- DefinitionIndicate if registrant meets the emerging growth company criteria. Reference 1: http://www.xbrl.org/2003/role/presentationRef
-Publisher SEC
-Name Exchange Act
-Number 240
-Section 12
-Subsection b-2
| Name: |
dei_EntityEmergingGrowthCompany |
| Namespace Prefix: |
dei_ |
| Data Type: |
xbrli:booleanItemType |
| Balance Type: |
na |
| Period Type: |
duration |
|
| X |
- DefinitionCommission file number. The field allows up to 17 characters. The prefix may contain 1-3 digits, the sequence number may contain 1-8 digits, the optional suffix may contain 1-4 characters, and the fields are separated with a hyphen.
| Name: |
dei_EntityFileNumber |
| Namespace Prefix: |
dei_ |
| Data Type: |
dei:fileNumberItemType |
| Balance Type: |
na |
| Period Type: |
duration |
|
| X |
- DefinitionTwo-character EDGAR code representing the state or country of incorporation.
| Name: |
dei_EntityIncorporationStateCountryCode |
| Namespace Prefix: |
dei_ |
| Data Type: |
dei:edgarStateCountryItemType |
| Balance Type: |
na |
| Period Type: |
duration |
|
| X |
- DefinitionThe exact name of the entity filing the report as specified in its charter, which is required by forms filed with the SEC. Reference 1: http://www.xbrl.org/2003/role/presentationRef
-Publisher SEC
-Name Exchange Act
-Number 240
-Section 12
-Subsection b-2
| Name: |
dei_EntityRegistrantName |
| Namespace Prefix: |
dei_ |
| Data Type: |
xbrli:normalizedStringItemType |
| Balance Type: |
na |
| Period Type: |
duration |
|
| X |
- DefinitionThe Tax Identification Number (TIN), also known as an Employer Identification Number (EIN), is a unique 9-digit value assigned by the IRS. Reference 1: http://www.xbrl.org/2003/role/presentationRef
-Publisher SEC
-Name Exchange Act
-Number 240
-Section 12
-Subsection b-2
| Name: |
dei_EntityTaxIdentificationNumber |
| Namespace Prefix: |
dei_ |
| Data Type: |
dei:employerIdItemType |
| Balance Type: |
na |
| Period Type: |
duration |
|
| X |
- DefinitionLocal phone number for entity.
| Name: |
dei_LocalPhoneNumber |
| Namespace Prefix: |
dei_ |
| Data Type: |
xbrli:normalizedStringItemType |
| Balance Type: |
na |
| Period Type: |
duration |
|
| X |
- DefinitionBoolean flag that is true when the Form 8-K filing is intended to satisfy the filing obligation of the registrant as pre-commencement communications pursuant to Rule 13e-4(c) under the Exchange Act. Reference 1: http://www.xbrl.org/2003/role/presentationRef
-Publisher SEC
-Name Exchange Act
-Number 240
-Section 13e
-Subsection 4c
| Name: |
dei_PreCommencementIssuerTenderOffer |
| Namespace Prefix: |
dei_ |
| Data Type: |
xbrli:booleanItemType |
| Balance Type: |
na |
| Period Type: |
duration |
|
| X |
- DefinitionBoolean flag that is true when the Form 8-K filing is intended to satisfy the filing obligation of the registrant as pre-commencement communications pursuant to Rule 14d-2(b) under the Exchange Act. Reference 1: http://www.xbrl.org/2003/role/presentationRef
-Publisher SEC
-Name Exchange Act
-Number 240
-Section 14d
-Subsection 2b
| Name: |
dei_PreCommencementTenderOffer |
| Namespace Prefix: |
dei_ |
| Data Type: |
xbrli:booleanItemType |
| Balance Type: |
na |
| Period Type: |
duration |
|
| X |
- DefinitionTitle of a 12(b) registered security. Reference 1: http://www.xbrl.org/2003/role/presentationRef
-Publisher SEC
-Name Exchange Act
-Number 240
-Section 12
-Subsection b
| Name: |
dei_Security12bTitle |
| Namespace Prefix: |
dei_ |
| Data Type: |
dei:securityTitleItemType |
| Balance Type: |
na |
| Period Type: |
duration |
|
| X |
- DefinitionName of the Exchange on which a security is registered. Reference 1: http://www.xbrl.org/2003/role/presentationRef
-Publisher SEC
-Name Exchange Act
-Number 240
-Section 12
-Subsection d1-1
| Name: |
dei_SecurityExchangeName |
| Namespace Prefix: |
dei_ |
| Data Type: |
dei:edgarExchangeCodeItemType |
| Balance Type: |
na |
| Period Type: |
duration |
|
| X |
- DefinitionBoolean flag that is true when the Form 8-K filing is intended to satisfy the filing obligation of the registrant as soliciting material pursuant to Rule 14a-12 under the Exchange Act. Reference 1: http://www.xbrl.org/2003/role/presentationRef
-Publisher SEC
-Name Exchange Act
-Section 14a
-Number 240
-Subsection 12
| Name: |
dei_SolicitingMaterial |
| Namespace Prefix: |
dei_ |
| Data Type: |
xbrli:booleanItemType |
| Balance Type: |
na |
| Period Type: |
duration |
|
| X |
- DefinitionTrading symbol of an instrument as listed on an exchange.
| Name: |
dei_TradingSymbol |
| Namespace Prefix: |
dei_ |
| Data Type: |
dei:tradingSymbolItemType |
| Balance Type: |
na |
| Period Type: |
duration |
|
| X |
- DefinitionBoolean flag that is true when the Form 8-K filing is intended to satisfy the filing obligation of the registrant as written communications pursuant to Rule 425 under the Securities Act. Reference 1: http://www.xbrl.org/2003/role/presentationRef
-Publisher SEC
-Name Securities Act
-Number 230
-Section 425
| Name: |
dei_WrittenCommunications |
| Namespace Prefix: |
dei_ |
| Data Type: |
xbrli:booleanItemType |
| Balance Type: |
na |
| Period Type: |
duration |
|
v3.23.3
| X |
- DefinitionBoolean flag that is true when the XBRL content amends previously-filed or accepted submission.
| Name: |
dei_AmendmentFlag |
| Namespace Prefix: |
dei_ |
| Data Type: |
xbrli:booleanItemType |
| Balance Type: |
na |
| Period Type: |
duration |
|
| X |
- DefinitionThe type of document being provided (such as 10-K, 10-Q, 485BPOS, etc). The document type is limited to the same value as the supporting SEC submission type, or the word 'Other'.
| Name: |
dei_DocumentType |
| Namespace Prefix: |
dei_ |
| Data Type: |
dei:submissionTypeItemType |
| Balance Type: |
na |
| Period Type: |
duration |
|
| X |
- DefinitionAddress Line 1 such as Attn, Building Name, Street Name
| Name: |
dei_EntityAddressAddressLine1 |
| Namespace Prefix: |
dei_ |
| Data Type: |
xbrli:normalizedStringItemType |
| Balance Type: |
na |
| Period Type: |
duration |
|
| X |
- Definition
+ References
+ Details
| Name: |
dei_EntityAddressCityOrTown |
| Namespace Prefix: |
dei_ |
| Data Type: |
xbrli:normalizedStringItemType |
| Balance Type: |
na |
| Period Type: |
duration |
|
| X |
- DefinitionCode for the postal or zip code
| Name: |
dei_EntityAddressPostalZipCode |
| Namespace Prefix: |
dei_ |
| Data Type: |
xbrli:normalizedStringItemType |
| Balance Type: |
na |
| Period Type: |
duration |
|
| X |
- DefinitionName of the state or province.
| Name: |
dei_EntityAddressStateOrProvince |
| Namespace Prefix: |
dei_ |
| Data Type: |
dei:stateOrProvinceItemType |
| Balance Type: |
na |
| Period Type: |
duration |
|
| X |
- DefinitionA unique 10-digit SEC-issued value to identify entities that have filed disclosures with the SEC. It is commonly abbreviated as CIK. Reference 1: http://www.xbrl.org/2003/role/presentationRef
-Publisher SEC
-Name Exchange Act
-Number 240
-Section 12
-Subsection b-2
| Name: |
dei_EntityCentralIndexKey |
| Namespace Prefix: |
dei_ |
| Data Type: |
dei:centralIndexKeyItemType |
| Balance Type: |
na |
| Period Type: |
duration |
|
| X |
- DefinitionIndicate if registrant meets the emerging growth company criteria. Reference 1: http://www.xbrl.org/2003/role/presentationRef
-Publisher SEC
-Name Exchange Act
-Number 240
-Section 12
-Subsection b-2
| Name: |
dei_EntityEmergingGrowthCompany |
| Namespace Prefix: |
dei_ |
| Data Type: |
xbrli:booleanItemType |
| Balance Type: |
na |
| Period Type: |
duration |
|
| X |
- DefinitionCommission file number. The field allows up to 17 characters. The prefix may contain 1-3 digits, the sequence number may contain 1-8 digits, the optional suffix may contain 1-4 characters, and the fields are separated with a hyphen.
| Name: |
dei_EntityFileNumber |
| Namespace Prefix: |
dei_ |
| Data Type: |
dei:fileNumberItemType |
| Balance Type: |
na |
| Period Type: |
duration |
|
| X |
- DefinitionThe exact name of the entity filing the report as specified in its charter, which is required by forms filed with the SEC. Reference 1: http://www.xbrl.org/2003/role/presentationRef
-Publisher SEC
-Name Exchange Act
-Number 240
-Section 12
-Subsection b-2
| Name: |
dei_EntityRegistrantName |
| Namespace Prefix: |
dei_ |
| Data Type: |
xbrli:normalizedStringItemType |
| Balance Type: |
na |
| Period Type: |
duration |
|
| X |
- DefinitionLocal phone number for entity.
| Name: |
dei_LocalPhoneNumber |
| Namespace Prefix: |
dei_ |
| Data Type: |
xbrli:normalizedStringItemType |
| Balance Type: |
na |
| Period Type: |
duration |
|
Unity Bancorp (NASDAQ:UNTY)
Historical Stock Chart
From Apr 2024 to May 2024

Unity Bancorp (NASDAQ:UNTY)
Historical Stock Chart
From May 2023 to May 2024
