UNITED STATES
SECURITIES AND EXCHANGE COMMISSION
Washington, D.C. 20549
FORM 6-K
REPORT OF FOREIGN PRIVATE ISSUER
PURSUANT TO RULE 13a-16 OR 15d-16
UNDER THE SECURITIES EXCHANGE ACT OF 1934
For the month of November 2023
Commission File Number: 001-40451
DLocal Limited
(Exact name of registrant as specified in its charter)
Dr. Luis Bonavita 1294
Montevideo
Uruguay 11300
+1 (424) 392-7437
(Address of principal executive office)
Indicate by check mark whether the registrant files or will file annual reports under cover of Form 20-F or Form 40-F:
Form 20-F ☒ Form 40-F ☐
Indicate by check mark if the registrant is submitting the Form 6-K in paper as permitted by Regulation S-T Rule 101(b)(1):
Yes ☐ No ☒
Indicate by check mark if the registrant is submitting the Form 6-K in paper as permitted by Regulation S-T Rule 101(b)(7):
Yes ☐ No ☒
TABLE OF CONTENTS
EXHIBIT
SIGNATURE
Pursuant to the requirements of the Securities Exchange Act of 1934, the registrant has duly caused this report to be signed on its behalf by the undersigned, thereunto duly authorized.
|
|
|
|
|
DLocal Limited |
|
|
|
|
|
|
By: |
/s/ Diego Cabrera Canay |
|
|
Name: |
Diego Cabrera Canay |
|
|
Title: |
Chief Financial Officer |
|
Date: November 22, 2023

dLocal Reports 2023 Third Quarter Financial Results
November 21, 2023
Third Quarter 2023
US$4.6 billion Total Payment Volume, up 69% year-over-year and 6% quarter-over-quarter
Revenue of US$164 million, up 47% year-over-year and 2% quarter-over-quarter
141% Net Revenue Retention Rate
Gross Profit of US$75 million, up 38% year-over-year and 5% quarter-over-quarter
Adjusted EBITDA of US$56 million, up 34% year-over-year and 7% quarter-over-quarter
dLocal reports in US dollars and in accordance with IFRS as issued by the IASB
MONTEVIDEO, Uruguay, Nov. 21, 2023 — DLocal Limited (“dLocal”, “we”, “us”, and “our”) (NASDAQ:DLO), a technology - first payments platform today announced its financial results for the third quarter ended September 30, 2023.
“After my first quarter at dLocal, I am extremely enthusiastic about our future prospects and the promising opportunities that lie ahead.
I am pleased to share that we delivered another quarter of solid performance with very solid growth across all main parameters, compared to last year.
TPV growth continues to be supported by our well-diversified merchant base and geographic reach. Revenues increased close to 50% year-over-year even with the strong devaluation of the Nigerian Naira. This is a testament to the resilience and well-diversified business we are building. We remain focused on delivering sustained gross profit growth. In Q3 2023 we attained US$75 million gross profit. Our profitability continues to be among the best in our comparables group. Our ratio of Adjusted EBITDA to Gross Profit came in at 75% for the quarter.
During Q3, we experienced sound growth across all verticals. We continue to see particularly strong traction with our platform solution.
From a geographic standpoint, during Q3 we saw very strong performance in our key markets. We continue to experience sustained strong revenue momentum in Brazil and Mexico as we grow with our existing customers and gain share of wallet. In contrast to the strong performance in our larger and more stable markets, Argentina and Nigeria, less stable markets, now represent only 20% of our total revenues, down from 29% a year ago, negatively impacted by Nigerian currency devaluation and weak macro conditions in Argentina. In addition, our business in Africa and Asia continues to perform very well. Excluding Nigeria, this region grew 79% YoY.
Our investments remain focused on thoughtfully expanding our global team and building the appropriate processes, tools and governance mechanics to ensure our business grows efficiently, and scales appropriately.
We are proud of the strong results we delivered year-to-date. We reaffirm our guidance for the year of revenue between US$620 and US$640 million and Adjusted EBITDA between US$200 and US$220 million. We have not modified our mid-term guidance of 25%-35% gross profit CAGR and Adjusted EBITDA over gross profit >75%.
Our current performance, future pipeline, and market opportunity present a unique opportunity for sustained growth over a multi-year period, driven by the powerful secular trends behind emerging market adoption of digital products and services. We must remain focused on executing against that opportunity, while constructing the foundational blocks as a company to ensure we can scale at the pace our merchants will demand.
Finally, I would like to share that our CFO, Diego Cabrera Canay, has decided to step down from his position to pursue new opportunities. Diego has played a significant role in our financial success during his period at dLocal. He will stay on through Q1 of next year to ensure a smooth transition. As one executive leaves, we are also strengthening our team with new hires in senior
positions, incorporating a new Principal Accounting Officer as well as an SVP of Government Relations and Strategic Partnerships” said Pedro Arnt, co-CEO of dLocal
Third quarter 2023 Financial Highlights
●Total Payment Volume (“TPV”) reached a record US$4.6 billion in the third quarter, up 69% year-over-year compared to US$2.7 billion in the third quarter of 2022 and up 6% compared to an already very strong US$4.4 billion in the second quarter of 2023.
●Revenues amounted to US$163.9 million, up 47% year-over-year compared to US$111.9 million in the third quarter of 2022 and up 2% compared to US$161.1 million in the second quarter of 2023. Excluding Nigeria, which faced a strong currency devaluation during the quarter, revenues would have grown 58% year-over-year and 11% quarter-over-quarter.
●Gross profit was US$74.5 million in the third quarter of 2023, up 38% year-over-year compared to US$53.9 million in the third quarter of 2022 and up 5% compared to US$70.8 million in the second quarter of 2023.
●Gross profit margin was 45% in this quarter, compared to 48% in the third quarter of 2022 and 44% in the second quarter of 2023. Sequentially, gross profit margin was positively impacted by lower expatriation costs and growth in certain countries in Africa & Asia with higher than average gross profit margin.
●Gross profit over TPV remained unchanged quarter-over-quarter at 1.6% and decreasing from 2.0% in the third quarter of 2022 mainly due to business and country mix.
●Adjusted EBITDA was US$55.6 million in the third quarter of 2023, up 34% year-over-year compared to US$41.6 million in the third quarter of 2022 and up 7% compared to US$52.0 million in the second quarter of 2023.
●Adjusted EBITDA margin was 34% in the third quarter of 2023, compared to 37% in the third quarter of 2022 and 32% in the second quarter of 2023. Adjusted EBITDA margin was also up sequentially, in line with gross profit margin.
●Adjusted EBITDA over gross profit remained best in class at 75% in the third quarter of 2023, compared to 74% in the second quarter of 2023 and 77% a year ago.
●Net financial income was US$1.5 million, down from US$7.5 million in the second quarter of 2023 and compared to a loss of US$2.5 million in the third quarter of 2022. Net financial income was negatively affected by the Argentine devaluation on intercompany loans denominated in dollars, partially offset by gains from hedged bonds acquired to protect from that devaluation.
●Effective income tax rate was 18% in the third quarter of 2023 compared to 7% in the third quarter of 2022 and 16% in the second quarter of 2023, as a result of the country mix, with higher local-to-local share of pre-tax income and the non-deductibility of IFRS inflation adjustment.
●Net income for the third quarter of 2023 was US$40.3 million, or US$0.13 per diluted share, up 25% compared to a profit of US$32.3 million, or US$0.10 per diluted share, for the third quarter of 2022 and down 10% compared to a profit of US$44.8 million, or US$0.15 per diluted share for the second quarter of 2023.
●During the third quarter of 2023, net income was affected by two non-cash effects: IFRS inflation adjustment accounting during a quarter of significant devaluation of the Argentine Peso, and exchange differences from USD liabilities held by our Argentina subsidiary during that period; these were partially offset by the fair value gain on our Argentine dollar-linked bonds. Adjusted Net Income (excluding these non-cash effects, in addition to other non-recurring items in line with our Adjusted EBITDA calculation) was $49.2 million during the period.
●As of September 30, 2023, dLocal had US$498.2 million in cash and cash equivalents, including US$191.8 million of own funds and US$306.4 million of merchants’ funds. The consolidated cash position decreased by US$44.1 million from US$542.3 million as of September 30, 2022. When compared to the US$549.4 million cash position as of June 30, 2023, it decreased by US$51.2 million, mainly driven by reduced settlement period to certain merchants and repatriation of funds in Argentina that were outstanding. In addition, we invested US$52.4 million dollars of our own funds in Argentine dollar-linked treasury bonds maturing in 2024. Own funds were up by US$15.1 million from US$176.7 million in the prior quarter.
The following table summarizes our key performance metrics:
|
|
|
|
|
|
|
|
Three months ended 30 of September |
Nine months ended 30 of September |
|
2023 |
2022 |
% change |
2023 |
2022 |
% change |
Key Performance metrics |
(In millions of US$ except for %) |
TPV |
4,618 |
2,734 |
69% |
12,566 |
7,271 |
73% |
Revenue |
163.9 |
111.9 |
47% |
462.3 |
300.5 |
54% |
Gross Profit |
74.5 |
53.9 |
38% |
207.1 |
147.1 |
41% |
Gross Profit margin |
45% |
48% |
-3p.p |
45% |
49% |
-4p.p |
Adjusted EBITDA |
55.6 |
41.6 |
34% |
153.1 |
112.7 |
36% |
Adjusted EBITDA margin |
34% |
37% |
-3p.p |
33% |
37% |
-4p.p |
Adjusted EBITDA/Gross Profit |
75% |
77% |
-3p.p |
74% |
77% |
-3p.p |
Profit |
40.4 |
32.3 |
25% |
120.6 |
89.3 |
35% |
Profit margin |
25% |
29% |
-4p.p |
26% |
30% |
-4p.p |
Third quarter 2023 Business Highlights
●During the third quarter of 2023, pay-ins TPV increased by 68% year-over-year and 8% quarter-over-quarter to US$3.4 billion, accounting for 74% of the TPV.
●Pay-outs TPV increased by 73% year-over-year and flat quarter-over-quarter to US$1.2 billion, accounting for the remaining 26% of the TPV.
●Cross-border TPV increased by 46% year-over-year and 2% quarter-over-quarter to US$2.3 billion. Cross-border volume accounted for 49% of the TPV in the third quarter of 2023.
●Local-to-local TPV increased by 99% year-over-year and 10% quarter-over-quarter to US$2.4 billion. Local-to-local volume accounted for 51% of the TPV in the third quarter of 2023.
●LatAm revenue increased 56% compared to the third quarter of 2022 and 7% quarter-over-quarter to US$136.0 million, accounting for 83% of total revenue. In the third quarter of 2023, we continue to experience strong revenue growth in Brazil and Mexico increasing 105% and 82% year-over-year, respectively.
●Africa and Asia revenue grew by 14% year-over-year and decreased 19% quarter-over-quarter to US$27.9 million, accounting for the remaining 17% of total revenue. Revenues in the third quarter of 2023 were impacted by the devaluation of the Nigerian Naira that occurred in mid June. Nigeria revenues decreased by 39% year-over-year and by 59% quarter-over-quarter. Excluding Nigeria, revenues increased by 79% year-over-year and by 41% quarter-over-quarter in Africa and Asia showing the continued growth across Africa and Asia.
●During the quarter, dLocal continued delivering strong revenue growth both from existing and from new customers. Revenue from Existing Merchants increased to US$157.2 million in the third quarter of 2023. The net revenue retention rate, or NRR, in the third quarter of 2023 reached 141%.
●Revenue from New Merchants was US$6.7 million in the third quarter of 2023.
The table below presents a breakdown of dLocal’s TPV by product and type of flow:
|
|
|
|
|
|
|
|
|
In millions of US$ except for % |
Three months ended 30 of September |
Nine months ended 30 of September |
|
2023 |
% share |
2022 |
% share |
2023 |
% share |
2022 |
% share |
Pay-ins |
3,429 |
74% |
2,046 |
75% |
9,122 |
73% |
5,572 |
77% |
Pay-outs |
1,189 |
26% |
687 |
25% |
3,444 |
27% |
1,699 |
23% |
Total TPV |
4,618 |
100% |
2,734 |
100% |
12,566 |
100% |
7,271 |
100% |
|
|
|
|
|
|
|
|
|
In millions of US$ except for % |
Three months ended 30 of September |
Nine months ended 30 of September |
|
2023 |
% share |
2022 |
% share |
2023 |
% share |
2022 |
% share |
Cross-border |
2,256 |
49% |
1,544 |
56% |
6,435 |
51% |
4,332 |
60% |
Local-to-local |
2,362 |
51% |
1,190 |
44% |
6,131 |
49% |
2,939 |
40% |
Total TPV |
4,618 |
100% |
2,734 |
100% |
12,566 |
100% |
7,271 |
100% |
The table below presents a breakdown of dLocal’s revenue by geography:
|
|
|
|
|
|
|
|
|
In thousands of US$ except for % |
Three months ended 30 of September |
Nine months ended 30 of September |
|
2023 |
% share |
2022 |
% share |
2023 |
% share |
2022 |
% share |
Latin America |
136.0 |
83% |
87.3 |
78% |
361.2 |
78% |
252.5 |
84% |
Brazil |
44.7 |
27% |
21.8 |
19% |
108.8 |
24% |
60.6 |
20% |
Argentina |
23.9 |
15% |
19.1 |
17% |
64.6 |
14% |
63.4 |
21% |
Mexico |
30.2 |
18% |
16.6 |
15% |
81.3 |
18% |
45.6 |
15% |
Chile |
12.4 |
8% |
13.7 |
12% |
40.8 |
9% |
38.6 |
13% |
Other LatAm |
24.8 |
15% |
16.0 |
14% |
65.7 |
14% |
44.4 |
15% |
|
|
|
|
|
|
|
|
|
Africa & Asia |
27.9 |
17% |
24.5 |
22% |
101.2 |
22% |
48.0 |
16% |
Nigeria |
8.3 |
5% |
13.6 |
12% |
55.6 |
12% |
19.7 |
7% |
Other Africa & Asia |
19.6 |
12% |
10.9 |
10% |
45.6 |
10% |
28.2 |
9% |
|
|
|
|
|
|
|
|
|
Total Revenue |
163.9 |
100% |
111.9 |
100% |
462.3 |
100% |
300.5 |
100% |
Special note regarding Adjusted EBITDA and Adjusted EBITDA Margin
dLocal has only one operating segment. dLocal measures its operating segment’s performance by Revenues, Adjusted EBITDA and Adjusted EBITDA Margin, and uses these metrics to make decisions about allocating resources.
Adjusted EBITDA as used by dLocal is defined as the profit from operations before financing and taxation for the year or period, as applicable, before depreciation of property, plant and equipment, amortization of right-of-use assets and intangible assets, and further excluding the changes in fair value of financial assets and derivative instruments carried at fair value through profit or loss, impairment gains/(losses) on financial assets, transaction costs, share-based payment non-cash charges, secondary offering expenses, and inflation adjustment. dLocal defines Adjusted EBITDA Margin as the Adjusted EBITDA divided by consolidated revenues.
Although Adjusted EBITDA and Adjusted EBITDA Margin may be commonly viewed as non-IFRS measures in other contexts, pursuant to IFRS 8, (“Operating Segments”), Adjusted EBITDA and Adjusted EBITDA Margin are treated by dLocal as IFRS measures based on the manner in which dLocal utilizes these measures. Nevertheless, dLocal’s Adjusted EBITDA and Adjusted EBITDA Margin metrics should not be viewed in isolation or as a substitute for net income for the periods presented under IFRS. dLocal also believes that its Adjusted EBITDA and Adjusted EBITDA Margin metrics are useful metrics used by analysts and investors, although these measures are not explicitly defined under IFRS. Additionally, the way dLocal calculates operating segment’s performance measures may be different from the calculations used by other entities, including competitors, and therefore, dLocal’s performance measures may not be comparable to those of other entities. Finally, dLocal is unable to present a quantitative reconciliation of forward-looking guidance for Adjusted EBITDA and Adjusted EBITDA over gross profit, which are forward-looking non-IFRS measures, because dLocal cannot reliably predict certain of their necessary components, such as impairment gains/(losses) on financial assets, transaction costs, and inflation adjustment.
The table below presents a reconciliation of dLocal’s Adjusted EBITDA and Adjusted EBITDA Margin to net income:
|
|
|
|
|
$ in thousands |
Three months ended 30 of September |
Nine months ended 30 of September |
|
2023 |
2022 |
2023 |
2022 |
Profit for the period |
40,364 |
32,338 |
120,605 |
89,333 |
Income tax expense |
8,897 |
2,287 |
21,952 |
7,651 |
Depreciation and amortization |
3,237 |
2,110 |
8,621 |
5,690 |
Finance income and costs, net |
(1,548) |
2,479 |
(10,398) |
3,519 |
Share-based payment non-cash charges |
3,322 |
1,599 |
7,072 |
4,874 |
Other operating (gain)/loss |
- |
706 |
- |
706 |
Secondary offering expenses¹ |
- |
- |
- |
89 |
Impairment loss / (gain) on financial assets |
(2,508) |
(24) |
(2,478) |
(106) |
Inflation adjustment |
3,817 |
127 |
6,497 |
905 |
Other non-recurring costs³ |
- |
- |
1,229 |
- |
Adjusted EBITDA |
55,581 |
41,622 |
153,100 |
112,661 |
Note: 1Corresponds to expenses assumed by dLocal in relation to secondary offerings of its shares which occurred in 2021. 2 During 2022, the Company utilized FTX Trading Ltd. (“FTX”) services for the repatriation of funds from one country. On November 11, 2022, when FTX filed for Chapter 11 bankruptcy in the United States, the Company had deposits of USD 5,576, whose withdrawals had not been processed by FTX. Such deposits were included in the loss allowance. As of September 30, 2023 and December 31, 2022, the Group does not hold any positions in crypto assets.” During the three months ending September 2023, the Group reassessed the recovery probability of its deposits based on negotiations with third parties that are willing to acquire them and publicly available information. Thus, the Group recognized a gain of USD 2,509 as result of the reversion of the loss allowance for the period ending September 30, 2023. 3 It includes non-recurring costs related to an internal review of the allegations made by a short-seller report, including fees from independent counsel, independent global expert services and forensic accounting advisory firm.
Special note regarding Adjusted Net Income
Adjusted Net Income is a non-IFRS financial measure. As used by dLocal Adjusted net income is defined as the profit for the period (net income) excluding impairment gains/(losses) on financial assets, transaction costs, share-based payment non-cash charges, secondary offering expenses, and other operating (gain)/loss, in line with our Adjusted EBITDA calculation (see detailed methodology for Adjusted EBITDA in page 9). It further excludes the accounting non-cash charges related to the fair value gain from the Argentine dollar-linked bonds and the exchange difference loss from the intercompany loan denominated in USD that we granted to our Argentine subsidiary to purchase the bonds. In addition, it excludes the inflation adjustment based on IFRS rules for hyperinflationary economies. We believe Adjusted Net Income is a useful measure for understanding our results for operations while excluding for certain non-cash effects such as currency devaluation and inflation. Our calculation for Adjusted Net Income may differ from similarly-titled measures presented by other companies and should not be considered in isolation or as a replacement for our measure of profit for the period as presented in accordance with IFRS.
The table below presents a reconciliation of dLocal’s Adjusted net income:
|
|
|
|
|
In thousands of US$ |
Three months ended 30 of September |
Nine months ended 30 of September |
|
2023 |
2022 |
2023 |
2022 |
Net income, as reported |
40,364 |
32,338 |
120,605 |
89,333 |
Share-based payment non-cash charges |
3,322 |
1,599 |
7,072 |
4,874 |
Other operating (gain)/loss |
- |
706 |
- |
706 |
Secondary offering expenses¹ |
- |
- |
- |
89 |
Impairment loss / (gain) on financial assets² |
(2,508) |
(24) |
(2,478) |
(106) |
Inflation adjustment³ |
3,817 |
127 |
6,497 |
905 |
Other non-recurring costs4 |
- |
- |
1,229 |
- |
Fair value (loss) / gains of financial assets at FVTPL5 |
(24,232) |
- |
(27,797) |
- |
Exchange difference - intercompany loan in USD5 |
27,351 |
- |
29,166 |
- |
Income tax adjustments6 |
1,092 |
56 |
479 |
56 |
Adjusted net income |
49,206 |
34,802 |
134,773 |
95,857 |
Note: 1Corresponds to expenses assumed by dLocal in relation to secondary offerings of its shares which occurred in 2021. 2 During 2022, the Company utilized FTX Trading Ltd. (“FTX”) services for the repatriation of funds from one country. On November 11, 2022, when FTX filed for Chapter 11 bankruptcy in the United States, the Company had deposits of USD 5,576, whose withdrawals had not been processed by FTX. Such deposits were included in the loss allowance. As of September 30, 2023 and December 31, 2022, the Group does not hold any positions in crypto assets.” During the three months ending September 2023, the Group reassessed the recovery probability of its deposits based on negotiations with third parties that are willing to acquire them and publicly available information. Thus, the Group recognized a gain of USD 2,509 as result of the reversion of the loss allowance for the period ending September 30, 2023. 3 Following IAS 29 requirements, Argentina’s economy is considered hyperinflationary. In this sense, the financial statements of the Argentinian subsidiaries were restated to reflect the purchasing power of the currency and therefore a gain on net monetary position arose. 4 It includes non-recurring costs related to an internal review of the allegations made by a short-seller report, including fees from independent counsel, independent global expert services and forensic accounting advisory firm. 5During Q3 2023 we recognized a fair value gain of US$ 24.2 million (US$ 3.6 million in Q2 2023) from the Argentine dollar-linked bonds and an exchange difference loss of US$ 27.4 million (-US$ 1.8 million in Q2 2023) from the intercompany loan denominated in USD that we granted to our Argentine subsidiary to purchase the bonds. 6We calculated the tax impact on all adjustments based on their corresponding tax rate.
Earnings per share
We calculate basic earnings per share by dividing the profit attributable to owners of the group by the weighted average number of common shares issued and outstanding during the three-months and nine-month periods ended September 30, 2023 and 2022.
Our diluted earnings per share is calculated by dividing the profit attributable to owners of the group of dLocal by the weighted average number of common shares outstanding during the period plus the weighted average number of common shares that would be issued on conversion of all dilutive potential common shares into common shares.
The following table presents the information used as a basis for the calculation of our earnings per share:
|
|
|
|
|
|
Three months ended 30 of September |
Nine months ended 30 of September |
|
2023 |
2022 |
2023 |
2022 |
Profit attributable to common shareholders (thousands USD) |
40,308 |
32,462 |
120,449 |
89,326 |
Weighted average number of common shares |
289,411,641 |
295,918,751 |
292,058,528 |
295,455,429 |
Adjustments for calculation of diluted earnings per share |
16,620,498 |
17,246,606 |
16,509,161 |
17,783,776 |
Weighted average number of common shares for calculating diluted earnings per share |
306,032,139 |
313,165,357 |
308,567,689 |
313,239,205 |
Basic earnings per share |
0.14 |
0.11 |
0.41 |
0.30 |
Diluted earnings per share |
0.13 |
0.10 |
0.39 |
0.29 |
This press release does not contain sufficient information to constitute an interim financial report as defined in International Accounting Standards 34, “Interim Financial Reporting” nor a financial statement as defined by International Accounting Standards 1 “Presentation of Financial Statements”. The quarterly financial information in this press release has not been audited.
Conference call and webcast
dLocal’s management team will host a conference call and audio webcast on November 22nd, 2023 at 8:00 a.m. Eastern Time. Please click here to pre-register for the conference call and obtain your dial in number and passcode.
The live conference call can be accessed via audio webcast at the investor relations section of dLocal’s website, at https://investor.dlocal.com/. An archive of the webcast will be available for a year following the conclusion of the conference call. The investor presentation will also be filed on EDGAR at www.sec.gov.
About dLocal
dLocal powers local payments in emerging markets, connecting global enterprise merchants with billions of emerging market consumers in more than 40 countries across APAC, the Middle East, Latin America, and Africa. Through the “One dLocal” platform (one direct API, one platform, and one contract), global companies can accept payments, send pay-outs and settle funds globally without the need to manage separate pay-in and pay-out processors, set up numerous local entities, and integrate multiple acquirers and payment methods in each market.
Definition of selected operational metrics
“API” means application programming interface, which is a general term for programming techniques that are available for software developers when they integrate with a particular service or application. In the payments industry, APIs are usually provided by any party participating in the money flow (such as payment gateways, processors, and service providers) to facilitate the money transfer process.
“Cross-border” means a payment transaction whereby dLocal is collecting in one currency and settling into a different currency and/or in a different geography.
“Local payment methods” refers to any payment method that is processed in the country where the end user of the merchant sending or receiving payments is located, which include credit and debit cards, cash payments, bank transfers, mobile money, and digital wallets.
“Local-to-local” means a payment transaction whereby dLocal is collecting and settling in the same currency.
“Net Revenue Retention Rate” or “NRR” is a U.S. dollar-based measure of retention and growth of dLocal’s merchants. NRR is calculated for a period or year by dividing the Current Period/Year Revenue by the Prior Period/Year Revenue. The Prior Period/Year Revenue is the revenue billed by us to all our customers in the prior period. The Current Period/Year Revenue is the revenue billed by us in the current period to the same customers included in the Prior Period/Year Revenue. Current Period/Year Revenue includes revenues from
any upselling and cross-selling across products, geographies, and payment methods to such merchant customers, and is net of any contractions or attrition, in respect of such merchant customers, and excludes revenue from new customers on-boarded in the preceding twelve months. As most of dLocal revenues come from existing merchants, the NRR rate is a key metric used by management, and we believe it is useful for investors in order to assess our retention of existing customers and growth in revenues from our existing customer base.
“Pay-in” means a payment transaction whereby dLocal’s merchant customers receive payment from their customers.
“Pay-out” means a payment transaction whereby dLocal disburses money in local currency to the business partners or customers of dLocal’s merchant customers.
“Revenue from New Merchants” means the revenue billed by us to merchant customers that we did not bill revenues in the same quarter (or period) of the prior year.
“Revenue from Existing Merchants” means the revenue billed by us in the last twelve months to the merchant customers that we billed revenue in the same quarter (or period) of the prior year.
“TPV” dLocal presents total payment volume, or TPV, which is an operating metric of the aggregate value of all payments successfully processed through dLocal’s payments platform. Because revenue depends significantly on the total value of transactions processed through the dLocal platform, management believes that TPV is an indicator of the success of dLocal’s global merchants, the satisfaction of their end users, and the scale and growth of dLocal’s business.
Forward-looking statements
This press release contains certain forward-looking statements. These forward-looking statements convey dLocal’s current expectations or forecasts of future events, including guidance in respect of revenue, Adjusted EBITDA, gross profit CAGR and Adjusted EBITDA over gross profit. Forward-looking statements regarding dLocal and amounts stated as guidance are based on current management expectations and involve known and unknown risks, uncertainties and other factors that may cause dLocal’s actual results, performance or achievements to be materially different from any future results, performances or achievements expressed or implied by the forward-looking statements. Certain of these risks and uncertainties are described in the “Risk Factors,” “Forward-Looking Statements” and “Cautionary Statement Regarding Forward-Looking Statements” sections of dLocal’s filings with the U.S. Securities and Exchange Commission. Unless required by law, dLocal undertakes no obligation to publicly update or revise any forward-looking statements to reflect circumstances or events after the date hereof. In addition, dLocal is unable to present a quantitative reconciliation of forward-looking guidance for Adjusted EBITDA and Adjusted EBITDA over gross profit, which are forward-looking non-IFRS measures, because dLocal cannot reliably predict certain of their necessary components, such as impairment gains/(losses) on financial assets, transaction costs, and inflation adjustment.
dLocal Limited
Certain interim financial information
Consolidated Condensed Statements of Comprehensive Income for the three-month and nine-month periods ended September 30, 2023 and 2022
(In thousands of U.S. dollars, except per share amounts, unaudited)
|
|
|
|
|
|
Three months ended 30 of September |
Nine months ended 30 of September |
|
2023 |
2022 |
2023 |
2022 |
|
|
|
|
|
Revenues |
163,921 |
111,864 |
462,346 |
300,497 |
Cost of services |
(89,378) |
(57,992) |
(255,206) |
(153,432) |
Gross profit |
74,543 |
53,872 |
207,140 |
147,065 |
|
|
|
|
|
Technology and development expenses |
(3,696) |
(1,692) |
(8,626) |
(4,741) |
Sales and marketing expenses |
(4,447) |
(3,472) |
(12,410) |
(9,444) |
General and administrative expenses |
(17,378) |
(11,483) |
(49,926) |
(30,872) |
Impairment (loss)/gain on financial assets |
2,508 |
24 |
2,478 |
106 |
Other operating (loss)/gain |
- |
(18) |
- |
(706) |
Operating profit |
51,530 |
37,231 |
138,656 |
101,408 |
Finance income |
44,449 |
6,810 |
70,315 |
12,346 |
Finance costs |
(42,901) |
(9,289) |
(59,917) |
(15,865) |
Inflation adjustment |
(3,817) |
(127) |
(6,497) |
(905) |
Other results |
(2,269) |
(2,606) |
3,901 |
(4,424) |
Profit before income tax |
49,261 |
34,625 |
142,557 |
96,984 |
Income tax expense |
(8,897) |
(2,287) |
(21,952) |
(7,651) |
Profit for the period |
40,364 |
32,338 |
120,605 |
89,333 |
|
|
|
|
|
Profit attributable to: |
|
|
|
|
Owners of the Group |
40,308 |
32,462 |
120,449 |
89,326 |
Non-controlling interest |
56 |
(124) |
156 |
7 |
Profit for the period |
40,364 |
32,338 |
120,605 |
89,333 |
|
|
|
|
|
Earnings per share (in USD) |
|
|
|
|
Basic Earnings per share |
0.14 |
0.11 |
0.41 |
0.30 |
Diluted Earnings per share |
0.13 |
0.10 |
0.39 |
0.29 |
|
|
|
|
|
Other comprehensive income |
|
|
|
|
Items that may be reclassified to profit or loss: |
|
|
|
|
Exchange difference on translation on foreign operations |
(1,822) |
(405) |
1,341 |
(488) |
Other comprehensive income for the period, net of tax |
(1,822) |
(405) |
1,341 |
(488) |
Total comprehensive income for the period, net of tax |
38,542 |
31,933 |
121,946 |
88,845 |
|
|
|
|
|
Total comprehensive income for the period |
|
|
|
|
Owners of the Group |
38,487 |
32,057 |
121,792 |
88,838 |
Non-controlling interest |
55 |
(124) |
154 |
7 |
Total comprehensive income for the period |
38,542 |
31,933 |
121,946 |
88,845 |
dLocal Limited
Certain interim financial information
Consolidated Condensed Statements of Financial Position as of September 30, 2023 and December 31, 2022
(In thousands of U.S. dollars, except per share amounts, unaudited)
|
|
|
|
30 of September, 2023 |
31 of December, 2022 |
ASSETS |
|
|
Current Assets |
|
|
Cash and cash equivalents |
498,165 |
468,092 |
Financial assets at fair value through profit or loss |
103,920 |
1,295 |
Trade and other receivables |
312,506 |
240,446 |
Derivative financial instruments |
353 |
1,206 |
Other assets |
27,549 |
56,789 |
Total Current Assets |
942,493 |
767,828 |
|
|
|
Non-Current Assets |
|
|
Deferred tax assets |
1,314 |
362 |
Property, plant and equipment |
3,488 |
2,734 |
Right-of-use assets |
3,884 |
3,934 |
Intangible assets |
56,381 |
51,443 |
Total Non-Current Assets |
65,067 |
58,473 |
TOTAL ASSETS |
1,007,560 |
826,301 |
|
|
|
LIABILITIES |
|
|
Current Liabilities |
|
|
Trade and other payables |
549,839 |
407,874 |
Lease liabilities |
630 |
686 |
Tax liabilities |
14,035 |
11,695 |
Derivative financial instruments |
1,373 |
544 |
Provisions |
637 |
1,473 |
Total Current Liabilities |
566,514 |
422,272 |
|
|
|
Non-Current Liabilities |
|
|
Deferred tax liabilities |
6,675 |
1,016 |
Lease liabilities |
3,509 |
3,393 |
Total Non-Current Liabilities |
10,184 |
4,409 |
TOTAL LIABILITIES |
576,698 |
426,681 |
|
|
|
EQUITY |
|
|
Share Capital |
578 |
592 |
Share Premium |
68,550 |
164,307 |
Capital Reserve |
21,252 |
16,185 |
Other Reserves |
(1,827) |
(1,448) |
Retained earnings |
342,164 |
219,993 |
Total Equity Attributable to owners of the Group |
430,717 |
399,629 |
Non-controlling interest |
145 |
(9) |
TOTAL EQUITY |
430,862 |
399,620 |
dLocal Limited
Certain interim financial information
Consolidated Condensed Statements of Cash flows for three-month and nine-month period ended September 30, 2023 and 2022
(In thousands of U.S. dollars, except per share amounts, unaudited)
|
|
|
|
|
|
Three months ended 30 of September |
Nine months ended 30 of September |
|
2023 |
2022 |
2023 |
2022 |
Cash flows from operating activities |
|
|
|
|
Profit before income tax |
49,261 |
34,625 |
142,557 |
96,984 |
Adjustments: |
|
|
|
|
Interest income from financial instruments |
(20,217) |
(6,835) |
(42,429) |
(12,371) |
Interest charges for lease liabilities |
373 |
(45) |
468 |
133 |
Other finance expense |
1,918 |
14,795 |
3,120 |
15,732 |
Finance expense related to derivative financial instruments |
12,647 |
(4,773) |
22,516 |
- |
Net exchange differences |
28,438 |
(6,088) |
32,520 |
(10,434) |
Fair value loss on financial assets at fair value through profit or loss |
(24,232) |
43 |
(27,886) |
25 |
Amortization of Intangible assets |
2,897 |
1,793 |
7,565 |
4,809 |
Depreciation of Property, plant and equipment |
219 |
189 |
626 |
530 |
Amortization of Right-of-use asset |
121 |
128 |
430 |
351 |
Revenue reduction related to prepaid assets |
- |
246 |
- |
457 |
Share-based payment expense, net of forfeitures |
3,322 |
1,599 |
7,072 |
4,874 |
Net Impairment loss/(gain) on financial assets |
(2,508) |
(24) |
(2,478) |
(106) |
|
52,239 |
35,653 |
144,081 |
100,984 |
Changes in working capital |
|
|
|
|
Increase in Trade and other receivables |
(12,706) |
(33,131) |
(72,092) |
(37,873) |
Decrease/(increase) in Other assets |
19,592 |
(2,635) |
31,749 |
(3,328) |
Increase in Trade and other payables |
(48,174) |
88,030 |
141,965 |
146,446 |
Decrease in Tax Liabilities |
(1,035) |
1,437 |
(4,376) |
(3,284) |
(Decrease) / Increase in Provisions |
(279) |
(33) |
(836) |
(170) |
Cash from operating activities |
9,637 |
89,321 |
240,491 |
202,775 |
Income tax paid |
(1,663) |
(3,028) |
(8,479) |
(6,956) |
Net cash from operating activities |
7,974 |
86,293 |
232,012 |
195,819 |
|
|
|
|
|
Cash flows from investing activities |
|
|
|
|
Acquisition of Property, plant and equipment |
(329) |
(285) |
(986) |
(859) |
Additions of Intangible assets |
(4,358) |
(2,989) |
(12,503) |
(7,715) |
Payments of contingent consideration |
- |
(665) |
- |
(665) |
Acquisitions of financial assets at FVTPL |
(53,531) |
- |
(101,670) |
- |
Net collections of financial assets at FVTPL |
(3,757) |
(236) |
(2,234) |
(518) |
Interest collected from financial instruments |
20,454 |
6,835 |
42,429 |
12,371 |
Net cash provided by / (used in) investing activities |
(41,521) |
2,660 |
(74,964) |
2,614 |
|
|
|
|
|
Cash flows from financing activities |
|
|
|
|
Repurchase of shares |
- |
- |
(97,929) |
- |
Share-options exercise |
- |
2,818 |
153 |
3,724 |
Borrowing proceeds |
- |
126 |
- |
14,782 |
Borrowing repayments |
- |
- |
- |
(5,364) |
Interest payments on lease liability |
(373) |
45 |
(468) |
(133) |
Principal payments on lease liability |
(512) |
22 |
(788) |
(125) |
Finance expense paid related to derivative financial instruments |
(9,466) |
- |
(20,803) |
- |
Other finance expense paid |
(1,915) |
(3,181) |
(3,120) |
(4,360) |
Net cash (used in) / provided by financing activities |
(12,266) |
(170) |
(122,955) |
8,524 |
Net increase in cash flow |
(45,813) |
88,783 |
34,093 |
206,957 |
|
|
|
|
|
Cash and cash equivalents at the beginning of the period |
549,386 |
453,985 |
468,092 |
336,197 |
Net increase in cash flow |
(45,813) |
88,783 |
34,093 |
206,957 |
Effects of exchange rate changes on cash and cash equivalents |
(5,408) |
(470) |
(4,020) |
(856) |
Cash and cash equivalents at the end of the period |
498,165 |
542,298 |
498,165 |
542,298 |
dLocal was incorporated on February 10, 2021, as a Cayman Islands exempted company with limited liability, duly registered with the Cayman Islands Registrar of Companies. The contribution of dLocal Group Limited (a limited liability company incorporated in Malta, the former holding entity or “dLocal Malta”) shares to dLocal was finalized as of April 14, 2021. Until the contribution of dLocal Malta shares to it, dLocal had not commenced operations, consequently the historical information previous to that date presented herein corresponds to dLocal Malta, our predecessor. This reorganization was done, among other reasons, to facilitate the initial public offering of the Group. dLocal had no prior assets, holdings or operations.
Investor Relations Contact:
investor@dlocal.com
Media Contact:
marketing@dlocal.com
Exhibit 99.2
DLocal Limited
Unaudited Consolidated Condensed Interim Financial Statements as of September 30, 2023 and for the nine-month and three-month periods ended September 30, 2023 and 2022
DLocal Limited
Consolidated Condensed Interim Statements of Comprehensive Income
For the nine-month and three-month periods ended September 30, 2023 and 2022
(All amounts in thousands of U.S. Dollars except share data or as otherwise indicated)
|
|
|
|
|
|
|
|
|
|
|
|
|
|
|
|
|
|
|
|
|
|
|
Nine months ended |
|
|
Three months ended |
|
|
|
Notes |
|
September 30, 2023 |
|
|
September 30, 2022 |
|
|
September 30, 2023 |
|
|
September 30, 2022 |
|
Continuing operations |
|
|
|
|
|
|
|
|
|
|
|
|
|
|
Revenues |
|
6 |
|
|
462,346 |
|
|
|
300,497 |
|
|
|
163,921 |
|
|
|
111,864 |
|
Cost of services |
|
6 |
|
|
(255,206 |
) |
|
|
(153,432 |
) |
|
|
(89,378 |
) |
|
|
(57,992 |
) |
Gross profit |
|
|
|
|
207,140 |
|
|
|
147,065 |
|
|
|
74,543 |
|
|
|
53,872 |
|
Technology and development expenses |
|
7 |
|
|
(8,626 |
) |
|
|
(4,741 |
) |
|
|
(3,696 |
) |
|
|
(1,692 |
) |
Sales and marketing expenses |
|
8 |
|
|
(12,410 |
) |
|
|
(9,444 |
) |
|
|
(4,447 |
) |
|
|
(3,472 |
) |
General and administrative expenses |
|
8 |
|
|
(49,926 |
) |
|
|
(30,872 |
) |
|
|
(17,378 |
) |
|
|
(11,483 |
) |
Impairment reversal on financial assets |
|
16, 17 |
|
|
2,478 |
|
|
|
106 |
|
|
|
2,508 |
|
|
|
24 |
|
Other operating loss |
|
|
|
|
— |
|
|
|
(706 |
) |
|
|
— |
|
|
|
(18 |
) |
Operating profit |
|
|
|
|
138,656 |
|
|
|
101,408 |
|
|
|
51,530 |
|
|
|
37,231 |
|
Finance income |
|
11 |
|
|
70,315 |
|
|
|
12,346 |
|
|
|
44,449 |
|
|
|
6,810 |
|
Finance costs |
|
11 |
|
|
(59,917 |
) |
|
|
(15,865 |
) |
|
|
(42,901 |
) |
|
|
(9,289 |
) |
Inflation adjustment |
|
11 |
|
|
(6,497 |
) |
|
|
(905 |
) |
|
|
(3,817 |
) |
|
|
(127 |
) |
Other results |
|
|
|
|
3,901 |
|
|
|
(4,424 |
) |
|
|
(2,269 |
) |
|
|
(2,606 |
) |
Profit before income tax |
|
|
|
|
142,557 |
|
|
|
96,984 |
|
|
|
49,261 |
|
|
|
34,625 |
|
Income tax expense |
|
12 |
|
|
(21,952 |
) |
|
|
(7,651 |
) |
|
|
(8,897 |
) |
|
|
(2,287 |
) |
Profit for the period |
|
|
|
|
120,605 |
|
|
|
89,333 |
|
|
|
40,364 |
|
|
|
32,338 |
|
Profit attributable to: |
|
|
|
|
|
|
|
|
|
|
|
|
|
|
Owners of the Group |
|
|
|
|
120,449 |
|
|
|
89,326 |
|
|
|
40,308 |
|
|
|
32,462 |
|
Non-controlling interest |
|
|
|
|
156 |
|
|
|
7 |
|
|
|
56 |
|
|
|
(124 |
) |
Profit for the period |
|
|
|
|
120,605 |
|
|
|
89,333 |
|
|
|
40,364 |
|
|
|
32,338 |
|
Earnings per share |
|
|
|
|
|
|
|
|
|
|
|
|
|
|
Basic Earnings per share |
|
13 |
|
|
0.41 |
|
|
|
0.30 |
|
|
|
0.14 |
|
|
|
0.11 |
|
Diluted Earnings per share |
|
13 |
|
|
0.39 |
|
|
|
0.29 |
|
|
|
0.13 |
|
|
|
0.10 |
|
Other comprehensive Income |
|
|
|
|
|
|
|
|
|
|
|
|
|
|
Items that may be reclassified to profit or loss: |
|
|
|
|
|
|
|
|
|
|
|
|
|
|
Exchange difference on translation on foreign operations |
|
|
|
|
1,341 |
|
|
|
(488 |
) |
|
|
(1,822 |
) |
|
|
(405 |
) |
Other comprehensive income for the period, net of tax |
|
|
|
|
1,341 |
|
|
|
(488 |
) |
|
|
(1,822 |
) |
|
|
(405 |
) |
Total comprehensive income for the period |
|
|
|
|
121,946 |
|
|
|
88,845 |
|
|
|
38,542 |
|
|
|
31,933 |
|
Total comprehensive income for the period is attributable to: |
|
|
|
|
|
|
|
|
|
|
|
|
|
|
Owners of the Group |
|
|
|
|
121,792 |
|
|
|
88,838 |
|
|
|
38,487 |
|
|
|
32,057 |
|
Non-controlling interest |
|
|
|
|
154 |
|
|
|
7 |
|
|
|
55 |
|
|
|
(124 |
) |
Total comprehensive income for the period |
|
|
|
|
121,946 |
|
|
|
88,845 |
|
|
|
38,542 |
|
|
|
31,933 |
|
The accompanying notes are an integral part of these Consolidated Condensed Interim Financial Statements.
DLocal Limited
Consolidated Condensed Interim Statements of Financial Position
As of September 30, 2023 and December 31, 2022
(All amounts in thousands of U.S. Dollars except share data or as otherwise indicated)
|
|
|
|
|
|
|
|
|
Notes |
|
September 30, 2023 |
|
December 31, 2022 |
ASSETS |
|
|
|
|
|
|
Current Assets |
|
|
|
|
|
|
Cash and cash equivalents |
|
14 |
|
498,165 |
|
468,092 |
Financial assets at fair value through profit or loss |
|
15 |
|
103,920 |
|
1,295 |
Trade and other receivables |
|
16 |
|
312,506 |
|
240,446 |
Derivative financial instruments |
|
21 |
|
353 |
|
1,206 |
Other assets |
|
17 |
|
27,549 |
|
56,789 |
Total Current Assets |
|
|
|
942,493 |
|
767,828 |
Non-Current Assets |
|
|
|
|
|
|
Deferred tax assets |
|
|
|
1,314 |
|
362 |
Property, plant and equipment |
|
|
|
3,488 |
|
2,734 |
Right-of-use assets |
|
|
|
3,884 |
|
3,934 |
Intangible assets |
|
18 |
|
56,381 |
|
51,443 |
Total Non-Current Assets |
|
|
|
65,067 |
|
58,473 |
TOTAL ASSETS |
|
|
|
1,007,560 |
|
826,301 |
LIABILITIES |
|
|
|
|
|
|
Current Liabilities |
|
|
|
|
|
|
Trade and other payables |
|
19 |
|
549,839 |
|
407,874 |
Lease liabilities |
|
|
|
630 |
|
686 |
Tax liabilities |
|
20 |
|
14,035 |
|
11,695 |
Derivative financial instruments |
|
21 |
|
1,373 |
|
544 |
Provisions |
|
22 |
|
637 |
|
1,473 |
Total Current Liabilities |
|
|
|
566,514 |
|
422,272 |
Non-Current Liabilities |
|
|
|
|
|
|
Deferred tax liabilities |
|
|
|
6,675 |
|
1,016 |
Lease liabilities |
|
|
|
3,509 |
|
3,393 |
Total Non-Current Liabilities |
|
|
|
10,184 |
|
4,409 |
TOTAL LIABILITIES |
|
|
|
576,698 |
|
426,681 |
EQUITY |
|
13 |
|
|
|
|
Share Capital |
|
|
|
578 |
|
592 |
Share Premium |
|
|
|
68,550 |
|
164,307 |
Capital Reserve |
|
|
|
21,252 |
|
16,185 |
Other Reserves |
|
|
|
(1,827) |
|
(1,448) |
Retained earnings |
|
|
|
342,164 |
|
219,993 |
Total Equity Attributable to owners of the Group |
|
|
|
430,717 |
|
399,629 |
Non-controlling interest |
|
|
|
145 |
|
(9) |
TOTAL EQUITY |
|
|
|
430,862 |
|
399,620 |
TOTAL LIABILITIES AND EQUITY |
|
|
|
1,007,560 |
|
826,301 |
The accompanying notes are an integral part of these Consolidated Condensed Interim Financial Statement
DLocal Limited
Consolidated Condensed Interim Statements of Changes in Equity
For the nine-month periods ended September 30, 2023 and 2022
(All amounts in thousands of U.S. Dollars except share data or as otherwise indicated)
|
|
|
|
|
|
|
|
|
|
|
|
|
|
|
|
|
|
|
|
|
Notes |
|
Share
Capital |
|
Share
Premium |
|
Capital
Reserve |
|
Other Reserves |
|
Retained
Earnings |
|
Total |
|
Non-
controlling
interest |
|
Total
equity |
Balance as of January 1st, 2023 |
|
|
|
592 |
|
164,307 |
|
16,185 |
|
(1,448) |
|
219,993 |
|
399,629 |
|
(9) |
|
399,620 |
Comprehensive Income for the period |
|
|
|
|
|
|
|
|
|
|
|
|
|
|
|
|
|
|
Profit for the period |
|
|
|
— |
|
— |
|
— |
|
— |
|
120,449 |
|
120,449 |
|
156 |
|
120,605 |
Exchange difference on translation on foreign operations |
|
|
|
— |
|
— |
|
— |
|
(379) |
|
1,722 |
|
1,343 |
|
(2) |
|
1,341 |
Total Comprehensive Income for the period |
|
|
|
— |
|
— |
|
— |
|
(379) |
|
122,171 |
|
121,792 |
|
154 |
|
121,946 |
Transactions with Group owners in their capacity as owners |
|
|
|
|
|
|
|
|
|
|
|
|
|
|
|
|
|
|
Share-options exercise |
|
13 |
|
— |
|
2,158 |
|
(2,005) |
|
— |
|
— |
|
153 |
|
— |
|
153 |
Share-based payments net of forfeitures |
|
9 |
|
— |
|
— |
|
7,072 |
|
— |
|
— |
|
7,072 |
|
— |
|
7,072 |
Repurchase of shares |
|
13 |
|
(14) |
|
(97,915) |
|
— |
|
— |
|
— |
|
(97,929) |
|
— |
|
(97,929) |
Transactions with Group owners in their capacity as owners |
|
|
|
(14) |
|
(95,757) |
|
5,067 |
|
— |
|
— |
|
(90,704) |
|
— |
|
(90,704) |
Balance as of September 30, 2023 |
|
|
|
578 |
|
68,550 |
|
21,252 |
|
(1,827) |
|
342,164 |
|
430,717 |
|
145 |
|
430,862 |
Balance as of January 1st, 2022 |
|
|
|
590 |
|
157,151 |
|
12,741 |
|
(30) |
|
109,867 |
|
280,319 |
|
(18) |
|
280,301 |
Comprehensive Income for the period |
|
|
|
|
|
|
|
|
|
|
|
|
|
|
|
|
|
|
Profit for the period |
|
|
|
— |
|
— |
|
— |
|
— |
|
89,326 |
|
89,326 |
|
7 |
|
89,333 |
Exchange difference on translation on foreign operations |
|
|
|
— |
|
— |
|
— |
|
(1,755) |
|
1,267 |
|
(488) |
|
— |
|
(488) |
Total Comprehensive Income for the period |
|
|
|
— |
|
— |
|
— |
|
(1,755) |
|
90,593 |
|
88,838 |
|
7 |
|
88,845 |
Transactions with Group owners in their capacity as owners |
|
|
|
|
|
|
|
|
|
|
|
|
|
|
|
|
|
|
Share-options exercise |
|
13 |
|
2 |
|
8,167 |
|
(4,445) |
|
— |
|
— |
|
3,724 |
|
— |
|
3,724 |
Forfeitures |
|
13 |
|
— |
|
— |
|
(720) |
|
— |
|
— |
|
(720) |
|
— |
|
(720) |
Share-based payments |
|
9 |
|
— |
|
— |
|
5,594 |
|
— |
|
— |
|
5,594 |
|
— |
|
5,594 |
Transactions with Group owners in their capacity as owners |
|
|
|
2 |
|
8,167 |
|
429 |
|
— |
|
— |
|
8,598 |
|
— |
|
8,598 |
Balance as of September 30, 2022 |
|
|
|
592 |
|
165,318 |
|
13,170 |
|
(1,785) |
|
200,460 |
|
377,755 |
|
(11) |
|
377,744 |
The accompanying notes are an integral part of these Consolidated Condensed Interim Financial Statements.
DLocal Limited
Consolidated Condensed Interim Statements of Cash Flows
For the nine-month periods ended September 30, 2023 and 2022
(All amounts in thousands of U.S. Dollars except share data or as otherwise indicated)
|
|
|
|
|
|
|
|
|
|
|
Nine months ended |
|
|
Notes |
|
September 30, 2023 |
|
September 30, 2022 |
Cash flows from operating activities |
|
|
|
|
|
|
Profit before income tax |
|
|
|
142,557 |
|
96,984 |
Adjustments: |
|
|
|
|
|
|
Interest income from financial instruments |
|
11 |
|
(42,429) |
|
(12,371) |
Interest charges for lease liabilities |
|
11 |
|
468 |
|
133 |
Other finance expense |
|
|
|
3,120 |
|
15,732 |
Finance expense related to derivative financial instruments |
|
|
|
22,516 |
|
— |
Net exchange differences |
|
|
|
32,520 |
|
(10,434) |
Fair value gain on financial assets at fair value through profit or loss |
|
11 |
|
(27,886) |
|
25 |
Amortization of Intangible assets |
|
10 |
|
7,565 |
|
4,809 |
Depreciation of Property, plant and equipment |
|
10 |
|
626 |
|
530 |
Amortization of Right-of-use asset |
|
10 |
|
430 |
|
351 |
Revenue reduction related to prepaid assets |
|
6 |
|
— |
|
457 |
Share-based payment expense, net of forfeitures |
|
9 |
|
7,072 |
|
4,874 |
Net Impairment loss/(gain) on financial assets |
|
16, 17 |
|
(2,478) |
|
(106) |
|
|
|
|
144,081 |
|
100,984 |
Changes in working capital |
|
|
|
|
|
|
Increase in Trade and other receivables |
|
16 |
|
(72,092) |
|
(37,873) |
Decrease/(increase) in Other assets |
|
17 |
|
31,749 |
|
(3,328) |
Increase in Trade and other payables |
|
19 |
|
141,965 |
|
146,446 |
Decrease in Tax Liabilities |
|
20 |
|
(4,376) |
|
(3,284) |
Decrease in Provisions |
|
22 |
|
(836) |
|
(170) |
Cash from operating activities |
|
|
|
240,491 |
|
202,775 |
Income tax paid |
|
|
|
(8,479) |
|
(6,956) |
Net cash from operating activities |
|
|
|
232,012 |
|
195,819 |
Cash flows from investing activities |
|
|
|
|
|
|
Acquisitions of Property, plant and equipment |
|
|
|
(986) |
|
(859) |
Additions of Intangible assets |
|
18 |
|
(12,503) |
|
(7,715) |
Payments of contingent consideration |
|
|
|
— |
|
(665) |
Acquisition of financial assets at FVPL |
|
|
|
(101,670) |
|
— |
Net collections of financial assets at FVPL |
|
|
|
(2,234) |
|
(518) |
Interest collected from financial instruments |
|
|
|
42,429 |
|
12,371 |
Net cash used in investing activities |
|
|
|
(74,964) |
|
2,614 |
Cash flows from financing activities |
|
|
|
|
|
|
Repurchase of shares |
|
13 |
|
(97,929) |
|
— |
Share-options exercise |
|
|
|
153 |
|
3,724 |
Borrowings proceeds |
|
|
|
— |
|
14,782 |
Borrowings repayments |
|
|
|
— |
|
(5,364) |
Interest payments on lease liability |
|
|
|
(468) |
|
(133) |
Principal payments on lease liability |
|
|
|
(788) |
|
(125) |
Finance expense paid related to derivative financial instruments |
|
|
|
(20,803) |
|
— |
Other finance expense paid |
|
|
|
(3,120) |
|
(4,360) |
Net cash (used in)/provided by financing activities |
|
|
|
(122,955) |
|
8,524 |
Net increase in cash flow |
|
|
|
34,093 |
|
206,957 |
Cash and cash equivalents at the beginning of the period |
|
|
|
468,092 |
|
336,197 |
Effects of exchange rate changes on cash and cash equivalents |
|
|
|
(4,020) |
|
(856) |
Cash and cash equivalents at the end of the period |
|
|
|
498,165 |
|
542,298 |
The accompanying notes are an integral part of these Consolidated Condensed Interim Financial Statements.
DLocal Limited
Notes to the Consolidated Condensed Interim Financial Statements
At September 30, 2023
(All amounts in thousands of U.S. Dollars except share data or as otherwise indicated)
1. General information and Significant Events during the period
1.1. General information
DLocal Limited (“dLocal” or the “Company”) is a holding company, referred to together with its subsidiaries as the “Group”. dLocal is a limited liability company. The Group was established on October 5, 2016, under the holding company dLocal Group Limited, domiciled and incorporated in Malta, and on April 14, 2021 it was reorganized under dLocal, domiciled and incorporated in the Cayman Islands. The Company is the ultimate controlling party of the Group.
The Group processes payment transactions, enabling merchants located in developed economies (mainly United States, Europe and China) to get paid (“payins”) from customers in emerging markets and to make payments (“payouts”) to customers in emerging markets. As of the date of issuance of these Consolidated Condensed Interim Financial Statements, the Group continued to focus on its expansion efforts bringing the total number of countries in the geographic network to 40.
In order to conduct its business, the Group has direct connections with banks, acquirers and payments processors to process payments locally in emerging markets. It also operates with financial institutions to expatriate/repatriate the funds to/from the developed economies where the merchant customers elect to settle their funds in the currency of their preference (mainly U.S. Dollar and Euro). These Consolidated Condensed Interim Financial Statements include dLocal’s subsidiaries and details of the structure are included under Note 4: Consolidation of subsidiaries.
The Group is licensed and regulated in the EU as an Electronic Money Issuer, or EMI, and Payment Institution, or PI, and registered as a Money Service Business with the Financial Crimes Enforcement Network of the U.S. Department of the Treasury, or FinCEN, and operates and may be licensed, as applicable, in 40 countries in emerging markets, primarily in the Americas, Asia and Africa.
In addition, the Group is subject to laws aimed at preventing money laundering, corruption and the financing of terrorism. This regulatory landscape is constantly changing, including as a consequence of the implementation of the Fifth Anti-Money Laundering Directive (Directive (EU) 2018/843, “MLD5”) and the amended texts of the proposed Anti-Money Laundering Regulation (“AMLR”).
1.2. Significant events during the period
Class action lawsuits
On February 23 and February 28, 2023, respectively, DLocal Limited was named, along with several of its senior executives and/or directors, as defendant in certain putative class action lawsuits filed in the Supreme Court of the State of New York, New York County, asserting claims under Sections 11, 12, and 15 of the Securities Act of 1933 based in significant part on the short-seller report mentioned in note 1.3.e). These matters, captioned Zappia et al. v. DLocal Limited et al., Index No. 151778/2023 (Sup. Ct. N.Y. Cty.), and Hunt et al. v. DLocal Limited et al., Index No. 651058/2023 (Sup. Ct. N.Y. Cty.), allege, among other things, that the registration statement for our June 2021 initial public offering reflected certain material misstatements or omissions.
On March 3, 2023, plaintiffs in the two Actions filed a stipulation and proposed order consolidating the cases and appointing putative lead counsel, which application remains pending. The parties also agreed to a schedule for plaintiffs’ filing of an amended complaint and a subsequent briefing schedule for a motion to dismiss the amended complaint.
On May 12, 2023, plaintiffs in the Zappia and Hunt actions jointly filed a consolidated amended complaint. On July 11, 2023, Dlocal filed a motion to dismiss the complaint. Plaintiffs filed their opposition brief on August 15, 2023, and DLO filed its reply in further support of its motion to dismiss on September 22, 2023. The motion to dismiss has now been fully briefed and is awaiting further action of the court. No other proceedings are currently ongoing or scheduled.
On October 6, 2023, DLO was named as a defendant, along with its Co-CEO, Sebastián Kanovich, and CFO, Diego Cabrera Canay, in a new putative class action lawsuit filed in the U.S. District Court for the Eastern District of New York, asserting claims under Section 10(b) of the Securities Exchange Act of 1934 (the “Exchange Act”) and SEC Rule 10b-5, as well as control person claims against the individual defendants under Section 20(a) of the Exchange Act. This lawsuit, captioned Francis v. dLocal Ltd., et al., 1:23-cv-07501 (E.D.N.Y.), alleges misstatements and omissions in various public filings during the period of May 2, 2022 to May 25, 2023 relating to regulatory foreign exchange control risks in Argentina, and dLocal’s compliance controls and procedures. This lawsuit is in an early phase of litigation, and DLO anticipates jointly proposing a schedule for responding to any amended or designated-operative complaint after the court appoints a lead plaintiff and lead counsel for the proposed class.
Due to the preliminary posture of the above described lawsuits as of the date of issuance of these consolidated condensed interim financial statements, the Management and its legal advisors are unable to evaluate the likelihood of an adverse outcome or estimate a range of potential losses and no provision for contingencies have been recorded for the aforementioned matters. DLocal Limited intends to defend itself vigorously in these actions. As of the date of issuance of the Company’s financial statements there were no further updates in this regard.
Developments in Argentina
On April 20, 2023, the Central Bank in Argentina issued Comunicacion “A” 7746, which amends certain foreign exchange regulations and establishes procedures to obtain foreign currency for the settlement of certain professional, advertising services and other business services. On April 27, 2023, General Resolution No. 5351 was published, modifying Argentina’s System for Imports and Payments of Services Abroad (Sistema de Importaciones de la República Argentina y Pagos de Servicios al Exterior) (“SIRASE”) regime and establishing that all SIRASE applications must be approved by the Secretary of Commerce. The approval of certain of the Company’s expatriation requests submitted after April 20, 2023 are outstanding as of the date of the issuance of these condensed interim financial statements. Management continues to monitor the situation in close communication with our merchants.
In addition, during 2023 certain administrative and judicial inquiries have been initiated against DLocal Argentina S.A. These inquiries do not seek financial penalties at this stage. The Management and its legal advisors consider that the activities of the Company and its representatives were carried out in compliance with applicable laws and regulations, including compliance with foreign exchange market and tax regulations. Because of this and given the incipient nature of the inquiry, no provision for contingencies have been recorded for the aforementioned matters.
In June 2023, the Company announced that given the magnitude of dLocal’s business in Argentina, dLocal intended to show additional economic substance with its plan to hire approximately 100 people over the next year and 300 people in the medium-term in the country and to make an aggregate investment over time of up to USD100 million in Argentina, including through locally issued Argentinian federal government bonds US Dollar linked that may be used locally to fulfill operating expenses and local investments according to the company's strategy. On June 14, 2023, the Company acquired with own funds an amount of 48,540 bonds issued by the Treasury department of Argentina through a public bidding process (see note 15 Financial Assets at Fair Value through profit or loss). On July 31, 2023, the Company made a second purchase of bonds issued by the Treasury department of Argentina through a public bidding process, for a total amount of 47,607. These bonds are U.S. linked (payable in pesos but at the official spot exchange rate at the time of payment) with a coupon rate of 0.4% and a maturity date of April 2024.
2. Presentation and preparation of the Consolidated Condensed Interim Financial Statements and significant accounting policies
2.1. Basis of preparation of consolidated condensed interim financial information
These Consolidated Condensed Interim Financial Statements for the nine months ended September 30, 2023 have been prepared in accordance with International Accounting Standard 34, “Interim Financial Reporting” as issued by the International Accounting Standard Board.
These Consolidated Condensed Interim Financial Statements do not include all the notes of the type normally included in an annual consolidated financial statement. Accordingly, this report should be read in conjunction with the annual consolidated financial statements for the year ended December 31, 2022 (the “Annual Financial Statements”).
The accounting policies and critical accounting estimates and judgments adopted, except for those explicitly indicated on these Consolidated Condensed Interim Financial Statements, are consistent with those of the previous financial year and corresponding interim reporting period.
All amounts are presented in thousands of U.S. Dollars except share data or as otherwise indicated.
These Consolidated Condensed Interim Financial Statements for the nine months ended September 30, 2023 were authorized for issuance by the dLocal’s Board of Directors on November 20, 2023.
2.2. Share-based payments
During the nine months ended September 30, 2023 , the Group granted new share options and restricted share units under the Amended and Restated 2020 Global Share Incentive Plan to executives and employees in return for their services, which represented changes in the composition of share options outstanding at the end of the period.
2.2.1. Employee Share Purchase Plan (“ESPP”)
Set out below are summaries of restricted share units and share options granted under the plan:
|
|
|
|
|
|
|
|
|
|
|
September 30, 2023 |
|
December 31, 2022 |
|
|
Average |
|
|
|
Average |
|
|
|
|
exercise price |
|
Number of |
|
exercise price |
|
Number of |
|
|
(U.S. Dollars) |
|
options and RSUs |
|
(U.S. Dollars) |
|
options and RSUs |
At the beginning of the period |
|
8.30 |
|
3,534,561 |
|
1.16 |
|
4,032,345 |
Granted during the period |
|
6.01 |
|
3,831,490 |
|
18.90 |
|
1,474,463 |
Exercised during the period |
|
2.65 |
|
(564,272) |
|
3.45 |
|
(1,136,375) |
Cancelled during the period |
|
0.002 |
|
(13,428) |
|
— |
|
— |
Forfeited during the period |
|
13.97 |
|
(236,683) |
|
10.31 |
|
(835,872) |
At the end of the period |
|
7.26 |
|
6,551,668 |
|
8.30 |
|
3,534,561 |
Vested and exercisable at the end of the period |
|
6.46 |
|
876,557 |
|
4.06 |
|
347,788 |
No options expired during the periods covered by the above table.
2.3. New accounting pronouncements
The Group has not early adopted the following standards, interpretations or amendments that have been issued but are not yet effective:
Amendments to IFRS 16 - Lease Liability in a Sale and Leaseback
On September 22, 2022, the IASB issued 'Lease Liability in a Sale and Leaseback (Amendments to IFRS 16)' with amendments that clarify how a seller-lessee subsequently measures sale and leaseback transactions that satisfy the requirements in IFRS 15 to be accounted for as a sale. This amendment is effective for annual periods beginning on or after January 1, 2024. Earlier application is permitted. The Company has not opted for early application. The management of the Company does not anticipate that the application of this amendment will have a material impact on the Company's consolidated financial statements.
Amendments to IAS 1 - Non-current Liabilities with Covenants
On October 31, 2022, the IASB issued 'Non-current Liabilities with Covenants (Amendments to IAS 1)' to clarify how conditions with which an entity must comply within twelve months after the reporting period affect the classification of a liability. This amendment is effective for annual periods beginning on or after January 1, 2024. Earlier application is permitted. The Company has not opted for early application. The management of the Company does not anticipate that the application of this amendment will have a material impact on the Company's consolidated financial statements.
Amendments to IAS 12 - International Tax Reform (Pillar Two Model Rules)
On May 23, 2023, the IASB issued 'International Tax Reform — Pillar Two Model Rules (Amendments to IAS 12)' to respond to stakeholders’ concerns about the potential implications of the imminent implementation of the OECD pillar two model rules on the accounting for income taxes. This amendment is effective for annual periods beginning on or after January 1, 2023. The management of the Company does not anticipate that the application of this amendment will have a material impact on the Company's consolidated financial statements.
Amendments to IAS 7 and IFRS 7 - Supplier Finance Arrangements
On May 25, 2023, the IASB issued 'Supplier Finance Arrangements (Amendments to IAS 7 and IFRS 7)' to add disclosure requirements, and ‘signposts’ within existing disclosure requirements, that ask entities to provide qualitative and quantitative information about supplier finance arrangements. This amendment is effective for annual periods beginning on or after January 1, 2024. Earlier application is permitted. The Company has not opted for early application. The management of the Company does not anticipate that the application of this amendment will have a material impact on the Company’s consolidated financial statements.
Lack of Exchangeability – Amendments to IAS 21
In August 2023, the IASB amended IAS 21 to add requirements to help entities to determine whether a currency is exchangeable into another currency, and the spot exchange rate to use when it is not. These new requirements will apply from 2025, with early application permitted. The management of the Company is assessing if the application of this amendment will have a material impact on the Company's consolidated financial statements.
The Group did not change its accounting policies or make retrospective adjustments as a result of new accounting standards made applicable on January 1, 2023.
3. Accounting estimates and judgments
Accounting estimates and judgments are continually evaluated and are based on historical experience and other factors, including expectations of future events that are believed to be reasonable under the circumstances.
The critical accounting estimates and judgments adopted on these Consolidated Condensed Interim Financial Statements are consistent with those of the previous financial year and corresponding interim reporting period.
4. Consolidation of subsidiaries
DLocal Limited, located in Cayman Islands, is the parent company of the Group and acts as a holding company for subsidiaries whose main activity is cross-border and local payments, enabling international merchants to access end customers in emerging markets. Its revenue comes from dividends receivable from subsidiaries and share of profit from subsidiary partnership.
The consolidated condensed interim financial statements of the Group include the following subsidiaries, each of which serves a different vertical or a specific service according to the needs of the Group:
|
|
|
|
|
|
|
|
|
|
|
|
|
|
|
% of equity interest held by Dlocal |
Entity name |
|
Country of incorporation |
|
Principal activities |
|
September 30, 2023 |
|
December 31, 2022 |
Dlocal Group Limited |
|
Malta |
|
Holding Company |
|
100% |
|
100% |
Dlocal Limited |
|
Malta |
|
Payments provider |
|
99.999% |
|
99.999% |
Dlocal Markets Limited |
|
Malta |
|
Holding Company |
|
100% |
|
100% |
Dlocal Hold Ops Limited |
|
Cayman Islands |
|
Holding Company |
|
100% |
|
100% |
Dlocal LLP |
|
United Kingdom |
|
Payments provider |
|
99.999% |
|
99.999% |
Dlocal Corp LLP |
|
United Kingdom |
|
Payments provider |
|
99.999% |
|
99.999% |
Dlocal OpCo UK LTD |
|
United Kingdom |
|
Payments provider |
|
100% |
|
100% |
Dlocal Inc. (³) |
|
United States of America |
|
Holding Company |
|
- |
|
100% |
Dlocal Technologies S.A. |
|
Uruguay |
|
Service provider |
|
100% |
|
100% |
Dlocal Uruguay S.A. |
|
Uruguay |
|
Collection agent |
|
100% |
|
100% |
Dlocal PTE Limited |
|
Singapore |
|
Holding Company |
|
100% |
|
100% |
Dlocal Argentina S.A. |
|
Argentina |
|
Collection agent |
|
100% |
|
100% |
Demerge Arg S.A. |
|
Argentina |
|
Service provider |
|
100% |
|
100% |
Dlocal Services S.A. |
|
Argentina |
|
Service provider |
|
100% |
|
100% |
Demerge Services S.A. |
|
Argentina |
|
Service provider |
|
100% |
|
100% |
Depansum Arg S.A. |
|
Argentina |
|
Service provider |
|
100% |
(2) |
- |
DLocal Developments Arg S.A. |
|
Argentina |
|
Service provider |
|
100% |
(2) |
- |
DLocal Bangladesh Limited |
|
Bangladesh |
|
Collection agent |
|
100% |
|
100% |
Demerge Bolivia S.R.L. |
|
Bolivia |
|
Collection agent |
|
100% |
|
100% |
Dlocal Brasil Holding Financeira Ltda. |
|
Brazil |
|
Holding Company |
|
100% |
|
100% |
Dlocal Brasil Instituição de Pagamento S.A. |
|
Brazil |
|
Collection agent |
|
100% |
|
100% |
Demerge Brasil Facilitadora de Pagamentos Ltda. |
|
Brazil |
|
Collection agent |
|
100% |
|
100% |
Webpay Brasil Pagamentos Ltda. |
|
Brazil |
|
Collection agent |
|
100% |
|
100% |
Demerge Cameroun SARL |
|
Cameroon |
|
Collection agent |
|
100% |
|
100% |
Dlocal Chile SPA |
|
Chile |
|
Collection agent |
|
100% |
|
100% |
Demerge Chile SPA |
|
Chile |
|
Collection agent |
|
100% |
|
100% |
Pagos y Servicios Limitada |
|
Chile |
|
Collection agent |
|
99% |
|
99% |
FCA CL 2 SpA |
|
Chile |
|
Collection agent |
|
100% |
|
100% |
Dlocal Colombia S.A.S. |
|
Colombia |
|
Collection agent |
|
100% |
|
100% |
Demerge Colombia S.A.S. |
|
Colombia |
|
Collection agent |
|
100% |
|
100% |
Kupa Colombia S.A.S. |
|
Colombia |
|
Collection agent |
|
100% |
|
100% |
Dlocal Costa Rica SRL |
|
Costa Rica |
|
Collection agent |
|
100% |
|
100% |
Demerege Ecuador S.A. |
|
Ecuador |
|
Collection agent |
|
100% |
|
100% |
Dlocal Egypt LLC |
|
Egypt |
|
Collection agent |
|
100% |
|
100% |
Dlocal El Salvador S.A de C.V. |
|
El Salvador |
|
Collection agent |
|
100% |
|
100% |
dLocal Ghana Limited Company |
|
Ghana |
|
Collection agent |
|
100% |
|
100% |
Demerge Guatemala S.A. |
|
Guatemala |
|
Collection agent |
|
100% |
|
100% |
Dlocal Honduras S.A. |
|
Honduras |
|
Collection agent |
|
100% |
|
100% |
Depansum Solutions Private Limited |
|
India |
|
Collection agent |
|
99.99% |
|
99.99% |
Dlocal India Pvt Limited |
|
India |
|
Collection agent |
|
99.99% |
|
99.99% |
Guisol Solutions Private Limited |
|
India |
|
Collection agent |
|
100% |
|
100% |
PT Dlocal Solutions Indonesia |
|
Indonesia |
|
Collection agent |
|
100% |
|
100% |
PT Dlocal Services Gateway |
|
Indonesia |
|
Collection agent |
|
85% |
(2) |
- |
PT Dlocal Payment Solutions Indonesia |
|
Indonesia |
|
Collection agent |
|
85% |
(2) |
- |
Dlocal Opco Ireland Ltd |
|
Ireland |
|
Payments provider |
|
100% |
(2) |
- |
Dlocal Israel Limited |
|
Israel |
|
Service provider |
|
100% |
|
100% |
Dlocal SARL |
|
Ivory Coast |
|
Collection agent |
|
100% |
|
100% |
Demerge Japan Ltd |
|
Japan |
|
Collection agent |
|
66.6% |
|
66.6% |
Dlocal Payments Kenya Limited |
|
Kenya |
|
Collection agent |
|
100% |
|
100% |
|
|
|
|
|
|
|
|
|
Depansum Limited |
|
Kenya |
|
Collection agent |
|
99% |
(2) |
- |
Depansum Malaysia SDN. BHD. |
|
Malaysia |
|
Collection agent |
|
100.0% |
|
100.0% |
Demerge Mexico S.A. de C.V. |
|
Mexico |
|
Collection agent |
|
99.9% |
|
99.9% |
Dlocal Mexico S.A. DE C.V. |
|
Mexico |
|
Collection agent |
|
99.9% |
|
99.9% |
Dlocal Technologies Mexico S.A. DE C.V. |
|
Mexico |
|
Service provider |
|
100% |
|
100% |
DLocal Morocco SARL AU |
|
Morocco |
|
Collection agent |
|
100% |
|
100% |
Demerge Nigeria Limited |
|
Nigeria |
|
Collection agent |
|
100% |
|
100% |
Dlocal Panama S.A. |
|
Panama |
|
Collection agent |
|
100% |
|
100% |
Dlocal Paraguay S.A. |
|
Paraguay |
|
Collection agent |
|
100% |
|
100% |
Demerge Peru S.A.C. |
|
Peru |
|
Collection agent |
|
99% |
|
99% |
Depansum Perú S.A.C |
|
Peru |
|
Collection agent |
|
100% |
|
100% |
Dlocal Payments Philippines Incorporated |
|
Philippines |
|
Collection agent |
|
100% |
|
100% |
Demerge República Dominicana SAS |
|
República Dominicana |
|
Collection agent |
|
99.99% |
|
99.99% |
Dlocal Rwanda Ltd. |
|
Rwanda |
|
Collection agent |
|
100% |
|
100% |
Demerge Senegal SAURL |
|
Senegal |
|
Collection agent |
|
100% |
(2) |
- |
Depansum PTY Limited |
|
South Africa |
|
Collection agent |
|
100% |
|
100% |
DLP South Africa PTY Ltd. |
|
South Africa |
|
Collection agent |
|
100% |
|
100% |
Demerge España SL |
|
Spain |
|
Service provider |
|
100% |
(2) |
- |
Dlocal Tanzania LTD |
|
Tanzania |
|
Collection agent |
|
100% |
|
100% |
Demerge (Thailand) Co. LTD (1) |
|
Thailand |
|
Collection agent |
|
49% |
|
49% |
Dlocal Uganda LTD |
|
Uganda |
|
Collection agent |
|
100% |
|
100% |
Dlocal Payment Services L.L.C. |
|
United Arab Emirates |
|
Collection agent |
|
100% |
|
100% |
Dlocal US LLC |
|
United States of America |
|
Service provider |
|
100% |
|
100% |
Dlocal Holding Uruguay S.A. (Formerly CILFUR S.A.) |
|
Uruguay |
|
Service provider |
|
100% |
|
100% |
DEMERGE URUGUAY S.A. (Formerly 'Maubek S.A.') |
|
Uruguay |
|
Service provider |
|
100% |
|
100% |
DLOCAL SERVICES URUGUAY S.A. (Formerly 'Harpot S.A.') |
|
Uruguay |
|
Collection agent |
|
100% |
|
100% |
Dlocal Vietnam Company Limited |
|
Vietnam |
|
Collection agent |
|
100% |
|
100% |
|
|
(1) |
Although Dlocal is the owner of 49% of Demerge (Thailand) Co. LTD, the Group controls its operations according to the guidelines in IFRS 10. |
(2) |
The Group has determined that the acquisition or incorporation of this subsidiary during 2023 does not constitute a business according to IFRS 3. |
|
|
(3) |
Dlocal Inc. was liquidated during July, 2023. |
|
|
5. Segment reporting
The Group operates in a single operating segment, which is “payment processing”. Operating segments are defined as components of an enterprise for which separate financial information is regularly evaluated by the chief operating decision maker, who in the Group’s case is the Executive Team, in deciding how to allocate resources and assess performance. The Executive Team is composed of the Co-Chief Executive Officers (“Co-CEOs”), the Co-President and Chief Operating Officer (“COO”), the Co-President and Chief Strategy Officer, the Chief Technology Officer (“CTO”), the Chief Revenue Officer (“CRO”), the General Counsel and the Chief Financial Officer (“CFO”).
The Executive Team evaluates the Group’s financial information and resources and assess the financial performance of these resources on a consolidated basis on the basis of Revenues, Adjusted EBITDA and Adjusted EBITDA margin as further described below.
Adjusted EBITDA and Adjusted EBITDA Margin
The Executive Team assesses the financial performance of the Group’s sole segment by Revenues, Adjusted EBITDA and Adjusted EBITDA Margin. The Adjusted EBITDA is defined as the consolidated profit from operations before financing and taxation for the year or period, as applicable, before depreciation of property, plant and equipment, amortization of right-of-use assets and intangible assets, and further excluding inflation adjustment, other operating gain/loss, impairment gain/loss on financial assets, secondary offering expenses, transaction costs, other non-recurring costs and share-based payment non-cash charges. The Group defines Adjusted EBITDA Margin as the Adjusted EBITDA divided by consolidated revenues.
The Group reconciles the segment’s performance measure to profit for the period as presented in the Consolidated Condensed Interim Statements of Comprehensive Income as follows:
|
|
|
|
|
|
|
|
|
|
|
|
|
Nine months ended |
|
Three months ended |
|
|
Note |
September 30, 2023 |
|
September 30, 2022 |
|
September 30, 2023 |
|
September 30, 2022 |
Profit for the period (1) |
|
|
120,605 |
|
89,333 |
|
40,364 |
|
32,338 |
Income tax expense |
|
12 |
21,952 |
|
7,651 |
|
8,897 |
|
2,287 |
Inflation adjustment |
|
11 |
6,497 |
|
905 |
|
3,817 |
|
127 |
Finance income |
|
11 |
(70,315) |
|
(12,346) |
|
(44,449) |
|
(6,810) |
Finance costs |
|
11 |
59,917 |
|
15,865 |
|
42,901 |
|
9,289 |
Depreciation and amortization |
|
10 |
8,621 |
|
5,690 |
|
3,237 |
|
2,110 |
Impairment gain on financial assets |
|
16 |
(2,478) |
|
(106) |
|
(2,508) |
|
(24) |
Secondary offering expenses (2) |
|
8 |
— |
|
89 |
|
— |
|
— |
Other non-recurring costs (3) |
|
8 |
1,229 |
|
706 |
|
— |
|
706 |
Share-based payment non-cash charges, net of forfeitures |
|
9 |
7,072 |
|
4,874 |
|
3,322 |
|
1,599 |
Adjusted EBITDA |
|
|
153,100 |
|
112,661 |
|
55,581 |
|
41,622 |
|
|
|
|
|
|
|
|
|
|
Revenues |
|
6 |
462,346 |
|
300,497 |
|
163,921 |
|
111,864 |
Adjusted EBITDA |
|
|
153,100 |
|
112,661 |
|
55,581 |
|
41,622 |
Adjusted EBITDA Margin |
|
|
33.1% |
|
37.5% |
|
33.9% |
|
37.2% |
1.Includes a net gain of USD 15,573 related to the effective portion of the change in the spot rate of the hedged currency, which offsets a foreign exchange loss of USD 15,962 (together for a net foreign exchange gain of USD 389 included in cost of services). For further information refer to Notes 6(c)i, and Note 21 Derivative financial instruments.
2.In 2022, corresponds to expenses incurred by dLocal in relation to a secondary offering of its shares occurred in 2021.
3.Includes non-recurring costs related to an internal review of the allegations made by a short-seller report, including fees from independent counsel, independent global expert services and forensic accounting advisory firm.
The Group’s revenue, results and assets for this one reportable segment can be determined by reference to the Consolidated Condensed Statement of Comprehensive Income and Consolidated Condensed Statement of Financial Position.
As required by IFRS 8 Operating Segments, below are presented applicable entity-wide disclosures related to dLocal’s revenues.
Revenue breakdown by region
The Group’s revenues arise from operations in 40 countries, where the merchants´ customers are based.
The table below shows the revenue breakdown based on the region where the payments from/to the merchant customers are processed in countries for which Revenue represented at least 10% of Total Revenues during the preceding four quarters (including countries below the 10% threshold previously disclosed and that Management elects continue with the disclosure):
|
|
|
|
|
|
|
|
|
|
|
|
|
|
|
Nine months ended |
|
Three months ended |
|
|
September 30, 2023 |
|
September 30, 2022 |
|
YoY% |
|
September 30, 2023 |
|
September 30, 2022 |
|
YoY% |
LatAm |
|
361,159 |
|
252,507 |
|
43.0% |
|
136,044 |
|
87,329 |
|
55.8% |
Brazil |
|
108,754 |
|
60,606 |
|
79.4% |
|
44,724 |
|
21,811 |
|
105.1% |
Mexico |
|
81,254 |
|
45,554 |
|
78.4% |
|
30,245 |
|
16,626 |
|
81.9% |
Argentina |
|
64,588 |
|
63,359 |
|
1.9% |
|
23,856 |
|
19,120 |
|
24.8% |
Chile |
|
40,815 |
|
38,556 |
|
5.9% |
|
12,430 |
|
13,735 |
|
(9.5)% |
Other countries |
|
65,748 |
|
44,432 |
|
48.0% |
|
24,789 |
|
16,037 |
|
54.6% |
Asia and Africa |
|
101,187 |
|
47,990 |
|
110.9% |
|
27,877 |
|
24,535 |
|
13.6% |
Nigeria |
|
55,614 |
|
19,652 |
|
183.0% |
|
8,321 |
|
13,586 |
|
(38.8)% |
Other countries |
|
45,573 |
|
28,338 |
|
60.8% |
|
19,556 |
|
10,949 |
|
78.6% |
Revenues |
|
462,346 |
|
300,497 |
|
53.9% |
|
163,921 |
|
111,864 |
|
46.5% |
Revenue with large customers
During the nine months ended September 30, 2023 the Group operated with more than 600 merchants (more than 600 merchants in the nine months ended September 30, 2022).
For the nine months ended September 30, 2023, the Group’s revenue from its top 10 merchants represented 58% of revenue (52% of revenue for the nine months ended September 30, 2022). For the nine months ended September 30, 2023 there is one customer (no customers for the nine months ended September 30, 2022) that on an individual level accounted for more than 10% of the total revenue.
Non current assets by country
The Company does not have any non-current assets located in the entity´s country of domicile.
Material non-current assets are the Intangible Assets described in Note 18: Intangible Assets.
6. Revenues and Cost of Services
(a) Revenue and Gross profit description
dLocal derives revenue from processing payments for international merchants to enable them to operate in selected emerging markets.
The breakdown of revenue from contracts with customers per type of service is as follows:
|
|
|
|
|
|
|
|
|
|
|
Nine months ended |
|
Three months ended |
|
|
September 30, 2023 |
|
September 30, 2022 |
|
September 30, 2023 |
|
September 30, 2022 |
Transaction revenues (i) |
|
453,856 |
|
298,112 |
|
159,651 |
|
110,831 |
Other revenues (ii) |
|
8,490 |
|
2,385 |
|
4,270 |
|
1,033 |
Revenues from payment processing (iii) |
|
462,346 |
|
300,497 |
|
163,921 |
|
111,864 |
Cost of services |
|
(255,206) |
|
(153,432) |
|
(89,378) |
|
(57,992) |
Gross profit |
|
207,140 |
|
147,065 |
|
74,543 |
|
53,872 |
(i)Transaction revenues are comprised of processing fees, foreign exchange fee, installment fee, chargebacks, refunds fee, and other transactional fees. These fees are recognized as revenue at a point in time when a payment transaction, or its reversal in the case of chargeback and refunds, has been processed.
(ii)Other revenues are mainly comprised of minor fees, such as initial setup fees, smart defense fees, issuing fees, maintenance fees, minimum monthly fees, and small transfer fees.
(iii)For the nine months ended September 30, 2022 revenues include an amortization charge of USD 457 related to prepaid assets. For the three months ended September 30, 2022 revenues include an amortization charge of USD 246, related to prepaid assets. There is not amortization charge for the nine months ended September 30, 2023.
As described in note 2.14 to the Annual Consolidated Financial Statements for the year ended December 31, 2022, the Group previously presented its revenue from installments, chargebacks, refunds and invoice processing fees as “Other revenues”. However, management considers it to be more relevant if all revenues that are driven by payments processed volumes are presented in one separate line item as “Transaction revenues”. Prior year comparatives as of September 30, 2022 have been restated by reclassifying USD 19,341 from “Other revenue” to “Transaction revenues”.
(b) Revenue recognized at a point in time and over time
Transaction revenues are recognized at a point in time when the payment transaction, or its reversal in the case of chargeback and refunds, is processed. Other revenues are recognized as revenue at a point in time when the respective performance obligation is satisfied. The Group did not recognize revenues over time for the nine months ended September 30, 2023 and 2022.
(c) Cost of services
Cost of services are composed of the following:
|
|
|
|
|
|
|
|
|
|
|
Nine months ended |
|
Three months ended |
|
|
September 30, 2023 |
|
September 30, 2022 |
|
September 30, 2023 |
|
September 30, 2022 |
Processing costs (i) |
|
243,297 |
|
146,190 |
|
85,048 |
|
55,280 |
Hosting expenses (ii) |
|
4,382 |
|
3,008 |
|
1,361 |
|
1,053 |
Salaries and wages (iii) |
|
1,542 |
|
998 |
|
603 |
|
390 |
Amortization of intangible assets (iv) |
|
5,985 |
|
3,236 |
|
2,366 |
|
1,269 |
Cost of services |
|
255,206 |
|
153,432 |
|
89,378 |
|
57,992 |
(i)Mainly corresponds to fees that financial institutions (banks, local acquirers or payment methods) charge the Group, which are typically a percentage of the transaction value but in some instances, it also could be a fixed fee mostly in the case of payouts and are related to payment processing, cash advances, and installment payments. It varies from one institution to another and usually depends on the settlement period contracted with each such institution, the payment method used and the type of product (whether it is a payin or a payout). It also includes conversion and expatriation or repatriation costs, charged by banks and brokers. For the nine months ended September 30, 2023, the amount includes USD 389 of foreign exchange gain (after considering gains from hedges of USD 15,573) on the processed volume between the processing date and the expatriation or repatriation of funds date (a loss of USD 950 for the nine months ended September 30, 2022). For the three months ended September 30, 2023, the amount includes USD 647 of foreign exchange gain (after considering gains from hedges of USD 9,956) on the processed volume between the processing date and the expatriation or repatriation of funds date (a loss of USD 386 for the three months ended September 30, 2022).
(ii)Expenses related to hosting services for the Group’s payment platform.
(iii)Consist of salaries and wages of the operations department directly involved in the day-to-day operations. For further detail refer to Note 9: Employee Benefits.
(iv)Amortization of intangible assets corresponds to the amortization of the internally generated software (i.e., dLocal’s payment platform) by the Group. For further detail refer to Note 18: Intangible Assets.
7. Technology and development expenses
Technology and development expenses are composed of the following:
|
|
|
|
|
|
|
|
|
|
|
Nine months ended |
|
Three months ended |
|
|
September 30, 2023 |
|
September 30, 2022 |
|
September 30, 2023 |
|
September 30, 2022 |
Salaries and wages (i) |
|
4,067 |
|
2,351 |
|
1,836 |
|
682 |
Software licenses (ii) |
|
2,208 |
|
866 |
|
874 |
|
419 |
Infrastructure expenses (iii) |
|
1,749 |
|
1,063 |
|
764 |
|
341 |
Information and technology security expenses (iv) |
|
234 |
|
261 |
|
104 |
|
185 |
Other technology expenses |
|
368 |
|
200 |
|
118 |
|
65 |
Total Technology and development expenses |
|
8,626 |
|
4,741 |
|
3,696 |
|
1,692 |
(i)Consist primarily of FTEs compensation related to technology related roles, excluding the capitalized salaries and wages related to internally generated software. For further detail on total salaries and wages refer to Note 9: Employee Benefits
(ii)Consist of software licenses used by the technology development department for the development and maintenance of the platform.
(iii)Corresponds to information technology costs to support our infrastructure and back-office operations.
(iv)Comprises expenses of overall monitoring and security of our network and platform.
8. Sales and marketing expenses and General and administrative expenses
Sales and marketing expenses and General and administrative expenses are composed of the following:
|
|
|
|
|
|
|
|
|
|
|
Nine months ended |
|
Three months ended |
Sales and marketing expenses |
|
September 30, 2023 |
|
September 30, 2022 |
|
September 30, 2023 |
|
September 30, 2022 |
Salaries and wages (i) |
|
9,549 |
|
7,618 |
|
3,580 |
|
3,026 |
Marketing expenses (ii) |
|
2,861 |
|
1,826 |
|
867 |
|
446 |
Total Sales and marketing expenses |
|
12,410 |
|
9,444 |
|
4,447 |
|
3,472 |
|
|
|
|
|
|
|
|
|
General and administrative expenses |
|
September 30, 2023 |
|
September 30, 2022 |
|
September 30, 2023 |
|
September 30, 2022 |
Salaries and wages (iii) |
|
24,461 |
|
16,058 |
|
8,934 |
|
5,813 |
Third-party services (iv) |
|
13,640 |
|
7,010 |
|
4,618 |
|
2,852 |
Office expenses (v) |
|
3,033 |
|
2,214 |
|
1,093 |
|
879 |
Travel and other operating expenses |
|
6,156 |
|
3,136 |
|
1,862 |
|
1,098 |
Amortization and depreciation (vi) |
|
2,636 |
|
2,454 |
|
871 |
|
841 |
Total General and administrative expenses |
|
49,926 |
|
30,872 |
|
17,378 |
|
11,483 |
(i)Salaries and wages related to Full Time Equivalents (“FTE”) engaged in the Sales and marketing department of the Group. For further detail on total salaries and wages refer to Note 9: Employee Benefits.
(ii)Expenses related to trade marketing at events, the distribution and production of marketing and advertising campaigns mostly related to public relations expenses, commissions to third-party sales force and partners, and online performance marketing.
(iii)Salaries and wages related to administrative FTEs. For further detail on total salaries and wages refer to Note 9: Employee Benefits.
(iv)This includes Advisors’ fees, Legal fees, Auditors’ fees and Human resources’ fees. Third-party services, for the nine months ended September 30, 2023, also include USD 1,229 of non-recurring costs related to an internal review of the allegations made by a short-seller report, including fees from independent counsel, independent global expert services and forensic accounting advisory firm.
(v)Consist of office rent and related expenses.
(vi)Corresponds to amortization of right-of-use assets, intangible assets and depreciation of property, plant and equipment. For further detail on total amortization and depreciation charges refer to Note 10: Amortization and Depreciation.
9. Employee Benefits
As of September 30, 2023, the Group’s FTEs were 867 (632 as of September 30, 2022) where 31% corresponded to information technology and product engineers and related roles (35% as of September 30, 2022).
Employee benefits is composed of the following:
|
|
|
|
|
|
|
|
|
|
|
Nine months ended |
|
Three months ended |
|
|
September 30, 2023 |
|
September 30, 2022 |
|
September 30, 2023 |
|
September 30, 2022 |
Salaries, wages and contractor fees (i) |
|
44,888 |
|
29,857 |
|
15,827 |
|
11,102 |
Share-based payments (ii) |
|
7,072 |
|
4,874 |
|
3,322 |
|
1,599 |
Total employee benefits |
|
51,960 |
|
34,731 |
|
19,149 |
|
12,701 |
(i)Salaries, wages and contractor fees include social security costs as well as annual bonuses compensations. This line also includes USD 12,341 for the nine months ended September 30, 2023 (USD 7,706 for the nine months ended September 30, 2022) related to capitalized salaries and wages and USD 4,196 for the three months ended September 30, 2023 (USD 2,790 for the three months ended September 30, 2022) related to capitalized salaries and wages.
(ii)The share-based payments relate to equity-settled compensation expenses, net of forfeitures if any. For further information refer to Note 2.2: Share-based payments.
10. Amortization and Depreciation
Amortization and depreciation expenses are composed of the following:
|
|
|
|
|
|
|
|
|
|
|
Nine months ended |
|
Three months ended |
|
|
September 30, 2023 |
|
September 30, 2022 |
|
September 30, 2023 |
|
September 30, 2022 |
Amortization of intangible assets |
|
7,565 |
|
4,809 |
|
2,897 |
|
1,793 |
Right-of-use asset amortization |
|
430 |
|
351 |
|
121 |
|
128 |
Depreciation of Property, plant & equipment |
|
626 |
|
530 |
|
219 |
|
189 |
Total Amortization and Depreciation |
|
8,621 |
|
5,690 |
|
3,237 |
|
2,110 |
For further information related to amortization of intangible assets refer to Note 18: Intangible Assets.
11. Other Results
Other results is composed of the following categories:
|
|
|
|
|
|
|
|
|
|
|
Nine months ended |
|
Three months ended |
|
|
September 30, 2023 |
|
September 30, 2022 |
|
September 30, 2023 |
|
September 30, 2022 |
Interest Income from Financial Instruments (i) |
|
42,429 |
|
12,371 |
|
20,217 |
|
6,835 |
Fair value gains of financial assets at FVPL (i) |
|
27,886 |
|
(25) |
|
24,232 |
|
(25) |
Finance income |
|
70,315 |
|
12,346 |
|
44,449 |
|
6,810 |
|
|
|
|
|
|
|
|
|
|
|
Nine months ended |
|
Three months ended |
|
|
September 30, 2023 |
|
September 30, 2022 |
|
September 30, 2023 |
|
September 30, 2022 |
Finance expense related to derivative financial instruments (ii) |
|
(22,485) |
|
(12,467) |
|
(10,848) |
|
(7,694) |
Other finance expenses (iii) |
|
(36,964) |
|
(3,265) |
|
(31,680) |
|
(1,640) |
Interest charges for lease liabilities (iv) |
|
(468) |
|
(133) |
|
(373) |
|
45 |
Finance costs |
|
(59,917) |
|
(15,865) |
|
(42,901) |
|
(9,289) |
Inflation adjustment (v) |
|
(6,497) |
|
(905) |
|
(3,817) |
|
(127) |
Other results |
|
3,901 |
|
(4,424) |
|
(2,269) |
|
(2,606) |
(i)Corresponds to interests on bank accounts and fair value gains from short -term liquid financial instruments and financial assets measured at fair value through profit and loss.
(ii)Corresponds to the implicit interest rate included in the derivative financial instruments. The implicit interest rate are not designated as hedging instruments. The Group has elected to separate the spot element from the forward element of the derivative financial instruments and designated as the hedging instrument only the change in the fair value of the spot element, which is included in Costs of Services. The forward element of the derivative financial instruments, which consists of the implicit interest rate, is not designated as a hedging instrument and therefore is presented as Finance costs. For further information refer to Note 21 Derivative financial instruments.
(iii)In 2023, mainly corresponds to foreign exchange loss and other interests. In 2022, it also included interest charges for borrowings.
(iv)Interest charges for lease liabilities correspond to the application of IFRS 16 Leases.
(v)Following IAS 29 requirements, Argentina’s economy is considered hyperinflationary. In this sense, the financial statements of the Argentinian subsidiaries were restated to reflect the purchasing power of the currency and therefore a loss on net monetary position arose.
12. Income Tax
Income tax expense is recognized based on management’s estimate of the weighted average effective annual income tax rate expected for the full financial year. The estimated average income tax rate used for the nine months ended September 30, 2023 is 15.4%, compared to 7.9% for the nine months ended September 30, 2022. The effective income tax rate increase is explained by an increase in the results of subsidiaries located in countries where the income tax rate is higher.
The income tax charge recognized in profit and losses is the following:
|
|
|
|
|
|
|
|
|
|
|
Nine months ended |
|
Three months ended |
Current Income Tax |
|
September 30, 2023 |
|
September 30, 2022 |
|
September 30, 2023 |
|
September 30, 2022 |
Current Income Tax on profits for the period |
|
(15,194) |
|
(8,999) |
|
(3,876) |
|
(2,889) |
Total Current Income Tax expense |
|
(15,194) |
|
(8,999) |
|
(3,876) |
|
(2,889) |
|
|
|
|
|
|
|
|
|
Deferred income tax |
|
September 30, 2023 |
|
September 30, 2022 |
|
September 30, 2023 |
|
September 30, 2022 |
Increase in deferred income tax assets |
|
952 |
|
968 |
|
505 |
|
660 |
(Increase)/decrease in deferred income tax liabilities |
|
(7,710) |
|
380 |
|
(5,526) |
|
(58) |
Total Deferred income tax (expense)/benefit |
|
(6,758) |
|
1,348 |
|
(5,021) |
|
602 |
Income Tax expense |
|
(21,952) |
|
(7,651) |
|
(8,897) |
|
(2,287) |
13. Capital management
(a) Share capital
Authorized shares, as well as issued and fully paid-up shares, are presented below:
|
|
|
|
|
|
|
|
|
|
|
|
September 30, 2023 |
|
September 30, 2022 |
|
|
Amount |
|
USD |
|
Amount |
|
USD |
|
Authorized Shares of USD 0.002 USD each |
|
|
|
|
|
|
|
|
|
Class A common shares |
|
1,000,000,000 |
|
2,000 |
|
1,000,000,000 |
|
2,000 |
|
Class B common shares |
|
250,000,000 |
|
500 |
|
250,000,000 |
|
500 |
|
Undesignated shares |
|
250,000,000 |
|
500 |
|
250,000,000 |
|
500 |
|
|
|
1,500,000,000 |
|
3,000 |
|
1,500,000,000 |
|
3,000 |
|
Issued and Fully Paid Up Shares of USD 0.002 each |
|
|
|
|
|
|
|
|
|
Class A Common Shares |
|
155,503,714 |
|
310 |
|
161,930,899 |
|
324 |
|
Class B Common Shares |
|
134,054,192 |
|
268 |
|
134,054,192 |
|
268 |
|
|
|
289,557,906 |
|
578 |
|
295,985,091 |
|
592 |
|
Share Capital evolution |
|
|
|
|
|
|
|
|
|
Share Capital as at January 1 |
|
296,029,870 |
|
592 |
|
295,028,441 |
|
590 |
|
i) Issue of common shares at USD 0.002 |
|
564,272 |
|
— |
* |
956,650 |
|
2 |
|
ii) Repurchase of shares |
|
(7,036,236) |
|
(14) |
|
— |
|
— |
|
Share capital as of September 30, 2023 |
|
289,557,906 |
|
578 |
|
295,985,091 |
|
592 |
|
* Amounts are rounded to the nearest thousand and should not be interpreted as zero.
The rights of the holders of Class A Common Shares and Class B Common Shares are identical, except with respect to voting, conversion and transfer restrictions applicable to the Class B Common Shares. Each Class A Common Share is entitled to one vote while Class B Common Shares are entitled to five votes each. Each Class B Common Share is convertible into one Class A Common Share automatically upon transfer, subject to certain exceptions. Holders of Class A Common Shares and Class B Common Shares vote together as a single class on all matters unless otherwise required by law.
i)For the nine months ended September 30, 2023 and 2022, dLocal issued 564,272 and 956,650 new Class A Common Shares receiving total proceeds of USD 153 and 3,724, respectively, related to the exercise of share-options.
ii)For the nine months ended September 30, 2023, dLocal repurchased 7,036,236 Class A Common Shares paying USD 97,929 in connection with the Share Buyback Program. Including the repurchases made in 2022, the Company has reached the buyback limit of USD 100,000 and has therefore completed the Share Buyback program.
(b) Capital reserve
The Capital reserve corresponds to reserves related to the share-based plans, as described in Note 2.11: Share-based payments and warrants to the Annual Financial Statements for the year ended December 31, 2022. Accordingly, this reserve is related to share-based payment compensation plans of the Group.
The following table shows a breakdown of the consolidated condensed interim statement of financial position line item ‘Capital Reserves’ and the movements in these reserves during the periods.
|
|
|
|
|
|
|
2023 |
|
2022 |
Balances as of January 1 |
|
16,185 |
|
12,741 |
Share-options exercise (i) |
|
(2,005) |
|
(4,445) |
Share-based payments charges |
|
7,072 |
|
5,594 |
Forfeitures |
|
— |
|
(720) |
Balance as of September 30 |
|
21,252 |
|
13,170 |
(i)During the nine months ended September 30, 2023 and 2022, a total of 564,272 and 956,650 share-options under the share-based payments plan were exercised, respectively. Consequently, the correspondent charge to Capital reserve was recycled into the Share premium line item within equity.
(c) Other Reserves
The reserves for the Group relate to cumulative translation adjustment representing differences on conversion of assets and liabilities at the reporting date.
The following table shows a breakdown of the consolidated statement of financial position line item ‘Other Reserves’ and the movements in these reserves during the periods.
|
|
|
|
|
|
|
2023 |
|
2022 |
|
|
Cumulative Translation Adjustment |
|
Cumulative Translation Adjustment |
Balances as of January 1 |
|
(1,448) |
|
(30) |
Movement of other reserves |
|
(379) |
|
(1,755) |
Balance as of September, 30 |
|
(1,827) |
|
(1,785) |
(d) Retained Earnings
Movements in retained earnings were as follows:
|
|
|
|
|
|
|
2023 |
|
2022 |
Balance as at January 1 |
|
219,993 |
|
109,867 |
Comprehensive income for the period |
|
122,171 |
|
90,593 |
Balance as of September, 30 |
|
342,164 |
|
200,460 |
(e) Earnings per share
dLocal calculates basic earnings per share by dividing the profit attributable to equity holders by the weighted average number of common shares issued and outstanding during the nine months ended September 30, 2023 and 2022.
For diluted earnings per share is calculated by dividing the profit attributable to equity holders of dLocal by the weighted average number of common shares outstanding during the period plus the weighted average number of common shares that would be issued on conversion of all dilutive potential common shares into common shares.
The next table presents the information used as base for such calculation:
|
|
|
|
|
|
|
|
|
|
|
Nine months ended |
|
Three months ended |
|
|
September 30, 2023 |
|
September 30, 2022 |
|
September 30, 2023 |
|
September 30, 2022 |
Profit attributable to common shareholders (U.S. Dollars) |
|
120,449,000 |
|
89,326,000 |
|
40,308,000 |
|
32,462,000 |
Weighted average number of common shares |
|
292,058,528 |
|
295,455,429 |
|
289,411,641 |
|
295,918,751 |
Adjustments for calculation of diluted earnings per share(1) |
|
16,509,161 |
|
17,783,776 |
|
16,620,498 |
|
17,246,606 |
Weighted average number of common shares for calculating diluted earnings per share |
|
308,567,689 |
|
313,239,205 |
|
306,032,139 |
|
313,165,357 |
Basic earnings per share |
|
0.41 |
|
0.30 |
|
0.14 |
|
0.11 |
Diluted earnings per share |
|
0.39 |
|
0.29 |
|
0.13 |
|
0.10 |
1 For the nine months ended September 30, 2023, the adjustment corresponds to the dilutive effect of i) 14,644,675 average shares related to share-based payment warrants described in Note 2.11: Share-based payments and warrants to the Annual Financial Statements for the year ended December 31, 2022; and ii) 1,864,486 average shares related to share-based payment plans with employees (14,896,831 and 2,886,945 respectively for the nine months ended September 30, 2022). For the three months ended September 30, 2023, the adjustment corresponds to the dilutive effect of i) 14,699,513 average shares related to share-based payment warrants; and ii) 1,920,985 average shares related to share-based payment plans with employees (14,887,078 and 2,359,528 respectively for the three months ended September 30, 2022).
14. Cash and cash equivalents
Cash and cash equivalents breakdown is presented below:
|
|
|
|
|
|
|
September 30, 2023 |
|
December 31, 2022 |
Own Balances |
|
191,755 |
|
247,833 |
Merchant Clients Funds |
|
306,410 |
|
220,259 |
|
|
498,165 |
|
468,092 |
As of September 30, 2023, USD 498,165 (USD 468,092 on December 31, 2022) represents cash on hand, demand deposits with financial institutions and other short-term liquid financial instruments.
Own Balances correspond to cash and cash equivalents of the Group while Merchant Clients Funds correspond to freely available funds collected from the merchants’ customers, that can be invested in secure, liquid low-risk assets until they are transferred to the merchants in accordance with the agreed conditions with them or transferred to Own Funds accounts for the portion that corresponds to the Group fees. As of September 30, 2023 , Merchant Clients Funds includes USD 53,991 pending to be transferred to Own Funds accounts (USD 38,119 as of December 31, 2022).
15. Financial assets at fair value through profit or loss
(a)Classification of financial assets at fair value through profit or loss
Financial assets at fair value through profit or loss include the following:
|
|
|
|
|
|
|
September 30, 2023 |
|
December 31, 2022 |
Bonds issued by the Treasury Department of Argentina (TV24) |
|
99,874 |
|
— |
Other debt instruments |
|
4,046 |
|
1,295 |
|
|
103,920 |
|
1,295 |
For 2023 and 2022, financial assets at fair value through profit or loss are investments in quoted debt securities. The increase mainly corresponds to the acquisition of locally issued Argentinian federal government bonds which are U.S. Dollar linked during June and July 2023. These bonds are U.S. dollar linked with a coupon rate of 0.4% and a maturity date of April 2024.
For further information referred to accounting policies see Note 2.5 Financial instruments-initial recognition and subsequent measurement to the Annual Consolidated Financial Statements for the year ended December 31, 2022, and related to fair value hierarchies see Note 24: Fair value hierarchy.
(b)Amounts recognized in profit or loss
During the period, the following gains were recognized in profit and loss:
|
|
|
|
|
|
|
|
|
|
|
Nine months ended |
|
Three months ended |
|
|
September 30, 2023 |
|
September 30, 2022 |
|
September 30, 2023 |
|
September 30, 2022 |
Fair Value Movement in profit and loss |
|
27,886 |
|
(25) |
|
24,232 |
|
(25) |
|
|
27,886 |
|
(25) |
|
24,232 |
|
(25) |
As at September 30, 2023, the Group had an investment in quoted debt securities and bonds issued by the Treasury Department of Argentina. Of the financial assets at fair value through profit or loss balance at the end of the year, USD 99,874 are bonds issued by the Treasury department of Argentina (TV24). Apart from this, the Group does not have concentrated risk exposure to any single geography or market having similar characteristics. Concentration of risk related to these bonds did not exceed 20 per cent of gross monetary assets at any time during the period. The concentration of risk is limited due to the fact that the Group has established limits to the investments in bonds issued by the Treasury department of Argentina.
16. Trade and other receivables
Trade and Other Receivables of the Group are composed of the following:
|
|
|
|
|
|
|
September 30, 2023 |
|
December 31, 2022 |
Trade receivables |
|
269,309 |
|
218,922 |
Loss allowance |
|
(170) |
|
(280) |
Trade receivables net |
|
269,139 |
|
218,642 |
Advances and other receivables |
|
43,367 |
|
21,804 |
|
|
312,506 |
|
240,446 |
Trade Receivables correspond to uncollateralized gross amounts due from acquirers, processors, merchants and preferred suppliers for services performed that will be collected in less than one year, so they are classified as current. No financial assets are past-due and all Trade and other receivables are categorized as within “normal” credit risk rating.
Loss allowance and impairment losses
The following table presents the evolution of the loss allowance:
|
|
|
|
|
|
|
2023 |
|
2022 |
Opening book value as at January 1 |
|
(280) |
|
(322) |
Decrease in loss allowance for trade receivables |
|
(29) |
|
106 |
Write-off |
|
139 |
|
— |
Total as at September 30 |
|
(170) |
|
(216) |
Net impairment gain on financial assets |
|
(31) |
|
106 |
Initial recognition and subsequent measurement the Group applies the simplified approach to determine expected credit losses on trade receivables.
To measure the expected credit losses, trade and other receivables have been grouped based on shared credit risk characteristics and the days past due (only 0-30 past due bucket as of September 30, 2023 and December 31, 2022 because there are no other material buckets of the outstanding receivables).
The expected loss rates are based on the payment profiles of debtors over a period of 48 months before year end and the corresponding historical credit losses experienced within this period. The historical loss rate is adjusted to reflect current and forward-looking information on credit risk ratings of the countries in which the Group sells its services which affects the ability of the debtors to settle the receivables. On that basis, the average expected credit loss rate of the 0-30 past due bucket was determined at 0.1% for the nine months ended September 30, 2023 (0.2% in the nine months ended September 30, 2022).
17. Other Assets
Other assets are composed of the following:
|
|
|
|
|
Current |
|
September 30, 2023 |
|
December 31, 2022 |
Money held in escrow and guarantees due to: (i) |
|
24,924 |
|
43,814 |
-Stand by credit letters required by merchants |
|
13,000 |
|
18,575 |
-Banks requirements |
|
6,907 |
|
19,988 |
-Processors and others requirements |
|
1,454 |
|
1,688 |
-Credit card requirements |
|
3,563 |
|
3,563 |
Advance payments to merchants |
|
0 |
|
12,863 |
Rental guarantees |
|
116 |
|
112 |
Deposits in brokers (ii) |
|
5,576 |
|
5,576 |
Loss allowance |
|
(3,067) |
|
(5,576) |
Total current Other Assets |
|
27,549 |
|
56,789 |
|
|
|
|
|
(i)Comprises own funds and investments held in escrow in banks and guarantees required by processors, credit cards and merchants. In 2022 and 2023, some Merchants entered into stand by credit letters with banks that required the Group to maintain certain collaterals in such banks. In addition, it also includes money held in a pledge bank account to collateralize overdrafts and pre-settlements agreements with a bank. Finally, it also includes guarantees issued to processors and credit cards institutions. These agreements have short-term maturities.
(ii)During 2022, the Company utilized FTX Trading Ltd. (“FTX”) services for the repatriation of funds from one country. On November 11, 2022, when FTX filed for Chapter 11 bankruptcy in the United States, the Company had deposits of USD 5,576, whose withdrawals had not been processed by FTX. Such deposits were included in the loss allowance. As of September 30, 2023 and December 31, 2022, the Group does not hold any positions in crypto assets.” During the three months ending September 2023, the Group reassessed the recovery probability of its deposits based on negotiations with third parties that are willing to acquire them and publicly available information. Thus, the Group recognized a gain of USD 2,509 as result of the reversion of the loss allowance for the period ending September 30, 2023.
18. Intangible Assets
Intangible assets of the Group correspond to acquired software, capitalized expenses related to internally generated software and acquired merchant agreements, and are stated at cost less accumulated amortization.
|
|
|
|
|
|
|
|
|
|
|
|
|
|
|
2023 |
|
2022 |
|
|
Internally generated software |
|
Acquired intangible assets |
|
Total |
|
Internally generated software |
|
Acquired intangible assets (ii) |
|
Total |
Cost |
|
23,752 |
|
39,335 |
|
63,087 |
|
12,387 |
|
39,335 |
|
51,722 |
Accumulated amortization |
|
(7,972) |
|
(3,672) |
|
(11,644) |
|
(3,179) |
|
(1,574) |
|
(4,753) |
Opening book value as at January 1 |
|
15,780 |
|
35,663 |
|
51,443 |
|
9,208 |
|
37,761 |
|
46,969 |
Additions (i) |
|
12,341 |
|
162 |
|
12,503 |
|
7,715 |
|
— |
|
7,715 |
Amortization of the period |
|
(5,985) |
|
(1,580) |
|
(7,565) |
|
(3,236) |
|
(1,573) |
|
(4,809) |
Total as at September 30 |
|
22,136 |
|
34,245 |
|
56,381 |
|
13,687 |
|
36,188 |
|
49,875 |
Cost |
|
36,093 |
|
39,497 |
|
75,590 |
|
20,102 |
|
39,335 |
|
59,437 |
Accumulated amortization |
|
(13,957) |
|
(5,252) |
|
(19,209) |
|
(6,415) |
|
(3,147) |
|
(9,562) |
(i) The additions of the nine months ended September 30, 2023 include USD 12,341 related to capitalized salaries and wages (USD 7,706 as of September 30, 2022).
|
|
|
|
|
|
|
As of September 30, 2023 |
|
As of December 31, 2022 |
Cost |
|
75,590 |
|
63,087 |
Accumulated amortization |
|
(19,209) |
|
(11,644) |
Net book amount |
|
56,381 |
|
51,443 |
As of September 30, 2023 , and December 31, 2022 no indicator of impairment related to intangible assets existed, so the Group did not perform an impairment test.
19. Trade and other payables
Trade and Other Payables are composed of the following:
|
|
|
|
|
|
|
September 30, 2023 |
|
December 31, 2022 |
Trade Payables |
|
520,285 |
|
395,134 |
Accrued Liabilities |
|
9,202 |
|
5,801 |
Other Payables |
|
20,352 |
|
6,939 |
Total Trade and other payables |
|
549,839 |
|
407,874 |
These payables are classified as current liabilities as the payment is due within one year or less. Moreover, the carrying amounts are considered to be the same as fair values, due to their short – term nature.
Trade Payables correspond to liabilities with Merchants, either related to payin transactions processed or payout transactions to be processed at their request. Accrued Liabilities mainly correspond to obligations with legal and tax advisors, and auditors. Other Payables mainly correspond to obligations related to processors´ costs and the acquisitions of office goods and services necessary for the ordinary course of the business.
20. Tax Liabilities
The tax liabilities breakdown is as follows:
|
|
|
|
|
|
|
September 30, 2023 |
|
December 31, 2022 |
Income tax payable |
|
12,762 |
|
6,047 |
Other tax liabilities |
|
1,273 |
|
5,648 |
Income tax perception |
|
730 |
|
2,792 |
Digital services withholding VAT |
|
492 |
|
2,555 |
Other Taxes |
|
51 |
|
301 |
Total Tax Liabilities |
|
14,035 |
|
11,695 |
21. Derivative financial instruments
Derivative financial instruments: forward agreements
During the nine months ended September 30, 2023 and the year-ended December 31, 2022, dLocal entered into short-term derivative contracts (delivery and non-delivery forwards) with different counterparties in different countries in which the Group operates, according to the following detail:
|
|
|
|
|
|
|
|
|
|
|
|
|
Transaction |
|
Type of Forward Transaction |
|
Local currency |
|
Outstanding notional amount in USD as of September 30, 2023 |
|
Outstanding balance as of September 30, 2023 - Derivative financial assets / (liabilities) |
|
Outstanding notional amount in USD as of December 31, 2022 |
|
Outstanding balance as of December 31, 2022 - Derivative financial liabilities |
Non-delivery forwards |
|
Buy USD |
|
Brazilian Reais |
|
5,889,258 |
|
176 |
|
22,436,774 |
|
122 |
Non-delivery forwards |
|
Sell USD (1) |
|
Brazilian Reais |
|
(257,783) |
|
1 |
|
(959,141) |
|
(15) |
Non-delivery forwards |
|
Buy USD |
|
Argentine Peso |
|
19,700,000 |
|
(395) |
|
6,600,000 |
|
(6) |
Delivery forwards |
|
Buy USD |
|
Chilean Peso |
|
10,552,010 |
|
(98) |
|
18,750,385 |
|
(250) |
Delivery forwards |
|
Buy USD |
|
Uruguayan Peso |
|
2,625,875 |
|
6 |
|
2,240,602 |
|
48 |
Non-delivery forwards |
|
Buy USD |
|
Egyptian Pound |
|
12,376,278 |
|
(348) |
|
12,979,395 |
|
1,002 |
Non-delivery forwards |
|
Buy EUR |
|
Moroccan Dirham |
|
9,543,572 |
|
(61) |
|
6,834,496 |
|
31 |
Non-delivery forwards |
|
Sell EUR |
|
Moroccan Dirham |
|
(1,972,709) |
|
— |
|
— |
|
— |
Non-delivery forwards (1) |
|
Buy EUR |
|
US Dollar |
|
31,069,051 |
|
(323) |
|
— |
|
— |
Non-delivery forwards (1) |
|
Sell EUR |
|
US Dollar |
|
(25,055,300) |
|
140 |
|
— |
|
— |
Non-delivery forwards |
|
Buy USD |
|
Nigerian naira |
|
— |
|
— |
|
8,863,831 |
|
(15) |
Non-delivery forwards |
|
Buy USD |
|
Indian Rupee |
|
1,908,572 |
|
(3) |
|
5,920,282 |
|
2 |
Non-delivery forwards |
|
Sell USD (1) |
|
Indian Rupee |
|
— |
|
— |
|
(566,948) |
|
1 |
Non-delivery forwards |
|
Buy USD |
|
South African Rand |
|
4,194,747 |
|
(41) |
|
5,176,642 |
|
(235) |
Non-delivery forwards |
|
Sell USD (1) |
|
South African Rand |
|
(1,914,799) |
|
18 |
|
(2,626,458) |
|
(11) |
Non-delivery forwards |
|
Buy USD |
|
Peruvian Sol |
|
1,200,000 |
|
(64) |
|
— |
|
— |
Non-delivery forwards |
|
Sell USD |
|
Peruvian Sol |
|
(1,251,563) |
|
12 |
|
— |
|
— |
Non-delivery forwards |
|
Buy USD |
|
Vietnamese Dong |
|
1,580,888 |
|
(2) |
|
— |
|
— |
Non-delivery forwards |
|
Buy USD |
|
Costa Rican Colon |
|
159,000 |
|
(35) |
|
159,000 |
|
(12) |
Non-delivery forwards |
|
Sell USD |
|
Costa Rican Colon |
|
(196,369) |
|
(3) |
|
— |
|
— |
Total |
|
|
|
|
|
|
|
(1,020) |
|
|
|
662 |
(1)The contracts to sell USD are entered into with the purpose of rebalancing and maintaining a hedge ratio that complies with the hedge effectiveness requirements.
Hedge accounting
During the nine months ended September 30, 2023, dLocal entered into hedge operations of trade and other receivables in Brazilian Reais, Argentine Peso, Chilean Peso, Uruguayan Peso, Egyptian Pound, Moroccan Dirham, Nigerian Naira, Indian Rupee, South African Rand, and Vietnamese Dong subject to foreign exchange exposure using delivery and non-delivery forward contracts (Brazilian Reais, Argentine Peso, Chilean Peso, Uruguayan Peso, Egyptian
Pound, Nigerian Naira, Indian Rupee, and South African Rand during the nine months ended September 30, 2022). The transactions have been elected for hedge accounting and classified as fair value hedge in accordance with IFRS 9. The Group has elected to designate only the spot element of these forward contracts as the hedging instrument (except in hedges of Uruguayan Peso and Chilean Peso during the nine months ended September 30, 2022). During the nine months ended September 30, 2023, dLocal recognized a net gain of USD 15,573 (net gain of USD 11,071 for the nine months ended September 30, 2022) included in the line item "Costs of services" related to the effective portion of the change in the spot rate of the hedged currency (which offsets a foreign exchange loss of USD 15,962 included in the same line item) and a net loss of USD 22,485 included in the line item "Finance costs" related to the implicit interest rate (net loss of USD 11,912 for the nine months ended September 30, 2022). For the three months ended September 30, 2023, dLocal recognized a net gain of USD 9,956 included in the line item "Costs of services" and a net loss of USD 10,848 included in the line item "Finance costs" (a net gain of USD 6,856 and a net loss of USD 7,691, respectively, for the three months ended September 30, 2022).
During the year ended December 31, 2022, dLocal entered into hedge operations of trade and other receivables in Brazilian Reais, Argentine Peso, Chilean Peso, Uruguayan Peso, Egyptian Pound, Moroccan, Dirham, Nigerian Naira, Indian Rupee, South African Rand and Costa Rica Colon, subject to foreign exchange exposure using delivery and non-delivery forward contracts. The spot element of these forward transactions was elected for hedge accounting and classified as fair value hedge in accordance with IFRS 9. The Group has elected to designate only the spot element of these forward contracts as the hedging instrument, except for hedges of Uruguayan Peso and Chilean Peso. During the year ended December 31, 2022, dLocal recognized a net gain of USD 14,559 included in the line item "Costs of services" related to the effective portion of the change in the spot rate of the hedged currency (which offsets a foreign exchange loss of USD 14,832 included in the same line item) and a net loss of USD 18,763 included in the line item "Finance costs" related to the implicit interest rate.
22. Provisions
(a) Current or potential proceedings
Provisions for the period are related to current or potential proceedings where the management understands, based on the Group’s legal advisors’ assessment, that it is more likely than not that an outflow of resources will be required to settle the obligation and a reliable estimate can be made of the amount of the obligation.
(b) Movements in current or potential proceedings
Movements in current or potential proceedings are set out below:
|
|
|
|
|
|
|
2023 |
|
2022 |
Carrying amount as at January 1 |
|
1,473 |
|
1,710 |
Reversal to labor provision |
|
(871) |
|
(296) |
Interest charges for labor provision |
|
35 |
|
126 |
Total carrying amount at September 30 |
|
637 |
|
1,540 |
23. Related parties
(a) Key Management compensation
The compensation of the Executive Team during the period can be analyzed as follows:
|
|
|
|
|
|
|
|
|
|
|
Nine months ended |
|
Three months ended |
|
|
September 30, 2023 |
|
September 30, 2022 |
|
September 30, 2023 |
|
September 30, 2022 |
Short-term employee benefits – Salaries and wages |
|
1,580 |
|
2,806 |
|
601 |
|
280 |
Long-term employee benefits – Share-based payment |
|
3,393 |
|
4,874 |
|
1,946 |
|
1,599 |
|
|
4,973 |
|
7,680 |
|
2,547 |
|
1,879 |
(b) Transactions with other related parties
The following transactions occurred with related parties:
|
|
|
|
|
|
|
|
|
|
|
Nine months ended |
|
Three months ended |
|
|
September 30, 2023 |
|
September 30, 2022 |
|
September 30, 2023 |
|
September 30, 2022 |
Transactions with merchants – Revenues |
|
1,309 |
|
— |
|
266 |
|
(8) |
Transactions with preferred suppliers (Collection agents) – Costs |
|
(35) |
|
(581) |
|
(25) |
|
(408) |
(c) Outstanding balances arising from transactions with other related parties
The following balances are outstanding at the end of the reporting period in relation to transactions with related parties:
|
|
|
|
|
|
|
September 30, 2023 |
|
December 31, 2022 |
Transactions with merchants – trade receivables |
|
476 |
|
428 |
Transactions with merchants – trade payables |
|
— |
|
(482) |
Transactions with preferred suppliers (Collection agents) – trade payables |
|
(6) |
|
(1,258) |
Transactions with preferred suppliers (Collection agents) – trade receivables |
|
0 |
|
552 |
Outstanding balances are unsecured and are repayable in cash.
24. Fair value hierarchy
The following tables show financial instruments recognized at fair value for the period ended September 30, 2023 and December 31, 2022, analyzed between those whose fair value is based on:
• Level 1: quoted (unadjusted) prices in active markets for identical assets or liabilities.
• Level 2: other techniques for which all inputs which have a significant effect on the recorded fair value are observable, either directly or indirectly.
• Level 3: techniques which use inputs which have a significant effect on the recorded fair value that are not based upon observable market data.
The table also includes financial instruments measured at amortized cost. The Group understands that the book value of such instruments approximates their fair value.
|
|
|
|
|
|
|
|
|
|
|
|
|
September 30, 2023 |
|
FVPL |
|
Amortized
cost |
|
Total |
|
Level 1 |
|
Level 2 |
|
Level 3 |
Assets |
|
|
|
|
|
|
|
|
|
|
|
|
Financial Assets at Fair Value through Profit or Loss |
|
103,920 |
|
— |
|
103,920 |
|
103,920 |
|
— |
|
— |
Other Assets |
|
— |
|
27,549 |
|
27,549 |
|
— |
|
— |
|
— |
Trade and Other Receivables |
|
— |
|
312,506 |
|
312,506 |
|
— |
|
— |
|
— |
Derivative financial instruments |
|
353 |
|
— |
|
353 |
|
— |
|
353 |
|
— |
Cash and Cash Equivalents |
|
— |
|
498,165 |
|
498,165 |
|
— |
|
— |
|
— |
|
|
104,273 |
|
838,220 |
|
942,493 |
|
103,920 |
|
353 |
|
— |
|
|
|
|
|
|
|
|
|
|
|
|
|
December 31, 2022 |
|
FVPL |
|
Amortized
cost |
|
Total |
|
Level 1 |
|
Level 2 |
|
Level 3 |
Assets |
|
|
|
|
|
|
|
|
|
|
|
|
Financial Assets at Fair Value through Profit or Loss |
|
1,295 |
|
— |
|
1,295 |
|
1,295 |
|
— |
|
— |
Other Assets |
|
— |
|
56,789 |
|
56,789 |
|
— |
|
— |
|
— |
Trade and Other Receivables |
|
— |
|
240,446 |
|
240,446 |
|
— |
|
— |
|
— |
Derivative financial instruments (1) |
|
1,206 |
|
— |
|
1,206 |
|
— |
|
1,206 |
|
— |
Cash and Cash Equivalents |
|
— |
|
468,092 |
|
468,092 |
|
— |
|
— |
|
— |
|
|
2,501 |
|
765,327 |
|
767,828 |
|
1,295 |
|
1,206 |
|
— |
|
|
|
|
|
|
|
|
|
|
|
|
|
September 30, 2023 |
|
FVPL |
|
Amortized
cost |
|
Total |
|
Level 1 |
|
Level 2 |
|
Level 3 |
Liabilities |
|
|
|
|
|
|
|
|
|
|
|
|
Trade and Other Payables |
|
— |
|
(549,839) |
|
(549,839) |
|
— |
|
— |
|
— |
Lease liabilities |
|
— |
|
(4,139) |
|
(4,139) |
|
— |
|
— |
|
— |
Derivative financial instruments |
|
(1,373) |
|
— |
|
(1,373) |
|
— |
|
(1,373) |
|
— |
|
|
(1,373) |
|
(553,978) |
|
(555,351) |
|
— |
|
(1,373) |
|
— |
|
|
|
|
|
|
|
|
|
|
|
|
|
December 31, 2022 |
|
FVPL |
|
Amortized
cost |
|
Total |
|
Level 1 |
|
Level 2 |
|
Level 3 |
Liabilities |
|
|
|
|
|
|
|
|
|
|
|
|
Trade and Other Payables |
|
— |
|
(407,874) |
|
(407,874) |
|
— |
|
— |
|
— |
Lease liabilities |
|
— |
|
(4,079) |
|
(4,079) |
|
— |
|
— |
|
— |
Derivative financial instruments |
|
(544) |
|
— |
|
(544) |
|
— |
|
(544) |
|
— |
|
|
(544) |
|
(411,953) |
|
(412,497) |
|
— |
|
(544) |
|
— |
(1)The most frequently applied valuation techniques include forward pricing models. The models incorporate various inputs including: foreign exchange spot, interest rates curves of the respective currencies and the terms of the contract
There were no changes in level 3 items for the periods ended September 30, 2023 and December 31, 2022. Also, there were no transfer of items between level 2 and level 3, acquisitions, disposals nor gains or losses recognized in profit for the period related to level 3 instruments.
25. Subsequent events
Warrant exercise
On November 15, 2023 a holder of warrants exercised its net issuance right resulting in a net issuance amount of 6,334,134 shares at a Fair Market Value of U.S. Dollars 18.098 per share, calculated using the average price of five business days before the exercise date.
Exhibit 99.3

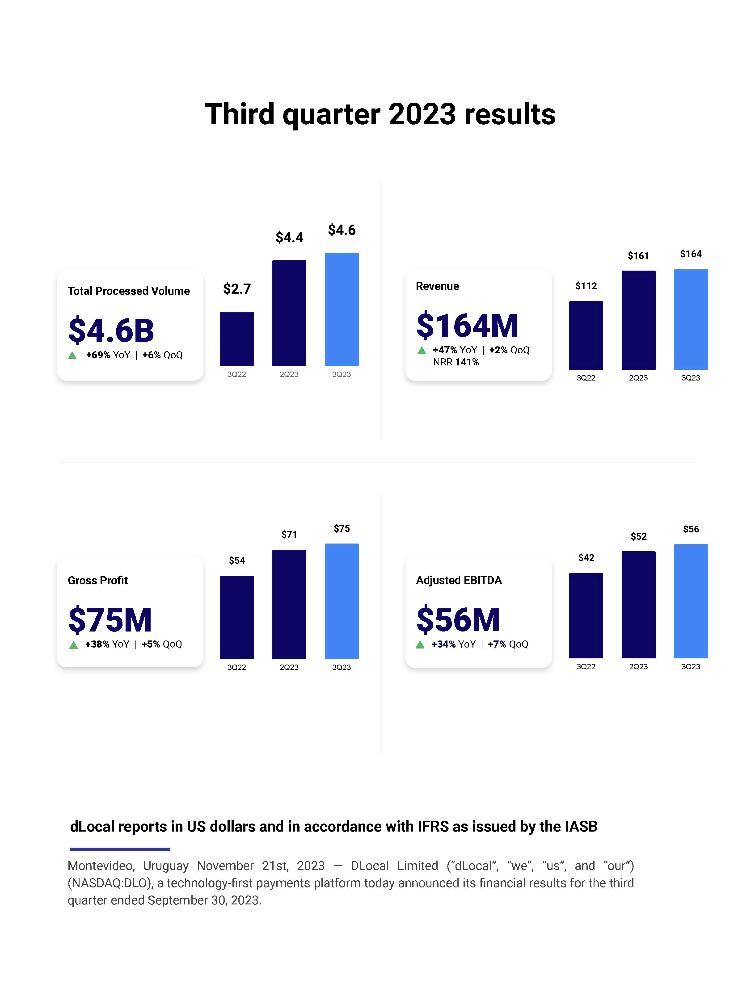
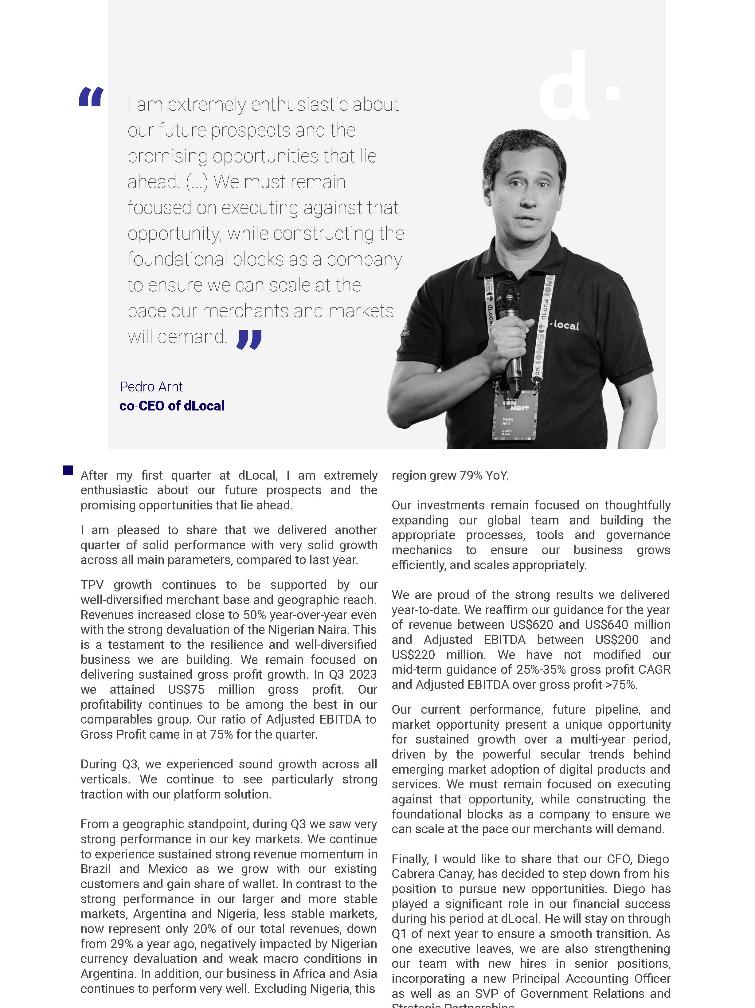
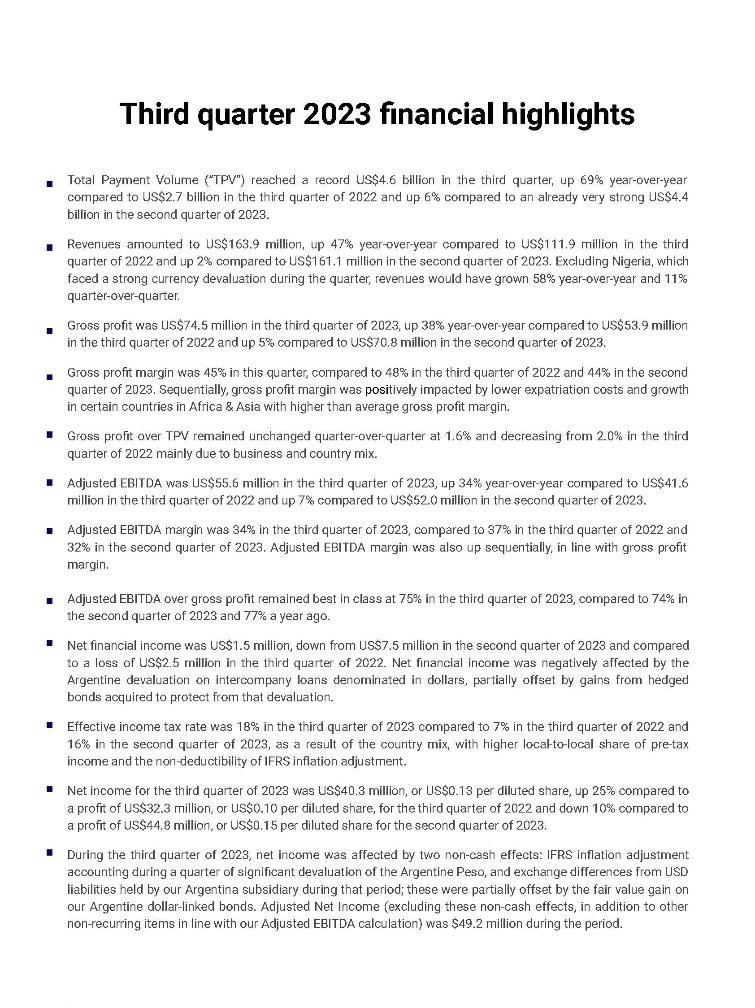
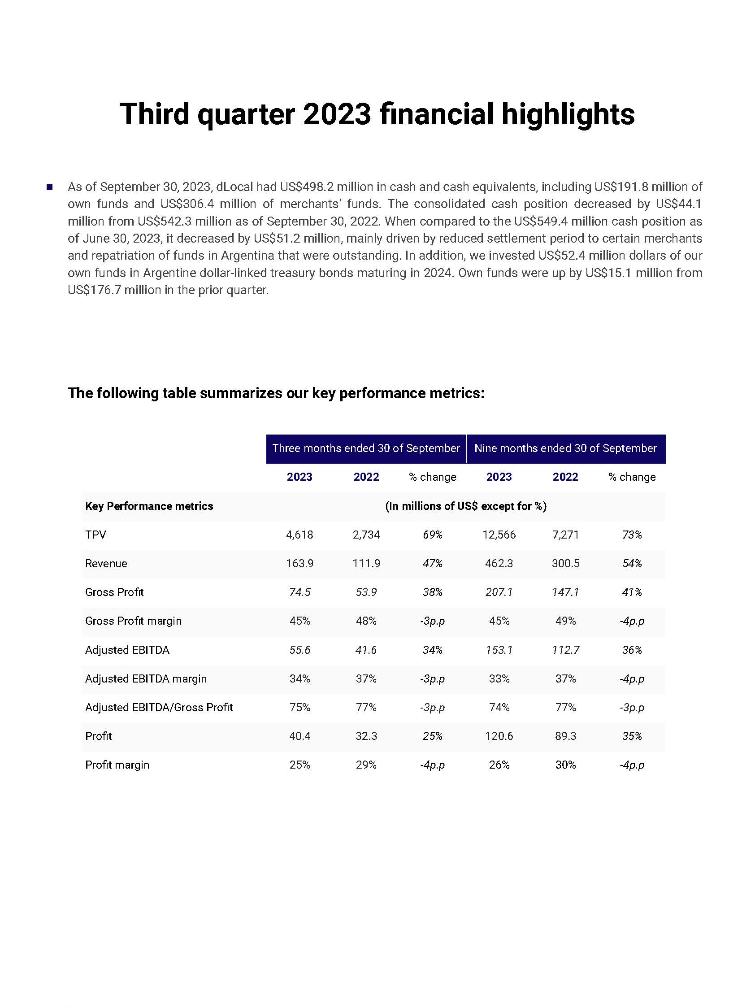
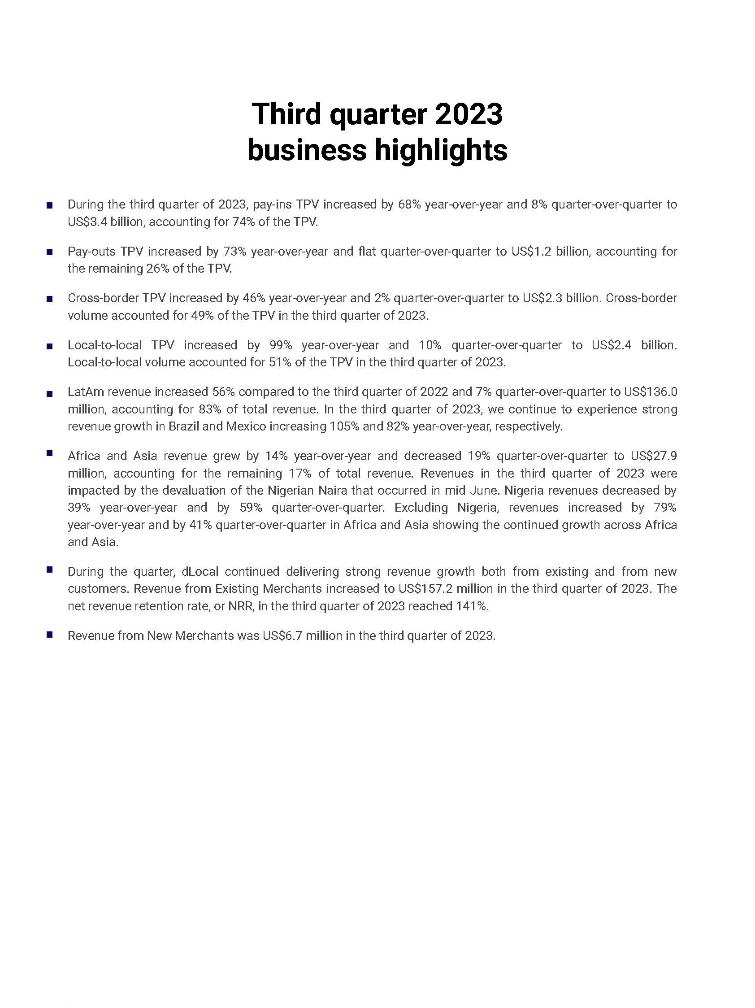
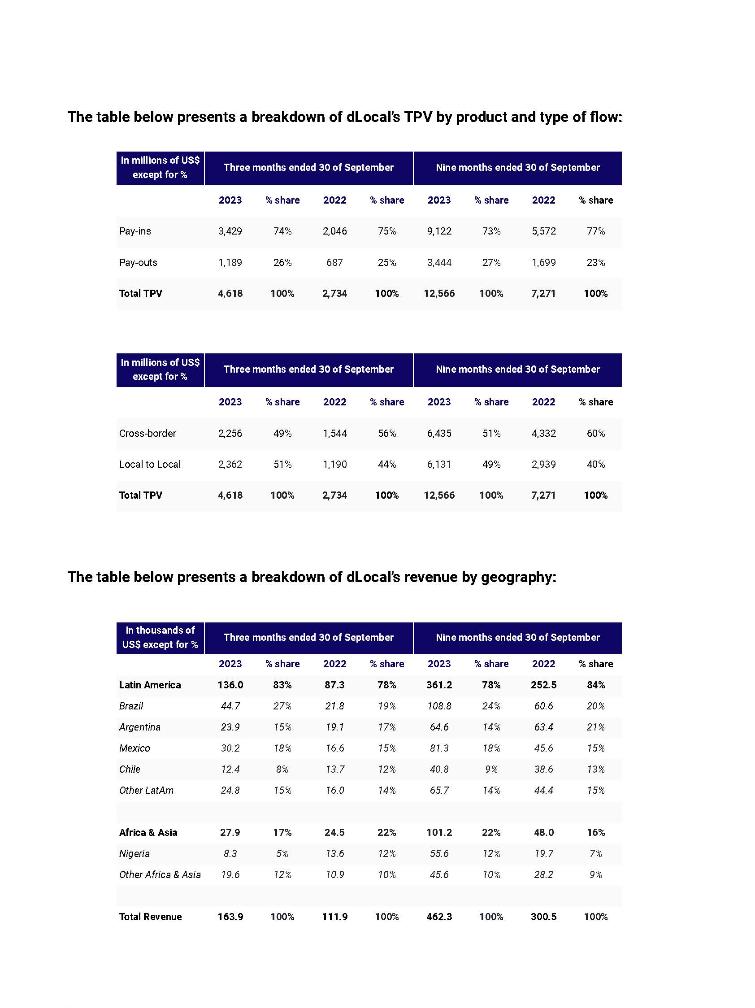
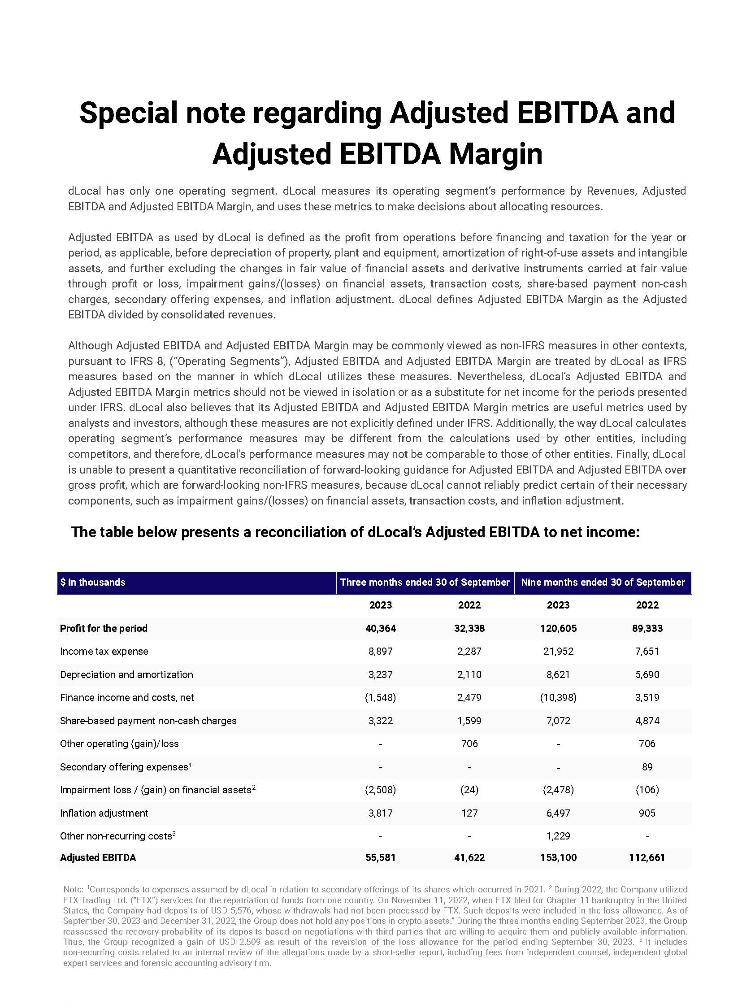
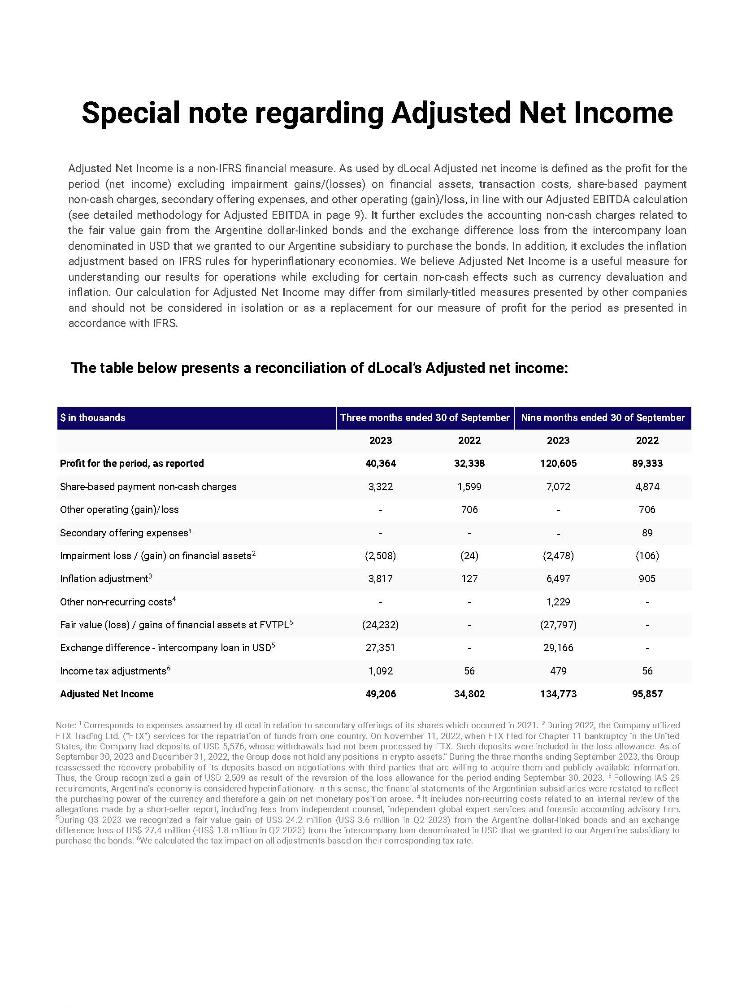
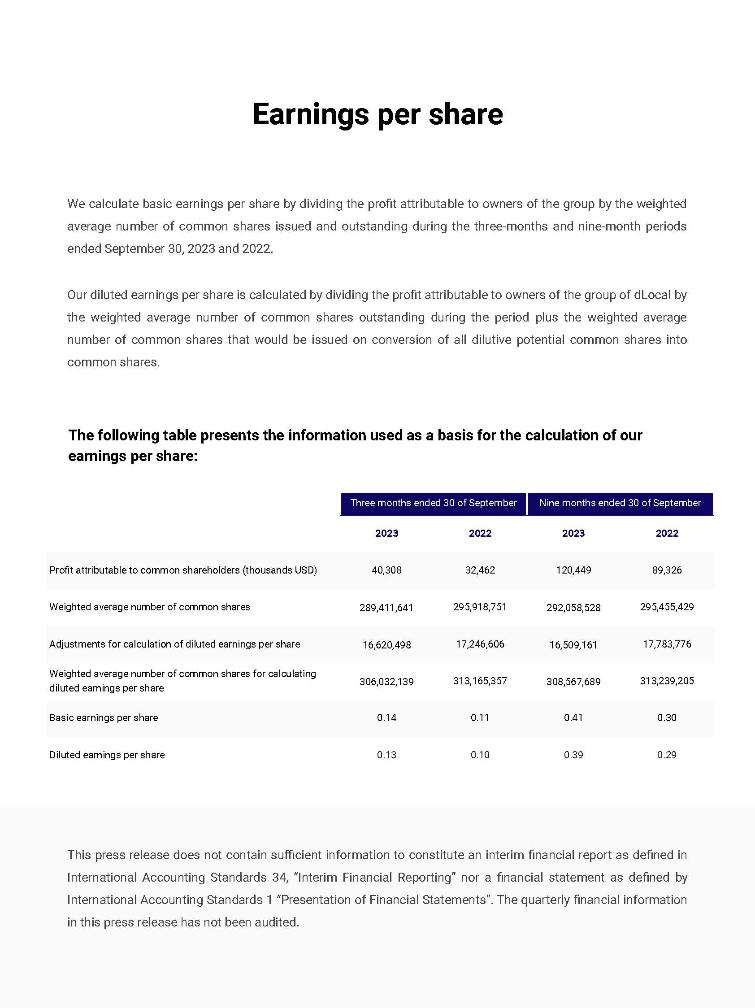
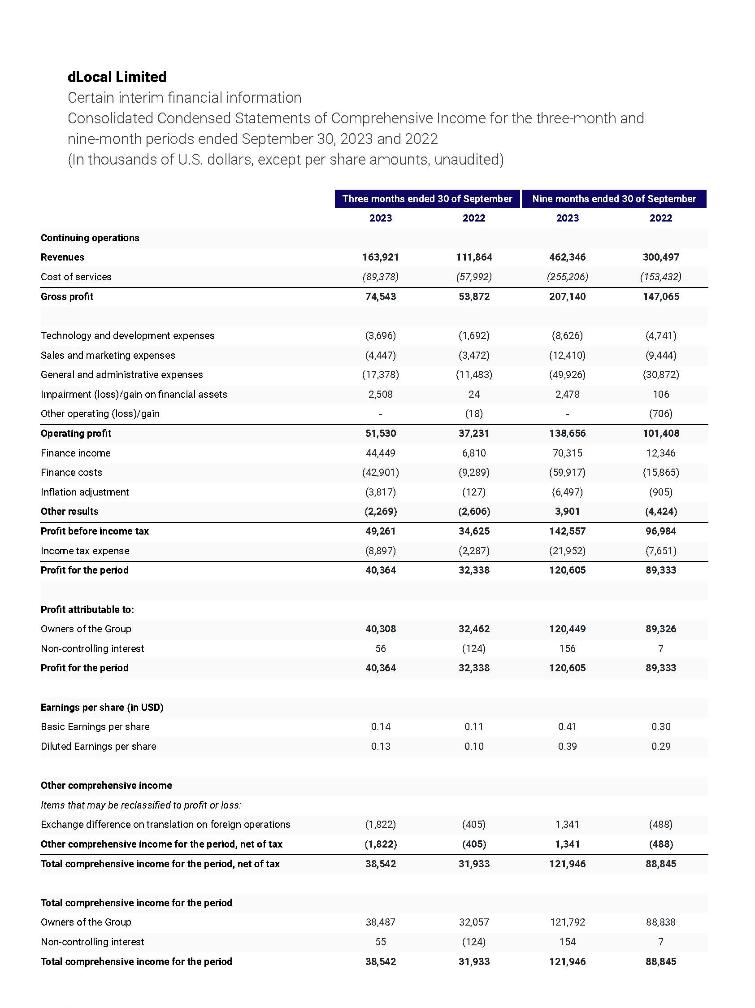
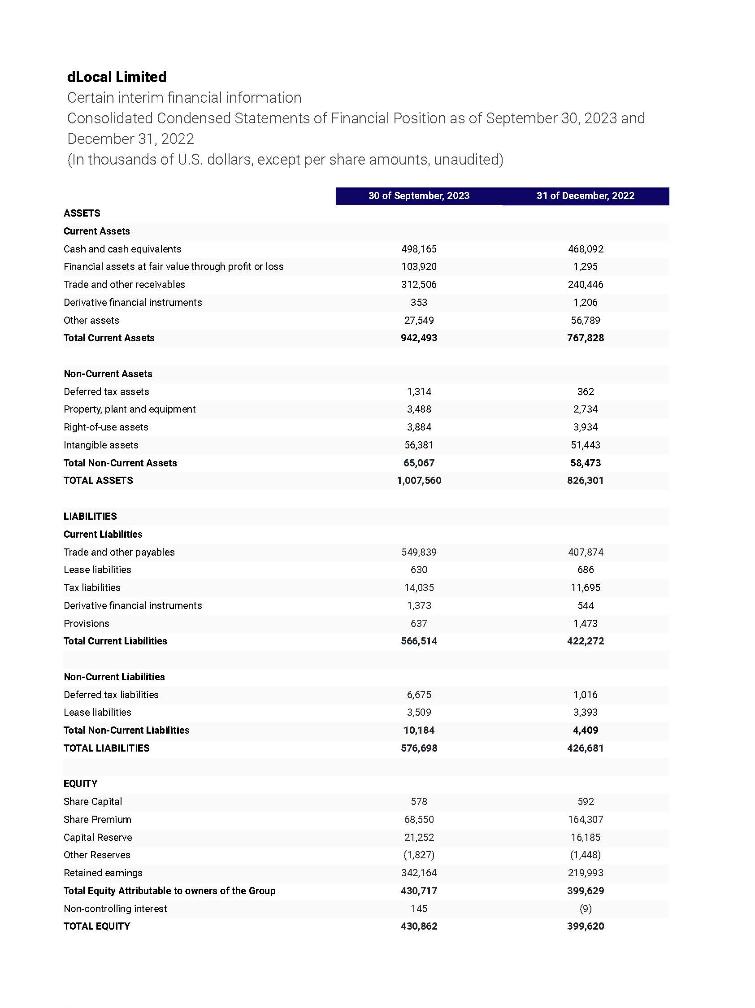
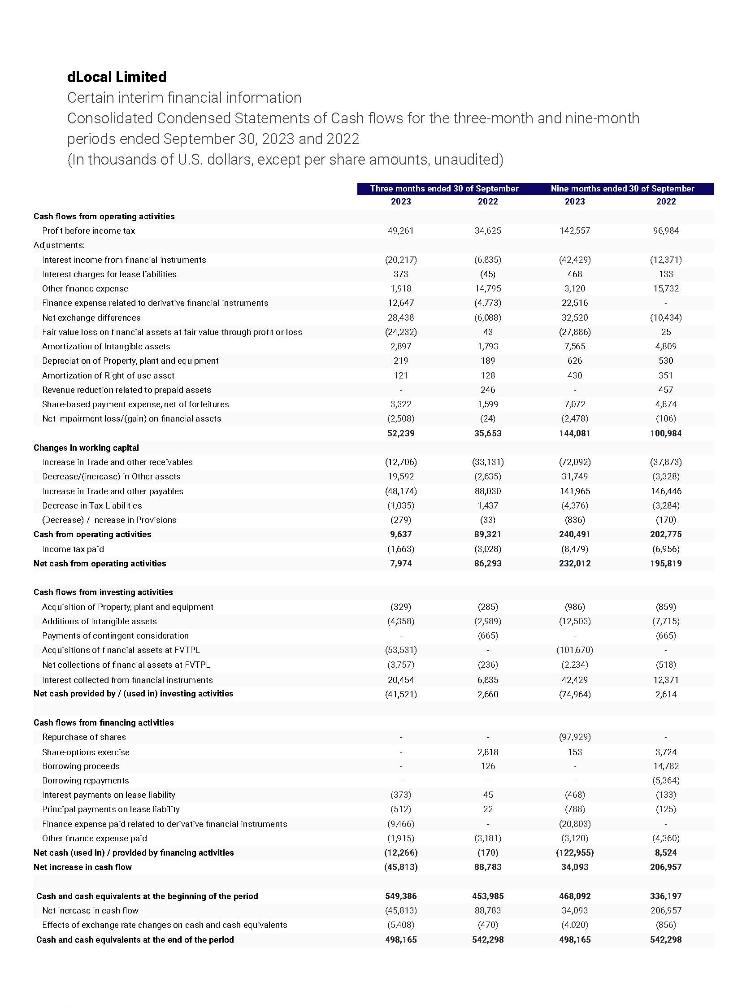

Exhibit 99.4


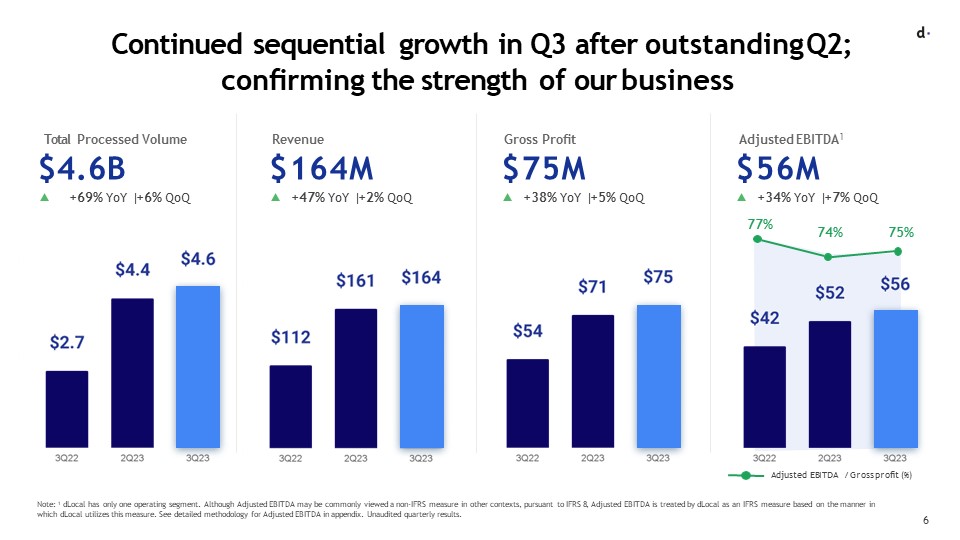
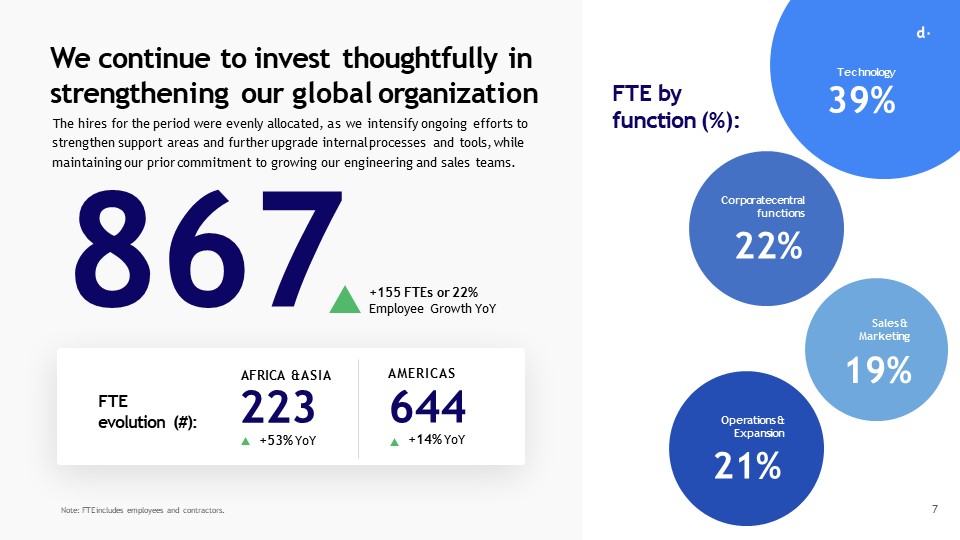
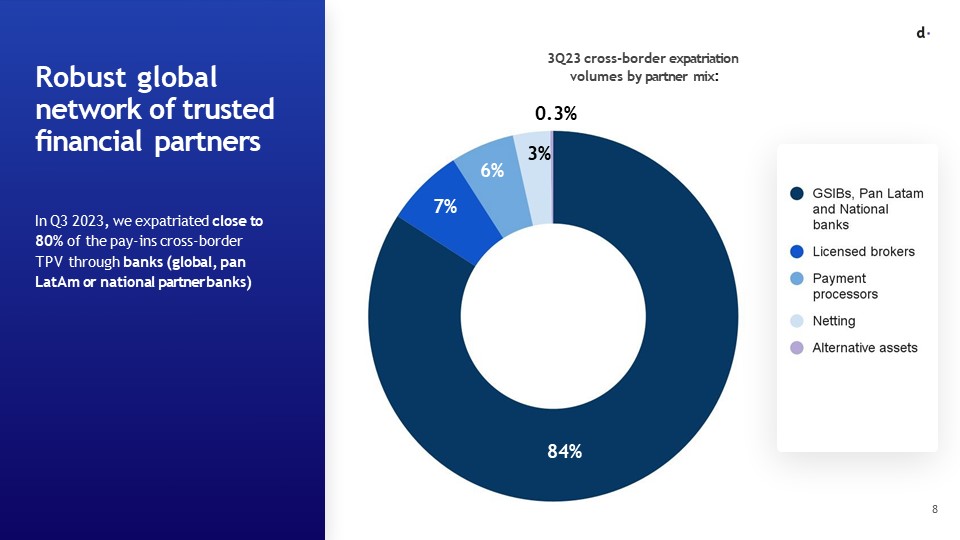
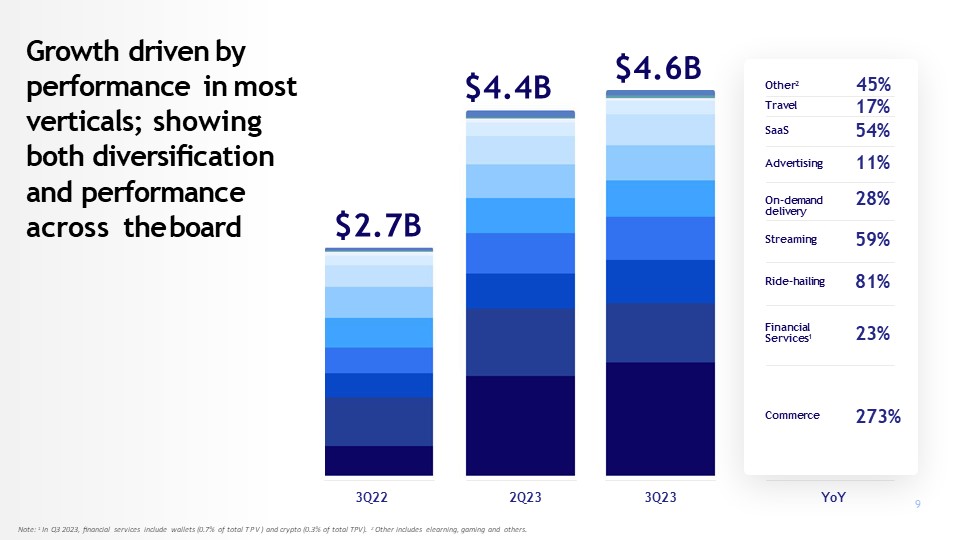
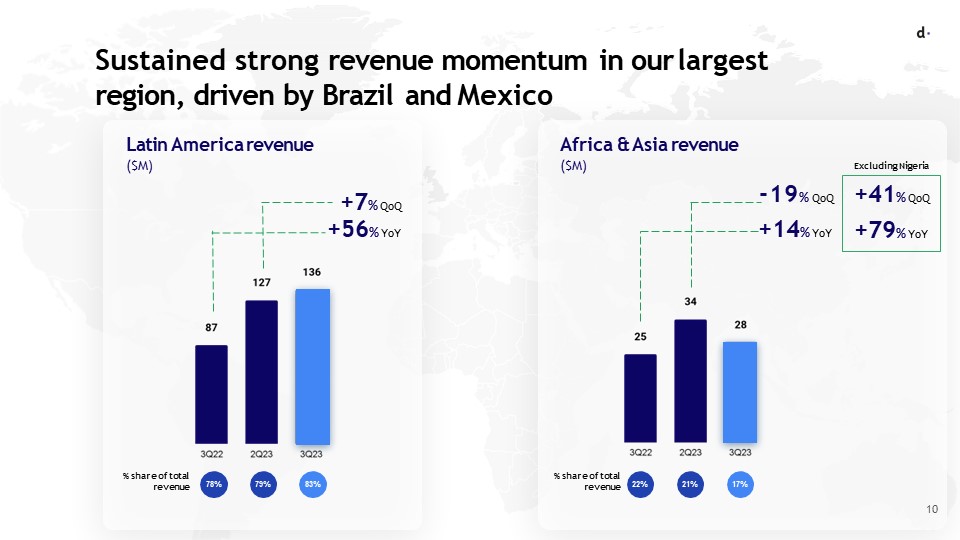

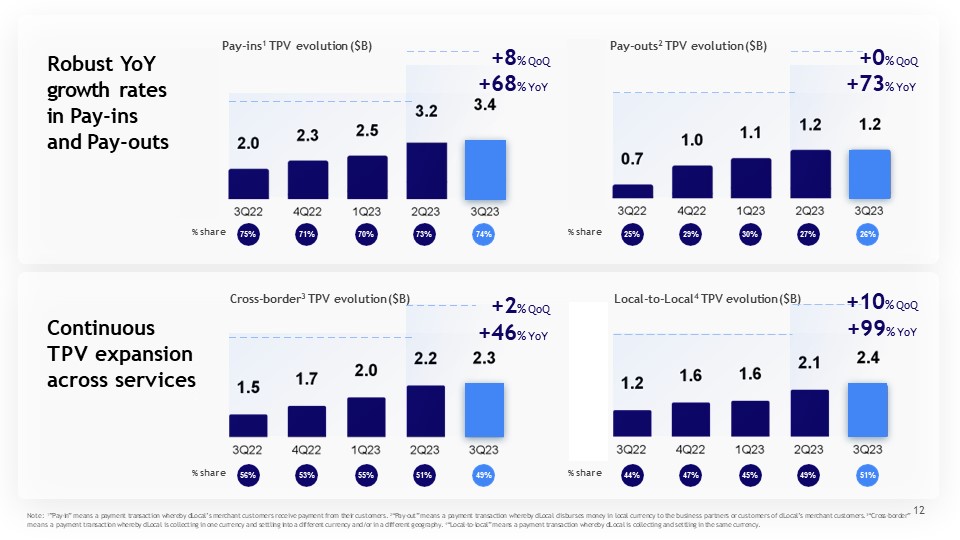
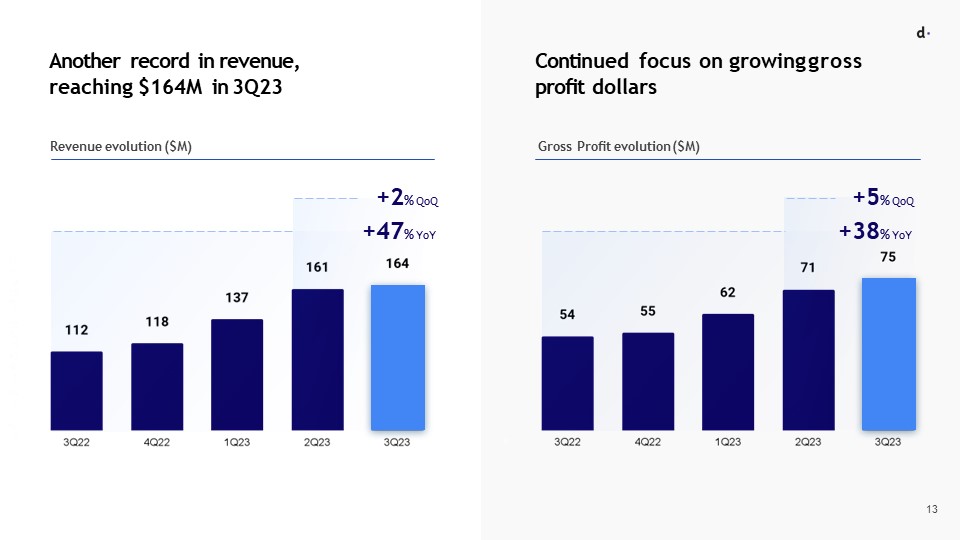
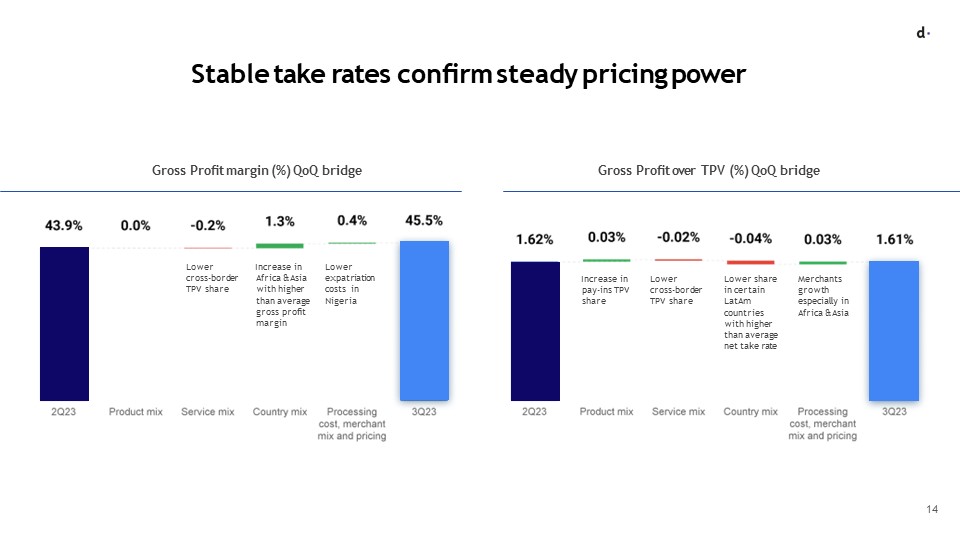
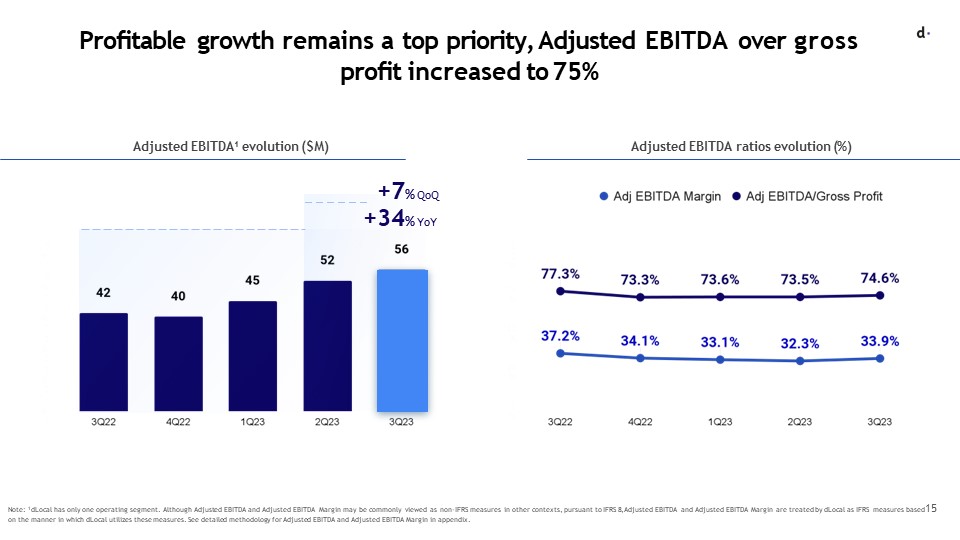
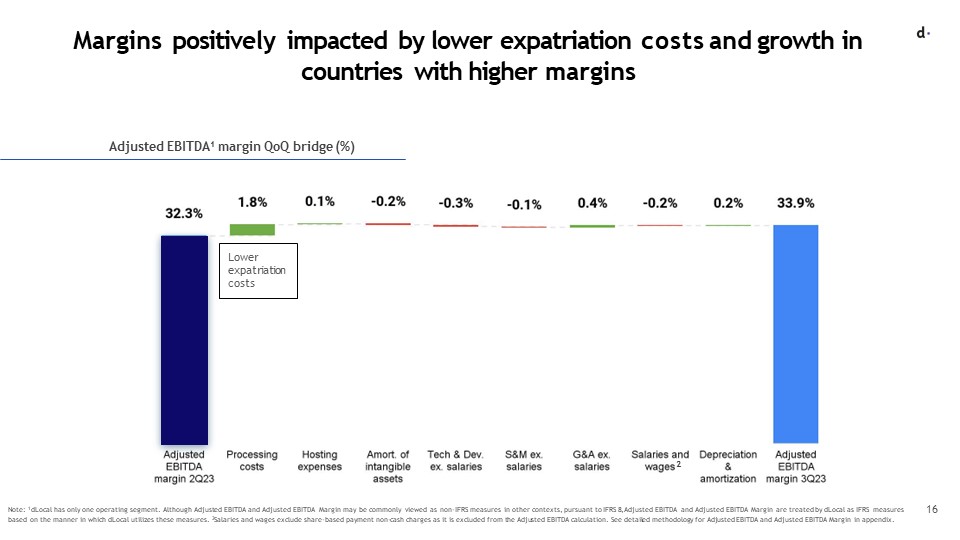
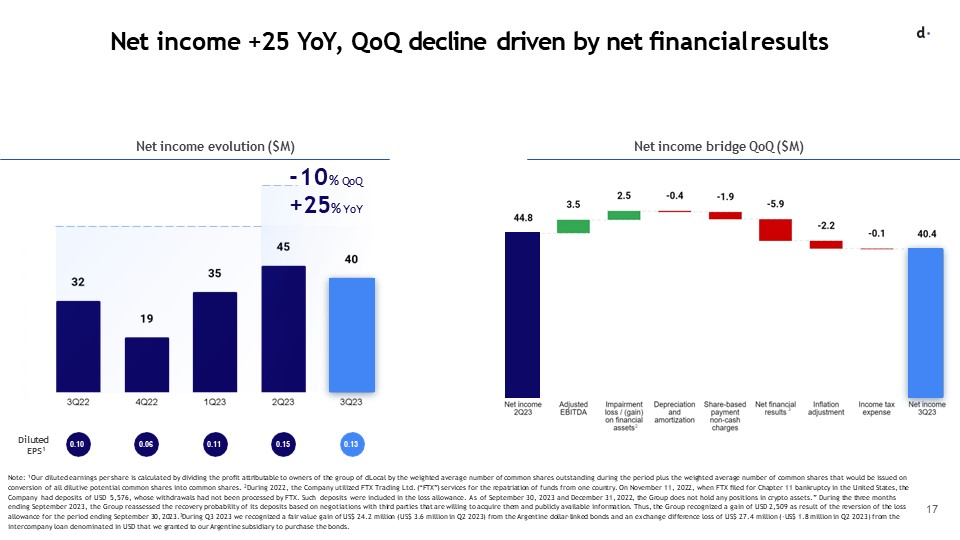
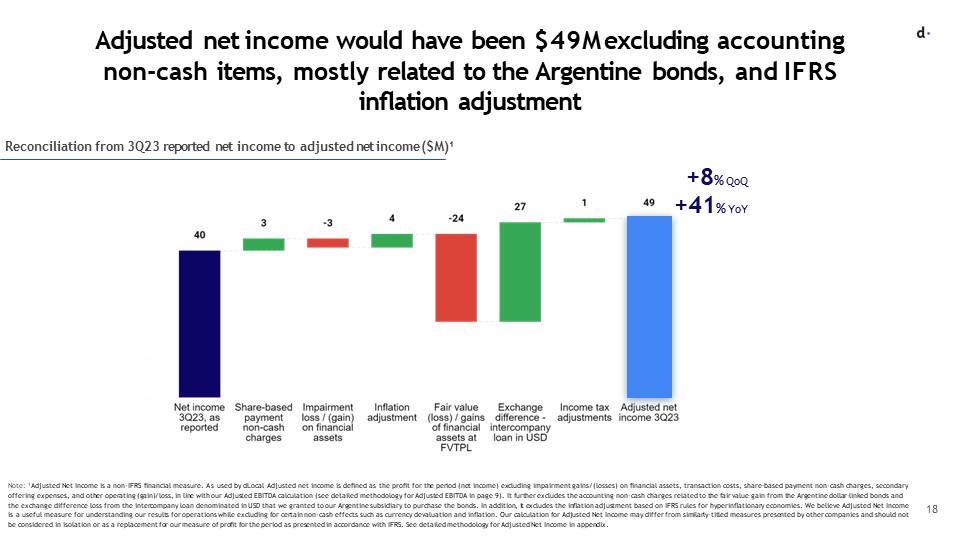
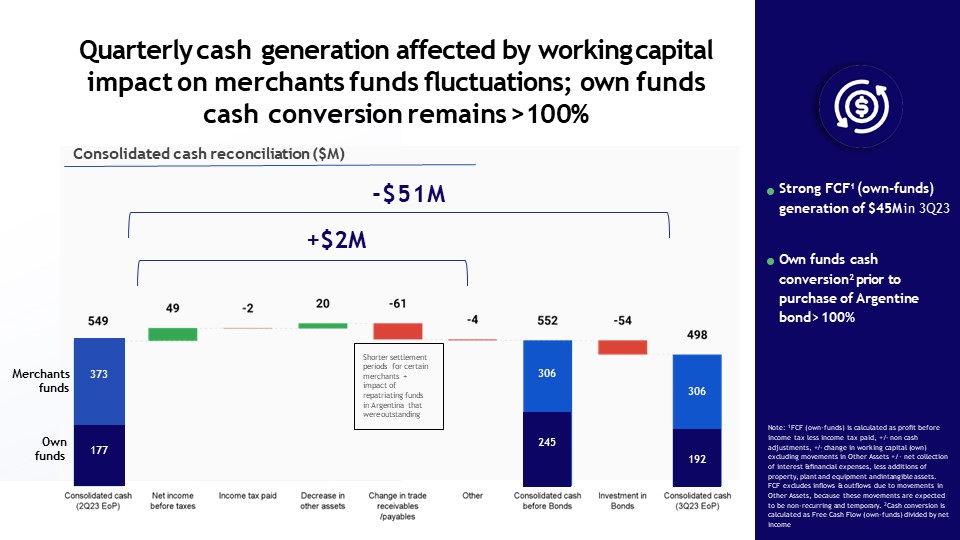


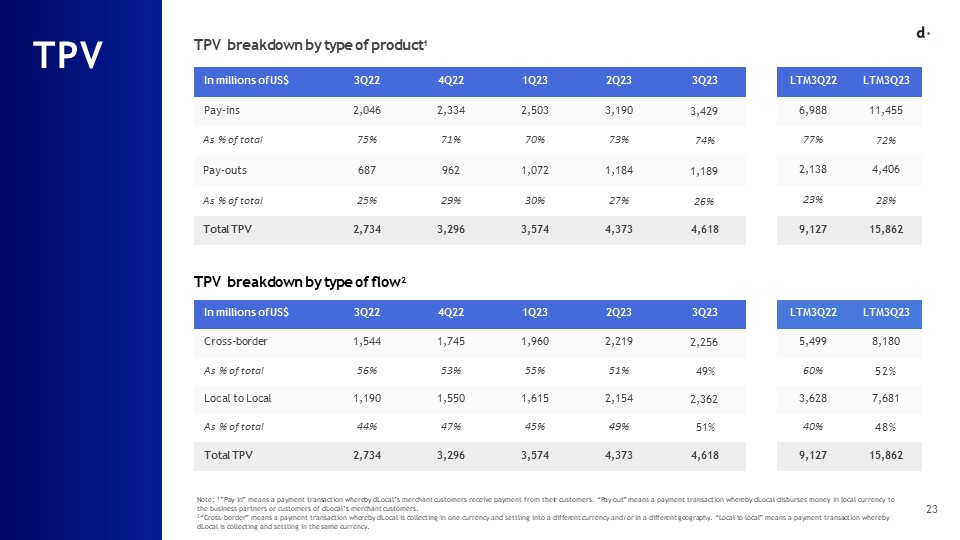
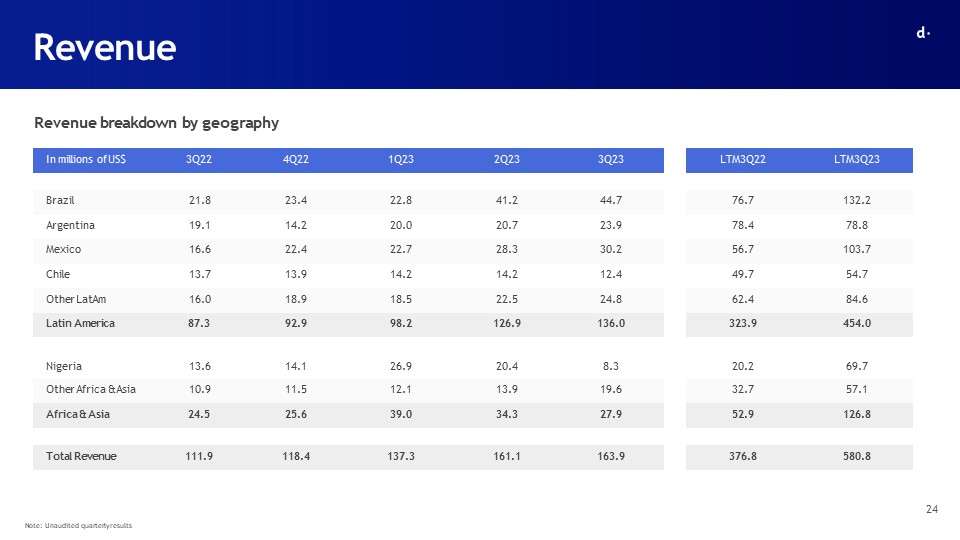
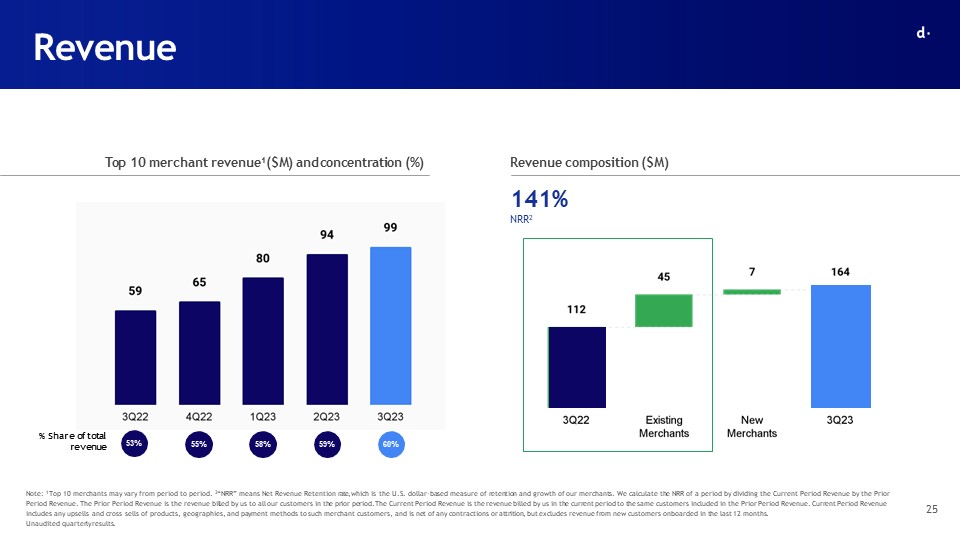
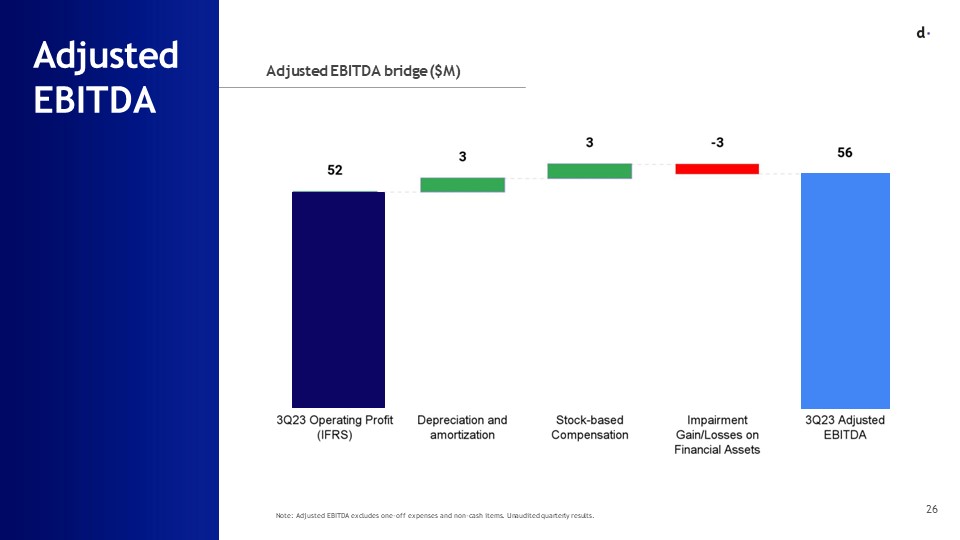
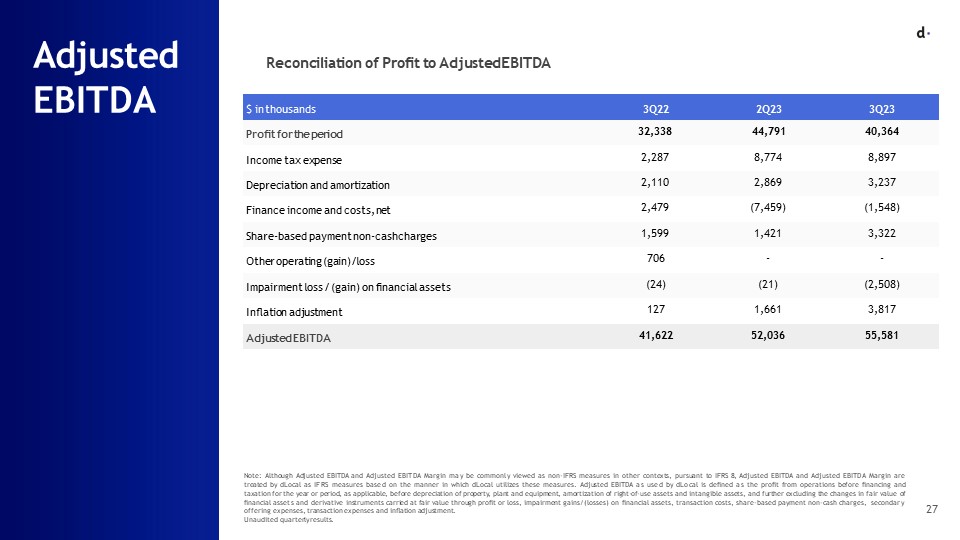
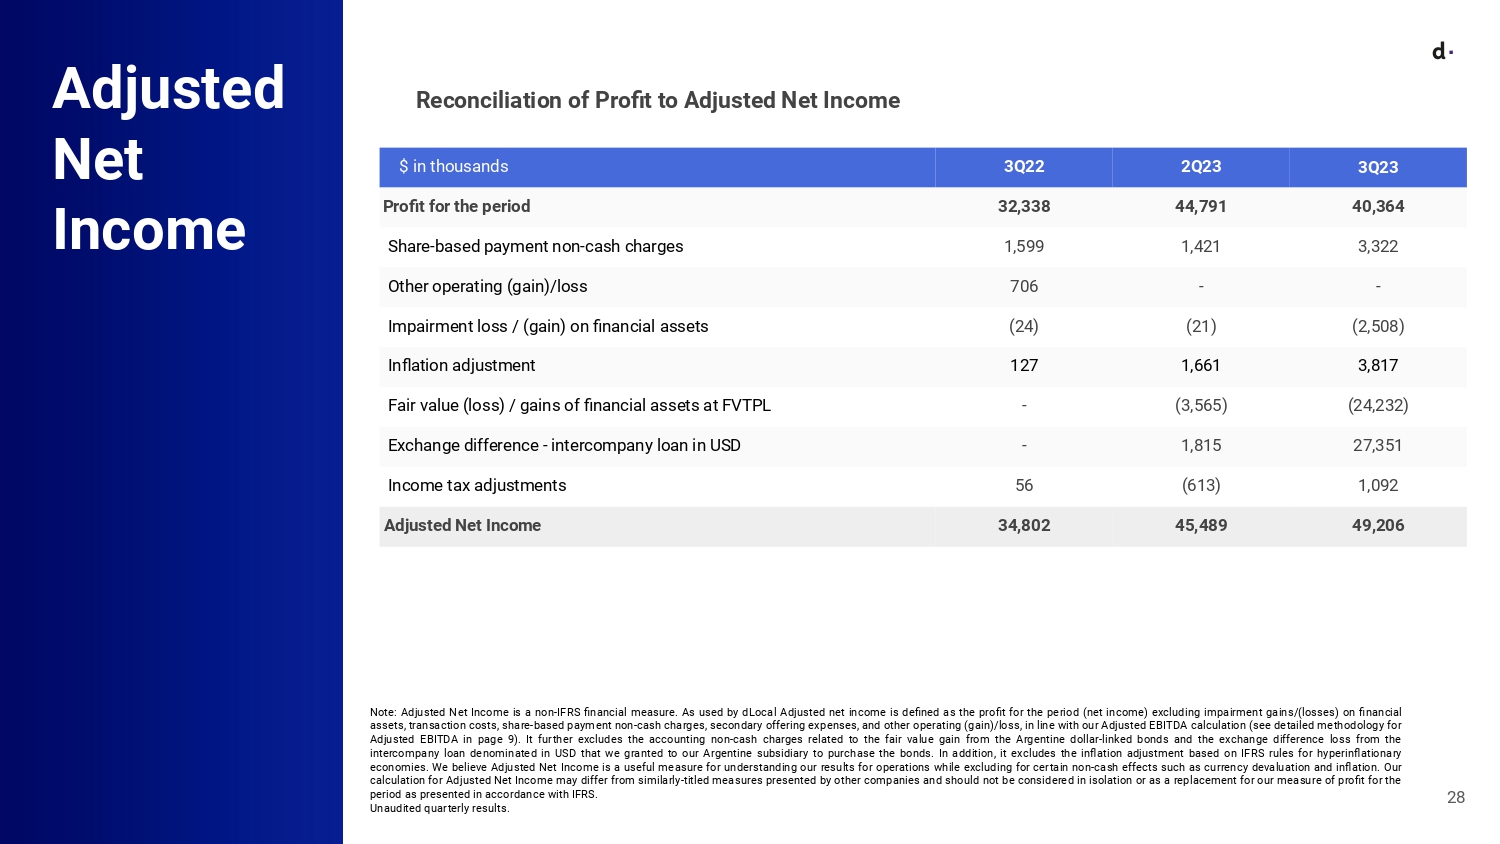
DLocal (NASDAQ:DLO)
Historical Stock Chart
From Apr 2024 to May 2024

DLocal (NASDAQ:DLO)
Historical Stock Chart
From May 2023 to May 2024
