CVB FINANCIAL CORP false 0000354647 0000354647 2023-07-26 2023-07-26
UNITED STATES
SECURITIES AND EXCHANGE COMMISSION
Washington, D.C. 20549
FORM 8-K
Current Report
Pursuant to Section 13 or 15(d)
of the Securities Exchange Act of 1934
Date of Report (Date of earliest event reported): July 26, 2023
CVB FINANCIAL CORP.
(Exact name of registrant as specified in its charter)
|
|
|
|
|
| California |
|
000-10140 |
|
95-3629339 |
| (State or other jurisdiction of incorporation or organization) |
|
(Commission file number) |
|
(I.R.S. employer identification number) |
|
|
|
|
|
| 701 North Haven Avenue, Ontario, California |
|
91764 |
| (Address of principal executive offices) |
|
(Zip Code) |
Registrant’s telephone number, including area code: (909) 980-4030
Not Applicable
(Former name or former address, if changed since last report)
Check the appropriate box below if the Form 8-K filing is intended to simultaneously satisfy the filing obligation of the registrant under any of the following provisions (See General Instruction A.2. below):
| ☐ |
Written communications pursuant to Rule 425 under the Securities Act (17 CFR 230.425) |
| ☐ |
Soliciting material pursuant to Rule 14a-12 under the Exchange Act (17 CFR 240.14a-12) |
| ☐ |
Pre-commencement communications pursuant to Rule 14d-2(b) under the Exchange Act (17 CFR 240.14d-2(b)) |
| ☐ |
Pre-commencement communications pursuant to Rule 13e-4(c) under the Exchange Act (17 CFR 240.13e-4(c)) |
Securities registered pursuant to Section 12(b) of the Act:
|
|
|
|
|
| Title of each class |
|
Trading Symbol(s) |
|
Name of each exchange on which registered |
| Common Stock, No Par Value |
|
CVBF |
|
The Nasdaq Stock Market, LLC |
Indicate by check mark whether the registrant is an emerging growth company as defined in Rule 405 of the Securities Act of 1933 (§230.405 of this chapter) or Rule 12b-2 of the Securities Exchange Act of 1934 (§240.12b-2 of this chapter). Emerging growth company ☐
If an emerging growth company, indicate by check mark if the registrant has elected not to use the extended transition period for complying with any new or revised financial accounting standards provided pursuant to Section 13(a) of the Exchange Act. ☐
| Item 7.01 |
Regulation FD Disclosure. |
The President and Chief Executive Officer and Chief Financial Officer of CVB Financial Corp. (the “Company”) will make presentations to institutional investors at various meetings throughout the third quarter of 2023. The July 2023 slide presentation, updated to reflect second quarter 2023 financial information, is included as Exhibit 99.1 of this report. The information in this report (including Exhibits 99.1) shall not be deemed to be “filed” for the purposes of Section 18 of the Securities Exchange Act of 1934, as amended (the “Exchange Act”), or otherwise subject to the liability of that section, and shall not be incorporated by reference into any registration statement or other documents filed under the Securities Act of 1933, as amended, or the Exchange Act, except as shall be expressly set forth by the specific reference in such filing. A copy of the slide presentation will be also available on the Company’s website at www.cbbank.com under the “Investors” tab.
| Item 9.01 |
Financial Statements and Exhibits. |
(d) Exhibits
2
SIGNATURES
Pursuant to the requirements of the Securities Exchange Act of 1934, the registrant has duly caused this report to be signed on its behalf by the undersigned hereunto duly authorized.
|
|
|
|
|
|
|
|
|
|
|
CVB FINANCIAL CORP. |
|
|
|
|
(Registrant) |
|
|
|
|
| Date: July 27, 2023 |
|
|
|
By: |
|
/s/ E. Allen Nicholson |
|
|
|
|
|
|
E. Allen Nicholson |
|
|
|
|
|
|
Executive Vice President and Chief Financial Officer |
3

Exhibit 99.1 July 2023 cbbank.com

Forward Looking Statements This presentation contains forward-looking
statements that are intended to be covered by the safe harbor for such statements provided by the Private Securities Litigation Reform Act of 1995. These statements are based on the current beliefs and expectations of the management of CVB Financial
Corp. and Citizens Business Bank (collectively, the “Company”) and are subject to significant risks and uncertainties that could cause actual results or performance to differ materially from those projected. You should not place undue
reliance on these statements. Factors that could cause the Company’s actual results to differ materially from those described in the forward-looking statements include, among others, changes in the U.S. economy or local, regional and global
business, economic and political conditions; changes in laws or the regulatory environment, including trade, monetary and fiscal policies and laws; inflation or deflation, interest rate, market and monetary fluctuations; possible changes in our
levels of capital or liquidity or our access to government or private lending facilities; possible credit related impairments, goodwill impairments or declines in the fair value of our loans and securities; the effect of acquisitions we have made or
may make; changes in the competitive environment, including technological changes; cybersecurity and fraud threats; changes in the commercial and residential real estate markets; changes in customer preferences, borrowing and savings habits;
geopolitical conditions, threats of terrorism or military action, catastrophic events or natural disasters such as earthquakes, drought, pandemics, climate change and extreme weather; fraud and cybersecurity threats; and unanticipated legal or
regulatory proceedings or outcomes. These factors also include those contained in the Company’s filings with the Securities and Exchange Commission, including the “Risk Factors” section of the Company’s Annual Report on Form
10-K for the year ended December 31, 2022. When considering these forward-looking statements, you should keep in mind these risks and uncertainties, as well as any cautionary statements that the Company or its management may make from time to time.
These forward-looking statements speak solely as of the date they are made and are based only on information then actually known to the Company’s executives who are making the associated statements. The Company does not undertake to update any
forward-looking statements except as required by law. Non-GAAP Financial Measures—Certain financial information provided in this presentation has not been prepared in accordance with U.S. generally accepted accounting principles
(“GAAP”) and is presented on a non-GAAP basis. Investors and analysts should refer to the reconciliations included in this presentation and should consider the Company’s non-GAAP measures in addition to, not as a substitute for or
as superior to, measures prepared in accordance with GAAP. These measures may or may not be comparable to similarly titled measures used by other companies. cbbank.com 2

CVB Financial Corp. (CVBF) ▪ Total Assets: $16.5 Billion ▪
Gross Loans: $ 8.9 Billion ▪ Total Deposits (Including Repos): $12.8 Billion ▪ Total Equity: $ 2.0 Billion ➢ Largest financial institution headquartered in the Inland Empire region of Southern California. Founded in 1974. 3
cbbank.com

Bank Accomplishments & Ratings ➢ 185 Consecutive Quarters of
Profitability ➢ 135 Consecutive Quarters of Cash Dividends ➢ Ranked #1 Forbes, 2023 Best Banks in America (February 2023) ➢ Ranked #4 Forbes, 2022 Best Banks in America (January 2022) ➢ Ranked #1 Forbes, 2021 Best Banks
in America (January 2021) ➢ Ranked #1 Forbes, 2020 Best Banks in America (January 2020) ➢ Ranked #4 Forbes, 2019 Best Banks in America (January 2019) ➢ Ranked #2 Forbes, 2017 Best Banks in America (January 2017) ➢ Ranked
#1 Forbes, 2016 Best Banks in America (January 2016) ➢ Ranked #3 in S&P Global Market Intelligence’s 2022 Top 50 Public Banks ➢ BauerFinancial Report ▪ Five Star Superior Rating ❖ 54 Consecutive Quarters ➢
Fitch Rating ▪ BBB+ (April 2023) ➢ One of the 10 largest bank holding companies in CA As of 7/11/2023 CVB Financial Corp. is the holding company for Citizens Business Bank SNL Financial ranking of largest bank holding companies in CA,
as of 6/30/2023 4 cbbank.com

62 Business Financial Centers 3 CitizensTrust Locations Corporate Office
Business Financial Centers CitizensTrust cbbank.com

Our Vision Citizens Business Bank will strive to become the premier
financial services company operating throughout the state of California, servicing the comprehensive financial needs of successful small to medium sized businesses and their owners. cbbank.com 6

Target Customer The best privately-held and/or family-owned businesses
throughout California ▪ Annual revenues of $1-300 million ▪ Top 25% in their respective industry ▪ Full relationship banking ▪ Build long-term relationships cbbank.com 7

Three Areas of Growth DeNovo Acquisitions San Diego (2014) American
Security Bank (2014) Oxnard (2015) County Commerce Bank (2016) Santa Barbara (2015) Valley Business Bank (2017) San Diego (2017) Community Bank (2018) Stockton (2018) Suncrest Bank (2022) Modesto (2020) cbbank.com 8

Acquisition Strategy Banks: ➢ Target size: $1 billion to $10
billion in assets ➢ Financial & Strategic ➢ In-market and/or adjacent geographic market (California) Banking Teams: ➢ In-market ➢ New markets cbbank.com 9

Relationship Banking Model Customer Credit Relationship Marketing
Management Manager Division (Bank) Citizens Home Agribusiness Lending Dairy & Asset Based Construction Livestock Lending Lending Real Estate Treasury SBA Government Management Services International Services CitizensTrust/ Specialty Wealth
Banking Management Citizens Bankcard/ Equipment Processing Financing cbbank.com 10

CVBF Balance Sheet Profile June 30, 2023 Deposits & Wholesale
Securities Assets Loans Repos Funding Cash D&L & Agri Repos 4% 3% 4% Other Others Muni 8% 8% 9% Interest- Agency C&I bearing 10% 11% FRB 35% BTFB Securities $1.5B Loans $5.6B $8.9B $12.8B $16.5B MBS 46% 34% 54% CMO FHLB ST 59%
Noninterest- 22% borrowings CRE bearing 54% 78% 61% 100% Core Customer Deposits Capital Ratios as of June 30, 2023 TCE Tier 1 Leverage CET1 Tier 1 RBC Total RBC 7.8% 9.8% 14.1% 14.1% 14.9% cbbank.com 11

Q2 2023 Financial Highlights • ROATCE = 18.39% • ROAA =
1.36% Profitability • NIM = 3.22% • Efficiency Ratio = 40.86% • Q2’23 Net Income = $55.8 million / EPS = $0.40 • 6% decrease in Net Income vs. Q1‘23 & Q2’22 Income Statement • Cost of deposits
increased sequentially from 0.17% to 0.35% • Loans decreased sequentially by $35 million ~ 0.4% • Total deposits increased sequentially by $126 million ~ 1% Balance Sheet • Noninterest deposits 64% of Total Deposits at quarter end
• ST-borrowings, net of cash decreased sequentially by $300 million • Q2 Net charge-offs = $73,000 • NPA/TA = 0.04% (NPA = $6.5 million) Asset Quality • Classified loans = $78 million or 0.87% of total loans • ACL = $87
million or 112% of classified loans • CET1 Ratio = 14.1% Capital • Total Risk-Based Ratio = 14.9% • Tangible Common Equity Ratio = 7.8% cbbank.com 12

Selected Ratios 2020 2021 2022 Q2’22 Q1’23 Q2’23
ROATCE 14.25% 15.93% 18.85% 18.67% 20.59% 18.39% NIM 3.59% 2.97% 3.30% 3.16% 3.45% 3.22% Cost of Deposits 0.12% 0.04% 0.05% 0.03% 0.17% 0.35% Performance Cost of Funds 0.13% 0.05% 0.06% 0.04% 0.49% 0.83% Efficiency Ratio 41.40% 41.09% 38.98% 37.24%
39.50% 40.86% NIE % Avg. Assets 1.49% 1.24% 1.28% 1.20% 1.36% 1.32% NPA % Total Assets 0.12% 0.04% 0.03% 0.08% 0.04% 0.04% Credit Quality Net Charge-Offs 0.00% 0.04% (0.01%) -0.01% 0.00% 0.00% (Recoveries) to Avg. Loans CET1 Ratio 14.8% 14.9% 13.5%
13.4% 13.8% 14.1% Capital Total Risk-Based Capital 16.2% 15.6% 14.4% 14.2% 14.6% 14.9% Ratio cbbank.com 13

Selected Highlights Q2’22 Q1’23 Q2’23 ($ in
Thousands) Net Interest Income $ 121,940 $ 125,728 $ 119,535 Noninterest Income 14,670 13,202 12,656 Noninterest Expense 50,871 54,881 54,017 PTPP 85,739 84,049 78,174 Income Provision for Credit Losses 3,600 1,500 500 Statement Earnings before
Income Taxes 82,139 82,549 77,674 Net Income $ 59,058 $59,270 $ 55,770 Basic earnings per common share $0.42 $0.42 $0.40 Diluted earnings per common share $0.42 $0.42 $0.40 cbbank.com 14

Selected Highlights Q2’22 Q1’23 Q2’23 ($ in
Thousands) Average Cash & Cash Equivalents $ 976,020 $ 212,079 $ 525,566 Average Loans 8,634,575 8,963,323 8,892,413 Average PPP Loans 96,240 7,339 5,461 Average Total Securities 6,104,037 5,762,728 5,689,606 Average Balance Average
Noninterest-bearing Deposits 8,923,043 8,092,704 7,823,496 Sheet Average Total Deposits & Customer 14,753,879 13,264,705 12,800,441 Repurchase Agreements Average Borrowings 39 971,701 1,526,958 Loan-to-deposit 60.93% 70.50% 72.27%
Noninterest-bearing deposits/Total Deposits 62.96% 63.65% 63.58% cbbank.com 15

Pretax-Pre Provision Income ($ in Millions) 2.31% 2.16% 2.09% 2.02%
1.91% $78.2 $95.4 $91.9 $85.7 $84.0 Q2 2022 Q3 2022 Q4 2022 Q1 2023 Q2 2023 PTPP income (Non -GAAP*) PTPP ROAA (Non-GAAP*) * We use certain non-GAAP financial measures to provide supplemental information regarding our performance. cbbank.com
16
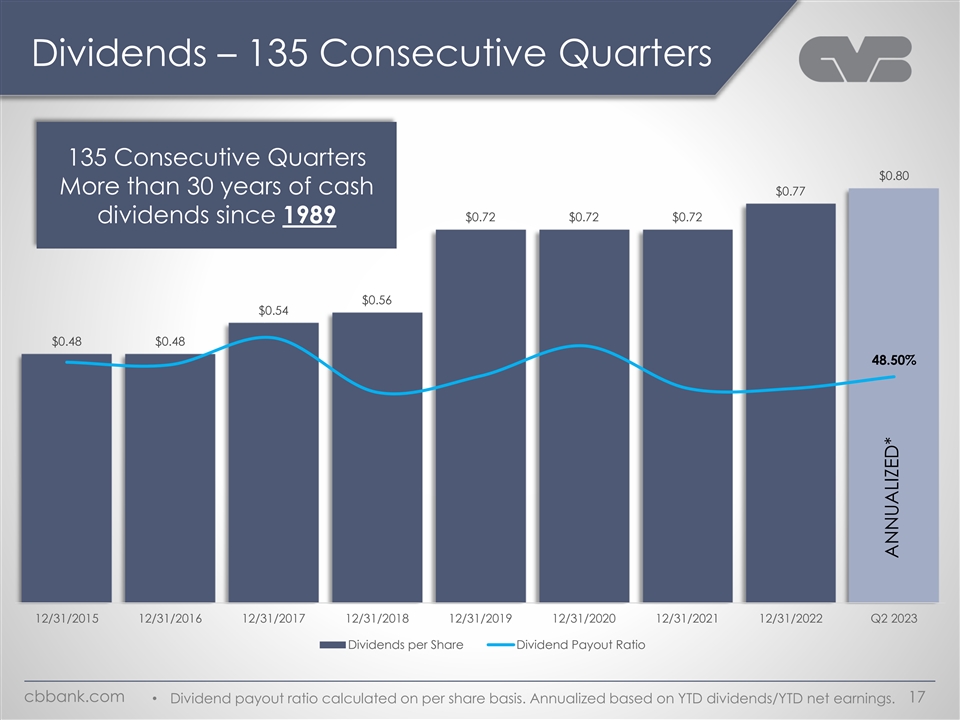
Dividends – 135 Consecutive Quarters 135 Consecutive Quarters
$0.80 More than 30 years of cash $0.77 $0.72 $0.72 $0.72 dividends since 1989 $0.56 $0.54 $0.48 $0.48 48.50% 12/31/2015 12/31/2016 12/31/2017 12/31/2018 12/31/2019 12/31/2020 12/31/2021 12/31/2022 Q2 2023 Dividends per Share Dividend Payout Ratio
cbbank.com 17 • Dividend payout ratio calculated on per share basis. Annualized based on YTD dividends/YTD net earnings. ANNUALIZED*

Earnings Per Share 185 Consecutive Quarters $1.67 $1.60 $1.56 of
Profitability $1.48 $1.30 $1.24 $0.95 $0.94 $0.93 12/31/2015 12/31/2016 12/31/2017 12/31/2018 12/31/2019 12/31/2020 12/31/2021 12/31/2022 Q2 2023 cbbank.com 18 • Annualized based on Q2’23 EPS. Q2 ANNUALIZED*

Strong Capital Ratios CVBF CET1 % KRX Avg CET1 % Regulatory Min. 14.9%
14.1% 13.8% 13.6% 13.6% 13.4% 13.5% 12.5% 12.2% 11.8% 11.8% 11.8% 11.7% 7.0% 7.0% 7.0% 7.0% 7.0% 7.0% 7.0% Q4 2021 Q1 2022 Q2 2022 Q3 2022 Q4 2022 Q1 2023 Q2 2023 Capital Ratios 14.9% As of Q2 2023 14.1% 14.1% 4.4% $494mm 9.8% 5.6% $789mm $621mm
7.1% 5.8% $930mm 10.5% 8.5% 7.0% 4.0% T1 Leverage CET1 T1 RBC Total RBC Regulatory Minimum + Capital Conservation Buffer Excess Capital * Source: S&P Capital IQ. Unweighted Average NASDAQ Regional Banking Index KRX (50 Banks) cbbank.com
19

CET1 Ratio Trend (%) 17.1% CVBF KRX 16.9% 15.1% 14.9% 14.9% 14.9% 14.8%
14.8% Community Suncrest 14.6% 14.6% 14.5% Bank Q3’18 Q1’22 14.3% 14.1% 14.1% 13.8% 13.8% 13.6% 13.6% 13.5% 13.4% 13.0% 12.9% 12.8% 12.8% 12.8% 12.5% 12.5% 12.2% 12.1% 12.1% 12.0% 12.0% 12.0% 12.0% 12.0% 12.0% 12.0% 11.9% 11.8% 11.8%
11.8% 11.7% 11.7% Q1 Q2 Q3 Q4 Q1 Q2 Q3 Q4 Q1 Q2 Q3 Q4 Q1 Q2 Q3 Q4 Q1 Q2 Q3 Q4 Q1 Q2 2018 2018 2018 2018 2019 2019 2019 2019 2020 2020 2020 2020 2021 2021 2021 2021 2022 2022 2022 2022 2023 2023 * Source: S&P Capital IQ. Unweighted Average NASDAQ
Regional Banking Index KRX cbbank.com 20

TCE Ratio Trend (%) CVBF KRX 12.2% 12.1% 11.8% 11.7% 11.5% 11.3% 11.1%
10.5% 10.2% 9.8% 9.6% 9.6% 9.4% 9.2% 9.2% 9.7% 9.7% 8.9% 9.6% 9.4% 9.3% 9.2% 9.2% 9.1% 9.1% 9.0% 8.9% 8.8% 8.8% 8.7% 8.7% 7.9% 8.6% 7.8% 7.8% 7.5% 7.4% 7.1% 7.7% 7.5% 7.5% 7.4% 7.0% Q1 Q2 Q3 Q4 Q1 Q2 Q3 Q4 Q1 Q2 Q3 Q4 Q1 Q2 Q3 Q4 Q1 Q2 Q3 Q4 Q1 Q2
2018 2018 2018 2018 2019 2019 2019 2019 2020 2020 2020 2020 2021 2021 2021 2021 2022 2022 2022 2022 2023 2023 * Source: S&P Capital IQ. Unweighted Average NASDAQ Regional Banking Index KRX cbbank.com 21

Credit Quality NPA % Total Assets Classified Loans % Total Loans 0.94%
0.12% 0.87% 0.87% 0.71% 0.04% 0.04% 0.03% 2020 2021 2022 Q2'23 2020 2021 2022 Q2'23 Net Charge-Offs (Recoveries) to Average Loans Allowance for Credit Losses 1.12% 0.98% 0.94% 0.82% 0.04% 0.00% 0.00% $93.7 $87.0 $85.1 (0.01%) $65.0 2020 2021 2022
Q2'23 2020 2021 2022 Q2'23 ACL ACL % Total Loans cbbank.com 22 ACL ($ in Millions) Allowance % Total Loans

Net Charge-Offs / Average Loans (%) CVBF KRX 0.08% 0.06% 0.06% 0.05%
0.05% 0.05% 0.04% 0.04% 0.04% 0.04% 0.04% 0.04% 0.03% 0.03% 0.03% 0.03% 0.03% 0.02% 0.02% 0.02% 0.01% 0.01% 0.01% 0.00% 0.00% 0.00% 0.00% 0.00% 0.00% 0.00% 0.00% 0.00% 0.00% 0.00% 0.00% 0.00% 0.00% 0.00% 0.00% -0.01% -0.01% -0.01% -0.03% * Source:
S&P Capital IQ. Unweighted Average NASDAQ Regional Banking Index KRX cbbank.com 23

NPA / Average Assets (%) CVBF KRX 0.63% 0.61% 0.56% 0.51% 0.51% 0.51%
0.49% 0.49% 0.47% 0.47% 0.45% 0.45% 0.42% 0.37% 0.33% 0.30% 0.30% 0.28% 0.28% 0.28% 0.27% 0.18% 0.17% 0.17% 0.14% 0.13% 0.12% 0.12% 0.12% 0.12% 0.10% 0.10% 0.09% 0.09% 0.08% 0.08% 0.06% 0.06% 0.05% 0.04% 0.04% 0.04% 0.03% * Source: S&P Capital
IQ. Unweighted Average NASDAQ Regional Banking Index KRX cbbank.com 24

Classified Loans / Total Loans (%) CVBF KRX 2.1% 2.1% 2.0% 1.9% 1.8%
1.8% 1.7% 1.6% 1.6% 1.6% 1.5% 1.5% 1.5% 1.5% 1.5% 1.5% 1.4% 1.4% 1.3% 1.2% 1.2% 1.1% 1.0% 1.0% 0.9% 0.9% 0.9% 0.9% 0.9% 0.8% 0.8% 0.8% 0.8% 0.7% 0.7% 0.7% 0.7% 0.7% 0.7% 0.7% 0.6% 0.6% 0.6% * Source: S&P Capital IQ. Unweighted Average NASDAQ
Regional Banking Index KRX cbbank.com 25

Classified Loan Trend ($ in Millions) $78.66 $77.83 $76.17 $1.74 $2.11
$9.33 $66.98 $9.97 $12.94 $64.11 $63.65 Other* $1.77 $12.26 $6.87 $5.09 $5.99 $12.05 SFR mortgage $10.63 $10.37 $11.57 $7.64 SBA $17.34 $12.17 $20.75 $2.32 $9.00 Dairy & livestock and $16.58 agribusiness $1.53 $10.03 Commercial and $3.65
industrial $41.44 $38.10 CRE - Non-owner $33.88 $32.80 occupied $29.12 $24.62 CRE - Owner occupied Q1 2022 Q2 2022 Q3 2022 Q4 2022 Q1 2023 Q2 2023 *Other includes other loan segments that are not listed above, such as Construction and Consumer.
cbbank.com 26

CECL Update Highlights Allowance for Credit Losses – by Loan Type
3/31/2023 6/30/2023 Variance ($ in Millions) ✓ Provision for credit loss of $0.5mm in Q2 2023 ACL % of ACL % of ACL % of ✓ Lifetime historical loss models - Macroeconomic Segmentation Balance Loans Balance Loans Balance Loans variables
include GDP, Unemployment Rate, & $8.9 1.00% $9.1 0.95% $0.2 -0.05% C&I CRE price index $2.7 0.95% $0.0 -0.01% $2.7 0.96% SBA ✓ Weighting of multiple forecasts Real estate: Key Economic Assumptions – Weighted Forecast $67.1
0.97% $67.9 0.98% $0.8 0.01% Commercial RE FY’23 FY’24 FY’25 $1.2 1.69% $(0.5) -0.30% $1.7 1.99% Construction 1.5% 0.8% 2.0% GDP % Change $0.4 0.16% $0.4 0.17% $0.0 0.01% SFR Mortgage 3.8% 5.0% 5.0% Unempl. Rate $5.0 1.66% $0.2
0.11% $4.8 1.55% Dairy & livestock $0.3 0.36% $0.3 0.35% $0.0 -0.01% Q2 2023 Allowance by Portfolio Municipal lease $0.6 0.84% $0.4 0.73% $(0.2) -0.11% Consumer and other (Excluding PPP) $86.5 0.97% $87.0 0.98% $0.5 0.01% Sub Total 0.00% PPP
$0.0 0.00% $0.0 0.00% $0.0 0.01% $86.5 0.97% $87.0 0.98% $0.5 Total 78% 11% Commercial real estate: 78% Commercial and industrial: 11% Dairy & livestock and agribusiness: 6% SBA: 3% 6% Construction: 1% Consumer and other loans: 0% 3% SFR
mortgage: 1% 1% Municipal lease finance receivable: 0% 0% PPP: 0% 0% cbbank.com 27

Loans by Type C&I CRE Owner $0.96B 28.0% Commercial and industrial
10.7% Dairy & livestock and agribusiness 3.3% CRE $6.90B SBA 3.1% SFR mortgage 3.0% Construction 0.8% CRE Non-Owner Municipal lease 49.5% finance receivable 0.9% Consumer and other Other loans $1.05B 0.6% cbbank.com 28

Loan Trends ($ in Millions) Q2 2023 vs Q2 2022 $9,079 $8,942 $8,907
$8,774 $8,692 Total +$215 2% growth $6,950 $6,904 CRE +$260 $6,885 $6,685 $6,644 4% growth C&I $15 $956 $952 $949 $942 $898 Other($66) $536 $521 $517 $503 $470 D&L and Agribus. $297 $323 $308 $298 $434 +$25 $297 $291 $283 $274 $279 SBA($18)
Q2 2022 Q3 2022 Q4 2022 Q1 2023 Q2 2023 *Other includes other loan segments that are not listed above, such as Construction, SFR Mortgage. cbbank.com 29

Commercial Real Estate Loans Collateral Type Owner/Non-Owner Occupied
Other RE Rental Non- Medical and Leasing Farmland Owner 5% 3% 7% 64% Industrial Other 33% 9% Multi- Family 12% Owner Retail Office 36% 14% 17% cbbank.com 30

CRE by Collateral Origination Year Balance % of Avg. Size Classified
Collateral LTV at 2018 or ($ in Owner ($ in ($ in 2023 2022 2021 2020 2019 Type Origination earlier Millions) Occupied Millions) Millions) Industrial $ 2,288 49% 50% $ 1.62 $ 6.96 6% 20% 19% 12% 7% 36% 1,144 25% 55% 1.67 2.24 1% 23% 15% 17% 9% 35%
Office Retail 980 11% 48% 1.72 2.81 4% 22% 18% 13% 7% 36% Multi- 837 0% 49% 1.59 - 7% 21% 19% 19% 11% 23% Family Other 607 56% 47% 1.50 13.68 6% 14% 18% 11% 13% 38% Farmland 518 99% 46% 1.52 26.85 2% 21% 17% 21% 11% 28% 319 33% 58% 1.53 2.91 1% 12%
17% 14% 7% 49% Medical Other RE Rental & 211 9% 50% 1.94 - 11% 22% 15% 5% 6% 41% Leasing $ 6,904 36% 50% $ 1.62 $ 55.44 5% 20% 18% 14% 9% 34% Total cbbank.com 31

CRE Office by Loan Amount Balance Rate Resets Next % of Maturing Next
24 Avg. Balance Classified Balance Loan Amount 24 Months ($ in Millions) ($ in Millions) Owner Occupied ($ in Millions) months ($ in Millions) ($ in Millions) Greater than $20M $ 23 0% $ 23 $ 0 $ 0 $ 0 $10M to $20M 126 25% 14 0 12 23 $5M to $10M 275
17% 7 0 39 37 $1M to $5M 560 25% 2 1 72 87 Less than $1M 160 44% 0 1 23 22 Total $ 1,144 $ 146 $ 150 $296mm (or 26%) of CRE office loans mature or reprice in the next 24 months. cbbank.com 32

CRE Office Loans by Major MSA San Francisco County • Total
Balance of $476,000 (1 loan) Los Angeles County • Total Balance of $415mm (207 loans) San Diego County • Total Balance of $86mm (25 loans) Note: Only shows the office loans that are in the major MSA. cbbank.com 33

Greater LA Business Density Distribution % of Market Description $ Loan
LTV at Avg. Owner Classified Origination ($ in Thousands) Balance Loan Size Occupied West LA $ 84,952 19% 52% $ 4,471 $ 0 (HBD) Other West LA 69,966 20% 52% 2,186 0 North LA (HBD) 50,782 17% 45% 1,494 0 Other North LA 44,015 18% 47% 1,295 0 Downtown
LA (HBD) 583 100% 6% 583 0 Note: Darker Shaded areas represent higher density of businesses within each submarket (HBD) Other Central LA 42,504 28% 48% 2,237 0 • West LA includes Santa Monica and Century City • Central LA includes
Downtown LA Other LA 122,603 35% 50% 1,803 0 • North LA includes Pasadena and Burbank • Other LA (includes remaining areas of LA) Total $415,405 25% 49% $ 2,007 $ 0 cbbank.com 34

Greater SD Business Density Distribution % of Area $ Loan LTV at Owner
Avg. Size Classified Balance Origination ($ in thousands) Occupied Downtown SD (HBD) $ 3,871 41% 54% $ 1,290 $ 0 Other SD 81,659 0% 51% 3,711 0 • Darker shaded areas represent Higher Business Density (HBD) Total $ 85,530 2% 51% $ 3,421 $ 0
cbbank.com 35

Greater SF Business Density Distribution % of Area $ Loan LTV at Owner
Avg. Size Classified Origination ($ in thousands) Balance Occupied Downtown SF (HBD) $ 476 0% 3% $ 476 $ 0 Other SF 0 0% 0% 0 0 • Darker shaded areas represent Higher Business Density (HBD) Total $ 476 0% 3% $ 476 $ 0 cbbank.com 36

C&I by Industry % of Balance C&I Industry ($ in Millions)
Wholesale Trade: 9% Manufacturing: 13% Total Real Estate Rental and Leasing $ 208 22% Manufacturing 128 13% Construction: 8% Wholesale Trade 88 9% Real Estate Rental and Leasing: 22% Construction 78 8% Arts, Entertainment, and Recreation 74 8% Arts,
Administrative and Support and Entertainment, Waste Management and 65 7% and Recreation: Remediation Services 8% Professional, Scientific, and Technical Other: 19% 46 5% Services Administrative and Health Care and Social Assistance 46 5% Support and
Waste Management and Transportation and Warehousing 43 4% Remediation Services: 7% Other 180 19% Professional, Scientific, and Technical Services: Total $ 956 100% 5% Health Care and Social Assistance: 5% Transportation and Warehousing: 4%
cbbank.com 37

Line Utilization Trends 81% 78% 71% 69% 67% 69% 68% 68% 66% 53% 53% 49%
52% 50% 52% 51% 47% 49% 45% 48% 47% 47% 45% 46% 46% 41% 43% 41% 39% 32% 33% 31% 29% 32% 31% 29% 31% 27% 28% 28% 27% 26% Total D&L C&I cbbank.com 38 Q1 2020 Q2 2020 Q3 2020 Q4 2020 Q1 2021 Q2 2021 Q3 2021 Q4 2021 Q1 2022 Q2 2022 Q3 2022 Q4
2022 Q1 2023 Q2 2023 Q1 2020 Q2 2020 Q3 2020 Q4 2020 Q1 2021 Q2 2021 Q3 2021 Q4 2021 Q1 2022 Q2 2022 Q3 2022 Q4 2022 Q1 2023 Q2 2023 Q1 2020 Q2 2020 Q3 2020 Q4 2020 Q1 2021 Q2 2021 Q3 2021 Q4 2021 Q1 2022 Q2 2022 Q3 2022 Q4 2022 Q1 2023 Q2
2023

Relationship-Centered Deposit Base 100% Core Deposits - 0% Brokered
Deposits June 30, 2023 June 30, 2022 Total Deposits & Customer Repos Total Deposits & Customer Repos Repos Repos 3% 4% Interest-bearing Interest-bearing 36% 35% Noninterest-bearing 61% Noninterest-bearing 61% Cost of Interest-Bearing
Deposits and Repos June 2022 June 2023 0.10% 1.04% cbbank.com 39

Diverse Deposit Base Consumer Manufacturing 24% 10% Other Real Estate
Rental and Leasing 7% Other Industries Construction 10% 7% Agriculture, Forestry, Fishing and Hunting 2% Public Administration Transportation and 6% Warehousing 2% Educational Services 2% Finance and Insurance Retail Trade 6% 3% Wholesale Trade 3%
Property Management Health Care and Professional, Social Assistance 5% Scientific, and 4% Escrow and Title Technical Services 5% 4% *Other Industries include various industries that represent less than 2%. cbbank.com 40

Business vs Consumer Deposits Q1 2022 Q2 2023 Non- Non- Analyzed
Analyzed Business Business Consumer Accounts Accounts Consumer 24% 35% 35% 25% Analyzed Analyzed Business Business Accounts Accounts 41% 40% cbbank.com 41

Deposit Relationship Tenure Q1 2022 Q4 2022 Q2 2023 Over 10 Over 10
Over 10 Years Years Years 3 to 10 3 to 10 3 to 10 40% 40% 42% Years Years Years 34% 37% 36% Less than 3 Less than 3 Less than 3 Years Years Years 23% 24% 24% > 75% of our customer deposit relationships have banked with CBB for 3 years or more
cbbank.com 42

Brokered Deposits / Total Deposits (%) CVBF KRX 4.99% 4.94% 4.64% 4.63%
4.58% 4.47% 4.43% 4.38% 4.31% 4.10% 3.98% 3.73% 3.43% 3.37% 2.89% 2.76% 2.34% 2.21% 2.20% 2.11% 1.96% 1.94% 1.09% 0.76% 0.76% 0.75% 0.74% 0.74% 0.72% 0.60% 0.59% 0.27% 0.27% 0.00% 0.00% 0.00% 0.00% 0.00% 0.00% 0.00% 0.00% 0.00% 0.00% * Source:
S&P Capital IQ. Unweighted Average NASDAQ Regional Banking Index KRX cbbank.com 43

Cost of Deposits 6.00% CVBF KRX Fed Funds Rate 5.25% 5.00% Current rate
cycle to For the Last 5 Years CVBF Ranked Among the 5 Lowest Cost of Deposits date*: 4.00% of the 50 Banks in the KRX Index CVBF deposit beta = 6.4% 3.00% 2.50% 1.75% 2.00% 1.15% 0.82% 1.00% 0.35% 0.15% 0.25% 0.17% 0.21% 0.03% 0.00% Q1 Q2 Q3 Q4 Q1
Q2 Q3 Q4 Q1 Q2 Q3 Q4 Q1 Q2 Q3 Q4 Q1 Q2 Q3 Q4 Q1 Q2 2018 2019 2020 2021 2022 2023 *Measured as the growth in deposits costs from Q1 2022 through Q2 2023 as a function of growth in the Federal Funds Rate. Source: S&P Capital IQ. Unweighted Average
NASDAQ Regional Banking Index KRX (50 Banks) cbbank.com 44
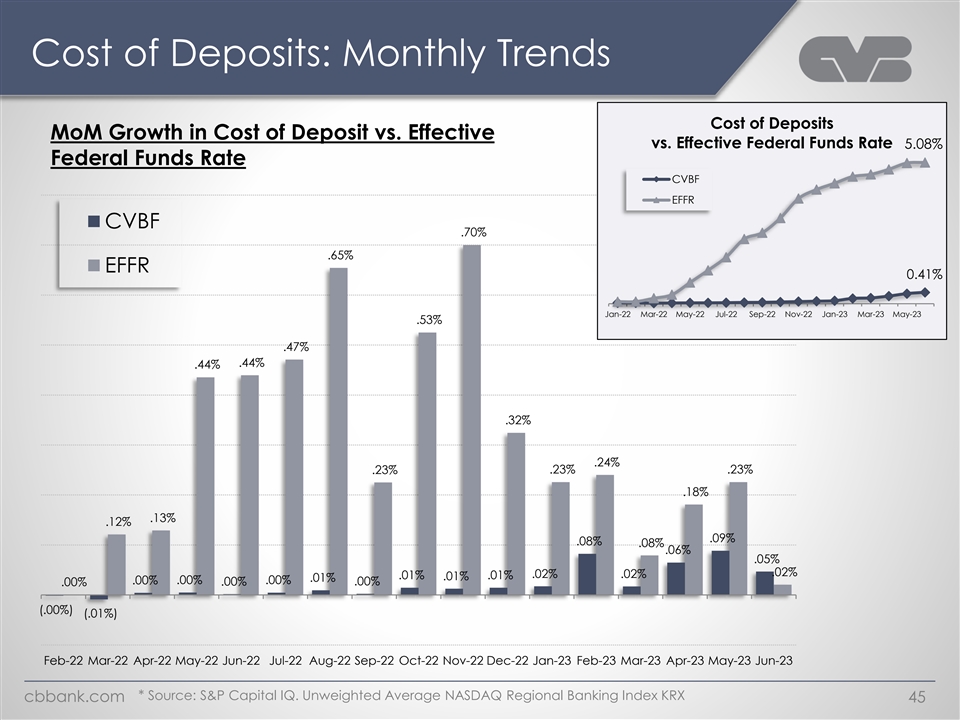
Cost of Deposits: Monthly Trends Cost of Deposits MoM Growth in Cost of
Deposit vs. Effective vs. Effective Federal Funds Rate 5.08% Federal Funds Rate CVBF EFFR CVBF .70% .65% EFFR 0.41% Jan-22 Mar-22 May-22 Jul-22 Sep-22 Nov-22 Jan-23 Mar-23 May-23 .53% .47% .44% .44% .32% .24% .23% .23% .23% .18% .13% .12% .09% .08%
..08% .06% .05% .02% .02% .02% .01% .01% .01% .01% .00% .00% .00% .00% .00% .00% (.00%) (.01%) Feb-22 Mar-22 Apr-22 May-22 Jun-22 Jul-22 Aug-22 Sep-22 Oct-22 Nov-22 Dec-22 Jan-23 Feb-23 Mar-23 Apr-23 May-23 Jun-23 * Source: S&P Capital IQ.
Unweighted Average NASDAQ Regional Banking Index KRX cbbank.com 45

Deposit Characteristics - Uninsured ($ in Billions) Estimated Uninsured
Deposit & Repo Analysis 6/30/23 (1) Total Deposits & Customer Repos $12.8 Less: Insured Deposits (4.3) Less: Collateralized Deposits (1.4) Less: Collateralized Repos (0.5) (2) Est. Uninsured Deposits , excluding items above $6.7 Est.
Uninsured (excluding collateralized) as % of Total Deposits & Customer Repos 52% (1) Total Deposits and Customer Repurchase Agreements as reported on CVB Financial Corp.’s Second Quarter 2023 Earnings Release (2) Est amount of uninsured
deposits of $8.1 billion to be reported on RC-O of the FFIEC 041 Call Report for 6/30/23 cbbank.com 46

Net Interest Income and NIM ($ in Millions) $137.4 $133.3 $2.0 $3.4
$125.7 4.01% $121.9 $1.2 $119.5 3.91% $3.2 $1.0 3.82% 3.51% 3.69% 3.46% 3.45% 3.20% 3.22% 3.16% $135.4 $129.9 $124.6 $118.7 $118.6 0.83% 0.49% 0.13% 0.05% 0.04% Q2'22 Q3'22 Q4'22 Q1'23 Q2'23 Earning Asset Yield Q2'22 Q3'22 Q4'22 Q1'23 Q2'23 Net
Interest Margin PPP interest/fees & Disc Accr Cost of Funds cbbank.com 47

Net Interest Margin Trend CVBF KRX 4.49% 4.40% 4.39% 4.34% 4.24% 4.08%
4.06% 3.82% 3.70% 3.69% 3.68% 3.78% 3.50% 3.74% 3.73% 3.45% 3.69% 3.69% 3.64% 3.64% 3.63% 3.34% 3.33% 3.58% 3.49% 3.22% 3.46% 3.45% 3.18% 3.16% 3.06% 2.96% 3.20% 2.92% 3.17% 2.90% 3.16% 3.12% 3.04% 2.98% 2.89% 2.89% 2.79% Q1 Q2 Q3 Q4 Q1 Q2 Q3 Q4 Q1
Q2 Q3 Q4 Q1 Q2 Q3 Q4 Q1 Q2 Q3 Q4 Q1 Q2 2018 2018 2018 2018 2019 2019 2019 2019 2020 2020 2020 2020 2021 2021 2021 2021 2022 2022 2022 2022 2023 2023 * Source: S&P Capital IQ. Unweighted Average NASDAQ Regional Banking Index KRX cbbank.com
48
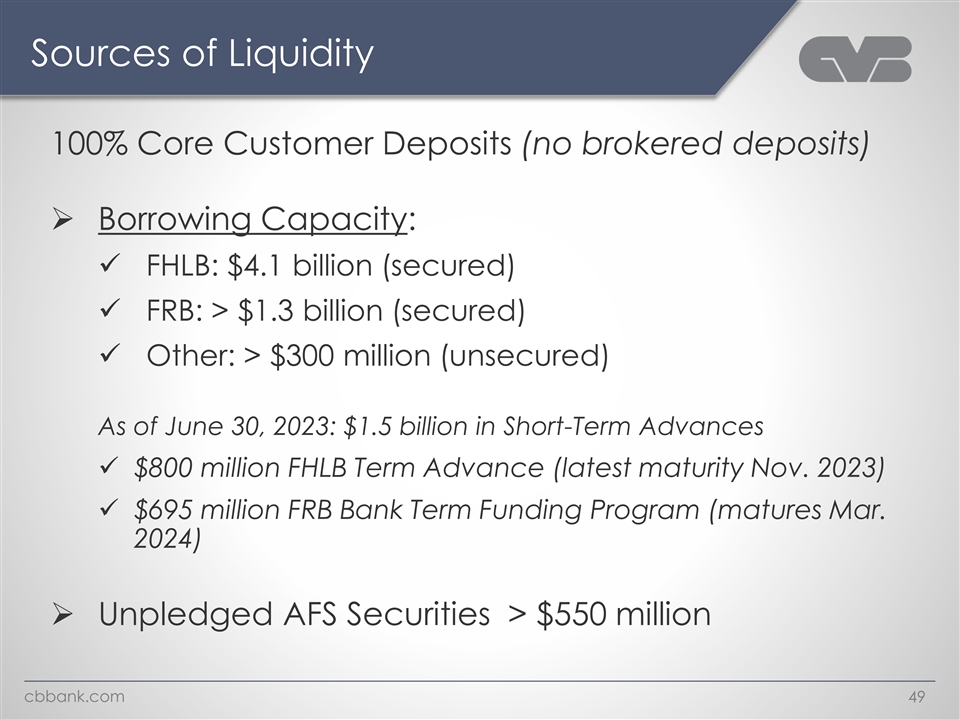
Sources of Liquidity 100% Core Customer Deposits (no brokered deposits)
➢ Borrowing Capacity: ✓ FHLB: $4.1 billion (secured) ✓ FRB: > $1.3 billion (secured) ✓ Other: > $300 million (unsecured) As of June 30, 2023: $1.5 billion in Short-Term Advances ✓ $800 million FHLB Term
Advance (latest maturity Nov. 2023) ✓ $695 million FRB Bank Term Funding Program (matures Mar. 2024) ➢ Unpledged AFS Securities > $550 million cbbank.com 49

Appendix Non-GAAP Reconciliation cbbank.com

Loans by Region # of Average Center Total Loans Loans per % Locations
(6/30/23) Location ($ in Thousands) (6/30/23) Los Angeles County 21 $159,580 $ 3,351,184 37.6% Central Valley and Sacramento 15 139,163 2,087,446 23.4% Orange County 10 112,699 1,126,986 12.7% Inland Empire 9 112,039 1,008,354 11.3% (Riverside &
San Bernardino Counties) Central Coast 5 95,524 477,620 5.4% San Diego 2 172,516 345,031 3.9% Other California 152,945 1.7% Out of State 357,831 4.0% Total 62 $143,668 $ 8,907,397 100.0% cbbank.com 51

Deposits by Region Average # of Center Total Deposits Total Deposits
Deposits per Locations (3/31/23) (6/30/23) Center (6/30/23) (6/30/23) ($ in Thousands) Los Angeles County 21 $4,989,500 $5,216,235 $248,392 Inland Empire 9 3,469,225 3,484,676 387,186 (Riverside & San Bernardino Counties) Central Valley and
Sacramento 15 2,130,360 2,042,311 136,154 Orange County 10 1,660,544 1,620,535 162,054 Central Coast 5 407,159 388,666 77,733 San Diego 2 105,317 97,470 48,735 Total 62 $12,762,105 $12,849,894 $207,256 *Includes Customer Repurchase Agreements.
cbbank.com 52

Reconciliation of Return on Average Tangible Common Equity (Non-GAAP)
The return on average tangible common equity is a non-GAAP disclosure. We use certain non-GAAP financial measures to provide supplemental information regarding our performance. We believe that presenting the return on average tangible common equity
provides additional clarity to the users of our financial statements. For the Year Ended December 31, Three Months Ended June 30, March 31, June 30, 2019 2020 2021 2022 2022 2023 2023 (Dollars in thousands) Net Income $ 207,827 $ 177,159 $ 212,521 $
235,425 $ 59,058 $ 59,270 $ 55,770 Add: Amortization of intangible assets 10,798 9,352 8,240 7,566 1,998 1,720 1,719 Less: Tax effect of amortization of intangible assets [1] (3,192) (2,765) (2,436) (2,237) (591) (508) (508) Tangible net income $
215,433 $ 183,746 $ 218,325 $ 240,754 $ 60,465 $ 60,482 $ 56,981 Average stockholders' equity $ 1,939,961 $ 1,991,664 $ 2,063,360 $ 2,066,463 $ 2,091,454 $ 1,978,244 $ 2,027,708 Less: Average goodwill (665,026) (663,707) (663,707) (764,143)
(765,822) (765,822) (765,822) Less: Average intangible assets (48,296) (38,203) (29,328) (25,376) (26,381) ( 20,983) (19,298) Average tangible common equity $ 1,226,639 $ 1,289,754 $ 1,370,325 $ 1,276,944 $ 1,299,251 $ 1,191,439 $ 1,242,588 Return
on average equity, annualized [2] 10.71% 8.90% 10.30% 11.39% 11.33% 12.15% 11.03% Return on average tangible common equity, annualized [2] 17.56% 14.25% 15.93% 18.85% 18.67% 20.59% 18.39% [1] Tax effected at respective statutory rates. [2]
Annualized where applicable. cbbank.com 53

Reconciliation of PTPP Return on Average Assets (Non-GAAP) The
Pretax-pre provision income (“PTPP”) return on average assets is a non-GAAP disclosure. We use certain non- GAAP financial measures to provide supplemental information regarding our performance. We believe that presenting the return on
average tangible common equity provides additional clarity to the users of our financial statements. Year Ended December 31, Three Months Ended June 30, March 31, June 30, 2019 2020 2021 2022 2022 2023 2023 (Dollars in thousands) Net Income $ 2
07,827 $ 1 77,159 $ 2 12,521 $ 2 35,425 $ 59,058 $ 59,270 $ 55,770 Add: Provision for(recapture of) credit losses 5,000 23,500 (25,500) 10,600 3,600 1,500 500 Add: Income tax expense 83,247 72,361 85,127 92,922 23,081 23,279 21,904 Pretax-pre
provision income $ 2 96,074 $ 2 73,020 $ 2 72,148 $ 3 38,947 $ 85,739 $ 84,049 $ 78,174 Average total assets $ 11,302,901 $ 12,929,813 $ 15,350,521 $ 16,911,661 $ 17,006,948 $ 16,313,136 $ 16,456,524 Return on average assets [1] 1.84% 1.37% 1.38%
1.39% 1.39% 1.47% 1.36% PTPP Return on average assets [1] 2.62% 2.11% 1.77% 2.00% 2.02% 2.09% 1.91% [1] Annualized where applicable. cbbank.com 54

Copy of presentation at www.cbbank.com cbbank.com
v3.23.2
| X |
- DefinitionBoolean flag that is true when the XBRL content amends previously-filed or accepted submission.
| Name: |
dei_AmendmentFlag |
| Namespace Prefix: |
dei_ |
| Data Type: |
xbrli:booleanItemType |
| Balance Type: |
na |
| Period Type: |
duration |
|
| X |
- DefinitionFor the EDGAR submission types of Form 8-K: the date of the report, the date of the earliest event reported; for the EDGAR submission types of Form N-1A: the filing date; for all other submission types: the end of the reporting or transition period. The format of the date is YYYY-MM-DD.
| Name: |
dei_DocumentPeriodEndDate |
| Namespace Prefix: |
dei_ |
| Data Type: |
xbrli:dateItemType |
| Balance Type: |
na |
| Period Type: |
duration |
|
| X |
- DefinitionThe type of document being provided (such as 10-K, 10-Q, 485BPOS, etc). The document type is limited to the same value as the supporting SEC submission type, or the word 'Other'.
| Name: |
dei_DocumentType |
| Namespace Prefix: |
dei_ |
| Data Type: |
dei:submissionTypeItemType |
| Balance Type: |
na |
| Period Type: |
duration |
|
| X |
- DefinitionAddress Line 1 such as Attn, Building Name, Street Name
| Name: |
dei_EntityAddressAddressLine1 |
| Namespace Prefix: |
dei_ |
| Data Type: |
xbrli:normalizedStringItemType |
| Balance Type: |
na |
| Period Type: |
duration |
|
| X |
- Definition
+ References
+ Details
| Name: |
dei_EntityAddressCityOrTown |
| Namespace Prefix: |
dei_ |
| Data Type: |
xbrli:normalizedStringItemType |
| Balance Type: |
na |
| Period Type: |
duration |
|
| X |
- DefinitionCode for the postal or zip code
| Name: |
dei_EntityAddressPostalZipCode |
| Namespace Prefix: |
dei_ |
| Data Type: |
xbrli:normalizedStringItemType |
| Balance Type: |
na |
| Period Type: |
duration |
|
| X |
- DefinitionName of the state or province.
| Name: |
dei_EntityAddressStateOrProvince |
| Namespace Prefix: |
dei_ |
| Data Type: |
dei:stateOrProvinceItemType |
| Balance Type: |
na |
| Period Type: |
duration |
|
| X |
- DefinitionA unique 10-digit SEC-issued value to identify entities that have filed disclosures with the SEC. It is commonly abbreviated as CIK. Reference 1: http://www.xbrl.org/2003/role/presentationRef
-Publisher SEC
-Name Exchange Act
-Number 240
-Section 12
-Subsection b-2
| Name: |
dei_EntityCentralIndexKey |
| Namespace Prefix: |
dei_ |
| Data Type: |
dei:centralIndexKeyItemType |
| Balance Type: |
na |
| Period Type: |
duration |
|
| X |
- DefinitionIndicate if registrant meets the emerging growth company criteria. Reference 1: http://www.xbrl.org/2003/role/presentationRef
-Publisher SEC
-Name Exchange Act
-Number 240
-Section 12
-Subsection b-2
| Name: |
dei_EntityEmergingGrowthCompany |
| Namespace Prefix: |
dei_ |
| Data Type: |
xbrli:booleanItemType |
| Balance Type: |
na |
| Period Type: |
duration |
|
| X |
- DefinitionCommission file number. The field allows up to 17 characters. The prefix may contain 1-3 digits, the sequence number may contain 1-8 digits, the optional suffix may contain 1-4 characters, and the fields are separated with a hyphen.
| Name: |
dei_EntityFileNumber |
| Namespace Prefix: |
dei_ |
| Data Type: |
dei:fileNumberItemType |
| Balance Type: |
na |
| Period Type: |
duration |
|
| X |
- DefinitionTwo-character EDGAR code representing the state or country of incorporation.
| Name: |
dei_EntityIncorporationStateCountryCode |
| Namespace Prefix: |
dei_ |
| Data Type: |
dei:edgarStateCountryItemType |
| Balance Type: |
na |
| Period Type: |
duration |
|
| X |
- DefinitionThe exact name of the entity filing the report as specified in its charter, which is required by forms filed with the SEC. Reference 1: http://www.xbrl.org/2003/role/presentationRef
-Publisher SEC
-Name Exchange Act
-Number 240
-Section 12
-Subsection b-2
| Name: |
dei_EntityRegistrantName |
| Namespace Prefix: |
dei_ |
| Data Type: |
xbrli:normalizedStringItemType |
| Balance Type: |
na |
| Period Type: |
duration |
|
| X |
- DefinitionThe Tax Identification Number (TIN), also known as an Employer Identification Number (EIN), is a unique 9-digit value assigned by the IRS. Reference 1: http://www.xbrl.org/2003/role/presentationRef
-Publisher SEC
-Name Exchange Act
-Number 240
-Section 12
-Subsection b-2
| Name: |
dei_EntityTaxIdentificationNumber |
| Namespace Prefix: |
dei_ |
| Data Type: |
dei:employerIdItemType |
| Balance Type: |
na |
| Period Type: |
duration |
|
| X |
- DefinitionLocal phone number for entity.
| Name: |
dei_LocalPhoneNumber |
| Namespace Prefix: |
dei_ |
| Data Type: |
xbrli:normalizedStringItemType |
| Balance Type: |
na |
| Period Type: |
duration |
|
| X |
- DefinitionBoolean flag that is true when the Form 8-K filing is intended to satisfy the filing obligation of the registrant as pre-commencement communications pursuant to Rule 13e-4(c) under the Exchange Act. Reference 1: http://www.xbrl.org/2003/role/presentationRef
-Publisher SEC
-Name Exchange Act
-Number 240
-Section 13e
-Subsection 4c
| Name: |
dei_PreCommencementIssuerTenderOffer |
| Namespace Prefix: |
dei_ |
| Data Type: |
xbrli:booleanItemType |
| Balance Type: |
na |
| Period Type: |
duration |
|
| X |
- DefinitionBoolean flag that is true when the Form 8-K filing is intended to satisfy the filing obligation of the registrant as pre-commencement communications pursuant to Rule 14d-2(b) under the Exchange Act. Reference 1: http://www.xbrl.org/2003/role/presentationRef
-Publisher SEC
-Name Exchange Act
-Number 240
-Section 14d
-Subsection 2b
| Name: |
dei_PreCommencementTenderOffer |
| Namespace Prefix: |
dei_ |
| Data Type: |
xbrli:booleanItemType |
| Balance Type: |
na |
| Period Type: |
duration |
|
| X |
- DefinitionTitle of a 12(b) registered security. Reference 1: http://www.xbrl.org/2003/role/presentationRef
-Publisher SEC
-Name Exchange Act
-Number 240
-Section 12
-Subsection b
| Name: |
dei_Security12bTitle |
| Namespace Prefix: |
dei_ |
| Data Type: |
dei:securityTitleItemType |
| Balance Type: |
na |
| Period Type: |
duration |
|
| X |
- DefinitionName of the Exchange on which a security is registered. Reference 1: http://www.xbrl.org/2003/role/presentationRef
-Publisher SEC
-Name Exchange Act
-Number 240
-Section 12
-Subsection d1-1
| Name: |
dei_SecurityExchangeName |
| Namespace Prefix: |
dei_ |
| Data Type: |
dei:edgarExchangeCodeItemType |
| Balance Type: |
na |
| Period Type: |
duration |
|
| X |
- DefinitionBoolean flag that is true when the Form 8-K filing is intended to satisfy the filing obligation of the registrant as soliciting material pursuant to Rule 14a-12 under the Exchange Act. Reference 1: http://www.xbrl.org/2003/role/presentationRef
-Publisher SEC
-Name Exchange Act
-Section 14a
-Number 240
-Subsection 12
| Name: |
dei_SolicitingMaterial |
| Namespace Prefix: |
dei_ |
| Data Type: |
xbrli:booleanItemType |
| Balance Type: |
na |
| Period Type: |
duration |
|
| X |
- DefinitionTrading symbol of an instrument as listed on an exchange.
| Name: |
dei_TradingSymbol |
| Namespace Prefix: |
dei_ |
| Data Type: |
dei:tradingSymbolItemType |
| Balance Type: |
na |
| Period Type: |
duration |
|
| X |
- DefinitionBoolean flag that is true when the Form 8-K filing is intended to satisfy the filing obligation of the registrant as written communications pursuant to Rule 425 under the Securities Act. Reference 1: http://www.xbrl.org/2003/role/presentationRef
-Publisher SEC
-Name Securities Act
-Number 230
-Section 425
| Name: |
dei_WrittenCommunications |
| Namespace Prefix: |
dei_ |
| Data Type: |
xbrli:booleanItemType |
| Balance Type: |
na |
| Period Type: |
duration |
|
CVB Financial (NASDAQ:CVBF)
Historical Stock Chart
From Apr 2024 to May 2024

CVB Financial (NASDAQ:CVBF)
Historical Stock Chart
From May 2023 to May 2024
