FORM
6-K
SECURITIES
AND EXCHANGE COMMISSION
WASHINGTON,
D.C. 20549
Report
of Foreign Issuer
Pursuant
to rule 13a-16 or 15d-16 of
The
Securities Exchange Act of 1934
CANARC
RESOURCE CORP.
Suite
301 - 700 West Pender Street, Vancouver, British Columbia, V6C 1G8
EXHIBIT
LIST
99.1 Techincal
Report for the El Compas Project
99.2 Consent
of Qualified Person Lisa Bascombe
99.3 Consent
of Qualified Person Sean Butler
99.4 Consent
of Qualified Person John Michael Collins
99.5 Consent
of Qualified Person Neil Schunke
99.6 Consent
of Qualified Person Frank Wright
SIGNATURES
Pursuant
to the requirements of the Securities Exchange Act of 1934, the registrant has duly caused this report to be signed on its behalf
by the undersigned, thereunto duly authorized.
Canarc
Resource Corp.
(Registrant)
Date: February 11, 2016
/s/
Catalin Chiloflischi
Catalin
Chiloflischi
Chief Executive Officer
Canarc Resource Corp.
NI 43-101 Technical Report for the El Compas Project
Zacatecas State, Mexico
February 2016
Prepared for:
Canarc Resource Corp.
#301-700 West Pender Street
Vancouver, BC
V6C 1G8
Prepared By:
John Michael Collins, P.Geo.
Neil Schunke, P.Eng.
Sean Butler, P.Geo.
Lisa Bascombe, MAIG
Frank Wright, P.Eng.
Effective Date: January 19th, 2016
Report Date: February/ 4th, 2016
| |  | 2 |

Document Control Information
 |
Canarc Resource Corp.
NI 43-101 Technical Report for the El Compas
Project, Zacatecas State, Mexico
February 2016 |
REVISION |
| No. |
DATE |
| |
0 |
02/04/2016 |
Revision Tracking
| Revision: |
Prepared By: |
Reviewed By: |
Issued For: |
Approved By: |
Date: |
Signature: |
| 0 |
S Butler, M Collins, F Wright, L Bascombe, N Schunke |
J Bothwell |
FV |
N Schunke |
02/04/2016 |
|
| |
|
|
|
|
|
|
| |
|
|
|
|
|
|
Issued for: Review and Comment (RC),
Information Only (IO), Implementation (IM), Final Version (FV).
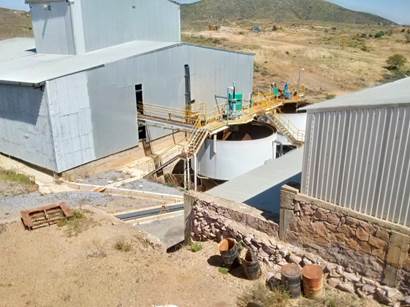
Cover photo is a view of the La Plata
processing facility
| | | 3 |
Certificates
CERTIFICATE OF AUTHOR
I, John Michael William Collins, P.Geo.,
do hereby certify that:
| 1. | I am currently employed as Manager North America by Mining Plus Canada Consulting Ltd., 440 - 580
Hornby St., Vancouver, BC, Canada. |
| 2. | This certificate applies to the Technical Report titled “Canarc Resource Corp., NI 43-101
Technical Report for the El Compas Project, Zacatecas State, Mexico” with effective date January 19th, 2016 (the
“Technical Report”). |
| 3. | I am a graduate of the University of Dalhousie and received a Bachelor of Science degree with Honours
in Earth Sciences in 1996. |
| 4. | I am a Registered Professional Geologist in the provinces of Ontario (No. 0828) and British Columbia,
Canada (No. 38766). |
| 5. | I have worked in exploration geology and project management for 15 years. I have worked as a consulting
geologist for companies for 11 years and for Mining Plus Canada Consulting Ltd. for 3 years. |
| 6. | I visited the El Compas Property on October 19th, 2015. |
| 7. | I am responsible for Sections 2-12, 18, 20 and parts of Sections 1 and 25-27 related to exploration
and mineral resources of the Technical Report. |
| 8. | I am independent of Canarc Resource Corp. applying all of the tests in section 1.5 of NI 43-101. |
| 9. | I have no prior involvement with the property that is the subject of this Technical Report. |
| 10. | I have read NI 43-101 and Form 43-101F1, and the Technical Report has been prepared in compliance
with that instrument and form. |
| 11. | As of the effective date of the Technical Report, to the best of my knowledge, information and
belief, the Technical Report contains all scientific and technical information required to be disclosed to make the report not
misleading. |
| 12. | I have read the definition of “qualified person” set out in National Instrument 43-101
(“NI 43-101”) and certify that by reason of my education, affiliation with a professional association (as defined in
NI 43-101) and past relevant work experience, I fulfill the requirements to be a “qualified person” for the purposes
of NI 43-101. |
| 13. | I consent to the filing of the Technical Report with any stock exchange and other regulatory authority
and any publication by them for regulatory purposes, including electronic publication in the public company files on their websites
accessible by the public, of the Technical Report. |
Dated February 4th, 2016.
“Signed and Sealed”
John Michael William Collins P.Geo.
| | | 4 |
CERTIFICATE OF AUTHOR
I, Neil Schunke, MAusIMM (CP Mining),
P.Eng., do hereby certify that:
| 1. | I am currently employed as a Principal Mining Consultant by Mining Plus Canada Consulting Ltd.,
Suite 440 - 580 Hornby Street, Vancouver BC V6C 3B6. |
| 2. | This certificate applies to the Technical Report titled “Canarc Resource Corp., NI 43-101
Technical Report for the El Compas Project, Zacatecas State, Mexico” with effective date January 19th, 2016 (the
“Technical Report”). |
| 3. | I graduated in 2000 from the University of South Australia with a Bachelor of Engineering (Mining)
degree and a Bachelor of Science (Applied Geology) degree. |
| 4. | I am a member in good standing of the AusIMM (Member No. 113025) holding accreditation as Chartered
Professional (Mining) and the Association of Professional Engineers and Geoscientists of British Columbia, Canada, Professional
Engineer (No. 42320). |
| 5. | I have practiced in my profession for 15 years in the areas of underground production mining and
consulting. |
| 6. | I visited the El Compas Property on October 19, 2015. |
| 7. | I am responsible for Sections, 15-16, 18-19, 21-22 and parts of Sections 1 and 25-26 related to
mining engineering, infrastructure and economics of the Technical Report. |
| 8. | I am independent of Canarc Resource Corp. applying all of the tests in section 1.5 of NI 43-101. |
| 9. | I have no prior involvement with the property that is the subject of this Technical Report. |
| 10. | I have read NI 43-101 and Form 43-101F1, and the Technical Report has been prepared in compliance
with that instrument and form. |
| 11. | As of the effective date of the Technical Report, to the best of my knowledge and information the
Technical Report contains all scientific and technical information required to be disclosed to make the report not misleading. |
| 12. | I have read the definition of “qualified person” set out in National Instrument 43-101
(“NI 43-101”) and certify that by reason of my education, affiliation with a professional association (as defined in
NI 43-101) and past relevant work experience, I fulfil the requirements to be a “qualified person” for the purposes
of NI 43-101. |
| 13. | I consent to the filing of the Technical Report with any stock exchange and other regulatory authority
and any publication by them for regulatory purposes, including electronic publication in the public company files on their websites
accessible by the public, of the Technical Report. |
Dated February 4th, 2016
“Signed and Sealed”
Neil Schunke, MAusIMM, P.Eng.
| | | 5 |
CERTIFICATE OF AUTHOR
I Sean P. Butler, P.Geo., do hereby
certify that:
| 1. | I am currently employed as a Senior Geology Consultant by Mining Plus Canada Consulting Ltd., Suite
440 - 580 Hornby St., Vancouver, BC, V6C 3B6. |
| 2. | This certificate applies to the Technical Report titled “Canarc Resource Corp., NI 43-101
Technical Report for the El Compas Project, Zacatecas State, Mexico” with effective date January 19th, 2016 (the
“Technical Report”). |
| 3. | I am a graduate with a Bachelor of Science, in Geology from the University of British Columbia
in 1982. |
| 4. | My professional affiliation is member of the Association of Professional Engineers and Geoscientists
of British Columbia, Canada, Professional Geoscientist (No. 19,233). |
| 5. | I have been professionally active in the mining industry for approximately 25 years since graduation
from university. I have worked extensively exploring for both base and precious metals from early stage programs up to advanced
underground exploration and mining. |
| 6. | I have not visited the El Compas property. |
| 7. | I am responsible for Sections 2-12, 15, 20, 23-24 and parts of Sections 26-27 related to geology
of the Technical Report. |
| 8. | I am independent of Canarc Resource Corp. applying all of the tests in section 1.5 of NI 43-101. |
| 9. | I have no prior involvement with the property that is the subject of this Technical Report. |
| 10. | I have read NI 43-101 and Form 43-101-F1, and the Technical Report has been prepared in compliance
with that instrument and form. |
| 11. | As of the effective date of the Technical Report, to the best of the my knowledge, information
and belief, this Technical Report contains all scientific and technical information that is required to be disclosed to make the
Technical Report not misleading. |
| 12. | I have read the definition of "qualified person" set out in National lnstrument 43-101
and certify that by reason of my education, affiliation with a professional association and past relevant work experience, I fulfill
the requirements to be a "qualified person" for the purposes of Nl 43-101. |
| 13. | I consent to the filing of the Technical Report with any stock exchange and other regulatory authority
and any publication by them for regulatory purposes, including electronic publication in the public company files on their websites
accessible by the public, of the Technical Report. |
Dated February 4th, 2016.
“Signed and Sealed”
Sean P. Butler, P.Geo.
| | | 6 |
CERTIFICATE OF AUTHOR
I, Lisa Bascombe of Perth Western Australia,
Australia do hereby certify:
| 1. | That I am a Principal Geologist with Mining Plus with a business address, Bravo building, 1 George
Wiencke Drive, Perth, Western Australia. |
| 2. | This certificate applies to the Technical Report titled “Canarc Resource Corp., NI 43-101
Technical Report for the El Compas Project, Zacatecas State, Mexico” with effective date January 19th, 2016 (the
“Technical Report”). |
| 3. | That I am a member in good standing of the Australian Institute of Geoscientists (AIG), membership
number 3520. |
| 4. | That I am a graduate of Macquarie University, New South Wales, Australia, graduating with BSc Geology
in 1996. |
| 5. | That I have worked as an Exploration Geologist, Underground Mine Geologist, Senior Mine Geologist,
Resource Geologist, Senior Consultant and Principal Consultant for a total of 19 years. |
| 6. | I have read the definition of “qualified person” set out in National Instrument 43-
101 (“NI 43-101”) and certify that I am a “qualified person” for the purposes of NI 43- 101. |
| 7. | That I, Lisa Bascombe have not visited the El Compas Project of Canarc Resource Corp. |
| 8. | I am responsible for section 1.7 of the Executive Summary and Section 14. |
| 9. | I am independent of Canarc as described in Section 1.5 of NI 43-101. |
| 10. | I have had no prior involvement with the property. |
| 11. | I have read NI 43-101 and Form 43-101F1 and the parts of the Technical Report for which I am responsible
for and they have been prepared in compliance with that instrument. |
| 12. | That as of the effective date of the Technical Report, to the best of my knowledge, information
and belief, the parts of the Technical Report for which I am responsible contain all scientific and technical information that
is required to be disclosed to make the Technical Report not misleading. |
| 13. | I consent to the filing of the Technical Report with any stock exchange and other regulatory authority
and any publication by them for regulatory purposes, including electronic publication in the public company files on their websites
accessible by the public, of the Technical Report. |
Signed this 4th day of February,
2016 at Perth, Western Australia, Australia.
“Signed”
Lisa Bascombe BSc, MAIG,
| | | 7 |
CERTIFICATE OF AUTHOR
I, Frank R. Wright, P.Eng., do hereby
certify that:
| 1. | I am a consulting metallurgical engineer with an office at #45-10605 Delsom Cres., Delta, British
Columbia, Canada. |
| 2. | This certificate applies to the Technical Report titled “Canarc Resource Corp., NI 43-101
Technical Report for the El Compas Project, Zacatecas State, Mexico” with effective date January 19th, 2016 (the
“Technical Report”). |
| 3. | I am a graduate of BSc. Metallurgical Engineering in 1979, from University of Alberta, Edmonton,
AB; and with a Bachelor of Business Administration in 1984, from Simon Fraser University, Burnaby, BC. |
| 4. | I am a member in good standing of the Association of Professional Engineers and Geoscientists of
British Columbia, Canada, Professional Engineer (No. 15747). |
| 5. | I have continuously practiced my profession of performing metallurgical and mineral process engineering
for 28 years, both as an employee of various mining and consulting companies, and since 1997 as an independent consultant. |
| 6. | I have not visited the El Compas Property or the La Plata processing facility. |
| 7. | I am responsible for Sections 13, 17 and the parts of Section 26 related to metallurgy of the Technical
Report. |
| 8. | I am independent of Canarc Resource Corp. applying all of the tests in section 1.5 of NI 43-101,
other than providing consulting services. |
| 9. | I have had no prior involvement with the property that is the subject of the Technical Report. |
| 10. | I have read NI 43-101 and Form 43-101-F1, and the Technical Report has been prepared in compliance
with that instrument and form. |
| 11. | As of the effective date of the Technical Report, to the best of the my knowledge, information
and belief, this Technical Report contains all scientific and technical information that is required to be disclosed to make the
Technical Report not misleading. |
| 12. | I have read the definition of "qualified person" set out in National lnstrument 43-101
and certify that by reason of my education, affiliation with a professional association and past relevant work experience, I fulfill
the requirements to be a "qualified person" for the purposes of Nl 43-101. |
| 13. | I consent to the filing of the Technical Report with any stock exchange and other regulatory authority
and any publication by them for regulatory purposes, including electronic publication in the public company files on their websites
accessible by the public, of the Technical Report. |
Dated February 4th, 2016
in North Vancouver, British Columbia.
“Signed and Sealed”
Frank R. Wright, P.Eng.
| | | 8 |
Mining Plus Canada Consulting Ltd. (MP)
has completed a Mineral Resource estimate, economic and technical study of the El Compas gold-silver project in Zacatecas, Mexico
for Canarc Resource Corp. (Canarc) of Vancouver, BC, Canada. The project is wholly owned through Canarc’s Mexican subsidiary
Minera Oro Silver de Mexico S.A. de C.V. (Oro Silver). The mining project is supported by the lease agreement by Oro Silver from
the Zacatecas state government on the nearby La Plata processing facility. The existing processing facility is permitted as a flotation
based operation including a permitted tailings management facility (TMF). Permit revisions may be required if a cyanide leaching
and destruction circuit is developed. This report is prepared to NI 43-101 standards at the Preliminary Economic Assessment (PEA)
level.
The project includes Inferred Mineral
Resources in its economic review. The reader is cautioned that Inferred Resources are considered too speculative geologically to
have the economic considerations applied to them that would enable them to be categorised as Mineral Reserves, and there is no
certainty that Inferred Resources will ever be upgraded to a higher category. The reader is further cautioned that the PEA is preliminary
in nature, and that there is no certainty that the PEA will be realised.
| 1.1 | Property Description and Location |
The El Compas property is 3,943 hectares
in size and covers approximately 2.4km of strike length over the El Compas vein system and 1.2km of strike length over the El Orito
vein system. The 24 mineral concessions are located on the southern outskirts of Zacatecas city, Zacatecas, Mexico. The concessions
are 100% owned by Oro Silver, now a subsidiary of Canarc. The La Plata processing facility is located north of Zacatecas city and
owned by the state government of Zacatecas with a Letter of Intent to lease it to Oro Silver.
The El Compas and El Orito Mineral Resources
are located near the centre of the property, entirely within the El Compas, El Orito and Don Luis Del Oro concessions. There is
a surface access agreement for part of the project to allow development of the mine portal and required surface support.
| 1.2 | Accessibility, Climate, Local Resources, Infrastructure and Physiography |
Access to the El Compas property is
by a one kilometre gravel road from the south end of the city of Zacatecas. Topography is gentle and the climate is mild, allowing
year round operations. Services, supplies and skilled labour are available for operation of a mine in Zacatecas.
Mexico is the largest silver producer
in the world, due significantly to production from Zacatecas state, at Fresnillo and Somberete. Zacatecas city was founded in 1546,
after the discovery of silver vein systems by Juan de Tolosa. The first record of mine development in the El Orito district was
in 1570 with intermittent development up to the Mexican Revolution in 1910. Modern exploration work is from the mid 1990’s
until 2011 and includes multiple diamond drilling campaigns. From 2002 to 2006, Contracuna mined approximately 55,000 tonnes of
ore from El Compas and processed it at a processing facility north of Zacatecas.
| | | 9 |
The modern history of exploration at
El Compas has references to work by Boliden before 2005 but no specific date. Minera Hochschild de Mexico S.A. de C.V. (MHM) completed
work in 2005 that included surface mapping, chip sampling and almost 6,000 metres of diamond drilling. Oro Silver started working
at El Compas in the fall of 2006. Oro Silver completed multiple drill programs to evaluate the El Compas property. Work also included
a survey and chip sampling of the underground workings and ASTER satellite imagery analysis. Three programs of diamond drilling
with some reverse circulation drilling were completed by Oro Silver between 2007 and 2011, for a total of 17,686m of drilling.
Low sulfidation style epithermal veins
occur in the El Orito Zone at El Compas and are unique in the Zacatecas district. They are gold-rich, silver-poor (Ag/Au of about
6.7:1 to 20:1), with very low total sulfide and base metal content. Epithermal veins with a low sulfidation style occur in both
the andesite and phyllite of the Chilitos Formation, and overlying felsic volcanic rocks of the La Virgen Formation.
| 1.5 | Sample Preparation, Analysis and Security |
The sample preparation procedures for
chip and drill core sampling are consistent with industry standards and adequate for a study of this detail.
| 1.6 | Mineral Processing and Metallurgical Testing |
Metallurgical testing was conducted
by SGS Mineral Services (SGS) of Lakefield, Ontario from 2008 to 2010 for Oro Silver with results provided in various historical
SGS reports. In 2015, Tetra Tech Consulting of Golden, Colorado supervised and reported on additional gravity, flotation and leaching
test work on samples that had been stored at the El Compas site. Samples were selected from drill core, reverse circulation chips
and underground channel samples. Collected samples were shipped to the Resource Development Inc. (RDI) laboratory in Golden, Colorado
where the metallurgical testing program was conducted. Tetra Tech supervised and reported on this metallurgical testwork.
The laboratory test data shows that
cyanide tank leaching of whole ore, as well as that of flotation concentrate, had a good response particularly if subjected to
prior gravity treatment. Cyanide gold dissolution of 90% to 96% was readily achieved on whole ore and 98% on flotation concentrate.
Silver dissolution was significantly lower ranging between 40% and 60% for whole ore and 80% for flotation concentrate. Flotation
response provided for optimum gold recoveries in the mid eighty percent range, with a corresponding silver recovery of 70%. Test
results vary depending on the specific testing conditions used as well as the mineralogy and grade of the material tested. Based
on the currently defined Resource, metallurgical results and the fact that there is an existing flotation circuit installed at
the La Plata processing facility, the chosen circuit for treating El Compas potentially economic material is a gravity and flotation
process, followed by cyanide leaching of a flotation concentrate and using Merrill Crowe for recovery of the dissolved precious
metals.
| | | 10 |
| 1.7 | Mineral Resource Estimate |
Mining Plus completed a Mineral Resource
estimate on the El Compas project using Vulcan v9.1 Software. Canarc provided exploration drilling and underground channel sampling
results that had been collected by Marlin Gold and its project predecessors. The sample data was checked and corrected for errors
and incomplete data by MP.
An interpretation of the El Compas and
El Orito vein systems was done by MP using Surpac v6.6 software. This interpretation resulted in the El Orito vein being defined
as two higher grade separate veins or zones, and the El Compas defined as a large “halo” zone with an inner high grade
section. Two small El Orito related sub zones were also modelled.
The drill hole and channel sample results
were combined to calculate the composite grade over the entire mineralised vein intercept length. This method results in the generation
of a single sample for each drill hole intercept within a given mineralised domain. The true thickness sample length has been
used for the length weighting in order to negate the effect of differences in intersection angles between drill holes and channel
samples. A detailed review of the composite statistics by area was undertaken with the view to determining the most appropriate
top cut grades to apply to gold and silver. The intercept length compositing process has reduced much of the grade variability
within the domains with only the main high grade, Domain 2, requiring the capping of extreme values for both gold at 75.0 g/t
and silver at 700.0 g/t. The reduction in coefficient of variation (CV) from 4.34 to 1.69 for gold and 2.05 to 1.55 for silver
confirms that the application of this top cut is robust.
A block model has been created for the
El Compas project area in Vulcan v9.1 3-D (Maptek) modelling software. The block model was sub-divided into a mined and an un-mined
area, due to the increased sample density in the areas that have been mined historically. Sub-celling has been employed at domain
boundaries to allow adequate representation of the domain geometry and volume. The parent block size of 12.5 x 12.5 x 5m was selected
since it approximates half the sectional drill spacing within the deposit. All sub-cells have been estimated within the parent
cell and therefore have the same estimated grade. The blocks in the mined portion of the Resource have been reduced in size to
6.25 x 6.25 x 2.5m.
A bulk density of 2.6 g/cm3
(or tonnes per cubic metre) was assigned to all blocks within the block model.
Final grade estimates have been validated
by statistical analysis and visual comparison to the input drill hole composite data. In areas of high drill hole data density,
the block model grade is seen to closely mimic the composite grade, however in areas of low drill hole data density, the block
model grade deviates from the composite grade. Analysis of the various validation methods indicates that the Mineral Resource Estimate
is an accurate global representation of the input data.
Resource categories have been applied
to the estimation on the basis of drill density, number of available composites, estimation pass and confidence in the estimation.
No portion of the in-situ El Compas Mineral Resource meets the criteria for classification as a Measured Mineral Resource. The
Indicated Mineral Resource category has been applied to the areas within the main mineralised domains (Domains 1, 2, 6 and 7)
which have been estimated in the first and second interpolation passes. The Inferred Resource category has been applied to areas
within the main mineralised domains which have been estimated in the third pass and to all of Domains 4 and 5. The Mineral Resource
estimate has been depleted for the underground mining which is stated to have occurred before 2008 within the digitised level
wireframes provided to MP.
| | | 11 |
The previous Mineral Resource Estimate
for the El Compas deposit was completed in 2011 by SRK Consulting. It is not stated in the documentation provided as to whether
the reported tonnes and grade in the 2011 Mineral Resource estimate are depleted or not. For the sake of this comparison, it is
assumed that this SRK block model has been depleted for the mining that occurred prior to 2008. A comparison between the depleted
MP block model and the 2011 SRK model both reported at a gold cut-off of 2.0 g/t Au, is provided in Table 1-1.
Table 1-1 Comparison between
the 2011 SRK Mineral Resource Estimate and the 2015 MP Mineral Resource Estimate at a 2.0 g/t Au Cut-off
| SRK Mineral Resource Estimate for the El Compas Deposit - 2011 |
| Area |
Cut-Off Au g/t |
Indicated |
Inferred |
| Tonnes |
Au g/t |
Ag g/t |
Au Oz |
Ag Oz |
Tonnes |
Au g/t |
Ag g/t |
Au Oz |
Ag Oz |
| El Compas |
2.0 |
394,000 |
4.2 |
64.4 |
53,203 |
815,527 |
161,000 |
3.3 |
33.3 |
16,926 |
172,525 |
| El Orito |
2.0 |
130,000 |
5.0 |
69.0 |
20,689 |
288,434 |
258,000 |
4.4 |
56.4 |
36,580 |
468,164 |
| Total |
2.0 |
524,000 |
4.4 |
65.5 |
73,892 |
1,103,961 |
419,000 |
4.0 |
47.6 |
53,507 |
640,689 |
| Mineral Resource Estimate for the El Compas Deposit - January 14, 2016 |
| Area |
Cut-Off Au g/t |
Indicated |
Inferred |
| Tonnes |
Au g/t |
Ag g/t |
Au Oz |
Ag Oz |
Tonnes |
Au g/t |
Ag g/t |
Au Oz |
Ag Oz |
| El Compas |
2.0 |
506,987 |
6.7 |
66.7 |
109,948 |
1,086,599 |
128,984 |
3.4 |
58.0 |
14,245 |
240,430 |
| El Orito |
2.0 |
45,291 |
4.3 |
60.5 |
6,324 |
88,042 |
292,310 |
4.5 |
60.8 |
42,375 |
571,353 |
| Total |
2.0 |
552,278 |
6.5 |
66.2 |
116,272 |
1,174,640 |
421,294 |
4.2 |
59.9 |
56,619 |
811,784 |
| % Diff |
El Compas |
29% |
61% |
4% |
107% |
33% |
-20% |
5% |
74% |
-16% |
39% |
| El Orito |
-65% |
-12% |
-12% |
-69% |
-69% |
13% |
2% |
8% |
16% |
22% |
| Total |
5% |
49% |
1% |
57% |
6% |
1% |
5% |
26% |
6% |
27% |
The El Compas Mineral Resource
has been reported by mineralised vein system, above defined gold cut-off grades and by Resource category, which is presented in
Table 1-2. The Resource has been depleted for historic mining and therefore is considered in-situ.
Table 1-2 El Compas Mineral
Resource Inventory
Mineral Resource Estimate for the El Compas Deposit
January 14, 2016 |
| Vein |
Cut off Au g/t |
Tonnes |
Au g/t |
Ag g/t |
Au Oz |
Ag Oz |
| Indicated |
| El Compas |
2.0 |
507,000 |
6.7 |
66.7 |
110,000 |
1,087,000 |
| El Orito |
2.0 |
45,000 |
4.3 |
60.5 |
6,000 |
88,000 |
| Total |
|
552,000 |
6.5 |
66.2 |
116,000 |
1,175,000 |
| |
Inferred |
| El Compas |
2.0 |
129,000 |
3.4 |
58.0 |
14,000 |
240,000 |
| El Orito |
2.0 |
292,000 |
4.5 |
60.8 |
42,000 |
571,000 |
| Total |
|
421,000 |
4.2 |
59.9 |
57,000 |
812,000 |
| | | 12 |
Notes:
| 1. | Mineral Resources estimated as of January 14, 2016. |
| 2. | CIM Definition Standards were followed for the Mineral Resource estimates. |
| 3. | Mineral Resources are estimated using Vulcan software, and have been reported at a 2.0 g/t Au cut-off
grade. |
| 4. | For the purpose of Resource estimation, assays were capped at 75.0 g/t for Au and 700.0 g/t for
Ag. |
| 5. | A bulk density of 2.6 tonnes/m3 has been applied for volume to tonnes conversion. |
| 6. | Resource categories have been applied to the estimation on the basis of drill-hole density, number
of available composites, estimation pass and confidence in the estimation. |
| 7. | A small amount of the Resource has been mined at the top of the El Compas vein and this material
has been removed from the Resource. |
This El Compas project assessment includes
Inferred Resources in the economic analyses. Inferred Resources are considered too speculative geologically to have the economic
considerations applied to them that would enable them to be categorised as Mineral Reserves.
Qualitative assessments of the El Compas
Mineral Resource model concluded the general mining method for design application is to be sublevel stoping. Based on the geometry
and grade of each zone, the transverse and longitudinal variations of the sublevel stoping method have been identified as optimal.
Cemented rockfill (CRF) will be used
to backfill the primary stopes and secondary stopes will be backfilled with unconsolidated waste rockfill (WRF) upon completion
of mining. Backfill of completed longitudinal stopes will be done with waste rockfill (WRF) were possible and cemented rockfill
(CRF) in zones adjacent to future production stopes. Panel extraction will occur in a bottom-up sequence.
The gold equivalent Cut-off Grade (COG)
utilised for mine design and planning are presented in Table 1-3.
Table 1-3 Summary of Cut-off
Grades
| |
Stoping COG
(g/t AuEq) |
Incremental Stoping COG (g/t AuEq) |
Development Only
(g/t AuEq) |
| Cut-off Grade (In-situ) |
2.2 |
2.0 |
1.3 |
| Cut-off Grade (Recovered and Diluted) |
2.0 |
1.9 |
1.3 |
Preliminary Mineable Shape Optimiser
(MSO) analyses on 15 and 20m sublevel spacings showed that a 20m spacing resulted in negligible net difference in mineable tonnage
and minimal variance in grade (-3%). As a 20m sublevel spacing represents reduced development requirements whilst providing a practical
design parameter for effective mining, this sublevel interval was selected for subsequent analysis.
The Resource will be mined from two
underground zones (El Compas and El Orito) using shared access and infrastructure. The El Compas zone mineable inventory spans
a strike length of 270 metres and covers a vertical depth of 140 metres below surface. The El Orito zone mineable inventory spans
a strike length of 230 metres and covers a vertical depth of 100 metres below surface. A new portal will be excavated in the face
of an existing rock quarry located to the immediate south of the El Compas zone. This portal location is already permitted as per
the pre-existing mining plan. Further surface disturbances will be minimal.
| | | 13 |
The mine development plan includes 8,635m
of lateral and 328m of vertical excavations. Table 1-4 provides a summary of life of mine development metres.
Table 1-4 Development Metres
| Development Metres |
Value |
| |
Lateral Capital (m) |
5,577 |
| |
Lateral Operating (m) |
2,656 |
| |
Lateral Total (m) |
8,635 |
| |
|
|
| |
Vertical Capital (m) |
328 |
| |
Vertical Operating (m) |
- |
| |
Vertical Total (m) |
328 |
| |
|
|
Production design was completed in three
main stages as follows;
| 1- | MSO Optimisation - Identification of Potential Mineable Inventory |
| 2- | Identification of Additional Inventory – Satellite and Close Proximity to Mined Workings |
| 3- | Manual Design Amendment - Final Mine Inventory |
Notable optimisation of mine inventory
tonnage and mill feed head grade was achieved as a result of positive outcomes from three initiatives:
| · | Crown Zone Inclusion - High grade material on 360/380 Levels |
| · | Manual interpretation of close - proximity incremental opportunity |
| · | Manual adjustments to stope design for increased design section granularity |
In comparison to the preliminary MSO
outputs at the incremental cut-off grade, the optimised design presents increased incremental ounces, improved design consistency
along strike and practical extraction horizons. Stope blocks demonstrating a mineable width >12m over a consistent strike length
have been flagged and designed to allow for transverse extraction.
The final mine plan with the El Compas
crown zone recovers in excess of 85% in-situ metal from the available Resource (on an in-situ basis).
Figure 1-1 shows a longsection of
the final mine plan colour-coded to depict AuEq grade (in-situ).
| | | 14 |

Figure 1-1- Mine Plan Longsection
depicting AuEq Grade (In-situ), View from East
The mine inventory consists of 683kt
of Indicated material, 270kt of Inferred material and 144kt of Unclassified material (internal waste dilution). Table 1-5 provides
a summary of recovered potentially economic material by Resource category.
Table 1-5 Mined and Recovered
(Mrec) Material by Resource Category
| Mrec Material by Resource Category |
Value |
| |
Mrec Material Tonnes (t) Indicated |
683,169 |
| |
Mrec Material Grade AuEq (g/t) Indicated |
5.3 |
| |
Mrec Material Grade Au (g/t) Indicated |
4.7 |
| |
Mrec Material Grade Ag (g/t) Indicated |
49.8 |
| |
|
|
| |
Mrec Material Tonnes (t) Inferred |
269,882 |
| |
Mrec Material Grade AuEq (g/t) Inferred |
4.9 |
| |
Mrec Material Grade Au (g/t) Inferred |
4.1 |
| |
Mrec Material Grade Ag (g/t) Inferred |
62.4 |
| |
|
|
| |
Mrec Material Tonnes (t) Unclassified |
144,246
|
| |
Mrec Material Grade AuEq (g/t) Unclassified |
0.0 |
| |
Mrec Material Grade Au (g/t) Unclassified |
0.0 |
| |
Mrec Material Grade Ag (g/t) Unclassified |
0.0 |
| |
|
|
Mining activities have been sequenced
to optimise mining efficiency, adhere to the La Plata processing facility throughput capacity and geotechnical and economic considerations.
The extraction sequence is based on preference for accessing higher grade material early in the mine life whilst adhering to a
practical extraction sequence. The El Compas zone will be extracted first, followed by extraction of the El Orito zone. Both the
El Compas and El Orito zones are divided into two mining panels (Upper and Lower). Table 1-6 presents a summary of potentially
economic material tonnage and grades (Mrec) by project year.
| | | 15 |
Table 1-6 Potentially
Economic Material Tonnage and Grade- Annually
| |
Year 1 |
Year 2 |
Year 3 |
Year 4 |
Year 5 |
Year 6 |
Year 7 |
Year 8 |
| Mrec Material Tonnes (t) |
58,686 |
167,069 |
169,597 |
163,770 |
170,123 |
172,497 |
163,880 |
31,677 |
| Mrec Material Grade AuEq (g/t) |
6.1 |
4.9 |
4.2 |
4.0 |
6.0 |
4.0 |
3.6 |
2.6 |
| Mrec Material Metal AuEq (oz) |
11,562 |
26,365 |
23,096 |
21,172 |
33,006 |
22,296 |
18,982 |
2,614 |
| Mrec Material Grade Au (g/t) |
5.3 |
4.4 |
3.4 |
3.6 |
5.5 |
3.3 |
3.1 |
2.1 |
| Mrec Material Metal Au (oz) |
10,008 |
23,507 |
18,543 |
19,122 |
30,223 |
18,344 |
16,400 |
2,147 |
| Mrec Material Grade Ag (g/t) |
64.7 |
41.8 |
65.6 |
30.6 |
40.0 |
56.0 |
38.5 |
36.0 |
| Mrec Material Metal Ag (oz) |
122,063 |
224,539 |
357,754 |
161,035 |
218,678 |
310,496 |
202,859 |
36,690 |
| Waste Mrec Tonnes (t) |
112,111 |
100,717 |
6,340 |
42,438 |
55,292 |
21,014 |
- |
- |
The El Compas zone is forecast to yield
an average a mill feed head grade of 5.0 g/t AuEq (4.3 g/t Au). The El Compas zone represents a higher mill feed head grade compared
to the El Orito zone at 3.5 g/t AuEq (3.0 g/t Au).
Underground mining activity will be
conducted by a mining contractor with the owner supplied labour force providing overarching site management, mine technical support
and processing facility labour. The mine contractor will provide labour for mine and mobile maintenance. Table 1-7 shows a
summary of owner labour requirements by department.
Table 1-7 El Compas Labour Requirements
| Labour Area |
Head Count |
| General Manager |
1 |
| General & Administration |
14 |
| Mine Administration |
1 |
| Mine Technical |
9 |
| Mill Administration |
1 |
| Mill Technical |
2 |
| Mill Operations |
29 |
| Mill Maintenance |
7 |
| Total Owners Labour Workforce |
64 |
During initial development of the ramp
from the new portal until the El Compas fresh air raise is developed through to surface, the mine will be force ventilated by large
auxiliary fans (installed outside the new portal) and low-leakage ducting. Following development of the El Compas fresh air raise,
a primary axial flow fan will be installed on top of this raise, force-ventilating the mine and exhausting via the new portal.
A large auxiliary fan will be installed in a bulkhead on the 340 Level (El Compas zone) to deliver fresh air for the continued
ramp development towards the El Orito zone. Once the El Orito fresh air raise is developed through to surface, a second primary
fan will be installed on top of the El Orito fresh air raise, force ventilating the mine and exhausting via the new portal.
| | | 16 |
Treatment of the El Compas potentially
economic material will be performed at the La Plata processing facility located 20 km from the mine. The facility is accessed
via all-weather roads from both the El Compas mine and the nearby city of Zacatecas. The facility includes a mineral processing
plant and related equipment, including site infrastructure. Operations at La Plata began in September 2013 but have been shut
down since October 2014. The reported design capacity of the processing facility was 500 tonnes per day.
The La Plata processing facility incorporated
conventional comminution and froth flotation to produce concentrate for sale to nearby smelters and refiners. Equipment for the
comminution and flotation circuits that is currently installed includes crushers, mill feed material bins, ball mills, conveyors,
flotation cells, thickeners and tailings handling. Some of this equipment requires refurbishment. Miscellaneous auxiliary items
including pumps, piping, electrical and instrumentation may need alterations or replacement. Canarc will modify the processing
facility to allow for doré production on site, which includes for the addition of gravity, leaching and Merrill Crowe treatment
circuits.
Potentially economic material will be
delivered by truck from the mine to La Plata seven days a week. Crushing will typically be for 10 hours per day to ensure a mill
feed of 483 tonnes a day. Crushed mill feed material is sent to two fine mill feed material bins, each having a 372 tonne live
load capacity and feeding a separate ball mill. The two ball mills will operate in parallel and grind the mill feed material to
a targeted particle size of P80 of 65 microns. The ball mill cyclone underflow is split and one third fed to a semi-continuous
centrifugal concentrator, with the balance incorporated as part of the mill recirculating load. The resulting rougher gravity concentrate
is sent to a table for batch cleaning, and the tabled concentrate smelted in an electric furnace.
The cyclone overflows are discharged
to rougher float cells. The bulk rougher flotation concentrate, amounting to approximately 50 tpd, is collected and sent to a thickener.
The thickener underflow is pumped to the leach circuit where pulp density is adjusted with barren cyanide recycle solution. The
cyanidation circuit consists of a series of six, gravity overflow tanks allowing for 48 hours of leach retention. The leached slurry
is filtered and the pregnant solution delivered to the Merrill Crowe circuit. The resulting precipitate is dried and melted in
an electric furnace, after adding flux, to produce gold silver doré bars.
Projected precious metal recoveries
are based on preliminary laboratory test results for gravity, flotation and leaching. At the average mill feed head grade of El
Compas mill feed of 3.9 g/t gold and 46.3 g/t silver, the overall plant recovery is 83% for gold and 55% for silver.
The washed leach filter cake is repulped
and sent with barren bleed to a SO2-air detoxification circuit. The treated leach residue is combined with the flotation
tailing and discharged to a TMF. Process water is reclaimed for use in the processing circuits.
| | | 17 |
| 1.10 | Project Infrastructure |
The El Compas property is located within
one kilometre from paved roads in the southern part of the city of Zacatecas, Mexico and accessed by an all-weather gravel road.
Access is available directly to the existing El Compas mine portal and to the rock quarry where the new portal will be excavated.
Minor roadworks will be required to provide clear and suitable access in and around the new portal site. The La Plata processing
plant and tailings facility is accessible by paved roads and all-weather gravel roads, approximately 20 kilometres from the El
Compas mine site around the western side of Zacatecas City.
Other infrastructure includes:
| · | Processing facility including TMF (the existing plant will be refurbished and modified) |
| · | Ventilation fans and controls |
| 1.11 | Market Studies and Contracts |
The El Compas Project will produce gold
and silver in the form of doré bars containing both metals. The weight of the doré bars and preliminary assays will
be used to calculate gold and silver content and the overall value of each shipment.
Doré bars are readily traded
in the market so there are not expected to be any issues with sale of mine output. There are several internationally recognised
precious metal refineries who are likely to be interested in refining gold and silver from El Compas production.
| 1.12 | Environmental Studies, Permitting and Social or Community Impacts |
Oro Silver has obtained Environmental
permits from the Mexican government for the development of an underground mine at El Compas and the construction of a 750 tpd leach
plant and tailings facility at the El Compas property and has acquired 12 hectares of land on which to construct these facilities.
Canarc has signed a Letter of Intent with the Zacatecas government for rental of the idle 500 tpd La Plata processing facility
that is located on the northern outskirts of Zacatecas for processing the El Compas potentially economic material. The government
processing facility is a fully permitted processing plant and tailings facility as a 500 tpd crushing, grinding and flotation operation
and will need to be modified to add a gravity concentrator, a concentrate leaching circuit and a cyanide destruction circuit.
The new El Compas portal is located
on the southern outskirts of Zacatecas, approximately 0.7 kilometres from existing residences. However, the closest underground
workings to existing residences is approximately 125m (lateral offset between the northern most El Orito upper level and the nearest
residence). To minimise impacts of mining operations on the community, the portal and operations area chosen are facing away from
the city and are inside an existing rock quarry. Other than the 12 hectares which Canarc owns, the surface rights to other areas
of the claims are held by a number of different local families with whom Minera Oro Silver has signed access agreements in place.
| | | 18 |
The area around Zacatecas has many historic
mining properties and operating mines from pre-colonial days and onward with an abundance of mine workings.
| 1.13 | Capital and Operating Costs |
The total project life of mine capital
costs are estimated at $11.53 million comprising of $7.65 million for upfront and $3.88 million for sustaining capital costs. Upfront
mine capital estimations include a 15% contingency. Mill Capital estimations have a 12% contingency applied.
Table 1-8 provides a summary of
upfront capital costs associated with pre-steady state operation. Table 1-9 provides a summary of sustaining capital costs
associated with steady state production.
Table 1-8 Upfront Capital Costs
Summary
| Upfront Capital Costs |
US$M |
| Mining |
1.97 |
| Processing |
3.88 |
| Pre-Steady State Capital Development |
1.80 |
| |
|
| Total |
7.65 |
Table 1-9 Sustaining Capital
Costs Summary
| Sustaining Capital Costs |
US$M |
| |
Mining |
0.85 |
| |
Capital Development |
2.21 |
| |
Processing |
0.50 |
| |
General |
0.32 |
| |
|
|
| |
Total |
3.88
|
| |
|
|
Operating costs for life of mine total
$65.82 million equating to an operating cost of $60.0 per tonne milled. Cash operating costs of $522.8/Oz AuEq produced and All-In
Costs of $614.3/oz AuEq have been estimated. Table 1-10 provides a summary of operating unit costs in terms of cost per tonne
of material milled. The values presented represent average costs for life of mine.
Table 1-10 Operating Unit Costs
Summary
| Operating Costs Summary |
US$/t Milled |
| |
Mining |
32.0 |
| |
Milling |
18.4 |
| |
G&A |
9.7 |
| |
Total |
60.0 |
| |
|
|
Note: Minor summation
discrepancies exist due to rounding
There has been no consideration for
price escalations of capital and operating costs due to inflation.
| | | 19 |
The PEA calculates a Base Case after-tax
NPV of $32.87 million, with an after-tax IRR of 84% using a discount rate of 5%. The total life of mine capital cost of the project
is estimated to total $11.53 million. The payback period for the pre-steady state up-front capital and LOM capital is estimated
at 1.75 years (7 Quarters) and 2.75 years (11 Quarters) respectively. Cash operating costs of $522.8/Oz AuEq and All-In Costs of
$614.3/oz AuEq have been estimated. Operating costs for life of mine total $65.82 million, equating to an operating cost of $60.0
per tonne milled.
Project highlights and key parameters
and potential economic outcomes from the mining and processing plan considered in this PEA are detailed in Table 1-11.
Table 1-11 PEA Highlights and
Financial Parameters
PEA Highlights
Base Case of $1,100/Oz Gold, $14/Oz Silver |
Unit |
Value |
| Net Present Value (After Tax 5% Discount Rate) |
US$M |
32.9 |
|
| Internal Rate of Return |
IRR |
84% |
|
| Mill Feed |
Tonnes (t) |
1,097,297 |
|
| Mining Production rate |
t/ year |
164,250 |
|
| LOM Project Operating Period |
Years |
7.25 |
|
| Total Capital Costs |
US$M |
11.5 |
|
| Net After-Tax Cashflow |
US$M |
40.3 |
| LOM Gold Production (Payable) |
Oz |
114,624 |
| LOM Silver Production (Payable) |
Oz |
885,912 |
| Total Operating Unit Costs |
US$/t |
60.0 |
| Total Operating Unit Costs |
US$/Oz AuEq |
522.8 |
| All-in Unit Costs |
US$/Oz AuEq |
614.3 |
Notes:
| 1. | Gold equivalency has been calculated based on a gold price of US$1,100/Oz and a silver price of US$14/Oz,
metallurgical recoveries of 83.3% for gold and 55.3% for silver. The estimates for gold and silver recoveries are based on
flotation and leaching tests conducted at Research Development Inc.’s laboratory, which is located in Colorado, US and
supervised by Tetra Tech, Inc. personnel. |
| 2. | Tonnages are quoted as metric tonnes (t). |
| 3. | Deferred tax credits of US$9.86 million in Oro Silver have been incorporated into tax payable estimation
with total credits amortised over life of mine (maximum tax pool offset of 15% credit inclusion per annum) |
Project NPV is most sensitive to commodity
price variance in comparison to variances in mine operating cost, capital cost or discount rate. Project NPV exhibits similar sensitivity
to capital costs and discount rate. Table 1-12 shows the sensitivity of project metrics to commodity price variations.
| | | 20 |
Table 1-12 Sensitivity- Project
Metrics to Commodity Price Variations
| Sensitivity Analysis |
| Gold price US$/Oz |
$900 |
$1,000 |
$1,100 |
$1,200 |
$1,300 |
| Pre-Tax NPV 5% US$M |
$ 27.61 |
$ 37.97 |
$ 48.32 |
$ 58.68 |
$ 69.04 |
| After-Tax NPV 5% US$M |
$ 19.28 |
$ 26.18 |
$ 32.87 |
$ 39.46 |
$ 45.99 |
| Pre-Tax IRR |
67% |
85% |
102% |
118% |
132% |
| After-Tax IRR |
57% |
71% |
84% |
97% |
108% |
The results of this PEA support the
continued advancement of the El Compas project and work related to further technical studies. No production decision has been made
at this time. MP strongly recommends that additional studies are conducted in the following areas prior to making a production
decision:
| · | Confirmation of TMF dam construction to current quality standards |
| · | Metallurgical testwork to optimise the process flowsheet, potentially focussed on only a flotation
circuit |
| · | Detailed engineering work to confirm infrastructure requirements including processing facility,
electrical, ventilation, compressed air and dewatering |
Further recommendations are included
in Section 26.
| | | 21 |
Contents
| Certificates |
4 |
| 1 Executive summary |
9 |
| 1.1 Property Description and Location |
9 |
| 1.2 Accessibility, Climate, Local Resources, Infrastructure and Physiography |
9 |
| 1.3 History |
10 |
| 1.4 Deposit Type |
10 |
| 1.5 Sample Preparation, Analysis and Security |
10 |
| 1.6 Mineral Processing and Metallurgical Testing |
10 |
| 1.7 Mineral Resource Estimate |
11 |
| 1.8 Mining Methods |
13 |
| 1.9 Recovery Methods |
17 |
| 1.10 Project Infrastructure |
18 |
| 1.11 Market Studies and Contracts |
18 |
| 1.12 Environmental Studies, Permitting and Social or Community Impacts |
18 |
| 1.13 Capital and Operating Costs |
19 |
| 1.14 Economic Analysis |
20 |
| 1.15 Recommendations |
21 |
| 2 Introduction |
1 |
| 2.1 Purpose |
1 |
| 2.2 Property Visit |
1 |
| 2.3 Sources of Information |
4 |
| 2.4 Units |
4 |
| 2.5 List of Abbreviations |
4 |
| 3 Reliance On Other Experts |
2 |
| 4 Property, Description and Location |
3 |
| 4.1 Concession Ownership and Maintenance |
4 |
| 4.2 Mineralisation Location |
4 |
| 4.3 Concession Ownership |
7 |
| 4.4 Required Permits |
7 |
| 4.5 Surface Rights and Access |
7 |
| 4.6 Royalties |
7 |
| 4.7 Environmental Liabilities |
7 |
| 5 Accessibility, Climate, Local Resources, Infrastructure and Physiography |
8 |
| 5.1 Accessibility |
8 |
| 5.2 Climate and Vegetation |
8 |
| 5.3 Local Resources and Infrastructure |
8 |
| 5.4 Physiography |
9 |
| 6 History |
10 |
| 6.1 Production History of the Region |
10 |
| 6.2 History of the El Compas property |
11 |
| 6.3 History of the La Plata Processing Facility |
12 |
| 7 Geological Setting and Mineralisation |
13 |
| 7.1 Geological Setting |
13 |
| 7.2 Regional Geology |
13 |
| 7.3 Local Geology |
16 |
| 7.4 Alteration |
16 |
| 7.5 Veins and Faults |
16 |
| | | 22 |
| 7.6 Vein Textures and Mineralogy |
17 |
| 8 Deposit Types |
18 |
| 9 Exploration |
20 |
| 9.1 Exploration by Minera Hochschild |
20 |
| 9.2 Exploration by Oro Silver |
20 |
| 9.3 Interpretation |
21 |
| 10 Drilling |
22 |
| 10.1 Early Programs |
22 |
| 10.2 Oro Silver Programs |
23 |
| 10.2.1 Phase 1 |
23 |
| 10.2.2 Phase 2 |
24 |
| 10.2.3 Phase 3 |
24 |
| 10.2.4 Surveys and Investigations |
25 |
| 10.2.5 Interpretation |
25 |
| 11 Sample Preparation, Analyses and Security |
26 |
| 11.1 Minera Hochschild Drilling |
26 |
| 11.2 Oro Silver Channel Sampling |
26 |
| 11.3 Oro Silver Drilling |
27 |
| 11.3.1 Drill Site |
27 |
| 11.3.2 Drill Site to Core Logging Facility |
27 |
| 11.3.3 Core Logging Facility |
28 |
| 11.3.4 Core Logging |
28 |
| 11.3.5 Sampling and Bagging |
29 |
| 11.3.6 Shipping |
29 |
| 12 Data Verification |
30 |
| 12.1.1 MP Data Review |
30 |
| 12.2 Diamond Drilling 2011 |
30 |
| 12.2.1 Duplicates |
30 |
| 12.2.2 Standards |
31 |
| 12.2.3 Blanks |
32 |
| 12.3 Chip Sampling 2007 |
33 |
| 12.3.1 Duplicates |
33 |
| 12.3.2 Standards |
33 |
| 12.3.3 Blanks |
33 |
| 12.4 Opinion |
33 |
| 13 Mineral Processing and Metallurgical Testing |
35 |
| 13.1 Background |
35 |
| 13.2 Laboratory Results |
35 |
| 13.2.1 Sample Preparation and Head Assay |
35 |
| 13.2.2 Mineralogy |
39 |
| 13.2.3 Comminution |
40 |
| 13.2.4 Gravity Pre-treatment |
40 |
| 13.2.5 Flotation |
42 |
| 13.2.6 Heap Leach Evaluation |
44 |
| 13.2.7 Tank Leach Cyanidation |
44 |
| 13.2.8 Ammonium Sulphate Leaching |
46 |
| 13.2.9 Settling and Filtration Tests |
46 |
| 13.3 Conclusions |
47 |
| 14 Mineral Resource Estimates |
49 |
| | | 23 |
| 14.1 Data Preparation |
49 |
| 14.2 Geological Domaining, Interpretation and Wireframe Construction |
49 |
| 14.2.1 Geological Model |
49 |
| 14.2.2 Mineralisation Model |
49 |
| 14.3 Sample Coding |
51 |
| 14.4 Statistical Analysis |
51 |
| 14.4.1 Underground Channel vs Drill Hole Sample Comparison |
52 |
| 14.4.2 Raw and Composited Sample Statistics |
53 |
| 14.4.3 Top Cuts |
55 |
| 14.4.4 Declustering |
57 |
| 14.5 Variography |
57 |
| 14.5.1 Gold Domains |
57 |
| 14.5.2 Silver Domains |
58 |
| 14.6 Block Modelling Construction |
59 |
| 14.7 Density |
60 |
| 14.8 Grade Estimation |
62 |
| 14.9 Block Model Validation |
63 |
| 14.10 Block Model Classification and Depletion |
66 |
| 14.11 Comparison to Previous Estimates |
67 |
| 14.12 Mineral Resource Reporting |
68 |
| 15 Mineral Reserve Estimates |
71 |
| 16 Mining Methods |
72 |
| 16.1 Mining Method Selection |
72 |
| 16.1.1 Qualitative Assessment Inputs |
72 |
| 16.1.2 Qualitative Assessment Results |
74 |
| 16.1.3 Selected Mining Method |
77 |
| 16.2 Preliminary MSO Analysis |
77 |
| 16.3 Cut-off Grade Estimate |
82 |
| 16.3.1 Introduction |
82 |
| 16.3.2 Grade Equivalency Factors |
83 |
| 16.3.3 Estimate of Resource Tonnage-Grade Above Selected Resource Cut-off Grade |
83 |
| 16.3.4 Cut-off Grade Financial Drivers |
85 |
| 16.3.5 Cut-off Grade Calculation |
85 |
| 16.4 Underground Mine Design |
86 |
| 16.4.1 Geotechnical Parameters |
86 |
| 16.4.2 Hydrology |
90 |
| 16.4.3 Development Design |
90 |
| 16.4.4 Production Design |
98 |
| 16.4.5 Recovery and Dilution |
101 |
| 16.4.6 Crown Zone Extraction Methodology |
104 |
| 16.4.7 Backfill Methodology |
106 |
| 16.4.8 Mine Inventory and Final Mine Layout |
108 |
| 16.5 Underground Mine Schedule |
112 |
| 16.5.1 Sequence Overview |
112 |
| 16.5.2 Scheduling Rates |
114 |
| 16.5.3 Mine Schedule |
116 |
| 16.5.4 Backfill and Waste Provision |
121 |
| 16.5.5 Dewatering Strategy |
123 |
| 16.5.6 Mine Operation |
124 |
| 16.5.7 Labour Requirements |
124 |
| 16.5.8 Equipment Requirements |
125 |
| 16.5.9 Ventilation Strategy |
126 |
| 17 Recovery Methods |
127 |
| | | 24 |
| 17.1 Operating Facility and Treatment Flowsheet |
127 |
| 17.2 Process Design Criteria |
130 |
| 17.3 Process Description |
132 |
| 17.3.1 Mill Feed Delivery |
132 |
| 17.3.2 Comminution |
132 |
| 17.3.3 Gravity Pre-treatment and Flotation |
133 |
| 17.3.4 Concentrate Leaching |
134 |
| 17.3.5 Gold and Silver Recovery |
134 |
| 17.3.6 Detoxification and Tailings Disposal |
135 |
| 17.4 Consumables |
135 |
| 18 Project Infrastructure |
137 |
| 18.1 Site Layout Plans |
137 |
| 18.2 Site Access |
138 |
| 18.3 Processing Plant |
139 |
| 18.4 Tailings Management Facility |
139 |
| 18.5 Buildings and Workshop |
140 |
| 18.6 Fuel Supply |
140 |
| 18.7 Explosives Magazine |
141 |
| 18.8 Ventilation |
141 |
| 18.9 Electrical |
143 |
| 18.10 Compressed Air |
146 |
| 18.11 Dewatering |
148 |
| 18.12 Water Supply |
148 |
| 18.13 Refuge Chamber |
148 |
| 18.14 Escape Way |
148 |
| 18.15 Mobile Equipment |
148 |
| 19 Market Studies and Contracts |
149 |
| 20 Environmental Studies, Permitting and Social or Community Impact |
150 |
| 20.1 Environmental and Permitting |
150 |
| 20.1.1 El Compas |
150 |
| 20.1.2 La Plata Processing Facility |
150 |
| 20.2 Surface Access – El Compas |
151 |
| 20.3 Community Impact |
151 |
| 21 Capital and Operating Costs |
152 |
| 21.1 Capital Cost Estimates |
152 |
| 21.1.1 Upfront Capital Costs |
152 |
| 21.1.2 Sustaining Capital Costs |
154 |
| 21.2 Operating Cost Estimates |
155 |
| 22 Economic Analysis |
158 |
| 22.1 Valuation Methodology |
158 |
| 22.2 Assumptions |
158 |
| 22.3 Processing Plant Feed Throughput |
158 |
| 22.4 Cost Estimates |
159 |
| 22.5 Indicative Economic Results |
159 |
| 22.6 Sensitivity Analysis |
161 |
| 23 Adjacent Properties |
164 |
| 24 Other Relevant Data and Information |
165 |
| 25 Interpretation and Conclusions |
166 |
| | | 25 |
| 25.1 Exploration Conclusions |
166 |
| 25.2 Metallurgical Conclusions |
167 |
| 25.3 Mining Conclusions |
167 |
| 25.4 Economic Analysis |
168 |
| 26 Recommendations |
170 |
| 27 References |
172 |
| Appendix I |
173 |
| Swathe Plots for Domains 6 & 7 |
173 |
| Appendix II |
174 |
| Production Design- Discounted Areas |
174 |
| Appendix III |
177 |
| Canarc - El Compas Project- Discounted Cashflow Model |
177 |
| Canarc - El Compas Project- Sensitivity Tables (After-Tax) |
181 |
| Canarc - El Compas Project- Sensitivity Tables (Before-Tax) |
184 |
| | | 26 |
Figures,
Tables and Photos
Table of Figures
| Figure 1-1- Mine Plan Longsection depicting AuEq Grade (In-situ), View from East |
15 |
| Figure 4-1 Location Map (Source Oro Silver, 2008) |
3 |
| Figure 4-2 Concession Map (Source: Marlin Gold 2015) |
6 |
| Figure 6-1 Map of Historic Workings and local Geology at El Compas (Source Oro Silver, 2008) |
10 |
| Figure 7-1 Regional Geology (Source Oro Silver, 2008) |
15 |
| Figure 8-1 Epithermal Deposit Model (from Corbett, 2004) |
18 |
| Figure 10-1 Drilling by MHM (Source Oro Silver, 2008) |
23 |
| Figure 10-2 Drill Plan with existing underground workings |
25 |
| Figure 12-1 Duplicate Sample plot |
30 |
| Figure 12-2 Standard 1 (0.71 to 0.83 g/t Au recommended range) |
31 |
| Figure 12-3 Standard 2 (4.4 to 5.0 g/t Au recommended range) |
32 |
| Figure 13-1 Plan view of metallurgical sample locations (with hole number of sample) |
38 |
| Figure 13-2 Longitudinal view of metallurgical samples in the El Compas zone (looking west) |
38 |
| Figure 13-3 Longitudinal view of metallurgical samples in the El Orito zone (looking west) |
39 |
| Figure 14-1 Mineralisation Wireframes in Plan view |
50 |
| Figure 14-2 Comparison between the diamond drill hole and underground channel true thickness composites for gold |
52 |
| Figure 14-3 Comparison between the diamond drill hole and underground channel true thickness composited for silver |
52 |
| Figure 14-4 Comparison between gold grade and sample length for gold |
53 |
| Figure 14-5 Gold Log Histograms for length weighted raw samples and composites |
54 |
| Figure 14-6 Silver Log Histograms for length weighted raw samples and composites |
55 |
| Figure 14-7 Gold top cut analysis for Domain 2 |
56 |
| Figure 14-8 Silver top cut analysis for Domain 2 |
56 |
| Figure 14-9 Comparison between the Supplied Bulk Density Values and the Calculated Bulk Density Values |
61 |
| Figure 14-10 Cross-Section through the El Compas Block Model with the input drill hole grades |
63 |
| Figure 14-11 Northing Swath Plot for Domain 2 |
65 |
| Figure 14-12 Easting Swath Plot for Domain 2 |
65 |
| Figure 14-13 Relative Level (RL) Swath Plot for Domain 2 |
66 |
| Figure 14-14 El Compas In-situ Indicated Mineral Resource tonnage-grade curve |
69 |
| Figure 14-15 El Compas In-situ Inferred Mineral Resource tonnage grade curve |
70 |
| Figure 16-1 El Compas and El Orito Sections |
73 |
| Figure 16-2 Charted Summary of MSO outputs by AuEq Cut-off Grade |
80 |
| Figure 16-3 MSO Stope Width Distribution by Mining Area |
80 |
| Figure 16-4 MSO Heatmap- El Compas AuEq Grade Distribution (1.2 g/t Cut-off) |
81 |
| Figure 16-5 MSO Heatmap- El Orito AuEq Grade Distribution (1.2 g/t Cut-off) |
82 |
| Figure 16-6 Tonnage Grade Data for El Compas Model- Indicated Material Class |
84 |
| Figure 16-7 Tonnage Grade Data for El Compas Model- Inferred Material Class |
84 |
| Figure 16-8 Estimated Ground Support Based on Tunnelling Quality Index Q (Grinstad, 1993) |
88 |
| Figure 16-9 CPillarâ Analysis Results for El Orito |
89 |
| | | 27 |
| Figure 16-10 Plan View of Primary Mine Access |
92 |
| Figure 16-11 El Compas Development, (i) View from South, (ii) View from North-East |
93 |
| Figure 16-12 El Compas Typical Level Layout- Transverse Extraction (340 Level) |
94 |
| Figure 16-13 El Compas Existing Development Longsection- View from East |
95 |
| Figure 16-14 El Compas Existing Development Integrated with Proposed Design-Longsection |
95 |
| Figure 16-15 El Compas Existing Development Integrated with Proposed Design- Section View |
96 |
| Figure 16-16 El Orito Design- Isometric View looking North |
97 |
| Figure 16-17 El Orito Design Typical Level Layout (360 Level) |
97 |
| Figure 16-18 MSO Outputs Indicative of Incremental Cut-off Grade - View from East |
99 |
| Figure 16-19 Production Design, Manually Optimised (Development Depleted) - View from East |
99 |
| Figure 16-20 Resource Model and Production Design Overlay- Inventory Optimisation |
101 |
| Figure 16-21- Longsection and Plan View of Typical Longitudinal Stoping Layout |
102 |
| Figure 16-22- Longsection- Long Section, Cross Section and Plan of Typical Transverse BHS with CRF Layout |
103 |
| Figure 16-23- El Compas Crown Zone Overview- Longsection View from East |
104 |
| Figure 16-24- El Compas Crown Zone Extraction Methodology- Longsection View from East |
105 |
| Figure 16-25- El Compas Crown Zone- Surface Breakthrough and Disturbance Boundary |
106 |
| Figure 16-26 Long Section Schematic showing Application of Consolidated Backfill into Longitudinal Stope Void |
108 |
| Figure 16-27 Final Mine Layout Longsection (View Looking West) |
109 |
| Figure 16-28 Mine Plan Panel Definition by Zone- View from East |
112 |
| Figure 16-29 Mine Plan Panel AuEq In-situ Grade Legend- View from East |
113 |
| Figure 16-30 Mrec Material Tonnes versus Mrec AuEq Grade- Annually |
116 |
| Figure 16-31 Mrec Material Tonnage and Grade by Zone- Annually |
118 |
| Figure 16-32 Mine Plan by Project year- Longsection View from East |
119 |
| Figure 16-33 Annual Mrec Material - Production versus Development |
119 |
| Figure 16-34 Quarterly Mrec Material Tonnes by Zone |
120 |
| Figure 16-35 Lateral Development Metres - Annually |
120 |
| Figure 16-36 Lateral Development Metres- Quarterly |
121 |
| Figure 16-37 Mine Plan Development by Project year- View from South |
121 |
| Figure 16-38 Cumulative Waste Balance |
122 |
| Figure 16-39 Waste Material Handling Path Scenarios |
123 |
| Figure 16-40 Alternative Waste Provision Requirement (Cumulative) |
123 |
| Figure 16-41 El Compas Development- As-builts for Dewatering and Proposed Development Schedule |
124 |
| Figure 17-1 Process Flow Sheet |
129 |
| Figure 18-1 El Compas Site Layout Plan |
137 |
| Figure 18-2 La Plata Site Layout Plan |
138 |
| Figure 18-3 Road Route from El Compas to La Plata (Haulage) |
139 |
| Figure 18-4 El Compas Power Requirements Over Life of Mine |
145 |
| Figure 18-5 Site Power Usage by Equipment/Infrastructure Type |
145 |
| Figure 18-6 El Compas Electrical Line Diagram |
146 |
| Figure 21-1 Operating Unit Cost Breakdown |
157 |
| Figure 22-1 NPV Sensitivity Spider Chart |
162 |
Table of Tables
| Table 1-1 Comparison between the 2011 SRK Mineral Resource Estimate and the 2015 MP Mineral Resource Estimate at a 2.0 g/t Au Cut-off |
12 |
| Table 1-2 El Compas Mineral Resource Inventory |
12 |
| Table 1-3 Summary of Cut-off Grades |
13 |
| Table 1-4 Development Metres |
14 |
| Table 1-5 Mined and Recovered (Mrec) Material by Resource Category |
15 |
| Table 1-6 Potentially Economic Material Tonnage and Grade- Annually |
16 |
| Table 1-7 El Compas Labour Requirements |
16 |
| Table 1-8 Upfront Capital Costs Summary |
19 |
| Table 1-9 Sustaining Capital Costs Summary |
19 |
| Table 1-10 Operating Unit Costs Summary |
19 |
| Table 1-11 PEA Highlights and Financial Parameters |
20 |
| Table 1-12 Sensitivity- Project Metrics to Commodity Price Variations |
21 |
| Table 4-1 El Compas Mineral Concessions |
5 |
| Table 12-1 Standards Used by Oro Silver in 2011 |
31 |
| Table 13-1 SGS Metallurgical Sample ID (Source SGS, 2008) |
36 |
| Table 13-2 SGS Head Analyses (Source SGS, 2008) |
37 |
| Table 13-3 SGS Gravity Data (Source SGS, 2008) |
41 |
| Table 13-4 SGS Rougher Flotation Data (Source SGS, 2008) |
42 |
| Table 13-5 RDI Rougher Flotation Data (Tetra Tech, 2015) |
43 |
| Table 13-6 SGS Whole Ore Cyanide Leach Results – Low Mid Grade Samples (Source SGS, 2008) |
45 |
| Table 13-7 SGS Whole Ore Cyanide Leach Results – Mid High Grade Samples (Source SGS, 2008) |
45 |
| Table 13-8 SGS Cyanide Leach with Gravity Pre-treatment (Source SGS, 2008) |
46 |
| Table 14-1 Mineralised Wireframes Used in the Mineral Resource Estimation |
51 |
| Table 14-2 Effect of Compositing on Gold Grades Within Each Domain |
54 |
| Table 14-3 Effect of Compositing on Silver Grades Within Each Domain |
55 |
| Table 14-4 Effect of the Top Cuts for Gold and Silver on Domain 2 |
57 |
| Table 14-5 Gold Domain Variographic Parameters |
58 |
| Table 14-6 Silver Domain Variographic Parameters |
58 |
| Table 14-7 Block Model Extents |
59 |
| Table 14-8 El Compas Block Model Variables |
60 |
| Table 14-9 El Compas Block Model Interpolation Parameters |
62 |
| Table 14-10 Volumetric Comparison of the Domains between the BM and Wireframes |
64 |
| Table 14-11 Individual Domain Validation for both Silver and Gold |
64 |
| Table 14-12 Resource Classification Methodology |
67 |
| Table 14-13 Comparison between the 2011 SRK Mineral Resource Estimate and the 2016 MP Mineral Resource Estimate at a 2.0 g/t Au Cut-off |
67 |
| Table 14-14 El Compas Mineral Resource Inventory |
68 |
| Table 16-1 Inputs for UBC Mining Method Selector – El Compas and El Orito |
72 |
| Table 16-2 El Compas and El Orito Orebody Grade Distributions at 1.2 AuEq Cut-off Grade |
73 |
| | | 28 |
| Table 16-3 Qualitative Assessment Mining Methods Considered |
74 |
| Table 16-4 El Compas and El Orito Orebodies Qualitative Assessment – Surface to 100m Scenario |
75 |
| Table 16-5 Mining Method Ranking – El Compas |
75 |
| Table 16-6 Mining Method Ranking – El Orito |
76 |
| Table 16-7 MSO Input Parameters |
78 |
| Table 16-8 Summary of MSO outputs by AuEq Cut-off Grade |
79 |
| Table 16-9 Grade Equivalency Factors Used in El Compas Cut-off Grade Model |
83 |
| Table 16-10 Summary of cut-off grades |
85 |
| Table 16-11 ESR Values |
86 |
| Table 16-12 Summary of Average RMR Values |
87 |
| Table 16-13 Crown Pillar Design Guidelines |
90 |
| Table 16-14 Lateral Development Profiles and Naming Conventions |
90 |
| Table 16-15 Vertical Development Profiles and Naming Conventions |
91 |
| Table 16-16 Summary of Dilution and Recovery Factors |
101 |
| Table 16-17 Summary of Longitudinal Stoping Dilution Factor |
102 |
| Table 16-18 Summary of Transverse Stoping Dilution Factor |
103 |
| Table 16-19 Summary of Backfill Application by Stope Type |
107 |
| Table 16-20 Material Quantity by Source |
109 |
| Table 16-21 Mrec Material Quantity and Grade by Resource Category |
110 |
| Table 16-22 Mrec Metal by Resource Category |
110 |
| Table 16-23 Holistic Summary of Development Metres |
111 |
| Table 16-24 Development Metres by Zone |
111 |
| Table 16-25 Lateral Development by Opcode |
111 |
| Table 16-26 Vertical Development by Opcode |
112 |
| Table 16-27 Development Task Rates- Scheduling Rates |
114 |
| Table 16-28 Development Resource Rates- Scheduling Rates |
115 |
| Table 16-29 Production Task Rates- Scheduling Rates |
115 |
| Table 16-30 Production Drilling Factors |
116 |
| Table 16-31 Potentially Economic Material Tonnage and Grade- Annually |
117 |
| Table 16-32 Annual Metal Production and Recovery |
117 |
| Table 16-33 Potentially Economic Material Tonnage and Grade by Zone- Annually |
118 |
| Table 16-34 El Compas Labour Requirements |
125 |
| Table 16-35 El Compas Mobile Equipment Requirements |
125 |
| Table 17-1 Major Existing Plant Equipment |
128 |
| Table 17-2 Process Design Criteria |
131 |
| Table 17-3 Reagents |
135 |
| Table 18-1 Estimated Diesel Requirements – El Compas Mine |
140 |
| Table 18-2 Estimated Diesel Requirements – La Plata Processing Facility |
141 |
| Table 18-3 Estimated Underground Ventilation Requirements |
142 |
| Table 18-4 El Compas Mine Electrical Demand Calculation Inputs |
143 |
| Table 18-5 Underground Mine Compressed Air Requirements |
147 |
| Table 18-6 Surface Workshop Compressed Air Requirements |
147 |
| Table 21-1 Capital Cost Summary |
152 |
| | | 29 |
| Table 21-2 Total Upfront Capital Costs Summary |
153 |
| Table 21-3 Mine Upfront Capital Cost Summary |
153 |
| Table 21-4 Mill Upfront Capital Cost Summary |
153 |
| Table 21-5 Sustaining Capital Costs Summary |
154 |
| Table 21-6 Mining Sustaining Capital Costs |
154 |
| Table 21-7 General Sustaining Capital Costs Summary |
155 |
| Table 21-8 Operating Costs Summary |
155 |
| Table 21-9 Mining Operating Unit Costs Summary |
155 |
| Table 21-10 Milling Operating Unit Costs Summary |
156 |
| Table 21-11 G&A Operating Unit Costs Summary |
156 |
| Table 22-1 Assumptions Used in Economic Analysis |
158 |
| Table 22-2 Taxation and Royalties |
159 |
| Table 22-3 Economic Assessment- Key Metrics |
160 |
| Table 22-4 Sensitivity- Project Metrics based on Commodity Price Variation |
161 |
| Table 22-5 Sensitivity- Project NPV (After-Tax) |
161 |
| Table 22-6 Sensitivity- NPV (Before Tax) based on Discount Rate and Commodity Price Variation |
162 |
| Table 22-7 Sensitivity- NPV (After Tax) based on Discount Rate and Commodity Price Variation |
163 |
| Table 25-1 El Compas Mineral Resource Inventory |
166 |
| Table 25-2 PEA Highlights and Financial Parameters |
168 |
| Table 25-3 Sensitivity- Project Metrics to Commodity Price Variations |
169 |
Table of Photos
| Photo 2-1 Example of the Higher Grade Core Reviewed During the Site Visit at El Compas |
2 |
| Photo 2-2 Entrance to the Existing Workings at El Compas |
2 |
| Photo 2-3 Drill Core Laid out for Review at El Compas |
3 |
| Photo 2-4 View Inside the La Plata Mill |
3 |
| Photo 10-1 Drill Hole Collar Marker at El Compas |
22 |
| Photo 17-1 Crushing Circuit |
130 |
| Photo 17-2 Ball Mill |
132 |
| Photo 17-3 Flotation Cells |
133 |
| Photo 20-1 View of the Tailings Impoundment at La Plata |
150 |
| | | 30 |
Canarc Resource Corp. (Canarc) of Vancouver,
Canada, engaged Mining Plus Canada Consulting Ltd.(MP) to complete a technical review of Mineral Resources and the preparation
of a National Instrument 43-101 Technical Report on the El Compas gold and silver project in Zacatecas, Mexico. This review is
a Preliminary Economic Assessment (PEA) level study of the project which includes the mining of the gold-silver veins on the El
Compas project and processing at the existing nearby “La Plata” processing facility.
The purpose of the study is to determine
the economic viability of operating the underground mine at El Compas on a contractor assisted basis and the rehabilitation, upgrade
and operation of the state government owned and Canarc leased La Plata processing facility.
This report is an update on exploration
and development activities since the early 2011 Technical Report completed by SRK and the subsequent diamond drilling program in
late 2011 by Oro Silver. Oro Silver is now a wholly owned subsidiary of Canarc, following the agreement with Marlin Gold. This
report is prepared to assist the management and directors of Canarc to decide the next steps to take in advancing the El Compas
project.
The reader is cautioned that the PEA
is preliminary in nature and the PEA mine plan and economic model include the use of Inferred Resources that are considered to
be too speculative to be used in an economic analysis, except as allowed for by Canadian Securities Administrator’s National
43-101 (43-101) in PEA studies. Mineral Resources that are not mineral reserves do not have demonstrated economic viability. There
is no certainty that Inferred Resources can be converted to Indicated or Measured Resources or Mineral Reserves, and as such, there
is no certainty that the results of this PEA will be realised.
A property visit to both the El Compas
mining property and the La Plata processing facility was made on October 19, 2015 by John Michael Collins, P.Geo. and Neil Schunke,
P.Eng. of MP accompanied by Garry Biles, President and COO of Canarc and Jose Luis Garcia and Karina Rodriguez Rios of Oro Silver.
Mr. Garcia has worked actively on the project for many years and is familiar with the data collection processes, QA/QC and sampling
methods used in the historic drilling and sampling programs by Oro Silver.
The property visit included a visit
to the Oro Silver office in Zacatecas, both at the beginning and end of the day. Files on computers to confirm location of the
existing underground workings were reviewed among other files. Original hard copies of previous reports were found, reviewed and
confirmed as consistent with electronic copies provided for this report. High grade core is stored in the office and it was looked
at including the core in Photo 2-1. Visible gold was seen in at least two sections of core plus significant quartz veining
and alteration surrounding the mineralised zones.
QA/QC processes used during the historic
work were discussed and deemed to fully meet industry standards. Details of electronic data on file and organization of the data
available was also viewed.
| | | 1 |

Photo 2-1 Example of the Higher Grade
Core Reviewed During the Site Visit at El Compas
The next site visited was the El Compas
mine site. The historic portal to the existing underground workings was visited (Photo 2-2). The proposed location for the
portal of the underground workings drafted in this report to access the deposit was reviewed for relevance of location to the Resource
and ability to collar a portal. It is in a former quarry wall and is deemed feasible for the purpose proposed, located well and
will keep the workings and site infrastructure plus noise and dust away from existing residential areas. Access is good on a short
gravel road used by haul trucks to and from the quarry and the ability to easily get the infrastructure; primarily electricity
required for mining was confirmed.

Photo 2-2 Entrance to the Existing
Workings at El Compas
Drill core stored at the El Compas project
site was laid out prior to the visit. The drill core is well marked and appears to be sampled and managed to industry standards.
The core reviewed is consistent with the drill logs provided by Oro Silver. Box markings, sample tag notes and tag location, areas
of sampling and storage methods were compared to the logs and confirmed to be the same. Storage of the core and sample material
returned from the lab is very good.
| | | 2 |

Photo 2-3 Drill Core Laid out
for Review at El Compas
The drill collar in Photo 10-1 was
one of several collar locations checked during the visit. The locations of the drill collars visited were compared to the location
on a handheld GPS. They were all within the accuracy of the GPS and deemed correct having been surveyed along with the existing
underground workings. The quality of the field markings of drill collars is very good and all are of a quality for use in a Resource
estimate.
The visit to the La Plata processing
facility included detail photography, video and notes on the mill, crushing and flotation and TMF at La Plata. A discussion of
the location for possible upgrades to leaching if deemed necessary and rehabilitation of existing equipment required for operation
in several different possible formats from flotation only, as presently permitted, to potentially cyanide leaching. The site is
large enough for the proposed work and access is very good and is made along a mine access road.
The photo on this report cover is at
the La Plata processing facility location as well as Photo 2-4 below. The tailings impoundment is seen in Photo 20-1.

Photo 2-4 View Inside the La
Plata Mill
| | | 3 |
| 2.3 | Sources of Information |
This study is based on historic information
obtained from maps, longitudinal and cross sections, data tables and documents prepared by (MHM) and Oro Gold de Mexico S.A. de
C.V. between April, 2005 and November 2011. Additional information relating to exploration in the El Compas area came from studies
prepared by consultants to these companies, government geologists and other sources. Documents used in the preparation of this
report are assumed by the authors as accurate and complete in all aspects and are referenced in the Sources of Information section.
The drill core is stored on site and
MP was provided access during the property visit, plus access to the mining property and processing facility.
Sections of this report particularly
on historic subjects and geology are heavily dependent on the reports by Rigby, et. al. (2011) and Jutras, et. al. (2008). MP takes
full responsibility for the contents of this report.
Costs of supplies and contractors quotations
have been provided by Canarc.
Units of measurement used in this report
are largely metric. Conversion of grams to troy ounces, a factor of 31.1035 grams/troy ounce is used, and 1 ounce per tonne = 31.1035
g/t. Currency is in United States dollars (US$) unless noted otherwise.
| CaOH2 | | calcium hydroxide (lime) |
| CNA | | Comisión Nacional del Agua, (a.k.a. CONAGUA) |
| EIA | | Environmental Impact Assessment |
| | | 4 |
| gr/ft3 | | grain per cubic foot |
| gr/m3 | | grain per cubic metre |
| LHOS | | longhole open stoping |
| MASL | | metres above sea level |
| MIA | | Mitigation Impact Assessment |
| MIBC | | methyl isobutyl carbinol |
| m3/h | | cubic metres per hour |
| Na2S2O5 | | sodium metabisulfite |
| Oro Gold | | Oro Gold de Mexico S.A. de C.V. |
| Oro Silver | | Minera Oro Silver de México, S.A. de C.V. |
| oz/st | | opt ounce per short ton |
| | | 2 |
| P80 | | 80% passing particle size |
| PAX | | potassium amyl xanthate |
| PLS | | pregnant leachate solution |
| pH | | measure of alkalinity / acidity based on negative logarithm of hydrogen-ion conc. |
| psia | | pound per square inch absolute |
| psig | | pound per square inch gauge |
| SEMARNAT | | Ministry of Environment and Natural Resource |
| TMF | | tailings management facility |
| usgpm | | US gallon per minute |
| WOP | | Water Optimisation Plan |
| | | 3 |
| 3 | Reliance On Other Experts |
MP has depended on a review of mineral
concession titles by the legal firm of Cereceres Estudio Legal, S.C. of Chihuahua, Mexico dated September 15, 2015. Titles are
maintained in Mexico in Spanish and outside counsel for this review was necessary to ensure accuracy.
The staff of Canarc and the Mexican
subsidiary of Canarc, Oro Silver have provided information and confirmation of many details plus provided the historical reports
and data collected by previous professionals.
| | | 2 |
| 4 | Property, Description and Location |
This section is partly sourced from
the Rigby, et. al. (2011) and Jutras, et. al. (2008) reports.
The El Compas project is located in
Zacatecas state, Mexico. It is located on the southern outskirts of Zacatecas city. The property is centred about UTM coordinates
747,200E, and 2,515,500N, (WGS84 Zone 13 North) at a mean elevation of about 2,430 metres.
The property is 3,943 hectares in size
and covering approximately 2.4km of strike length over the El Compas vein system and 1.2km of strike length over the El Orito vein
system, two of the more important mineralised structures in the district. Other mineralised veins occur on the property.

Figure 4-1 Location Map (Source
Oro Silver, 2008)
| | | 3 |
The El Compas property consists of 24,
semi-contiguous mineral concessions covering approximately 3,943 Ha. The El Compas and El Orito Resource areas are located within
the 28ha El Compas concession (Title No. 218370), the 9ha El Orito concession (Title No. 220278), and the 127ha Don Luis del Oro
concession (Title No. 223882). Details of these and the other concession are summarised in Table 2.2.1, and concession locations
are shown in Figure 2-2. There are small concessions not owned by Oro that are internal to the El Compas Property; however, none
of these are located in the immediate area of interest.
Several concessions were located since
the previous studies on this property in 2011. These are included in the following summaries.
Mexican law requires that the boundaries
of mineral concessions be established by a registered Mexican Mineral Concession Surveyor. The mineral concession corners are typically
marked by a cement cairn inscribed with concession numbers. Four concessions, including El Compas and El Orito, have had their
boundaries surveyed and determined to be correct.
The leased La Plata processing facility
is located north of Zacatecas towards Veta Grande in a rural area.
Oro Silver also owns mineral rights
to four small concessions located a short distance to the north that are not part of the scope of this report.
| 4.1 | Concession Ownership and Maintenance |
All minerals found in Mexico are the
property of Mexico and may be exploited by private entities under concessions granted by the Mexican government. The process was
defined under the Mexican Mining Law of 1992 and excludes petroleum and nuclear resources from consideration. The Mining Law also
requires that non-Mexican entities must either establish a Mexican corporation, or partner with a Mexican entity.
Under current Mexican mining law, amended
April 29, 2005, the Director General of Mines (“DGM”) grants mineral concessions for a period of 50 year terms with
maintenance obligations. There is no distinction between mineral exploration and exploitation concessions. As part of the requirements
to maintain a concession in good standing, bi-annual fees must be paid, and a report must be submitted to the DGM each May. This
report covers work conducted over the previous year on the concession.
The semi-annual fee is calculated on
a per-hectare basis. For concessions granted prior to January 2006, the fee is updated based on the amount of time that has passed
since granting of the concession and the Mexican Consumer Price Index. For concessions granted after January 2006, a per-hectare
escalating fee applies. Many of the concessions that comprise the El Compas property, including the El Compas concession, were
granted prior to January 2006.
| 4.2 | Mineralisation Location |
The El Compas and El Orito Resources
are located near the centre of the property entirely within the El Compas, El Orito and Don Luis Del Oro concessions. The near
surface portion of the El Compas vein Resource lies entirely within the El Compas concession. At depth, it dips west towards and
onto the Don Luis del Oro concession. The northern portion of the El Orito vein Resource is located within the El Orito concession,
while the southern portion lies within the Don Luis del Oro concession.
| | | 4 |
Table 4-1 El Compas Mineral
Concessions

| | | 5 |

Figure 4-2 Concession Map (Source:
Marlin Gold 2015)
| | | 6 |
All the concessions listed in Table
4-1 are 100 % owned by Oro Silver according to the due diligence report by Cereceres Estudio Legal SC (2015).
These have been acquired directly by
Oro Silver from the Mexican government or purchased from other concession owners as noted in Figure 4-2. Concession acquisition
is based on multiple payments over the years.
Permits are in place, and environmental
permitting is discussed further in Section 20 of this report.
| 4.5 | Surface Rights and Access |
There is a surface access contract in
place between Oro Silver and Maricela Bañuelos Arellano for a 53 hectare plot covering some of the key ground at El Compas,
specifically on the Don Luis del Oro and La Virgen concessions with a small block kept out of the agreement for a surface quarry.
The term of the surface access contract expires in 2024 and is adequate for surface facilities and underground portal access.
The quarry which is on the south side
of the project continues to operate regularly and trucks are used to transport supplies to and from this project through the nearby
suburb.
Oro Silver has acquired also 12 hectares
of land for installation of the surface support facilities required for the construction and operation of the project.
There are two royalties on the El Compas
project properties.
The Altiplano group of concessions include
La Virgen 2, La Casi Virgen 3 Fracc A, La Casi Virgen 3 Fracc B, La Casi Virgen 6, Don Luis del Oro and Don Luis del Oro. These
concessions have a three percent NSR royalty on them payable to the previous owners including Exploraciones del Altiplano.
The remaining concessions have 1.5 %
NSR royalty payable to Marlin Gold. This includes the El Compas and El Orito concessions on which the present Mineral Resource
estimate and PEA is located on.
| 4.7 | Environmental Liabilities |
There are no known environmental liabilities.
| | | 7 |
| 5 | Accessibility, Climate, Local Resources, Infrastructure and Physiography |
El Compas is accessed by an all-weather
gravel road, one kilometre from the paved roads in the southern part of the city of Zacatecas. Land use in the area is open range
cattle ranching, building stone quarries and some recently constructed nearby housing.
Zacatecas city is the second largest
city in the state after Fresnillo with a population of 138,000 (2005, http: //www.en.wikipedia.org/wiki/Zacatecas). Highways 45
and 49 connect the city to other major centres in Mexico by road, and an international airport (at 2,140 metres elevation) connects
Zacatecas with Mexico City and the U.S. by daily flights. The Central Mexican railroad connects Zacatecas to Mexico City and the
USA at Juarez as well as international ports.
The El Compas property is generally
gently rolling to flat, just outside the city, and all parts are accessible.
The La Plata processing facility is
located on the northern side of Zacatecas and connected via the road network of Zacatecas to the El Compas project site. Roads
are well maintained gravel for the final few kilometres to the mine and processing facility sites from Zacatecas.
| 5.2 | Climate and Vegetation |
The climate and vegetation in Zacatecas
is typical of the high altitude physiographic region known as the Mesa Central, with a summer rainy season from May to September
averaging 15.6°C, and dry winters from December to February, with an average temperature of 10°C. Total annual precipitation
is about 430 millimetres, and the average annual temperature is about 13.4°C (http://www.zacatecas.climatemps.com/). The elevation
of the city of Zacatecas in the project area lies at about 2,430 metres.
Work can continue year round in the
Zacatecas region.
| 5.3 | Local Resources and Infrastructure |
Zacatecas the state capital along with
the adjoining City of Guadalupe, are modern and fully serviced cities. Electrical power, water, sewage treatment and telecommunications
are available on or near to the property. Many local resources, such as experienced labour, operational services, petroleum products,
equipment and materials are available in the city.
The region can provide a wide range
of manpower skilled in all aspects of mining, processing and administration.
There is access to power via power line
and transformer installations at the existing mine access area. The line capacity allows for 480V usage with conversion to 120V.
This power supply is currently available for basic dewatering of the underground workings and will also be required for ventilation.
| | | 8 |
The processing plant with a tailings
facility is existing, permitted, road accessible and located near the mine on the other side of Zacatecas from the El Compas mine
site. There is grid electricity at the processing facility. The processing facility has an agreement with Minera Capstone to provide
water for processing. The existing road network around Zacatecas
will be used for moving material from the mine to the processing facility and supplying both the mine and processing facility with
material and staff access.
The physiography of the region is dominated
by basin-and-range type topography, with broad north-north-east trending valleys separated by narrow mountain ranges. Zacatecas
city, and the property, occurs in the Sierras de Zacatecas. The Graben de Calera lies to the west of the property. Topographic
relief on the property is low, gentle and vegetation is dominantly cactus, maguey, sage and grass.
| | | 9 |
| 6.1 | Production History of the Region |
Mexico is the largest silver producer
in the world (2014, https://www.silverinstitute.org/site/supply-demand/silver-production/). This position is significantly due
to production from Zacatecas state, at Fresnillo and Somberete. Zacatecas state produces more silver than all other Mexican states
combined (http://www.coremisgm.gob.mx/productos/anuario/Capitulo_2.pdf).
Pre-Hispanic exploitation was likely
mining the native silver in the oxide zone on the top of the veins near Zacatecas. Zacatecas city was founded in 1546, after the
discovery of silver vein systems by Juan de Tolosa after he was directed to them by the local indigenous population. In a little
more than a century, Zacatecas state became Mexico’s largest silver producer, and the city was the second largest in the
country after Mexico City. As in many mining districts in Mexico, production ceased during the Mexican Revolution from 1910 to
1917. Production resumed in some areas by about 1936. Historic silver production estimates exceed 1.5 billion ounces from the state
and 750 million ounces from the Zacatecas district.

Figure 6-1 Map of Historic Workings
and local Geology at El Compas (Source Oro Silver, 2008)
| | | 10 |
| 6.2 | History of the El Compas property |
The history of the El Compas is not
well documented. The source of this summary is the 2008 report by Oro Silver (Jutras, et. al. 2008).
The El Orito mining district was first
exploited in 1570 and intermittently thereafter to about the time of the Mexican Revolution. Most historic mining was by small-scale
shaft excavations. The two largest shafts in the Resource area are located on the El Compas concession and are known as El Compas
and La Predilecta (Figure 6-1). The El Compas Shaft has a reported depth of 115 m, while the depths of mining shafts on the
northern part of the concession and to the north-east at El Orito are unknown. Other historical workings are known to exist on
the property but these have not been investigated by Oro Silver.
From the mid 1990’s until the
present, a number of companies have explored the El Orito district.
Monarch Resources Limited conducted
exploration in the area in 1996 that included 829m of diamond core drilling in 4 holes (“MLV” holes) that tested the
El Compas 2 and Escuadra Veins, located about 600 m east of the El Compas Vein. The results of the drilling are not known.
The Consejo de Recursos Mexicanos mapped
and sampled the surface and underground exposures on the El Compas Concession in 2001, and produced a non-NI 43-101 compliant Resource
estimate.
Aurcana Corporation conducted exploration
in the area in 2003-2004 that included 1,899m of diamond core drilling in 9 holes (“LVDD” holes) that further tested
the El Compas 2 vein. One of these holes is reported to have intercepted 13.2 g/t Au over 4.46m (non-NI 43-101compliant).
Boliden Mining Company conducted exploration
in the area prior to MHM, but the exact dates are not known. According to MHM documents, Boliden drilled four diamond core holes
(“BDDV” holes) that targeted the El Compas 2 vein south of the historic Aurcana drilling. One of the holes intercepted
mineralisation grading 3.5 g/t Au and 25.0 g/t Ag over 0.55m.
Contracuna l, S.A de C.V worked the
El Compas veins by underground ramp-in-ore mining from about 2002 until late 2007. The mining rate from 2002 until late-2006 was
estimated by Oro Silver to be 50 to 100 tonnes per day, with an average weighted head grade of 4.7 g/t Au and 86.7 g/t Ag, and
based on incomplete records for 55,140 tonnes of ore shipped to the Veta Grande mill.
MHM extensively explored the El Orito
district during 2005. A major part of the program involved focused work at the El Compas vein system.
District-wide surface exploration by
MHM identified numerous targets characterised by north and/or north-west trending mineralised veins and faults, eight of which
were tested by diamond drilling. In total 5,516m of drilling in 20 NQ holes were completed. Results of the drilling confirmed the
presence of significant gold and silver grades at depth in a number of the target structures tested. Significant results include
15.2 g/t Au and 155.0 g/t Ag over 1.05 m from the El Compas 4 vein, located roughly 1.4 km south-east of the El Compas vein.
At El Compas MHM carried out 1:1000
scale surface mapping, and collected 60 surface outcrop and 469 underground channel samples for analysis. Twenty HQ and NQ diamond
core holes totalling 5,788m tested the El Compas vein structure over nearly 1,000 m of horizontal strike length, at about 25 to
50 m spacing in the mine area, and about 100 m spacing south of the mine, at depths of 60 to 400 metres below surface. Results
of drilling confirmed the presence of significant gold and silver grades at depth particularly within the Adit Zone ore chute.
The results of the MHM drilling at El Compas were utilised in the current Resource estimate.
The previous Resource estimate is outlined
in Section 14.11.
| | | 11 |
| 6.3 | History of the La Plata Processing Facility |
The processing facility was constructed
by the state government of Zacatecas for processing of ore from small miners in 2012. A portion of processing tonnage continues
to be available for small miners under Oro Silver as part of the lease agreement with the government. It operated from 2012 until
late 2014.
In November, 2015 it was assigned to
Oro Silver based on a monthly rental fee and an allowance for capacity to process local small miners’ ore on a toll basis.
The La Plata site is fully permitted
for the flotation equipment presently installed including the existing tailings impound.
| | | 12 |
| 7 | Geological Setting and Mineralisation |
Section 7 is sourced largely from Jutras,
et. al. 2008 and Rigby, et. al., 2011.
The Zacatecas Mining District covers
a belt of Tertiary aged epithermal vein deposits that contain silver, gold and base metals including copper, lead and zinc. This
is located in the southern Sierra Madre Occidental Physiographic Province in north-central Mexico. The dominant structural features
that localise mineralisation are of Tertiary age and are interpreted to be related to the development of a volcanic centre with
subsequent caldera development and to north-westerly trending basin-and-range structures. The Zacatecas Mining District occurs
in a structurally complex setting associated with siliceous subvolcanic and volcanic rocks underlain by sedimentary and metasedimentary
rocks.
The boundary zone between the Sierra
Madre Occidental and Mesa Central geologic provinces is marked by the north-west striking Rio Santa Maria fault system. This is
a major fault system extending from the city of Durango in the north-west to the city of San Luis Potosi in the south-east. The
Tertiary volcanic rocks which presumably overlay older rocks of the Mesa Central have been uplifted and eroded. The Rio Santa Maria
fault zone also separates a region of lower elevation and lower relief to the north from higher elevation and higher relief topography
to the south.
The regional geology was mapped and
described by Caballero Martinez and Rivera Venegas (1999) and Caballero Martinez and Rivera Venegas et al. (1999) Regional Geology
(Source Oro Silver, 2008) Figure 7-1
Mesozoic rocks occur north and west
of Guadalupe and Zacatecas. The oldest rocks in the region are upper Triassic phyllites, arenites and limestone of the Zacatecas
Formation. These are overlain by upper Jurassic to Cretaceous phyllite, silty limestone and volcanic rocks of the Chilitos Formation.
The western part of the Sierra de Zacatecas is underlain by lower members of the Chilitos Formation and the eastern part by volcanic
rock-dominant upper members of the Chilitos Formation. The Chilitos and Zacatecas Formations dip gently to the north- north-east.
Disconformably overlying the Chilitos
Formation, and outcropping in Zacatecas and Guadalupe, is the lower Tertiary Conglomerado Rojo de Zacatecas dating between 29 and
50.9 Ma. This red-purple polymictic conglomerate unit is correlated with the Conglomerado Rojo de Guanajuato and other continental
red bed occurrences in the Mesa Central.
The occurrence of this conglomerate
provides evidence of pre-Oligocene extension that predates extension temporally related to volcanism of the Sierra Madre Occidental
(SMO). Discordantly overlying the Chilitos Formation and Conglomerado Rojo de Zacatecas are felsic volcanic rocks of the SMO. Rocks
of the SMO occur south of Zacatecas and Guadalupe, the lowermost part of which is the Calerilla-Guadalupe Formation (46.8 Ma),
comprising a thin, discontinuous volcanic breccia. The La Virgen Formation (36.8 Ma) overlies the Calerilla-Guadalupe Formation
comprising thick-bedded ignimbrite and minor rhyolite tuff. The Los Alamitos Formation is an overlying, Miocene-aged ash flow with
lithic fragments, up to 40m thick. Partially welded, biotite phyric ashflows of the Pliocene La Capilla Formation, up to 100m thick,
cap the sequence.
Tertiary felsic plugs and dykes cut
all the units. Intermediate plugs and dykes of Mesozoic age, locally known as the Roca Verde, intrude the Mesozoic sequence. Early
Cenozoic to Mesozoic rocks have been affected by Laramide shortening, and all rocks are cut by faults related to mid to late Tertiary
extension. Extension was episodic, occurring at 26 to 27 Ma, 24Ma, and 11Ma. Tertiary faults are N-S to NNE, NW and occasionally
NE trending. The timing relation between
these fabrics is uncertain, though the lack of consistent cross-cutting relations suggests faults experienced coeval motion. Aranda-Gomez
and others (2007) observe NW faults cut by N-S faults in the Zacatecas area.
| | | 13 |
The timing of initial motion on the
Rio Santa Maria fault may be 27 to 32 Ma (Aranda-Gomez et al., 2007), older than extension affecting rocks of the SMO and the roughly
11Ma age of most N-S faulting. Red bed sedimentary sequences are suggested by the same workers as temporally related to the early
phase of extension and spatially related to the structures accommodating that extension.
Epithermal vein systems in Mexico largely
date from 48Ma to 18Ma and are controlled by Tertiary extensional structural fabrics, as is volcanism of the SMO. In the Zacatecas
region, most vein systems are closely associated with the intersection of NW and N-S trending faults, though the first-order control
appears to be the NW striking fault fabrics of the Rio Santa Maria fault zone.
The nearby vein systems at Fresnillo
and Real de Angeles have been respectively dated at 32-28 Ma and 45.2 Ma, suggesting an Eocene to Oligocene age for intermediate
sulfidation state veins in the Zacatecas area. The timing for mineralisation therefore corresponds to the initial phases of felsic
volcanism in the SMO and motion along the north-west trending Rio Santa Maria fault zone. Zacatecas hosts low to intermediate sulfidation
style vein systems and exhalative base and precious metal sulfide systems.
Intermediate sulfidation style vein
systems (Veta Grande, San Acacio) occur in the Chilitos Formation. These are silver-rich base metal+quartz+calcite veins and breccias
with very low gold content (typically less than 1.0 g/t gold in ore) and abundant sulfides.
Low sulfidation style veins occur in
the El Orito Zone at El Compas, and are unique in the Zacatecas district. They are gold-rich, silver-poor (Ag/Au of about 6.7:1
to 20:1), with very low total sulfide and base metal content. Epithermal veins with a low sulfidation style occur in both the Chilitos
Formation, and overlying felsic volcanic rocks of the La Virgen Formation. Exhalative sulfide mineralisation (San Nicholas, Francisco
I Madero) occur in the marine sedimentary rock sequence of the Mesa Central. The Cozamin deposit, of Capstone Gold on the other
side of Zacatecas, is described as an intermediate sulfidation style vein system, overprinted by an intrusion-related disseminated
sulfide system.
| | | 14 |

Figure 7-1 Regional Geology
(Source Oro Silver, 2008)
| | | 15 |
The veins at El Compas strike predominantly
north and north-west and are hosted partly in volcanic and sedimentary rocks of the Chilitos formation and partly in overlying
volcanic rocks of the La Virgen formation. At least five low sulfidation epithermal veins were historically exploited by several
small shafts at the El Compas and El Orito concessions for gold and silver.
The exploitation by Contracuna at El
Compas between 2002 and 2008 of two of these veins was by a ramp-in-ore. Contracuna reports on their mine plans state about 1,215m
of ramp development, to a depth of about 90m below the portal elevation.
The El Compas project area is underlain
by andesite and phyllite of the Chilitos Formation in the north (light brown in Figure 7-1), and felsic volcanic rocks of the
La Virgen Formation in the south and east (pink in Figure 7-1). The La Virgin Formation is a thick sequence of massive, columnar
jointed Tertiary ignimbrites, rhyolite flows, and sandstone. Midway between the El Compas Adit and Shaft zones the Escuadra fault,
a significant NW striking and SW dipping district scale structure cuts the local stratigraphy and has juxtaposed Chilitos Formation
and La Virgen rocks in fault contact with one another on surface. The El Orito vein is within the La Virgin Formation with a large
sedimentary component.
Intense argillic alteration with strong
Fe-oxide is observed at the andesite-rhyolite contact on the first level of the ramp. In the andesite, narrow zones of argillic
alteration occur in the wallrocks to quartz veins and some veinlets. Chlorite and fine-grained epidote alteration of the propylitic
zone occurs as distal alteration associated with the quartz veins. The width of the propylitic zone is up to 5 times the vein width.
In rhyolite, proximal wallrock alteration comprises narrow zones of silicification, fracture controlled Fe-oxide and argillic alteration
Numerous fault-hosted veins occur on
the Property. Faults and veins are primarily north-south trending and steep west to vertical dipping. North-west trending faults
and fault-veins are moderate to steep south-west dipping.
| | | 16 |
On the El Compas claim, north and north-west
trending fault-veins merge across zones of curvilinear veins, faults, veinlets and fault-related cleavages. Fault-veins correspond
to areas of steeper topographic gradient suggesting fault motion has at least partially controlled topography. In felsic rocks,
faults are characterised by narrow fault cores containing gouge, quartz-matrix breccias, sheeted quartz veins and single planar
veins. Damage zones in the fault walls are narrow zones, and cleavage intensity and quartz veinlet density decrease away from the
fault core. Veins occupying the fault core are typically <1m in width. Rocks of the Chilitos Formation are cut by more numerous
faults and cleavages, and veins occupying the fault cores are often >1m wide. In the El Compas ramp, the anastomosing Veta Bajo
and Veta Alto (referred to collectively as the El Compas veins by MHM) are typically separated by 2 metres of wallrock and are
individually 2 to 4 metres in width. Where these structures merge, continuous vein widths up to 22 metres are observed. Furthermore,
drilling has confirmed that potentially economic material extraction from the El Compas UG mine comes from a steep north plunging
to subvertical chute within the plane of the Veta Bajo and Veta Alto veins.
| 7.6 | Vein Textures and Mineralogy |
At the El Compas concession,
northerly trending veins in the Chilitos Formation have finely banded, coliform and crustiform open space fill textures.
Bladed quartz after calcite textures are common. Veins in felsic rocks are comprised of saccharoidal to fine-grained quartz,
banded veins. Wider veins in felsic rocks are observed in the Cantera pit and at the El Compas shaft. These veins show
breccia and bladed quartz-after calcite textures. Calcite is observed in bands in large andesite-hosted quartz veins and in
veinlets distal to mineralised zones in very weakly propylitised rocks. Within the El Compas ramp, the widest calcite veins
(>0.75m, both black and white coarse grained calcite) occur as north-west trending veins. Large northerly trending calcite
veins have not been observed on surface or in the El Compas ramp; however, thick calcite-rich quartz veins were intersected
by drilling at deeper levels below the mine and elsewhere that appear to correlate with the north-south trending El Compas
and other veins. Sulfide abundance in veins rarely exceeds 5%, and is most abundant in the mineralised veins. Pyrite or
pyrrhotite are the most common sulfides. Rare sphalerite and exotic copper was observed at the 7th level of the El Compas
ramp. Magnetite was identified in panned concentrates from the mineralised veins.
| | | 17 |
The El Compas and El Orito veins have
the characteristics of a low sulfidation epithermal vein system. They occur in a region characterised by numerous, high silver-grade
intermediate sulfidation epithermal vein systems. See Figure 8-1 on the left side and centre for the model by Corbett, 2004.
Epithermal systems may be classified
as high, intermediate and low sulfidation styles. They are characterised by the sulfidation state of the hypogene sulfide mineral
assemblage and show general relations in volcano-tectonic setting, precious and base metal content, igneous rock association, proximal
hypogene alteration and sulfide abundance (Sillitoe and Hedenquist, 2003). Ore in all occurrences of the type form under epizonal
conditions, which is generally within 2 kilometres of the paleo-surface. Veins in epithermal systems often display textures indicative
of repetitive and sustained open-space filling, and boiling.

Figure 8-1 Epithermal Deposit
Model (from Corbett, 2004)
Significant members of the low sulfidation
class of epithermal systems include Sleeper, Midas, and El Penon. Those associated with bimodal basalt-rhyolite sequences and sub-alkaline
magmas display illite proximal alteration zones, with adularia and local fluorite. They generally display low total sulfide content
(<2 volume %). Base metal sulfides occur in very low abundance, and systems tend to be gold-rich. Selenides are common in some
systems. The alkaline magma associated systems (not under consideration here) are temporally associated with alkaline basalt and
trachyte, have roscoelite-bearing illite+adularia proximal alteration and more abundant sulfides (up to 10% volume). Selenides
are uncommon in alkaline magma associated systems. Both subclasses contain pyrrhotite, pyrite and minor arsenopyrite. Low sulfidation
epithermal systems often have silver:gold ratios of ≤15 and <200 ppm copper (Sillitoe and Hedenquist, 2003).
| | | 18 |
Low sulfidation epithermal veins are
generally not considered transitional to intermediate sulfidation state epithermal systems (Sillitoe and Hedenquist, 2003), although
this is based solely on the different tectonic environments under which they may typically form. It does not exclude them from
occurring in a similar area however. Significant members of the intermediate sulfidation epithermal class are well represented
in Mexico and include Fresnillo and Pachuca-Real del Monte. They are related to andesite, rhyodacite and occasionally rhyolite
sequences. Adularia is rare to absent in the proximal alteration assemblage, and the gangue contains abundant, often manganiferous,
carbonate. Sulfide content in veins typically exceeds 5% volume and comprises pyrite, iron-poor sphalerite, galena, chalcopyrite,
and tennanite-tetrahedrite.
Selenides and pyrrhotite are uncommon,
and Mexican examples tend to be Ag-rich, with Ag:Au exceeding 10:1, and often >100:1. Most significant members of both classes
have vertical mineralised extents of <1km, often <500 m. Ore is hosted by fault-related veins and breccias, and elevated
precious metal content occurs in plunging, lenticular zones within the plane of the vein (“chutes”).
Vertical zonations in metal content
occur in some low and intermediate sulfidation state systems. In systems displaying such zoning, gold, silver, mercury and tellurium
are relatively enriched in the upper portions of the system, and base metal contents occur in higher concentrations at deeper levels
in the system.
| | | 19 |
Section 9 is sourced largely from Jutras,
et. al. 2008 and Rigby, et. al., 2011.
| 9.1 | Exploration by Minera Hochschild |
At the El Compas vein system, MHM conducted
1:1,000 scale surface mapping and collected 60 surface and 469 underground channel samples for analysis. Twenty HQ and NQ diamond
core holes were also completed. The report on work this was completed in 2005.
| 9.2 | Exploration by Oro Silver |
Oro Silver Resources Ltd. personnel
first visited the El Compas property in September of 2006. Between September and October of 2006, Mr. Charles Tarnocai and Ms.
Anna Fonseca conducted a preliminary field evaluation of the El Compas concession that included surface mapping and select surface
and underground sampling. Mr. Tarnocai was again in the field in February 2007. Results of the underground sampling confirmed historical
production grades reported by Contracuna.
Based upon the positive results of preliminary
investigations, a more comprehensive exploration program was undertaken. Detailed surface mapping and surface and underground sampling
took place from March through mid-June 2007, concurrent with negotiations for the El Compas mining and concession rights. The underground
samples evaluated the relationship between grade and different vein types exposed in the ramp. Results indicated that both north
and north-west components of the El Compas vein system carry precious metal mineralisation. By the end of May 2007, three hundred
and seventy, one metre rock chip samples in forty-six channels spaced at about 25 metres apart along the El Compas mine ramp had
been collected and were submitted for analysis. These were done by a dedicated team on a systematic basis from a scaffolding with
tarps lain underneath. All reasonable efforts were made to limit the bias and collect a sample representative of the channel marked.
Samples were submitted to the same laboratory as the diamond drill core for the same analysis. The line locations were picked up
by the surveyor.
In September 2007, Oro Silver filed
its first Technical Report on the El Compas property for NI 43-101 purposes (Thiboutot and Tarnocai, 2007).
Starting in October 2007, historic MHM
core acquired from the owner of the El Compas concession as part of the option agreement was re-logged for lithology, alteration,
mineralisation and vein percent. As a validation check of historical assays, approximately 10% of the 825 samples originally prepared
and submitted by MHM for analysis were re-sampled by Oro Silver. Eighty quarter core samples were prepared from remaining half
core using a diamond core saw and submitted for analysis. An additional 1,025 half core samples were prepared by Oro Silver from
previously non-sampled intervals of MHM drill core and also submitted for analysis.
All aspects of exploration work were
supervised on a day-to-day basis by Oro’s Chief Geologist Eric Grill from June 2008 through Nov 2010. In July 2009, Oro Silver
initiated a surface exploration program in the vicinity of the historical mine workings. Anna Fonseca, P.Geo, consultant to Oro
Silver, collected 85 reconnaissance rock samples from surface outcrops over a 1km by 1.5km area in the vicinity of historic mine
workings and from underground exposures for analysis by infrared spectroscopy analysis. The resulting spectral mineral assemblage
showed a distinct mineral zonation that included buddingtonite with respect to north and north-west trending veins within the survey
area, and as such, could be used to vector towards mineralised centres. Additional sampling was recommended to identify possible
alteration centres elsewhere on the property.
| | | 20 |
A detailed survey of the underground
openings and channel sample locations was completed by May 2008. The underground survey data was utilised to construct a three
dimensional void model for Resource modelling purposes. The drill collars were picked up by the same surveyor.
In October 2009, Oro contracted Ward
Kilby of Cal Data Limited to acquire and analyse ASTER multi-spectral imagery covering the El Compas property. Some of the multi
and hyper spectral image analysis techniques identified large clay-rich zones within the property that could be related to a hydrothermal
alteration event.
During October-November 2009, Oro contracted
Geofisica TMC to carry out ground geophysical IP and magnetometer orientation surveys in the vicinity of the historic mine workings.
Magnetometer survey lines were oriented east-west, spaced 100m apart and covered the main mineralised portions of the El Compas
and El Orito veins. Two, wide-spaced magnetometer lines were also oriented north-east to test the north-west trending Escuadra
fault. The IP survey consisted of one east-west oriented line and two north-east oriented lines. The results of the surveys were
mixed. The magnetometer survey highlighted the El Compas vein above the underground mine workings, but not the El Orito vein. Neither
did it respond to the Escuadra fault. The IP survey locally produced a strong response over the Escuadra fault but was not able
to distinguish the El Compas or El Orito veins.
The exploration work conducted by MHM
and Oro Silver meets current industry standards. The geologic mapping, surface sampling, geophysical surveys and exploration drilling
programs are all appropriate for the type of mineralisation found at El Compas. The drilling programs are well planned and carried
out in a prudent and careful manner. All drill core and RC chip logging and sampling has been done by trained and professional
personnel and includes industry standard quality control programs.
| | | 21 |
From the mid 1990’s until the
present, a number of companies have explored the El Orito district. Monarch Resources Limited conducted exploration in the area
in 1996 that included 829m of diamond core drilling in 4 holes (“MLV” holes) that tested the El Compas 2 and Escuadra
Veins, located about 600 m east of the El Compas Vein. The results of the drilling are not known.
Aurcana Corporation conducted exploration
in the area in 2003-2004 that included 1,899m of diamond core drilling in 9 holes (“LVDD” holes) that further tested
the El Compas 2 vein. Boliden Mining Company conducted exploration in the area prior to MHM and drilled four diamond core holes
(“BDDV” holes) that targeted the El Compas 2 vein south of the historic Aurcana drilling. One of the holes intercepted
mineralisation grading 3.5 g/t Au and 25.0 g/t Ag over 0.55m (non-NI 43-101 compliant).
District-wide surface exploration in
2005 by MHM identified numerous targets characterised by north and/or north-west trending mineralised veins and faults, eight of
which were tested by diamond drilling. In total, 5,516m of drilling in 20 NQ holes were completed. Results of the drilling (non-NI
43-101compliant) confirmed the presence of significant gold and silver grades at depth in a number of the target structures tested.
Significant results include 15.2 g/t Au and 155.0 g/t Ag over 1.05 m from the El Compas 4 vein, located roughly 1.4 km south-east
of the El Compas vein. Other results include 55.9 g/t Au and 368.0 g/t Ag over 2.50 m (not true width) from drill hole HOC-16,
from beneath the El Compas ramp. Assay results from the MHM drill program at El Compas were utilised in the current Resource estimation.

Photo 10-1 Drill Hole Collar
Marker at El Compas
During late 2007, the results of Oro
Silver work, in conjunction with available historical data, were used to define and prioritise drill targets for a 5,000 metre
diamond drill program. The overall objectives of the program were the delineation of the El Compas Adit and Shaft zone ore chutes
to greater depth, and the evaluation of parallel structures. An additional objective was the discovery of one or more new, and
potentially economic, mineralised ore chutes and a preliminary evaluation of their size.
| | | 22 |

Figure 10-1 Drilling by MHM
(Source Oro Silver, 2008)
From November 2007 to April 2008, Oro
Silver completed a Phase 1 diamond drill program consisting of 5,399 metres of HQ diameter core in thirty-seven surface exploration
holes over portions of the El Compas and El Orito vein systems, from which a total of 1,498 core samples were prepared and submitted
for analysis. The El Compas shaft zone drilling was not completed as originally proposed following reinterpretation of available
data. The maximum hole depth for the 37 holes was 246.55m, and the average hole depth was 145.93m. Results of the Oro Silver drill
program confirmed and expanded on results obtained by MHM in 2005. The results from both MHM and Oro Silver drilling were utilised
in the current Resource estimate.
| | | 23 |
Phase 2 exploration by Oro took place
between June 2009 and September 2010, during which time Oro completed 5,912m of combined diamond core and reverse circulation drilling
in 39 holes. During the same period, it also completed an extensive property-wide surface exploration program. The objectives of
the Phase 2 drilling were to expand the El Compas and El Orito Resources where they were still open, upgrade Inferred Resources
to the indicated category by infill drilling, confirm the continuity of grade and thickness in areas of higher grade mineralisation with close spaced drilling,
and finally, to test the El Compas and other veins for higher grade gold and silver mineralisation at significantly deeper levels
than in the past.
From February to April 2010, Oro conducted
a deep drilling program consisting of RC pre-collars and HQ/NQ diamond core tails for a combined total of 2,330m in 4 holes. One
hole tested the El Compas vein more than 200m below the historic workings and 100m below the deepest known, well-mineralised intercept.
The other two holes, targeted the El Compas and El Compas 2 veins south of the historic El Compas shaft, at greater than 600m below
surface, where they were projected to intersect the Escuadra fault, a prominent north-west trending regional structure.
From April to November, the surface
exploration program was expanded to cover the entire property. Prospecting, geochemical sampling and collection of outcrop samples
for analysis by infrared spectroscopy, at regular spaced intervals along north-east oriented lines was completed. Additionally,
geological mapping was done at 1:5,000 scale in areas identified by prospecting as interesting and 1:1,000 scale in selected areas
identified as high priority. These property-wide studies were concluded towards the end of 2010, and results are still being analysed
and interpreted.
During August and September 2010, an
infill and close spaced diamond core drill program totalling 1,093m in 12 holes was completed at the El Compas and El Orito Resource
areas. At the El Compas vein, nine holes (includes two abandoned holes) tested the El Compas vein at 15m centres in the area surrounding
a higher-grade intercept. At the El Orito vein, three infill drill holes were completed in the area surrounding a higher-grade
intercept.
In July and August of 2011, further
drilling was undertaken. A total of 20 holes with 2,952m of drilling were completed. The targets in this drilling included the
El Compas and El Orito veins, stepping out and below existing intercepts and underneath fault zones.
The total drilling by Oro Silver in
the three phases comes to 14,263m.
| | | 24 |

Figure 10-2 Drill Plan with
existing underground workings
| 10.2.4 | Surveys and Investigations |
Oro Silver contracted GMTZ to complete
a detailed topographic survey at 1m contour intervals over the El Compas and El Orito veins for the purpose of Resource estimation
work. The drill hole collars were located during this survey and are on this survey datum. The topography outside this immediate
survey area is not at the same detail and appears to be on a similar but different elevation datum.
The exploration work conducted by MHM
and Oro Silver meets current industry standards. The geologic mapping, surface sampling, geophysical surveys and exploration drilling
programs are all appropriate for the type of mineralisation found at El Compas. Drill recovery rates were high and adequate for
this project. The drilling programs are well planned and carried out in a prudent, profession and careful manner. All drill core
and RC chip logging and sampling has been done by trained and professional personnel.
| | | 25 |
| 11 | Sample Preparation, Analyses and Security |
According to the report by Oro Silver
in 2008 and repeated in the SRK report of 2011, the following processes were used in sample preparation.
Sampling methodology and approach were
not documented in any MHM reports obtained by Oro Silver. Limited information on sampling was inferred by Oro Silver personnel
from direct inspection of core boxes and their contents and from assay certificates. Based on the evidence gathered, Oro Silver
believed that MHM core sampling took a systematic and organised approach.
| 11.1 | Minera Hochschild Drilling |
The core boxes were clearly identified
with hole name, box number and from-to interval. Drill hole depths were recorded on blocks inserted by the drillers every 3.05
m or less. Depth measurements calculated by MHM tied in well with the driller blocks.
The start and finish of sample intervals
were identified with marks on the inside wall of the plastic core box channel using a red marker. The corresponding sample identification
numbers were written on the plastic channel, at the midway point of the sample interval, also with a red marker.
Core was cut into equal halves with
a diamond saw and one half was returned to the core box for storage while the other half was submitted for analysis. Sample weights
listed on lab assay certificates are typically in the 1-3 kg range and suggest that entire half core was indeed submitted for analysis.
MHM prepared and submitted for analysis
a total of 926 core samples from 20 HQ and NQ diameter holes. All holes were collared in HQ diameter core; NQ coring was limited
to the tail portions of the deeper holes. The minimum sample length was 5 cm, the maximum sample length was 3.05 m, and the average
sample length was 0.77 m. There were only 4 samples under 15 cm in length and only 8 samples over 2.0 m in length.
It is not known if MHM produced detailed
geological logs of the drill holes; the only geologic data available was recorded in the drill database and consisted of a single
data column identifying rock type, together with sample interval and assay results data.
It is not known whether geotechnical
logging such as core recovery or RQD was completed. Inspection of drill core in drill boxes, and in particular the mineralised
intervals, suggests that low core recovery was not a significant concern.
| 11.2 | Oro Silver Channel Sampling |
A total of three hundred and seventy,
one metre chip channel samples were systematically collected from forty-six channels spaced about 25 metres apart along the El
Compas mine ramp and submitted for analysis. Channel sample assay results were partially incorporated into the database utilised
in the Resource estimate.
Prior to sampling, an Oro Silver geologist
marked out the channels with spray paint on the back to be sampled. Where possible, the channels were oriented perpendicular to
the trend of the vein, beginning and ending in host rock at least 1 m either side of the vein zone hangingwall and footwall contacts.
Sample length was normally 1 m, but in some instances samples were slightly shorter or longer, so that sample breaks coincided
with vein zone hangingwall and footwall contacts. Samples were collected by 2 technicians using a hammer and chisel, with a plastic
sheet to catch sample material. Scaffolding was utilised to access backs when necessary. Samples were cut, described, and bagged
individually. Samples collected each day were security-sealed and removed from the mine-site. Sample blanks and gold standards
were included in every batch of 30 samples. All channel samples were shipped to the Inspectorate sample prep facility in Durango,
Mexico. This program was co-managed by Rolando Mendoza
Pina, a Mexican Geolgical Engineer with MGTZ, under the supervision of an OSR geologist. The collection of sample material and
subsequent surveying of sample locations was performed by GMTZ technicians.
| | | 26 |
Every effort was made to ensure the
sampling was continuous within the interval, understanding that differences in hardness between geologic material could result
in a sample bias. Neither Oro Silver nor GMTZ believed a sample bias exists in the El Compas channel sampling.
Oro Silver prepared and submitted for
analysis a total of 1,498 core samples from 20 HQ diameter holes in Phase 1. The minimum sample length was 3 cm, the maximum sample
length was 3.71 m and the average sample length was 0.99 m. There were 4 samples under 10 cm in length and 3 samples over 2.5 m
in length.
Four Phase l drill holes were sampled
in their entirety, and all others were selectively sampled. Selective sampling was based on the prospect for an interval to carry
gold or silver mineralisation. Priority was therefore given to sampling geologic features such as veins, vein stockworks, fault
zones and altered/mineralised host rock. As an added precaution, samples were normally taken for one metre above and one metre
below the prospective interval.
A core process flow sheet and protocol
manual was developed and implemented by Oro Silver for the core drilling program at El Compas. The relevant parts are summarised
below.
Once the core interval had been drilled,
it was placed directly in the core boxes by the driller. Every interval drilled, usually every core lift, was marked with a drill
hole depth marker using a wooden/plastic block with non-recovered intervals also indicated with wooden/plastic blocks.
| 11.3.2 | Drill Site to Core Logging Facility |
The core was collected at each drill
site at least twice a day and carefully transported, as to avoid mixing up the core or moving the drill hole depth markers, to
the core logging facility using a safe and appropriate vehicle. Before transport, a quick check was performed to ensure the proper
drill hole number was written on the core boxes and that from-to’s that were written on the core boxes make sense. It might
also be acceptable, under certain situations to ask the drillers to transport the core to the core logging facility.
| | | 27 |
| 11.3.3 | Core Logging Facility |
The core boxes were stacked by box number
in the core logging facility waiting area. They were grouped by drill hole so a second quick review of number of boxes, drill hole
number and from-to was done. The core boxes were moved, as required, to the core logging benches for geotechnical, geological logging
and sampling based on priority assigned to the different drill holes. The core was washed of its excessive mud except for the ore
zone intervals, which should remain untouched. The project geologists, in concert with the logging geologists, were responsible
to define priorities for logging.
The logging protocol and format was
provided in an Oro Silver document called “MOS Core Logging Manual”. The logging system has a principal objective to
ensure consistency in data recording and aid in future geological modelling. General procedures used by Oro Silver are summarised
as follows:
The order and name of the core boxes
was checked again; the core must be placed in the boxes beginning at the upper left and ending at the lower right when the depth/drill
hole mark was to the left of the logger facing the core boxes, the core was not snaked back and forth. The core runs were checked
for omission and/or errors. The core was lined-up within individual core boxes and between core boxes. The geologist does a walk-through
to determine which sections need to be cleaned, which sections need to be geo-technically surveyed, and to determine major breaks
of geotechnical & geological units. Prior to core logging, if applicable, the geologist or the technician complete the geotechnical
logging of RQD and recovery. If geo-technical logging was done by a technician, the geologists can, at the same time, initiate
the geological logging. The core was logged for lithology, structure, alteration and mineralisation. Geological information was
usually marked on the core using yellow wax markers; structural information can be marked on the core using a blue wax marker;
measured depth, if applicable, can be marked with a black wax marker. It was strongly recommended to note important geological
characteristics (rock types, structures, etc.) directly on the core so the core photos can “speak” for themselves.
After the geological logging, the geologist assigns the sample interval by marking the core with a red wax marker with arrows indicating
the start and end of the sample and the sample number mark in the middle of the interval; a centre line, based on geological characteristics,
was traced for sampling/cutting. A sample interval was typically 1 m in length, and no shorter than 30 cm unless it was a vein,
in which case the minimum length was 15 cm. Sample breaks should be adjusted to accommodate important changes in geology wherever
possible. The geologist was responsible to fill the proper data in the sample tag books (drill hole number, box number, from-to,
etc.). The from and to for all samples were also marked in red so there was no confusion between these and the core run blocks
or other information on the core. This allows for verification by the technician before/during sawing. The sample tag books were
given to the sampler. The sampler will verify the sample number written on the core and match it against one of the sample tags.
One of the small sections of the sample tags (there were three sections for each sample tag) was put in the sample bags in which
the sample will be put, one was stapled to the core boxes at the beginning of the sampled interval while the biggest section of
the sample tag was kept for reference. For duplicate samples, one of the small sections of the tag was put in an empty bag, while
the second small section of the tag was attached to the sample preceding the duplicate sample. For the blank and standard samples,
one of the small sections of the tag was attached to the bags while the other small section of the tag was stapled in the core
boxes (sample preceding the standard/blank samples). Note that it was always the same side of the cut core that goes in the sampling
bags, usually the right hand side. The geologists must make sure that the technician understands this step. The core boxes then
proceed to the photo station where every box was digitally photographed twice; first dry and then wet.
| | | 28 |
| 11.3.5 | Sampling and Bagging |
The core sampling protocol and format
was provided in a Oro Silver document called “MOS QA/QC and Assaying Procedures”. General procedures are summarised
as follows:
Sample numbers were assigned for each
interval to be sampled by the geologists, who will also control insertion of sample numbers for QA/QC samples: one standard, one
blank, and one duplicate for every batch of 30 samples. The QA/QC samples will be marked ahead of time in the sample book using
the stamps provided. The “from” and “to” for each interval must be checked by the technicians. The sample
numbers will be entered in the computer files on a daily basis. As an extra QA/QC procedure sample bags were prepared with the
sample number marked on the outside of the bag.
All surface core was sawed in half using
the centreline identified by the core logging geologists. The section being bagged for assaying was always the right hand side
of the sawed core sample. All samples to be shipped out were weighed and entered in the computer file. If necessary, the samples
were double bagged and the external bag was closed using a security tie-wrap. Approximately 25-30 kg of individual samples were
put in burlap bags for shipping, the burlap bags were also closed using a safety tie-wrap.
Once approximately 100 samples were
ready for shipping, a shipment form was completed. The forms included information such as sample numbers, type of samples and most
importantly a shipment tracking number. All drill core was shipped to the Inspectorate sample prep facility in Durango, Mexico.
| | | 29 |
The drilling prior to 2011 was reviewed
by SRK in the 2011 report by Rigby, et.al. 2011. MP has reviewed their summary of findings and agrees with their general assessment
of the data. The drilling in 2011 included the systematic insertion of industry standards, blanks and sample duplicates. The program
was small and only a limited part of the core was sampled and analysed. Therefore there were few samples inserted as standards,
blanks and duplicates. There were 20 blanks and 19 standards and duplicates found in the 2011 database.
Several errors and data overlaps were
found in an initial review of the total database, and then confirmed against field data such as drill logs. These errors were corrected
in the database to conform to the field data. A further review was made to confirm the rest of the database.
| 12.2 | Diamond Drilling 2011 |
MP staff reviewed the database and compared
multiple assay certificates to the database provided by Canarc. There were no errors found in the 2011 assays transcribed in the
audit samples, and no further changes to the assay portion of the database was made.
This is a gold deposit and the replication
of the samples is good but some values vary a bit from each other. Figure 12-1shows the samples on a scatter plot with the
blue line indicating a potential 1:1 relation. The grey line represents the best fit trend. It is high at 0.97 and heavily influence
by the single value near ~1.6/2.0. This scattering is felt to be caused by what is described as the “nugget effect”
and is within industry standards for a deposit such as El Compas. This is scattering is small and caused by the nature of gold
at El Compas that includes fine-grained free gold particles.

Figure 12-1 Duplicate Sample
plot
Oro Silver had a group of standards
sourced from CDN Labs of British Columbia, Canada. These were prepared and subsequently sent by CDN out to twelve worldwide laboratories
for round robin analysis. From this analysis of the round robin samples, a statistical review of the samples was prepared and published
with a two standard deviation recommended reference. Table
12-1 summarises the standards used throughout the drill and channel sample programs by Oro Silver and the recommended range
of error.
| | | 30 |
Table 12-1 Standards Used by
Oro Silver in 2011

There were 19 samples analysed of standard
material samples during the 2011 program. It appears that five of the samples marked as Standard1 were in fact mislabelled Standard2
samples. One sample was marked as Standard5 (which does not exist) but analysed within the recommended range for Standard 2 which
is close to five g/t gold. It is surmised by MP that a standard was inserted and rather than mark the name (Standard2) the geologist
recorded the approximate grade of five (g/t Au) as the standard name. These samples have been analysed by MP with the group as
Standard 2 below.
The standard 1 results are summarised
in Figure 12-2 with one sample above the range expected. This failed standard sample is part of a sample grouping that is outside
the area of the present Resource estimate.

Figure 12-2 Standard 1 (0.71
to 0.83 g/t Au recommended range)
| | | 31 |
The failure rate was very high for Standard
2 in 2011, as seen in Figure 12-3. There are also questions described above of the mislabelling. These mislabelled samples
are part of this analysis.
It seems that the failure rate is particularly
date specific in when there is over reporting of the gold grade. Only one over reported standard relates to a hole with a mineral
intercept included in this Resource estimate. Although unfortunate, it represents a very small part of the total sampling of the
Resource estimate, was not too far above the recommended range and will not significantly affect the Resource estimate.

Figure 12-3 Standard 2 (4.4
to 5.0 g/t Au recommended range)
Standard 3 was used once and was reported
back within the suggested range of two standard deviations.
As reported in the 2011 by SRK, blank
material was created from felsic rhyolitic rock collected from a rock quarry located south of the El Compas Mine. Collection of
material in Zacatecas for blanks has the potential to not be 100% clean of precious metals due to the extensive mineralizing system
locally. Blank material was not analysed prior to use as a control sample. It is not reported how it was prepared for use.
Oro Silver was using 5X the detection
limit to determine blank failures, which is a common industry practice. The detection limits is interpreted from the Access database
as 0.005 g/t gold. If a blank exceeds 0.025 g/t gold, the blank is considered a failure.
Oro Silver submitted 20 blank samples
for analysis in 2011. There was one sample that was swapped with a standard that was immediately next to it in the sequence. After
correction for the mislabelled standard, all the blanks passed below detection level for gold.
| | | 32 |
The records of the 2007 chip sampling
values are on assay certificates and in excel spreadsheets. A review of the two data sets was done and no variations in the data
were found.
Standards were inserted as a pair of
one Standard and one blank sequentially inserted every 30 samples.
There is one Standard that appears mislabelled
as Standard 2 but is well within the Standard 1 recommended range, so it was moved and analysed with Standard 1 samples.
There were no known duplicates collected
in the 2007 chip sampling program.
Two different standards from CDN Labs
were inserted into the sample stream as every 30th sample and expected values as noted in Table 12-1 above. These
are Standard 1 and Standard 2. There were seven samples of Standard 1 and six of Standard 2.
Standard 1 was inserted seven times.
The failure rate was high with two failing (29%) on the low side of the recommended anticipated values. The values are 0.676 and
0.700 when the two standard deviations is a minimum of 0.710 g/t gold. The values in the area of these samples are within the section
of samples used in the Resource estimate. Most are in holes that are outside of the area that was classified in this estimate as
part of the deposit.
Standard 2 was inserted into six samples.
There was one failure (17%) in this, and it was high at 5.400 g/t gold when 5.0 g/t gold was the recommended maximum value. This
sample is high but only represents a small area of the program, and therefore its influence is very low on the total program.
There were 13 blanks inserted into the
sample stream. The failure is considered values greater than 0.025 g/t gold as described above. Three of the thirteen samples failed
this test (23%). The sample with the largest failure is from a sample that is not related to data included in the Resource estimate.
This set of samples are in a group of samples surrounding this failed value that had poor location control in the data available
at the time of data loading and were not included for this reason. The other two failed values are 0.030 and 0.040 g/t gold. This
indicates the possibility of some cross contamination in the laboratory between samples, likely during sample preparation. This
is low and not economically significant. It is not known if this was followed up for remediation.
A stronger re-assaying and standard
failure review and follow up program would be recommended for future programs. The quality of data although poor is adequate for
this Resource estimate due to the fact much of the 2011 drilling was outside of the area used for the Resource estimate.
| | | 33 |
The standards inserted in the chip program
represent a small localised area and the close spacing means that influence for any one sample will be limited in the tonnage it
represents including the fact that there is a large depletion immediately below it.
Additionally, the majority of the data
is from programs of standard inserted and monitored programs in earlier drill campaigns. There may have been a very strong program
of quality control in 2011, but the documentation was not found by MP in the files found and reviewed.
The quality of the data used is adequate
for a study of this level and accuracy, but future sampling programs should have a more robust and more heavily documented quality
control program.
| | | 34 |
| 13 | Mineral Processing and Metallurgical Testing |
The use of the term “ore”
within this section relates to material that is considered to be representative of intended feed material for mineral processing
and metallurgical testing.
Historical laboratory studies were performed
on mineral samples by SGS Mineral Services (SGS) of Lakefield, Ontario for Oro Silver Resources Limited. Work included a variety
of metallurgical and mineral processing procedures, which SGS results provided in three reports. The principal results relating
to process testing consisted of the response of El Compas mineral samples to gravity, flotation, whole ore cyanide leaching and
slurry settling, and was titled “Recovery of Gold from Gold Samples from Mexico” and listed as SGS Project #11752-001,
in a report dated April 2, 2008 (SGS, 2008). This also included an appended mineralogical report dated December 18, 2007 performed
on a single higher grade sample. Additional reports were issued by SGS in November 2009 relating to ammonium thiosulfate leaching
and in July 2010 for preliminary evaluation of heap leaching using coarse ore bottle roll testing.
In December 2015, Tetra Tech Consulting
of Golden Colorado reported to Canarc on test work performed by RDI, a laboratory facility located in Colorado (Tetra Tech, 2015).
This report titled “El Compas Gold Silver Mine Zacatecas Mexico Metallurgical Test Results” (#114-910438) outlined
test procedures and data including determination of the Ball Mill Work Index, and results from gravity, and flotation studies that
also included leaching and filtration of a flotation concentrate.
A discussion and summary of the laboratory
work is provided below.
| 13.2.1 | Sample Preparation and Head Assay |
The samples for the SGS test programs
were received as 15 boxes of sub-samples that weighed 274 kg and that were blended into eight composites for testing. The original
sub-samples used for metallurgical testing were labelled numerically, representing exploration assay samples. The eight composites
were labelled based on their gold grade (see Table 13-1 below), with two each labelled as Low Grade (LG 1 & 2), Mid-Low
Grade (MLG 1 & 2), Mid High Grade (MHG 1 & 2) and High Grade (HG 1 & 2).
| | | 35 |
Table 13-1 SGS Metallurgical
Sample ID (Source SGS, 2008)

Each of the composites were crushed
to minus 1.68 mm (10 mesh), and analysed for gold, silver, total sulphur, sulphide sulphur, total carbon and multi-element analyses
by induced coupled plasma spectrophotometry (ICP). The results are presented in Table 13-2.
| | | 36 |
Table 13-2 SGS Head Analyses
(Source SGS, 2008)

The assay results show that gold grades
for the 8 composites ranged from 2.5 g/t to 38.5 g/t, and silver grade range of 48.7 to 213.0 g/t. Total carbon and sulphur were
reported at less than 0.5% and 0.08% respectively. The copper content ranged from 31 to 51 ppm, with zinc at less than 10 ppm.
One of the high grade samples showed 270 ppm arsenic (As) with the remaining samples containing less than 75 ppm As.
| | | 37 |
Samples used for the December 2015 RDI
laboratory test program consisted of 64 archived assay reject samples from drill core and underground chip samples representing
the El Orito and El Compas Zones. Views of relevant drillhole locations with label identifications are provided in Figure 13-1
to Figure 13-3.

Figure 13-1 Plan view of metallurgical
sample locations (with hole number of sample)

Figure 13-2 Longitudinal view
of metallurgical samples in the El Compas zone (looking west)
| | | 38 |

Figure 13-3 Longitudinal view
of metallurgical samples in the El Orito zone (looking west)
The samples were blended into three
composites, labelled as low, medium and high grade. Portions of these were then re-blended into two additional composites, labelled
as Grinding Sample and Composite 1. The Grinding Sample had a head assay of 7.8 g/t Au and 96.6 g/t Ag. Composite 1 had an average
of two head assays that gave 1.8 g/t Au and 33.3 g/t Ag. Based on this a test composite was generated, labelled as Composite 2,
which was made up of 29 wt.% of the Grinding Sample, and 71wt.% of Composite 1. Composite 2 had a calculated gold head grade of
3.6 g/t and was used for the RDI gravity and flotation test program.
The mineralogical evaluation was performed
by SGS on a sample labelled high grade HG2. Sample preparation involved heavy media separation using a media SG of 2.9. The float
portion gave gold and silver content of 24.8 g/t and 149.0 g/t respectively. The sink portion provided a gold grade of 765.0 g/t
and 1608.0 g/t silver. Both fractions had less than 0.05% sulphide sulphur.
Microscopic examination revealed that
quartz is the most abundant mineral followed by montmorillonite with trace amounts of magnetite and hematite. Gold particles primarily
occurred as electrum with an average indicated gold content of 64%. The size of gold particles ranged from 1 to 134 microns with
an average size of 19 microns. By frequency, 65.3% of the gold is considered liberated with 13.5% attached to iron oxides, silver
minerals (Ag-S-Se), pyrite and other non-opaque minerals with 21.1% locked primarily in iron oxides. Based on surface area, the
liberated, attached and locked gold grains accounted for 77.9%, 20.9% and 1.3% respectively.
The silver minerals occurred primarily
as Ag-S-Se with some gold silver alloys and native silver. Ag-S-Se particles ranged in size from 1 to 122 µm, having an average
size of 30 µm and an average silver content of 77.8%. Approximately 75.4% of the Ag-S-Se was liberated, and 9.4% attached
to iron oxides, gold and non-opaque minerals. The remaining 15.2% was locked primarily in iron oxides and non-opaque minerals.
Based on surface area the liberated, attached, and locked gold grains accounted for 86.3%, 10.3% and 3.4% respectively.
| | | 39 |
SGS provided grind time verses product
particle size on various samples to achieve the desired grind and determine its effect on process response and precious metal recovery.
The results suggest an optimum grind size of 80% passing particle size (P80)
of between 50 to 75 microns, discussed further below. No work index testing was performed.
RDI conducted a single Bond Ball Mill
Work Index (BMWI) test using a closing screen size of 100 mesh (149µ). The results provided a BMWI of 19.01 kWh/tonne, indicating
a hard ore. The majority of the RDI test work was performed targeting a P80 of 53 microns.
| 13.2.4 | Gravity Pre-treatment |
The SGS mineralogical study including
deportment of precious metals in heavy media and related size of gold and electrum particles suggest that El Compas potentially
economic material would benefit from gravity pre-treatment. As part of the SGS study, gravity pre-treatment was incorporated prior
to some flotation and leaching test work. The program included subjecting the ground material to a laboratory scale Knelson Centrifugal
Concentrator. The Knelson concentrate was cleaned with a Mozley table, and the entire Mozley concentrate was fire assayed with
results presented in Table 13-3.
| | | 40 |
Table 13-3 SGS Gravity Data
(Source SGS, 2008)

The Mozley concentrate grade ranged
from approximately 1,500 to 52,000 g/t for gold and from 2,200 to 50,000 g/t for silver. Gravity recovery represented 9-29% for
gold and 1-8% for silver.
Tetra Tech reported the RDI
gravity results from a series of 8 tests performed on Composite 2 prior to flotation and using similar gravity procedures
consisting of 1 kg charges into a Knelson centrifugal concentrator. The Knelson concentrate was cleaned using a lab scale
Gemini table. The results showed a range of recovered weight from 0.1% to 0.3%, with a gold recovery ranging from 25% to 35%,
into cleaned gravity concentrates grading from 375 g/t to
1430 g/t Au. Corresponding silver recovery ranged from 3.6% to 5.9% into a concentrate grading from 867 g/t to 3230 g/t Ag.
| | | 41 |
The historic SGS work consisted of seven
2 kg flotation tests performed at natural pH, with 15 minutes froth time on samples of varying grade and at particle size of 80%
passing 60-70 microns. The tests utilised standard collectors of potassium amyl xanthate (PAX) and Aerofloat 407. Activating agents
included the use of copper sulphate (CuSO4), as well as sodium sulphate (NaSH), as outlined in Table 13-4.
Table 13-4 SGS Rougher Flotation
Data (Source SGS, 2008)

| | | 42 |
The data shows a recovery range of 66%
to 78% for gold, and 25% to 50% for silver. No confirmation mineralogy was performed on tailing losses. Mass pull to the bulk concentrate
with the exception of the initial test ranged from 4% to 7% by weight. The results were similar with use of copper sulphate showing
a minor improvement in some tests. However, precious metal losses are thought to be primarily attributed to non-liberated particles
being locked in oxide gangue minerals.
The December 2015 Tetra Tech report
summarised an initial series of eight rougher flotation tests performed on Composite 2 by RDI. All the tests followed gravity pre-treatment,
using methyl isobutyl carbinol (MIBC) as frother, and PAX as the primary collector, as well as various alternatives to the reagent
scheme. Flotation retention time was done in four - 5 minute stages totalling 20 minutes of retention time. The series of tests
evaluated a standard grind at a product particle size of 53 microns (270 mesh). Variation to test conditions included using a coarser
P80 targeting 74 microns (200 mesh), and a finer P80 of 44 microns (325 mesh). A summary of the results is
provided in Table 13-5.
Table 13-5 RDI Rougher Flotation
Data (Tetra Tech, 2015)
| Test # |
Conditions |
Combined Recovery % |
Gravity Recovery % |
Flotation Recovery % |
| Grind (P80) |
Reagents |
Wt |
Au |
Ag |
Wt |
Au |
Ag |
Wt |
Au |
Ag |
| FT1 |
270 mesh |
404, PAX |
8.1 |
79.1 |
59.5 |
0.2 |
30.3 |
4.6 |
7.9 |
48.8 |
54.9 |
| FT2 |
270 mesh |
404, PAX, Copper Sulphate |
6.9 |
86.5 |
67.9 |
0.1 |
30.0 |
5.1 |
6.8 |
56.5 |
62.8 |
| FT3 |
270 mesh |
404, PAX, Sodium Sulphide |
7.7 |
81.7 |
58.5 |
0.2 |
34.8 |
5.9 |
7.6 |
46.9 |
52.6 |
| FT4 |
270 mesh |
404, PAX, Copper Sulphate, Sodium Sulphide |
11.0 |
83.6 |
65.4 |
0.1 |
27.3 |
4.2 |
10.9 |
56.3 |
61.2 |
| FT5 |
200 mesh |
404, PAX, Copper Sulphate |
13.1 |
83.8 |
67.0 |
0.3 |
34.8 |
5.2 |
12.8 |
49.0 |
61.8 |
| FT6 |
325 mesh |
404, PAX, Copper Sulphate |
15.2 |
89.0 |
66.5 |
0.1 |
26.9 |
3.6 |
15.1 |
62.1 |
62.9 |
| FT7 |
270 mesh |
3477, PAX, Copper Sulphate |
16.4 |
89.0 |
73.4 |
0.1 |
27.3 |
3.9 |
16.3 |
61.8 |
69.4 |
| FT8 |
270 mesh |
Max Gold, PAX, Copper Sulphate |
15.3 |
86.3 |
64.9 |
0.1 |
24.9 |
3.6 |
15.2 |
61.4 |
61.3 |
Tetra Tech highlighted combined gravity
flotation recoveries for gold at 79% to 89%, with corresponding float only recoveries on gravity tailing ranging from 70% to 85%.
Tetra Tech also stated that reducing the grind from P80 74 to 53 microns indicated a recovery improvement of ~2.5%;
with the use of AP3477, and copper sulphate providing the best response. A more detailed look at the results indicated a mass pull
of 7% to 16% into concentrate gold grades ranging from 12.0 g/t to 38.0 g/t Au. The use of gravity pre-treatment and higher mass pull likely resulted in
the improved precious metal recoveries (as compared to the SGS data), albeit into lower grade float concentrates.
| | | 43 |
Based on their initial results, RDI
conducted a final larger flotation test (FT9), in order to produce concentrate for cyanide leach testing. Test FT9 targeted a P80
grind of 53 microns for 20 minutes using MIBC, PAX, AP3477, AF65 and copper sulphate. This resulted in producing a bulk rougher
concentrate representing a mass pull of 17.3%, into a concentrate grading 14.7 g/t Au and 223.0 g/t Ag. Gold and silver recovery
from gravity and flotation were respectively 82.3% and 66.3%.
| 13.2.6 | Heap Leach Evaluation |
SGS evaluated heap leach potential,
initially with the use of coarse sample bottle roll testing and then with columns. For bottle roll testing two samples; one labelled
as high grade (12.3 g/t Au, 74.0 g/t Ag) and the other as low grade (3.7 g/t Au, 40.0 g/t Ag) were tested. Two sets of crush sizes
were used for each sample, with the coarsest being 80% <1/2” (12.7 mm), and the second at 80% <1/4” (6.4 mm).
The tests maintained 1500 ppm sodium cyanide (NaCN) for a period of 14 days at 40% solids. The results showed gold recoveries respectively
for the ½” and ¼” material at 40.7%, and 56.5% on the high grade sample. For the low grade sample gold
recoveries were 41.6% and 47.6%, respectively for the ½” and ¼” material.
Bottle roll testing was followed up
with column leach studies. The work consisted of eight columns using two procedures. Each procedure was undertaken on the similar
two head grades and crush sizes as was used in the bottle rolls. One procedure used a set of four columns that was run after first
screening out the minus 10 mesh (1.68 mm) material and subjecting the finer fraction to gravity concentration using a Knelson centrifugal
concentrator. Upgrading the Knelson concentrate was undertaken by tabling. The other set of four columns treated the as-crushed
material.
The columns were operated for 60 days,
with most precious metal dissolution occurring in the first 30 days, then rapidly trending lower. Gravity response for the feed
on the four columns feeds prepared by this procedure provided little benefit, particularly as the ability to upgrade the -10 mesh
(1.68mm) gravity rougher product particles proved difficult.
Overall, gold recoveries using the various
column procedures ranged from 40% to 46% on the lower grade material which had an assayed head grade of 3.7 g/t Au and 40.0 g/t
Ag. For the higher grade material (assay head 12.3 g/t Au and 74.0 g/t Ag), there was some benefit evident from going to the finer
¼” crush size. Gold recovery improved from the lower 40 percentage at -1/2”; increasing up to 50% -56% range,
(depending on the procedure) at -1/4”. Total silver recoveries trended lower at approximately 12% to 16% regardless of the
head grade and procedure used for the columns. Given the relatively high head grade of the feed material, and poor response to
the laboratory column study no further work was pursued on heap leach evaluation.
| 13.2.7 | Tank Leach Cyanidation |
SGS performed kinetic cyanide bottle
roll tests on several ground mineral samples for up to 144 hours, while maintaining 1.0 g/L NaCN and monitoring reagent consumption.
The tests used samples of varying head grade and particle size distribution from P80 50 to 75 microns that were slurried
to 40 wt.% solids. Two tests evaluated the use of lead nitrate addition. Procedures and results are summarised below in Table 13-6.
on two samples, labelled as Mid-High Grade 1 and Mid-Low Grade 1. Further tests performed on higher grade samples labelled as High
Grade 2 and Mid-High Grade 2 are summarised in Table 13-7.
| | | 44 |
Table 13-6 SGS Whole Ore Cyanide
Leach Results – Low Mid Grade Samples (Source SGS, 2008)

Table 13-7 SGS Whole Ore Cyanide
Leach Results – Mid High Grade Samples (Source SGS, 2008)

The bottle roll results generally show
a good response to whole leaching recovering 90% to 98% of the gold, and 50% to 69% of the silver within the first 48 hours using
a moderate grind. The higher head grade material showed higher recovery, although tailing losses also trended higher. Finer grinding
and extended leach times beyond 48 hours had a modest improvement to the overall leach response. The addition of lead nitrate provided
no obvious benefit.
SGS continued leach evaluation following
the use of gravity pre-treatment (discussed above) conducted at a grind product particle size of P80 ~75 microns. Following
tabling of a Knelson centrifugal concentrate, the combined Knelson and table tailings were reground to a P80 50- 60
microns and subjected to bottle roll testing. Leach conditions operated at 40% solids maintaining 1 g/L NaCN for 72 hours. Procedures
and corresponding results are presented in Table 13-8.
| | | 45 |
Table 13-8 SGS Cyanide Leach
with Gravity Pre-treatment (Source SGS, 2008)

The results following 72 hours of leaching
provided for combined gravity and cyanide leach gold recoveries of 92% to 97%, with tailing losses ranging from 0.18 g/t in lower
grade bottle roll feed, and up to 1.3 g/t gold losses for the highest grade feed. Silver recoveries for combined gravity and leaching
ranged from 50% to 75%.
The December 8, 2015 Tetra Tech report
outlined the results of the bottle roll leaching of a rougher flotation concentrate. Feed to flotation had been ground targeting
a P80 particle size of 53 microns and then subjected to gravity pre-treatment using a Knelson concentrate that was cleaned
with a Gemini laboratory table. The combined Knelson and table tailings were forwarded to flotation. The resulting flotation concentrate
had a calculated head assay of 10.5 g/t Au and 224.0 g/t Ag, and was subjected to a 72 hour cyanide bottle roll test. The reported
results gave 99% gold recovery and 89% silver recovery resulting in cyanide consumption of 6.1 kg/t of concentrate.
| 13.2.8 | Ammonium Sulphate Leaching |
A low grade sample composite grading
3.7g/t Au and 66.0 g/t Ag was subjected to three procedures by SGS for ammonium thiosulphate leaching. The procedures included
two 72 hour tank leach tests on material ground to a P80 of 60 µm. One test was operated at pH 8.5 and the second
test at pH 9.5. The results showed improved recovery at the higher pH improving from 53% to 90% gold recovery by using pH 9.5.
Corresponding residue grades decreased from 1.7 g/t to 0.4 g/t Au. Silver recovery also improved from 37% to 50% by using pH 9.5.
This was followed up using the optimised
conditions from the tank test with a 21 day bottle roll test on minus 1.68 mm (-10 mesh) sample. The resulting gold and silver
extraction were calculated at 56% and 79% respectively, resulting in residue grade of 2.2 g/t Au and 50.0 g/t Ag. SGS concluded
in their reporting the samples appeared amenable to ammonium thiosulfate leaching, but that further investigation was required
to optimise test conditions.
| 13.2.9 | Settling and Filtration Tests |
Preliminary settling studies were undertaken
by SGS on leach residue originating from whole ore ground to a P80 of 74 microns (200 mesh). Settling was performed
in 2L graduated cylinder equipped with a rake, at solids pulp density ranging from of 7-14 wt.% and operating at pH 10.8 following
addition of hydrated lime. Scoping work indicated among the best performing flocculants was Magnafloc 919 that depending on conditions
used provided for a settling underflow area requirement of 0.13 m2/t/day and terminal density of 55 wt.% or higher.
Settling characteristics and clarity of the solution supernatant improved with flocculent addition, but was considered poor above
a starting solids pulp density of 10%.
| | | 46 |
Two vacuum filtering studies were performed
by RDI on the bottle roll leach residue that had been generated from flotation concentrate, where the feed had been originally
ground to P80 53 microns (270 mesh). The best of the results provided for a filter cake moisture content of 28% and
a filter rate of 13 L/m2/hr (0.32 US gallons/ft2/hr). The data suggests poor vacuum filtering characteristics
and further test work was recommended.
Gold is the principal metal of value.
The preliminary laboratory studies have indicated that heap leaching is not warranted for further pursuit at this time due to the
low precious metal recovery achieved. The laboratory test data also shows that cyanide tank leaching of whole ore, as well as that
of a flotation concentrate had a good response, particularly if subjected to prior gravity treatment. Depending on the specific
process conditions used, as well as the mineralogy and grade of the material tested, cyanide tank leaching resulted in cyanide
gold dissolution of between 90% to 96% to be readily achieved on whole ore. Silver recoveries for whole ore trend significantly
lower at 40% to 60%.
Preliminary cyanidation testing was
performed on a flotation concentrate grading 10.5 g/t Au and 224.0 g/t Ag. The resulting leach recoveries approached 99% and 89%
for gold and silver respectively after 72 hours of leaching. However, the initial flotation results from SGS indicate a poor flotation
response of 66% to 78% depending on the procedures used. RDI improved on these results by incorporating gravity pre-treatment,
a modified grind / reagent scheme and a higher mass pull into the rougher float concentrate to improve pre-leach recovery up to
the mid eighty percent range.
The El Compas potentially economic material
responds well to whole ore cyanide leaching. However, given the current limited Mineral Resource tonnage identified at El Compas
and the fact that froth flotation equipment is already installed at the La Plata processing facility, it suggests a continued examination
of flotation can be performed. This is in order to evaluate a potential benefit to project economics resulting from the reduction
in capital expense requirements. Such a study could include further investigation into leaching of the flotation concentrate either
on site or selling of the concentrate to potential toll or smelting facilities.
Future laboratory investigation should
include finalising a flowsheet. This would include optimising grind (in context with additional comminution work index testing)
and other process parameters for flotation and leach conditions of floatation concentrate, as well as potentially a trade-off study
for either whole ore leaching or direct sale of float concentrate. Flotation cleaning studies can be undertaken to determine if
concentrate grade can be improved without significantly decreasing yield.
Once the flowsheet is finalised, related
process testing such as solids settling and filtration rates are needed for establishing more detailed equipment specifications.
In addition, the application of intense cyanidation might be considered for evaluation particularly for the rougher gravity concentrate.
There is no related test data available to establish procedures for cyanide destruction, which needs to be included in future test
programs to properly size the detoxification treatment circuit and determine related reagent requirements. Analyses of process
makeup water and effluent discharge should also be performed in conjunction with regulatory and permitting requirements.
| | | 47 |
The historical whole ore leach test
data has focused on higher grade samples and more emphasis should be on the average to lower grade material, including those approaching
the mining cut-off grade and using reduced leach retention times if pursuing this process approach in the future. Future test work
needs to include sample locations in context with any Resource expansion, mine plan and anticipated variation in grade and lithology.
Consequently, additional laboratory studies are recommended to better define the operating response of El Compas potentially economic
material and spatially represent the deposit.
Pending further results, the recommended
flowsheet based on the currently available information suggests that due to the pre-existing plant equipment installed at La Plata,
the use of cyanidation of a flotation concentrate should be undertaken for preliminary assessment. Gravity pre-treatment prior
to flotation should also be incorporated. Merrill Crowe has been selected as the treatment option for a filtered pregnant solution
due to the elevated silver grade of the leachate.
| | | 48 |
| 14 | Mineral Resource Estimates |
Data has been extracted from the supplied
el_compas_drillholes.accdb database and imported into Vulcan v9.1 Software via an ODBC link (Open Database Connectivity).
All geological information collected during the logging process, sampling information, drill hole location information and assays
have been extracted and saved into a Vulcan database called “elc_nov2015.dhs.isis”.
A post processing script has been run
on 88 silver assays that were recorded as “-0.2” and one recorded as “0” to change these values to 0.05
g/t silver. MP is unsure whether these values represent below detection limit assays, since no laboratory information was provided
in the drillhole database; however, this has been assumed to be the case for the Resource estimation. Running such post processing
steps is considered standard industry practice prior to Resource estimation.
| 14.2 | Geological Domaining, Interpretation and Wireframe Construction |
Modelling of the host lithologies, structures
and weathering surfaces has not been undertaken as part of this Mineral Resource Estimate.
| 14.2.2 | Mineralisation Model |
The gold and silver mineralisation model
has been created initially in Geovia Surpac v6.6 software using vertical sections digitised generally every 25m and 12.5m spacing
in Northing. Since the mineralisation is hosted almost exclusively within quartz veins, the mineralised intercepts for each drill
hole have generally been selected based on the logged quartz veining. Two main vein systems have been interpreted, the El Compas
and the El Orito veins, with the mineralised veins interpreted in cross-section and then wireframed (Figure 14-1). Wireframes
for both veins were extended half the section spacing past the last identified intercept, with the down-dip extents modelled to
generate a consistent contact between sections and to avoid a saw-tooth shape along the basal extents of mineralisation.
| | | 49 |

Figure 14-1 Mineralisation Wireframes
in Plan view
The individual intercepts within both
mineralised vein systems have been reviewed in order to identify the presence of consistent zones of higher grade gold and silver
mineralisation. Areas of high grade mineralisation were sub-domained and estimated separately. A halo shape encompassing the main
El Compas vein has then been created in order to estimate gold and silver grades into the weakly mineralised portion surrounding
the vein.
A close geometric relationship has been
identified between the epithermal quartz veins and the later andesite intrusives with the andesites often seen within the mineralised
vein system. The thin and irregular nature of these intrusives and their presence within the mineralised vein system has precluded
any separation during modelling of the andesites. Hence, they
have been incorporated into the vein models as zones of internal dilution.
| | | 50 |
The Surpac wireframes have been imported
into Vulcan v9.1 modelling software where they have been checked to ensure that all drillhole intercepts have been appropriately
snapped.
Each wireframe has been used as hard
boundaries during the estimation with appropriate priorities set up during the block modelling process to account for areas where
any wireframes overlap. The seven mineralised wireframes used in the Mineral Resource estimate are detailed in Table 14-1.
Table 14-1 Mineralised Wireframes
Used in the Mineral Resource Estimation

The mineralised wireframes have been
used to code the drillhole database by domain. The “geocod” field was flagged using the mineralisation wireframes.
Where solids of the same type overlapped, a priority was set to ensure the correct coding precedence was applied. The statistical
analysis of assayed samples was undertaken using this unique domain code field, as was the compositing. The block model was coded
using the same methodology and wireframe priority as the drillhole database. A total of six (6) mineralised domains have been identified
within the deposit. Since both the gold and silver mineralisation is contained within the epithermal veins, the same domains have
been used to code gold and silver.
Mining Plus decided to apply an intercept
length compositing technique to the El Compas drillhole data due to the presence of numerous andesitic intrusives within the veins
and the extremely high grade variability in samples due to high nugget effects in both gold and silver. This technique effectively
creates a “metal equivalence” value by calculating the length weighted average grade for the entire intercept, along
with the total intercept length. This method results in the generation of a single sample for each drill hole intercept within
a given mineralised domain.
The true thickness sample length (perpendicular
to the vein dip and strike) has been used for the length weighting in order to negate the effect of differences in intersection
angles between drill holes and channel samples. A significant difference in intercept angles between drillholes and the underground
channel samples could potentially introduce a bias into the weighting of the intercepts. Maptek Vulcan v9.1 software calculates
the true width intersection for each intercept by using the average vein strike and dip during the compositing process to negate
this potential bias.
| | | 51 |
| 14.4.1 | Underground Channel vs Drill Hole Sample Comparison |
Rock chip channel samples have been
collected from the backs (roof) of the underground development drives. In order to determine if there is a grade bias between the
underground channel samples and the diamond drill hole samples, a comparison has been undertaken between the two composited data
sets for gold (Figure 14-2) and silver (Figure 14-3).

Figure 14-2 Comparison between
the diamond drill hole and underground channel true thickness composites for gold

Figure 14-3 Comparison between
the diamond drill hole and underground channel true thickness composited for silver
| | | 52 |
This review has identified that for
both gold and silver, the grades within the channel samples have a much smaller distribution, and lower grade with significantly
lower coefficient of variation (CV) compared to the diamond drillhole composites. The lower mean grades within both the gold and
silver channel composites are due to the absence of extreme values within this data set.
Mining Plus is satisfied that the two
sample types can both be utilised in the grade estimation.
| 14.4.2 | Raw and Composited Sample Statistics |
Analysis of the raw sample lengths has
identified that a number of samples with very small lengths are present within the mineralised domains. Therefore, prior to analysing
the raw sample statistics, MP compared the gold grade and sample length in order to determine if any grade bias has been introduced
through selective sampling (Figure 14-4).

Figure 14-4 Comparison between
gold grade and sample length for gold
Mining Plus is satisfied that no grade
bias has been introduced via selective sampling in the raw samples, allowing for a direct comparison between the raw and composited
samples to be undertaken.
| | | 53 |
The impact of the intercept length compositing
on the mean gold grade for each domain is detailed in
. In Figure 14-5, the raw sample
statistics and the composite sample statistics for gold are presented as histogram plots, enabling comparison between the two sample
types.
Table 14-2 Effect of Compositing
on Gold Grades Within Each Domain


Figure 14-5 Gold Log Histograms
for length weighted raw samples and composites
| | | 54 |
The impact of the intercept length compositing
on the mean silver grade for each domain is detailed in Table 14-3. In Figure 14-6, the raw sample statistics and the composite
sample statistics for silver are presented as histogram plots, enabling comparison between the two sample types.
Table 14-3 Effect of Compositing
on Silver Grades Within Each Domain


Figure 14-6 Silver Log Histograms
for length weighted raw samples and composites
The compositing process led to an increase
in the mean gold grade for the main mineralised domain (Domain 2) in both gold and silver, as the influence of the assays from
the barren intrusive lithologies was reduced. The significant reduction in CV for all domains demonstrates the effectives of this
compositing process in reducing the extreme grade variability.
A detailed review of the composite statistics
by area was undertaken with the view to determining the most appropriate top cuts to apply to gold and silver. Since the styles
and tenor of mineralisation differ greatly between the different areas, this was considered the most appropriate way to remove
the influence of extreme values within each domain. The intercept length compositing process has reduced much of the grade variability
within the domains, with only the main high grade, Domain 2, requiring the capping of extreme values for both gold and silver.
Log probability, log histogram and mean-variance
plots have been used to determine the appropriate top cut to apply for both gold (Figure 14-7) and silver (Figure 14-8)
in Domain 2. The effect of the top cuts applied within this domain is detailed in Table 14-4.
| | | 55 |

Figure 14-7 Gold top cut analysis
for Domain 2

Figure 14-8 Silver top cut analysis
for Domain 2
| | | 56 |
Table 14-4 Effect of the Top
Cuts for Gold and Silver on Domain 2

The application of a 75.0 g/t Au top
cut has reduced the mean grade by 33.5% through the capping of one very high grade sample. Although this reduction appears quite
severe, the extremely high grade sample capped during this process is considered to be an outlier and is not believed to be representative
of the total grade population. The reduction in CV from 4.34 to 1.69 confirms that the application of this top cut is robust.
A top cut of 700.0 g/t Ag was applied
to the silver composites within Domain 2, which reduced the mean grade by 14.8% by capping the same single very high grade sample
as was capped during the gold top-cutting process. The top cutting at the 99.8th percentile is robust as it reduces
the CV from 2.5 to 1.55.
No declustering was performed on the
composites prior to estimation of the Resource block grades.
Due to the reduction in the number of
samples within each domain, as a function of the intercept length compositing method, the variographic analysis has been undertaken
on grouped gold mineralisation domains by area and similar orientation. Domains 1 and 2 have been grouped together, as have Domains
6 and 7.
The variography for Domains 4 and 5
(which both contain one composite each) has been borrowed from the grouped Domain 1 & 2. The variography applied to each of
the gold domains is provided in Table 14-5.
| | | 57 |
Table 14-5 Gold Domain Variographic
Parameters

Note - italics indicate that the variographic
parameters have been borrowed from another domain.
Similar to the gold varioraphic analysis,
domains have been grouped by area and domain orientation with domains 1 and 2 grouped together, as have domains 6 and 7.
The variography for Domains 4 and 5
(which both contain one composite each) has been borrowed from the grouped Domain 1 & 2. The variography applied for each of
the silver domains is provided in Table 14-6.
Table 14-6 Silver Domain Variographic
Parameters

Note - italics indicate that the variographic
parameters have been borrowed from another domain.
| | | 58 |
| 14.6 | Block Modelling Construction |
A block model has been created for the
El Compas project area in Maptek’s Vulcan v9.1 3-D modelling software. The block model is called “el_compas.bmf”.
The block model was sub-divided into
a mined and an un-mined area due to the increased sample density in the areas that have been mined historically. The blocks in
the mined portion of the Resource have been reduced in size. The block model extents and block sizes for each area are detailed
in Table 14-7. Sub-celling has been employed at domain boundaries to allow adequate representation of the domain geometry and
volume.
Table 14-7 Block Model Extents

The parent block size selected approximates
half the sectional drill spacing within the deposit. All sub-cells have been estimated within the parent cell and therefore have
the same estimated grade. The block model has not been rotated.
The variables used in the construction
of the block model are provided in Table 14-8.
| | | 59 |
Table 14-8 El Compas Block Model
Variables
A total of 215 bulk density measurements
were included in the data provided to MP and were used to derive the dry bulk density used in the Mineral Resource estimation.
As stated in previous sections, these bulk density measurements have been collected using the water immersion technique on variable
lengths of diamond drill core with the lithology recorded for each interval.
Mining Plus independently verified the
supplied bulk density values by calculating the density from the wet and dry weights for each sample recorded in the database.
MP notes that the supplied bulk density values in the database are different to the MP calculated values.
| | | 60 |
The difference between the two calculated
bulk density values varies quite considerably from sample to sample (Figure 14-9), however the average density for both the
vein material and the host rocks are within error of each other.
A bulk density of 2.6 g/cm3
was assigned to all blocks within the block model.

Figure 14-9 Comparison between
the Supplied Bulk Density Values and the Calculated Bulk Density Values
Mining Plus recommends that the source
data for these bulk density measurements in the database be located and the values re-calculated using the standard water immersion
technique calculation.
| | | 61 |
Gold and silver have been estimated
in Vulcan v9.1 using Ordinary Kriging interpolations into the parent blocks. The interpolations have been constrained within the
mineralisation wireframes using hard boundary estimation and undertaken in three passes. The estimation parameters used during
the interpolation are detailed in Table 14-9. The low number of minimum and maximum samples for each pass is due to the intercept
length compositing used.
Table 14-9 El Compas Block Model
Interpolation Parameters

| | | 62 |
| 14.9 | Block Model Validation |
Final grade estimates have been validated
by statistical analysis and visual comparison to the input drill hole composite data. Visual
sectional analysis of the block model versus the input drillhole data indicates that the block model is generally an accurate representation
of the input drill data in Figure 14-10.

Figure 14-10 Cross-Section through
the El Compas Block Model with the input drill hole grades
The volumetric validation compares the
block model volume for each mineralised domain with the volume within the individual wireframes which were used to code those domains
in the model and is a reliable check as to the volume definition provided by the sub-celling within the block model. For deposits
contained within narrow high grade veins, such as El Compas, the volume validation can be quite critical. As outlined in
, the block model is effective at defining
the mineralised volume as represented by the mineralisation wireframes.
| | | 63 |
Table 14-10 Volumetric Comparison
of the Domains between the BM and Wireframes
A domain by domain comparison between
the composites and the mean block model grades for the three main high grade gold domains indicates that overall the block model
is within acceptable limits of the composites (+/- 10%) in Table 14-11.
Table 14-11 Individual Domain
Validation for both Silver and Gold

Swath plots of the block model grade
versus composite grade by Northing, Easting and Relative Level (RL) slice have been generated for the main high grade mineralisation
in Domain 2 (Figure 14-11, Figure 14-12 and Figure 14-13 respectively). Northing, Easting and RL swath plots have also
been generated for Domains 6 and 7 and are included in the Appendices.
| | | 64 |

Figure 14-11 Northing Swath
Plot for Domain 2

Figure 14-12 Easting Swath Plot
for Domain 2
| | | 65 |

Figure 14-13 Relative Level
(RL) Swath Plot for Domain 2
In areas of high drill hole data density,
the block model grade is seen to closely mimic the composite grade; however, in areas of low drill hole data density, the block
model grade deviates from the composite grade. In other words, in areas of good drill hole data coverage, the mean block model
grade reflects the input data. In areas where there is little or no data coverage, the block model mean grade is seen to approximate
the domain mean grade due to the lack of composite data. This is evident at the upper and lower limits in all three orientations
where the lack of informing samples drives the block model grades towards the domain mean.
Analysis of the various validation methods
indicates that the Mineral Resource Estimate is an accurate global representation of the input data.
| 14.10 | Block Model Classification and Depletion |
Resource categories have been applied
to the estimation on the basis of drill density, number of available composites, estimation pass and confidence in the estimation.
No portion of the in-situ El Compas
Mineral Resource meets the criteria for classification as a Measured Mineral Resource.
The Indicated Mineral Resource category
has been applied to the areas within the main mineralised domains (Domains 1, 2, 6 and 7) which have been estimated in the first
and second interpolation passes. The Inferred Resource category has been applied to areas within the main mineralised domains which
have been estimated in the third pass and to all of Domains 4 and 5. Details of the classification methodology are outlined in
Table 14-12.
| | | 66 |
Table 14-12 Resource Classification
Methodology

The Mineral Resource estimate has been
depleted for the underground mining which is stated to have occurred before 2008, within the digitised level wireframes provided
to MP.
Mining Plus is of the opinion that the
Resource classifications applied to the El Compas deposit are reflective of the relative levels of confidence in the tonnage and
grade estimate within the block model.
| 14.11 | Comparison to Previous Estimates |
The previous Mineral Resource Estimate
for the El Compas deposit was completed in 2011 by SRK Consulting. It is not stated in the documentation provided as to whether
the reported tonnes and grade in the 2011 Mineral Resource estimate are depleted or not. For the sake of this comparison, it is
assumed that this SRK block model has been depleted for the mining that occurred prior to 2008. A comparison between the depleted
MP block model and the 2011 SRK model, both reported at a gold cut-off of 2.0 g/t Au, is provided in Table 14-13.
Table 14-13 Comparison between
the 2011 SRK Mineral Resource Estimate and the 2016 MP Mineral Resource Estimate at a 2.0 g/t Au Cut-off
| SRK Mineral Resource Estimate for the El Compas Deposit - 2011 |
| Area |
Cut-Off Au g/t |
Indicated |
Inferred |
| Tonnes |
Au g/t |
Ag g/t |
Au Oz |
Ag Oz |
Tonnes |
Au g/t |
Ag g/t |
Au Oz |
Ag Oz |
| El Compas |
2.0 |
394,000 |
4.2 |
64.4 |
53,203 |
815,527 |
161,000 |
3.3 |
33.3 |
16,926 |
172,525 |
| El Orito |
2.0 |
130,000 |
5.0 |
69.0 |
20,689 |
288,434 |
258,000 |
4.4 |
56.4 |
36,580 |
468,164 |
| Total |
2.0 |
524,000 |
4.4 |
65.5 |
73,892 |
1,103,961 |
419,000 |
4.0 |
47.6 |
53,507 |
640,689 |
| Mineral Resource Estimate for the El Compas Deposit - January 14, 2016 |
| Area |
Cut-Off Au g/t |
Indicated |
Inferred |
| Tonnes |
Au g/t |
Ag g/t |
Au Oz |
Ag Oz |
Tonnes |
Au g/t |
Ag g/t |
Au Oz |
Ag Oz |
| El Compas |
2.0 |
506,987 |
6.7 |
66.7 |
109,948 |
1,086,599 |
128,984 |
3.4 |
58.0 |
14,245 |
240,430 |
| El Orito |
2.0 |
45,291 |
4.3 |
60.5 |
6,324 |
88,042 |
292,310 |
4.5 |
60.8 |
42,375 |
571,353 |
| Total |
2.0 |
552,278 |
6.5 |
66.2 |
116,272 |
1,174,640 |
421,294 |
4.2 |
59.9 |
56,619 |
811,784 |
| % Diff |
El Compas |
29% |
61% |
4% |
107% |
33% |
-20% |
5% |
74% |
-16% |
39% |
| El Orito |
-65% |
-12% |
-12% |
-69% |
-69% |
13% |
2% |
8% |
16% |
22% |
| Total |
5% |
49% |
1% |
57% |
6% |
1% |
5% |
26% |
6% |
27% |
| | | 67 |
| 14.12 | Mineral Resource Reporting |
The El Compas Mineral Resource has been
reported by mineralised vein system, above defined gold cut-off grades and by resource category, which is presented in Table 14-14.
The Resource has been depleted for historic mining and therefore is considered in-situ.
Table 14-14 El Compas Mineral
Resource Inventory
Mineral Resource Estimate for the El Compas Deposit
January 14, 2016 |
| Vein |
Cut off Au g/t |
Tonnes |
Au g/t |
Ag g/t |
Au Oz |
Ag Oz |
| Indicated |
| El Compas |
2.0 |
507,000 |
6.7 |
66.7 |
110,000 |
1,087,000 |
| El Orito |
2.0 |
45,000 |
4.3 |
60.5 |
6,000 |
88,000 |
| Total |
|
552,000 |
6.5 |
66.2 |
116,000 |
1,175,000 |
| |
Inferred |
| El Compas |
2.0 |
129,000 |
3.4 |
58.0 |
14,000 |
240,000 |
| El Orito |
2.0 |
292,000 |
4.5 |
60.8 |
42,000 |
571,000 |
| Total |
|
421,000 |
4.2 |
59.9 |
57,000 |
812,000 |
Notes:
| 1. | Mineral Resources estimated as of January 14, 2016. |
| 2. | CIM Definition Standards were followed for the Mineral Resource estimates. |
| 3. | Mineral Resources are estimated using Vulcan software, and have been reported at a 2.0 g/t Au cut-off
grade. |
| 4. | For the purpose of Resource estimation, assays were capped at 75.0 g/t for Au and 700.0 g/t for
Ag. |
| 5. | A bulk density of 2.6 tonnes/m3 has been applied for volume to tonnes conversion. |
| 6. | Resource categories have been applied to the estimation on the basis of drill-hole density, number
of available composites, estimation pass and confidence in the estimation. |
| 7. | A small amount of the Resource has been mined at the top of the El Compas vein and this material
has been removed from the Resource. |
Grade tonnage curves for the Indicated
and Inferred portion of the Resource are detailed in Figure 14-14 and Figure 14-15, and illustrate the potential tonnage
at various gold grade cut-offs.
| | | 68 |

Figure 14-14 El Compas In-situ
Indicated Mineral Resource tonnage-grade curve
| | | 69 |

Figure 14-15 El Compas In-situ
Inferred Mineral Resource tonnage grade curve
To the best of MP’s knowledge,
at the time of estimation there were no known environmental, permitting, legal, title, taxation, socio-economic, marketing, political
or other relevant issues that could materially impact on the eventual extraction of the Mineral Resources.
| | | 70 |
| 15 | Mineral Reserve Estimates |
This project includes Inferred Resources
in the economic analysis that is considered too speculative geologically to have the economic considerations applied to them that
would enable them to be categorised as Mineral Reserves.
This is a preliminary stage program
and no reserves can be determined at this stage of the project.
| | | 71 |
| 16.1 | Mining Method Selection |
Selecting the optimal mining method
is essential for extracting the optimal Resource quantity, maximising the project NPV and providing a safe work environment. Mining
method selection is also critical as it further impacts dilution, productivity, production consistency, productive capacity, time
to full production, backfill requirements and ventilation requirements. A desktop analysis was conducted using the previous Mineral
Resource estimate to provide initial guidance for mining method selection for the current study.
| 16.1.1 | Qualitative Assessment Inputs |
This analysis selects the most suitable
mining method for the El Compas and El Orito orebodies considering 11 geometric, economic and geotechnical inputs to rank 10 potential
mining methods. This indicative qualification system is known as the UBC Mining Method Selector and represents a ranking of potential
generic mining methods that should be considered for application.
Table 16-1 Inputs for UBC Mining
Method Selector – El Compas and El Orito
| Inputs |
| Orebody Shape |
Equidimensional |
Platy / Tabular |
Irregular |
| Orebody Plunge |
Steep |
Moderate |
Flat |
| Orebody Depth |
<100m |
100-600m |
>600m |
| Orebody Thickness |
Very Narrow |
Narrow |
Intermediate |
Thick |
Very Thick |
| Material Grade |
Low |
Moderate |
High |
| RMR HW |
Very Weak |
Weak |
Moderate |
Strong |
Very Strong |
| RMR Potentially Economic Material |
Very Weak |
Weak |
Moderate |
Strong |
Very Strong |
| RMR FW |
Very Weak |
Weak |
Moderate |
Strong |
Very Strong |
| RSS HW |
Weak |
Moderate |
Strong |
| RSS Potentially Economic Material |
Weak |
Moderate |
Strong |
| RSS FW |
Weak |
Moderate |
Strong |
| |
|
|
|
|
|
|
Geometric Factors
The four geometric factors include orebody
shape, thickness, plunge and depth. As shown in Figure 16-1, the El Compas and El Orito orebodies are considered platy or tabular,
as the orebody height and width are multiple times that of the thickness. The El Compas orebody is about 220 metres along strike
(110 metres in lower section) and 180 metres down dip, while the El Orito orebody is 300 metres along strike and 135 metres down
dip. The average thickness of these orebodies are 8.7 and 5.9 metres respectively.
| | | 72 |


Figure 16-1 El Compas and El
Orito Sections
The El Compas dip at about 75° while
the El Orito deposit is near vertical. The existing Resources are planned to be mined from near surface to a depth of approximately
220 metres. This analysis will be completed for both above and below 100 metres to assess the impact on the resulting mining method
ranking.
Grade
Based on an initial review of the grade
distribution within the previous Resource estimate (as presented in Table 16-2, Figure 16-4 and Figure 16-5), we see
that El Compas and El Orito have average gold equivalent grades of 2.8 g/t and 2.7 g/t at a gold equivalent cut-off grade of 1.2
g/t. These in-situ grades are considered moderate relative to the cut-off.
Furthermore, El Compas grade values
have zonal high grades between drawpoint elevations 2330 and 2375, and the Northings 2515830 and 2515980, while the remaining extremities
have relatively low grades. Early production from this high grade zone would result in increased cash flows early in the mine life.
The El Orito deposit shows a smaller high grade zone at the 2375 drawpoint between Northings 2516190 and 2516250, while the remainder
of the orebody would be considered erratic. A primary-secondary strategy may be effective in this area to maximise the mill feed
head grade.
Table 16-2 El Compas and El
Orito Orebody Grade Distributions at 1.2 AuEq Cut-off Grade
| Orebody |
Min |
Average |
Maximum |
Std. Dev. |
| El Compas |
1.25 |
2.75 |
6.56 |
1.13 |
| El Orito |
1.23 |
2.68 |
10.60 |
1.08 |
| | | 73 |
Geotechnical
| 16.1.1.1.1 | Rock Mass Ratings |
Based on a review of the report
“El Compas Geotech Investigation and Scoping Level Design/cash flow”, andesite and rhyolite makes up 79 and 21
percent of the host rock samples respectively. Of this, approximately 10 percent has a poor rock mass rating, which is
typical of fault material in the host rock. The remaining 90 percent has been rated 74 percent good and 16 percent fair. It
is further indicated that the fair material is consistent with the mineralised material. For the purposes of this assessment,
host rock and potentially economic material have been assigned a strong and moderate rock mass ratings respectively.
| 16.1.1.1.2 | Rock Substance Strengths (RSS) |
While no specific data has been provided
regarding the rock strengths, Andesite and Rhyolite are typically relative high strength rock, with a conservative Uniaxial Compressive
Strength (UCS) of 70MPa. If the host rock at the El Compas and El Orito site has a uniaxial strength that is higher than this value,
it will not materially affect the assessment results,; however, if the strength were significantly lower, the assessment should
be revisited. For the two scenarios under consideration, above 100 metres and 100-220 metres, the rock substance strength is calculated
using the following formula:

Where SG is the specific gravity or
density of the rock and g is acceleration due to gravity. For conservatism, the specific gravity of the two rock types is assumed
to be 2.8 t/m3; however, it is expected that the specific gravity of Rhyolite will be closer to 2.2 t/m3,
which would result in more favourable (higher) RSS value.
The RSS value ranges are Weak (<8),
Moderate (8-15) and Strong (>15). The calculated values for the two scenarios are 25.5 for depths of 100 metres and 11.6 for
depths of 220 metres.
| 16.1.2 | Qualitative Assessment Results |
Mining Methods
Mining methods considered by this assessment
include surface mining and underground mining methods from bulk to selective recovery and from hard to soft rock. Table 16-3
shows a list of the methods considered in no particular order.
Table 16-3 Qualitative Assessment
Mining Methods Considered
| Methods |
| Open Pit |
| Block Caving |
| Sublevel Stoping |
| Sublevel Caving |
| Longwall |
| Room and Pillar |
| Shrinkage Stoping |
| Cut and Fill |
| Top Slicing |
| Square Set |
| | | 74 |
Criteria Rating
Based on the suitability of the inputs,
a score of 1 to 5 (low; low-moderate; moderate; moderate-high; high) is assigned to each mining method. Where an input parameter
is especially detrimental to a mining method, a score of -49 is assigned to ensure the
mining method will have a negative score. This ratings system was used to ensure that any criteria that had significant disadvantage
compared to the other methods would clearly stand out in the overall matrix.
Qualitative Assessment
To illustrate the results of the assessment
process, the scoring for the above 100 metre scenario has been shown in Table 16-4. Orebody thickness results in Block Caving
and Sublevel Caving being omitted and similarly, plunge results in Longwall and Room and Pillar being omitted. The ranked mining
methods for consideration are shown in Table 16-5 and Table 16-6.
Table 16-4 El Compas and El
Orito Orebodies Qualitative Assessment – Surface to 100m Scenario

Table 16-5 Mining Method Ranking
– El Compas

| | | 75 |
Table 16-6 Mining Method Ranking
– El Orito

Of these mining methods, Top Slicing
and Square Set are removed from consideration due to geometric and geotechnical suitability respectively. Open pit mining is further
removed from consideration as a result of surface and permitting constraints.
Potential Mining Methods –
High Level Descriptions
Sublevel Stoping with Pillars:
Resource recovery is low due to mining primaries, not placing fill and recovering very small portion of secondary stopes with side
pillars to maintain support. Moderate to high productivity, non-entry, top-down, bulk method. Sill pillars are required after each
stoping level. A moderate cost method due to the amount of ground support required. Seismicity and ground support requirements
increase with depth.
Sublevel Stoping with Waste Rockfill
(WRF): Recovery is low to moderate (higher than Sublevel Stoping with Pillars). Moderate to high productivity, non-entry, bottom-up,
bulk method. Method can be applied overall top-down through multi stoping level panels that are individually mined bottom-up, however
this necessitates leaving a sill pillar between panels. A primary/secondary technique can be applied, leaving side pillars and
filling all stopes with waste. Requirement to truck waste underground.
Sublevel Stoping with Cemented Rockfill
(CRF): Recovery is moderate (higher than Sublevel Stoping with WRF). Moderate to high productivity, non-entry, bottom-up, bulk
method. Mixing of cement with crushed and screened waste rock provides a strong cemented backfill. Sill pillars are still required
between panels. Can be mined longitudinally with stopes mined to maximum allowable dimensions, filled, then once cured, the adjacent
stope can be mined. Alternatively, a primary/secondary technique can be applied, filling primary stopes with CRF and secondary
stopes with waste. Requirement to truck waste underground. Provision of cement may be costly.
Sublevel Stoping with Paste:
Recovery is high as pillars are not left in place. Moderate to high productivity, non-entry, bottom-up, bulk method. Similar to
Sublevel Stoping with CRF, but utilizing full stream mill tailings for paste fill, providing a highly engineered, strong cemented
backfill that can potentially be mined against directly adjacent to or beneath without use of sill pillars. Capital infrastructure
costs (mixing and reticulation) are high. Can be mined longitudinally with stopes mined to maximum allowable dimensions and filled,
then once cured, the next stope adjacent can be mined. Alternatively, a primary/secondary technique can be applied with no pillars
between the stopes, and filling primary stopes with paste and secondary stopes with waste. Requirement to truck waste underground,
however lower volumes of waste backfill are required. Provision of cement may be costly.
| | | 76 |
Shrinkage Stoping: Low to moderate
productivity, entry, bottom-up, selective method. Suited to narrow vein orebodies in poor ground. Bottom up method with low to
moderate productivity and reduced mining recovery due to pillars. As an entry mining method, workers will be exposed to all in-stope
hazards.
Cut and Fill: Low productivity,
entry, bottom-up, selective method. Used in steeply dipping and irregular orebodies. Successive small lifts are mined and then
backfilled on each level. Poor ground conditions can more easily be controlled due to the small lift height. Low dilution but generally
high cost and low productivity. As an entry mining method, workers will be exposed to all in-stope hazards.
Shrinkage Stoping and Cut and Fill mining
methods are not recommended due to high costs, reduced productivity and hazards associated with entry nature of mining methods.
| 16.1.3 | Selected Mining Method |
Given the grade distributions in both
the El Compas and El Orito orebodies, a combination of Sublevel Stoping mining methods is recommended. In moderate to high grade
zones, high recoveries can be achieved, while avoiding high capital costs, by applying Sublevel Stoping with CRF as a preferred
option over Sublevel Stoping with Paste. Where stopes are transversely oriented, stopes would be mined using a primary/secondary
technique, filling primary stopes with CRF (run of mine waste rock with 4% cement addition) and secondary stopes with waste. In
lower grade zones, Sublevel Stoping with WRF would be applied in a bottom-up approach with side and sill pillars left in place
to retain unconsolidated fill.
The Sublevel Stoping mining methods
have good suitability to the Mexican mining industry, as the workforce skill level is generally appropriate to perform the associated
development, mine production and CRF and WRF backfill activities.
Dilution is expected to be relatively
low. Productivity and productive capacity will be maximised for the El Compas and El Orito orebodies, while production consistency
can be achieved through a combination of mine development in potentially economic material and stope production. Time to full
production can be minimised, while maximising mill feed head grade by applying the Sublevel Stoping with CRF in the high grade
zone in a top-down fashion. Lastly, mine ventilation design can be simplified through a combination of on level fresh/return air
raises and upcasting/downcasting declines.
| 16.2 | Preliminary MSO Analysis |
Minable Shape Optimiser® (MSO),
a Datamine Studio3® tool, was used to determine the correlation between cut-off grade and the indicative mineable envelope.
The input parameters selected for MSO were based on initial interpretations of the El Compas and El Orito mineralization. MSO utilises
some key inputs to generate an optimised stope shape whereby mined metal for the total tonnage is optimised. The optimisation is
driven by the following main inputs:
| | | 77 |
For the purpose of MSO evaluations,
a minimum width of 2.0m was input Key MSO Inputs are as presented in Table 16-7.
Table 16-7 MSO Input Parameters
| Parameters |
Value |
Unit |
| Cut-off grade |
1.2-2.4 |
g/t AuEq |
| Min mining width |
2.5 |
m |
| Level spacing |
20 |
m |
| Section spacing |
10 |
m |
| Min trans pillar width |
5 |
m |
| Min dip angle |
60 |
deg |
| Max dip angle |
120 |
deg |
| Max strike angle |
45 |
deg |
| Max strike angle change |
20 |
deg |
The input block model was derived from
the Resource model prepared by MP (el_compas.bmf). The MSO input model (el_compas_dep_mso.dm) accounts for depletion of as-built
development and excludes waste blocks to aid processing efficiency. A default waste density of 2.6 t/m3 was assigned
for waste portions which align with the original block model values. Gold equivalent (AuEq) was assigned to input model cells based
on simplified commodity price equivalent. The formula used for this definition is AuEq = Au + Ag/78. This basic equivalency is
driven by pricing of gold (US$1,100/Oz) and silver (US$14/Oz).
Preliminary MSO optimisations on both
15m and 20m sublevel spacing showed that a 20m spacing resulted in negligible net difference in mineable tonnage and minimal variance
in grade (-3%). As a 20m sublevel spacing represents reduced development requirements whilst providing a practical design parameter
for effective mining, this sublevel interval was selected as a driver for subsequent analysis. Preliminary MSO optimisations were
also conducted at both 2.0m and 2.5m mining width with results yielding negligible difference in tonnage and grade due to Resource
geometry and block model cell dimensions. A minimum mining width of 2.5m was selected as a driver for subsequent analysis.
Table 16-8 provides a summary of
MSO outputs by AuEq Cut-off grade. Note that all MSO results represent in-situ values and do not account for mining recovery and
dilution. MSO outputs were imported to Deswik CAD software to facilitate the removal of extraneous satellite stopes that are not
conducive to practical and/or economic extraction. This process has been labelled as ‘cleaned’ thus the mineable tonnage
for each cut-off grade is reflected under ‘Total Cleaned’ tonnage. The El Compas mining zone hosts approximately 72%
of the mineable tonnage across all cut-off ranges analysed, with the remaining tonnage provided by the El Orito mining zone. El Compas presents a mineable
inventory with average width approximately double that of El Orito. The El Compas zone exhibits an average in-situ grade approximately
33% higher than that of El Orito.
| | | 78 |
Table 16-8 Summary of MSO outputs
by AuEq Cut-off Grade
| Case |
Summary |
El Compas |
El Orito |
Total |
Total Cleaned |
| 1.2 AuEq Cut-off |
Potentially Economic Material Tonnes In-situ |
965,111 |
423,348 |
1,388,459 |
1,251,427 |
| 1.2 AuEq Cut-off |
AuEq In-situ |
4.68 |
3.51 |
4.32 |
4.32 |
| 1.2 AuEq Cut-off |
Avg Width |
11.40 |
5.78 |
9.69 |
9.69 |
| |
|
|
|
|
|
| 1.4 AuEq Cut-off |
Potentially Economic Material Tonnes In-situ |
866,903 |
365,711 |
1,232,614 |
1,110,962 |
| 1.4 AuEq Cut-off |
AuEq In-situ |
5.03 |
3.78 |
4.66 |
4.66 |
| 1.4 AuEq Cut-off |
Avg Width |
11.21 |
5.65 |
9.56 |
9.56 |
| |
|
|
|
|
|
| 1.6 AuEq Cut-off |
Potentially Economic Material Tonnes In-situ |
790,866 |
316,080 |
1,106,946 |
997,697 |
| 1.6 AuEq Cut-off |
AuEq In-situ |
5.33 |
4.04 |
4.96 |
4.96 |
| 1.6 AuEq Cut-off |
Avg Width |
11.39 |
5.52 |
9.71 |
9.71 |
| |
|
|
|
|
|
| 1.8 AuEq Cut-off |
Potentially Economic Material Tonnes In-situ |
701,892 |
263,846 |
965,738 |
870,426 |
| 1.8 AuEq Cut-off |
AuEq In-situ |
5.74 |
4.39 |
5.37 |
5.37 |
| 1.8 AuEq Cut-off |
Avg Width |
11.20 |
5.54 |
9.66 |
9.66 |
| |
|
|
|
|
|
| 2.0 AuEq Cut-off |
Potentially Economic Material Tonnes In-situ |
620,787 |
231,727 |
852,514 |
768,376 |
| 2.0 AuEq Cut-off |
AuEq In-situ |
6.22 |
4.63 |
5.78 |
5.78 |
| 2.0 AuEq Cut-off |
Avg Width |
10.91 |
5.48 |
9.43 |
9.43 |
| |
|
|
|
|
|
| 2.2 AuEq Cut-off |
Potentially Economic Material Tonnes In-situ |
557,336 |
197,906 |
755,242 |
680,704 |
| 2.2 AuEq Cut-off |
AuEq In-situ |
6.63 |
4.95 |
6.19 |
6.19 |
| 2.2 AuEq Cut-off |
Avg Width |
11.12 |
5.60 |
9.67 |
9.67 |
| |
|
|
|
|
|
| 2.4 AuEq Cut-off |
Potentially Economic Material Tonnes In-situ |
515,484 |
179,692 |
695,176 |
626,567 |
| 2.4 AuEq Cut-off |
AuEq In-situ |
6.97 |
5.16 |
6.50 |
6.50 |
| 2.4 AuEq Cut-off |
Avg Width |
10.18 |
5.59 |
8.99 |
8.99 |
Figure 16-2 presents the mineable
potentially economic material tonnage and grade (AuEq) relationship of the MSO results. A relatively linear relationship between
tonnage and grade (in-situ) is evident across the cut-off ranges analysed.
| | | 79 |
Figure 16-2 Charted Summary
of MSO outputs by AuEq Cut-off Grade
Figure 16-3 illustrates the stope
width distribution for each mining zone. These statistics are based on a numerical count of stopes and do not reflect a weighted
average based on tonnage.

Figure 16-3 MSO Stope Width
Distribution by Mining Area
| | | 80 |
Figure 16-4 displays a heatmap of
El Compas MSO AuEq grade results at a 1.2 g/t AuEq cut-off grade. This figure ultimately presents a north-south longsection of
the mineable envelope grade distribution. The heatmap indicates that a high grade zone exists
spanning approximately 80m strike length between the 380 and 300 level.

Figure 16-4 MSO Heatmap- El
Compas AuEq Grade Distribution (1.2 g/t Cut-off)
Figure 16-5 displays a heatmap of
El Orito MSO AuEq grade results at a 1.2 g/t AuEq cut-off grade. The heatmap indicates that the higher grade material for El Orito
is situated between the 2516065 to 2516215 northings.
| | | 81 |

Figure 16-5 MSO Heatmap- El
Orito AuEq Grade Distribution (1.2 g/t Cut-off)
| 16.3 | Cut-off Grade Estimate |
An assessment has been made of the economics
and break even points for the proposed El Compas and El Orito underground mine in order to:
| · | Provide guidance on the design limits for the proposed underground mine and to enable estimation
of a mining inventory for initial evaluation of project economics, utilising block model data, financial/marketing parameters and
operating cost information |
| · | Provide criteria on cut-off grades to determine whether a given block of material should be scheduled
to be sent to the processing facility or taken to the waste dump, utilising block model data, financial/marketing parameters and
operating cost information |
| · | Provide guidance on cut-off grades to be used in designing stopes. |
The underground cut-off grade model
has been built utilising the following cost and physical parameters that represented the best available information as of December
2015 when the model was prepared:
| · | Block model provided by MP, converted into Datamine format |
| · | Metal price and exchange rate parameters provided by Canarc |
| · | Mining recovery and dilution factors estimated based on the selected mining method |
| · | Metallurgical recovery factors based on recent testwork data provided by Canarc |
| · | Mine development physicals based on a high level design on indicative inventory |
| · | Logistics, treatment and refinery parameters and costs provided by Canarc |
| · | Operating mining cost estimates provided by Canarc. Where costs were unavailable, costs were based
on unit rates for similar mines (based on size and mining method) |
| · | Operating milling cost provided by Canarc |
| · | Operating G&A cost provided by Canarc |
| · | Mill feed haulage costs based on cost data provided by Canarc. |
| | | 82 |
| 16.3.2 | Grade Equivalency Factors |
Grade equivalency factors have been
determined for the purposes of normalising the grades of each commodity to an equivalent single element grade for convenience.
The grade equivalency factors do not alter the physical quantities of contained material within the Resource. The El Compas block
model output data that has been used for input into the cut-off grade model and is expressed in terms of a gold equivalent (AuEq).
The basic equivalency is driven by pricing
of gold (US$1,100/Oz) and silver (US$14/Oz). Equivalency factors are summarised in Table 16-9. Note that the equivalency formula
for this preliminary level of analysis does not account for relative differences in metallurgical recovery because it is fully
accounted for in the economic analysis (see Section 22). Project physicals and economic analysis are also presented by individual
commodity contribution to facilitate detailed analysis based on differing metallurgical recoveries.
Table 16-9 Grade Equivalency Factors
Used in El Compas Cut-off Grade Model
| |
1 g/t Au is equivalent to |
1 g/t Ag is equivalent to |
| Au (g/t) |
1.0 |
78.0 |
Using these grade equivalency factors,
the formulae used to calculate AgEq is;

| 16.3.3 | Estimate of Resource Tonnage-Grade Above Selected Resource Cut-off Grade |
The El Compas block model has been summarised
to provide a summary of tonnage-grade data in terms of AuEq grade bins. The resource tonnage-grade curves (in terms of AuEq) are
shown in Figure 16-6 and Figure 16-7.
| | | 83 |

Figure 16-6 Tonnage Grade Data
for El Compas Model- Indicated Material Class

Figure 16-7
Tonnage Grade Data for El Compas Model- Inferred Material Class
| | | 84 |
| 16.3.4 | Cut-off Grade Financial Drivers |
The operating cost drivers have been
based on the following key areas:
| · | Operating development (including ground support and services) |
| · | Operating stope drill and blast |
| · | Surface mill feed material haulage |
Backfill unit cost estimates were built
up using first principles for the selected mining method. Metallurgical recovery parameters for each of the commodities to concentrate
product were supplied by Tetra Tech and approved by Canarc. Payable percentage terms from the refineries for each of the commodity
are based on typical regional data and approved by Canarc.
| 16.3.5 | Cut-off Grade Calculation |
The gold equivalent Cut-off Grade (based
on in-situ Resource COG) is the total of operating costs per tonne of in-situ Resource, divided by the revenue per ounce of in-situ
Resource AuEq.
Based on the analysis, the marginal
cut-off grades calculated for underground extraction methods are summarised in Table 16-10.
Table 16-10 Summary
of cut-off grades
| |
Full COG (g/t AuEq) |
Incremental COG (g/t AuEq) |
Development Only (g/t AuEq) |
| Cut-off Grade (In-situ) |
2.2 |
2.0 |
1.3 |
| Cut-off Grade (Recovered and Diluted |
2.0 |
1.9 |
1.3 |
| | | 85 |
| 16.4 | Underground Mine Design |
| 16.4.1 | Geotechnical Parameters |
Limited geotechnical data was available
upon which to conduct detailed geotechnical analysis. The geotechnical analysis described in the Technical Memorandum from October
19, 2012 (SRK Consulting, 2012) was used as the basis for further basic analysis for the current geotechnical mine design parameters.
Expected ground support requirements
were estimated using the tunnelling quality index, Q. Table 1-1 shows the Excavation Support Ratio (ESR) values used in this
system.
Table 16-11 ESR Values
| Type of Excavation |
ESR |
| A |
Temporary mine openings etc |
ca. 3-5 |
| B |
Vertical shafts* |
i) circular sections
ii) rectangular/square section |
ca. 2.5
ca. 2.0 |
| |
* Dependent on purpose. May be lower than given values. |
| C |
Permanent mine openings, water tunnels for hydro power (exclude high pressure penstocks) water supply tunnels, pilot tunnels, drifts and headings for large openings |
1.6 |
| D |
Minor road and railway tunnels, surge chambers, access tunnels, sewage tunnels etc |
1.3 |
| E |
Power houses, storage rooms, water treatment plants, major road and railway tunnels, civil defence chambers, portals, intersections etc |
1.0 |
| F |
Underground nuclear power stations, railway stations, sports and public facilities, factories etc |
0.8 |
| G |
Very important caverns and underground openings with a long lifetime = 100 years, or without access for maintenance. |
0.5 |
| |
|
|
|
The following parameters were established
for estimating ground support requirements:
| · | Drive dimensions 4.5 x 4.5 m |
RMR values based on rock classes at
El Compas (SRK Consulting, 2012) are shown in Table 16-12.
| | | 86 |
Table 16-12 Summary of Average
RMR Values
| Rock Type |
Relative Quality |
Percent of Rock Mass |
RMR |
Rock Class |
Comment |
| Andesite |
Strong |
59% |
85 |
II - Good |
|
| Medium |
12% |
60 |
III - Fair |
Typical of potentially economic material |
| Weak |
8% |
30 |
IV - Poor |
Typical in shear zones |
| Rhyolite |
Strong |
15% |
85 |
II - Good |
Southern portion |
| Medium |
4% |
60 |
III - Fair |
|
| Weak |
2% |
30 |
IV - Poor |
|
| Overall |
Strong |
74% |
|
II - Good |
|
| Medium |
16% |
III - Fair |
| Weak |
10% |
IV - Poor |
Figure 16-8 shows the ground support
chart where Q-values are plotted against the Equivalent dimension. The El Compas rock mass is represented on this chart for each
of the relative rock qualities (Strong – Green, Medium – Blue and Weak – Red).
| | | 87 |

Figure 16-8 Estimated Ground
Support Based on Tunnelling Quality Index Q (Grinstad, 1993)
The ground support design for the El
Compas mine will be:
| · | No support required for Good and Fair rock conditions. However 2 bolts/metre have been assumed
for spot bolting according to actual conditions. |
| · | Systematic bolting and screen required for Poor rock conditions, at a spacing of 1.5 x 1.5 m. If
unreinforced shotcrete is available, shotcrete can be used as an alternative to screen at a thickness of 50-100 mm. |
Splitset bolts, 2.4 m in length will
be sufficient for ground support as they are a minimum of 50% of the planned excavation widths.
| | | 88 |
Screen is assumed to be installed in
Poor rock conditions down to 1.5 m above the floor.
The crown zone at El Compas will be
recovered following the bottom-up sequence, to maximise Resource recovery. The crown pillar above El Orito will need to remain
intact due to permitting issues with surface disturbance in that location.
Crown pillar dimension requirements
for El Orito were estimated using the Empirical Scaled Span design Method (Carter, 2014). The calculation is done using CPillar
3Dâ software, using the parameters below based on a crown pillar thickness around
20m:
| · | For Span from 5.0 to 7.5m |
| · | Thickness of Crown from 15 to 30m |
| · | Specific Gravity from 2.5 to 2.6 |
| · | Rock Quality from Fair to Good |
| · | Dip of Orebody from 65° to 90° |
From the crown pillar design guidelines
chart for this method (Figure 16-9), the majority of the area representing possible crown pillar scenarios is in category E
or better. From Table 16-13, this means that the crown pillar will have a low to moderate level of concern.

Figure 16-9 CPillarâ
Analysis Results for El Orito
| | | 89 |
Table 16-13 Crown Pillar Design
Guidelines

The existing El Compas workings are
currently flooded to the portal elevation. There are a number of east-west faults that are likely to intersect the existing workings
and these may provide conduits for the water to enter new mine development once it advances sufficiently far to the north and within
close proximity to these workings. The positions and orientation of these faults within the existing workings is not known.
There are no pumps currently installed
within the existing workings and the water level appears to be stable. Water inflow rates are unknown, however they are likely
not significant.
The orebody is to be extracted via two
independently functional underground zones with shared access infrastructure. The two relatively independent underground zones
comprise the El Compas and El Orito zones. The El Compas and El Orito mine development has been designed with consistent development
profiles. Table 16-14 presents a summary of lateral development profiles and naming convention.
Table 16-14 Lateral Development
Profiles and Naming Conventions
| Opcode |
Description |
Profile |
Width |
Height |
Gradient (1:n) |
Cap/Op |
| DEC |
Decline |
A |
4.75 |
4.50 |
+/- 1:7 to 1:10 |
CAP |
| OD_ |
Ore Drive |
B |
4.25 |
4.50 |
Flat |
OP |
| TOD |
Transverse Ore Drive |
B |
4.25 |
4.50 |
Flat |
CAP |
| RHB |
Rehab |
B |
4.25 |
4.50 |
Flat to 1:50 |
CAP |
| ACC |
Access |
B |
4.25 |
4.50 |
1:50 to 1:30 |
CAP |
| FWD |
Footwall Drive |
B |
4.25 |
4.50 |
1:50 |
CAP |
| FAD |
Fresh Air Drive |
B |
4.25 |
4.50 |
1:50 |
CAP |
| SP_ |
Stockpile (Remuck Bay) |
C |
4.50 |
4.50 |
1:50 |
CAP |
| DSP |
Decline Stockpile (Remuck Bay) |
C |
4.50 |
4.50 |
1:50 |
CAP |
| SMP |
Sump |
D |
4.00 |
4.00 |
1:10 |
CAP |
| | | 90 |
A summary of the vertical development
profiles and naming convention is presented in Figure 16-19.
Table 16-15 Vertical Development
Profiles and Naming Conventions
| Opcode |
Description |
Profile |
Width |
Depth |
Cap/Op |
| FAR |
Fresh Air Raise to Surface |
Z |
2.5 |
2.5 |
Cap |
Mine access to the El Compas zone is
gained via surface portal on the eastern side (footwall) of the El Compas mineralisation. The mine portal is to be excavated in
the north-eastern face of the existing quarry, situated to the south of the El Compas zone. The decline ramp drives approximately
330m to the north-east and then turns to advance 200m in a northerly direction to provide access to the El Compas spiral decline
at the 340 Level (approximately 80m below surface). Approximately, a further 220m of development is required to intersect the fresh
air raise (via the spiral decline and 340 Level Access). The maximum length of secondary ventilation required prior to establishment
of the new fresh air source to the 340 Level in the El Compas zone is approximately 750m. This is considered to be well within
the capabilities of large auxiliary fans and low-leakage ducting. Once the fresh air raise has been completed in the El Compas
zone, ventilation for the continuation of El Orito development will be supplied by a large auxiliary fan installed within a bulkhead
in the 340 Level fresh air drive and low-leakage ducting. The maximum length of secondary ventilation required prior to establishment
of the El Orito fresh air raise to surface is approximately 700m, well within the capabilities of large auxiliary fans and low-leakage
ducting. This comprises 220m of secondary ventilation ducting via the El Compas zone 340 Level Access and spiral decline, 280m
via the straight ramp to El Orito and a further 200m via the El Orito spiral decline and 320 Level Access. Further detail on the
ventilation strategy is presented in Section 16.5.9.
Figure 16-10 depicts a plan view
of the primary mine ramp providing access to both the El Compas and El Orito zones. The main haulage ramp is designed at a gradient
of 1:10 to allow for priority access to higher grade El Compas stope blocks and to facilitate suitable mine haulage gradient. The
spiral declines are designed at 1:7 gradient to accommodate the optimal 20m level spacing whilst minimising lateral development
requirements. The El Compas zone includes 9 levels from the 220 Level to the 380 Level (380 Level is rehabilitated existing development).
The El Orito zone includes 6 levels from the 280 Level to the 380 Level.
| | | 91 |

Figure 16-10 Plan View of Primary
Mine Access
The main access ramp continues in a
northerly direction beyond the El Compas access to ultimately intersect the El Orito zone. The main decline ramp and El Compas
spiral decline do not intersect, with the exception of the link drive on the 350 Level. This separation allows for effective ventilation
management during concurrent mining of both zones.
El Compas Development Design
This El Compas 340 Level access point
links to the main decline spiral designed to a 22.5m centreline radius at 15% gradient (~1:7). The spiral decline ramps down in
the westerly direction (dip) at approximately 75 degrees. The spiral decline follows the orebody footwall dip at approximately
75 degrees. The spiral ramp drives vertically up to the 360 Level and down to the 220 Level, providing decline access points spanning
140 vertical metres. Level access drives are driven from the spiral decline level turnout at 20m sub-level spacing.
| | | 92 |


Figure 16-11 El Compas Development,
(i) View from South, (ii) View from North-East
For transverse extraction, the development
strategy is based on the excavation of a footwall access drive which is driven parallel to the orebody to facilitate crosscut development
into the transverse LHOS stopes (separate crosscut for each primary/secondary stope). Footwall drives extent to the relevant northing
to link the transverse mining block interface into the longitudinal stoping area. This configuration allows for the simultaneous
extraction from the transverse and longitudinal mining areas.
Typical level development drive length:
| Level Access | 50 m each |
| Fresh Air Drive | 15 m each |
| Remuck Bay | 18 m each |
| Sump | 10 m each |
The positioning of development adheres
to geotechnical guidelines relating to adequate standoff distances between underground infrastructure. A 15m minimum (wall to wall)
standoff is maintained between the footwall drive and the orebody contact in order to maintain drive stability and access to adjacent
mining areas. Fresh air drives and vertical ventilation development maintains a minimum 15m lateral offset with the footwall drive
(wall to wall).
| | | 93 |

Figure 16-12 El Compas Typical
Level Layout- Transverse Extraction (340 Level)
Remuck bays are situated within the
level access development to cater for the storage of blasted material, rehandle activity or for temporary preparation of backfill
material. Sumps are positioned within the initial portion of the level access to ensure all mine water associated with production
activity is captured prior to run-off onto the main decline and main mine access infrastructure.
Both longitudinal and transverse stopes
can be extracted simultaneously as ore drive access is maintained to the orebody lateral extents via footwall drives. Longitudinal
mining is conducted from a single ore drive centrally positioned to allow for the extraction of a maximum stoping width of 12m.
The relatively vertical nature of the orebody allows for effective drilling of the stopes via upholes from a centrally located
ore drive. The mine workings receive primary ventilation via a fresh air raise to surface. A 2.4mW x 2.4mD alimak raise is situated
between the surface and the respective level fresh air drives. The fresh air drive is situated on the southern side of the each
level access. Once vertical development is established, return air is exhausted via the decline. Detailed ventilation modelling
is recommended prior to mine plan implantation. Mine egress is supplied by the mine decline and access network, with second means
of egress provided via the fresh air raise network.
The El Compas zone includes historical
development excavations within the upper portion of the mineralisation. The as-built development commences at the existing surface
portal in the northern extent of the El Compas zone surface outcrop. Development drifts are typically excavated at 3mW x 3mH dimension
however are known to vary depending on the orebody width and development intersections. Five main mining horizons were previously
excavated spanning a maximum strike length of 245m. Historical mining records and as-built interrogations concluded that 48,645
tonnes (18,709m3) of ore was extracted from the historical excavations. Figure
16-13 displays a longsection of the El Compas existing development.
| | | 94 |

Figure 16-13 El Compas Existing
Development Longsection- View from East
The existing development has been integrated
into the proposed design in efforts to utilise pre-established mining horizons wherever possible. Figure
16-14 shows the 380, 360 and 350 Levels incorporating the historical development into the proposed development plan.
All mining levels are designed at 20m sublevel spacing with the exception of the 350 Level. The 350 level is incorporated to the
development plan as historical working in this area will need to be assessed (rehab) to facilitate transverse mining extraction
below (340 level) and longitudinal extraction above (350-360 Stopes).

Figure 16-14 El Compas Existing
Development Integrated with Proposed Design-Longsection
The 380 level is predominantly rehabilitated
development that is to be utilised for the extraction of the 380 level crown zone through to surface. The extraction methodology
for this level is defined in Section 16.4.6. 380 level rehab development also provides a secondary link drive to the fresh air
raise which will facilitate second means of egress as production activity retreats towards this area.
Non-integrated historical development
will need to be considered during production drilling activity. The southern portion of the El Compas historical development includes
dual drives on the same elevation. The Proposed mine plan rehabilitates only one drive (typically the drive on the footwall side),
thus the requirement to re-access the second drift should be assessed during operation. Figure
16-15 shows a typical section through the central portion of the El Compas design, detailing the integration of
the historical workings (rehabilitated) and the proposed development plan. Note that a single ore drive is developed or rehabilitated
on each mining level where longitudinal extraction is to take place.
| | | 95 |

Figure 16-15 El Compas Existing
Development Integrated with Proposed Design- Section View
El Orito Development Design
The El Orito zone accessed via the main
ramp extension from the El Compas 350 level link drive to the El Orito spiral ramp at the 320 Level. The El Orito 320 level represents
the bottom horizon of the upper mining panel and thus provides preferential access to first potentially economic material. At the
320 level, the El Orito spiral ramp drives vertically up to the 380 Level and down to the 280 Level, providing decline access points
spanning 100 vertical metres. The decline spiral is designed to a 22.5m centreline radius at 15% gradient (~1:7). The spiral decline
ramps down in the Westerly direction (dip) at approximately 80 degrees for the El Orito upper mining panel and maintains a vertical
alignment (zero dip) for the lower El Orito mining panel. Level access drives are driven from the spiral decline level turnout
at 20m sub-level spacing. Typical level development drive lengths and design parameters are as per those utilised for El Compas.
Figure 16-16 shows the El Orito development design in isometric
view.
| | | 96 |

Figure 16-16 El Orito Design-
Isometric View looking North
The El Orito zone consists of separate
lenses with a minimum pillar distance of approximately 5m. Each lense is serviced by an independent ore drive connecting to the
level access. Figure 16-17 shows a typical level
layout for the El Orito zone.

Figure 16-17 El Orito Design
Typical Level Layout (360 Level)
The El Orito zone is to be ventilated
in a similar fashion to that of El Compas whereby primary fresh air is to be delivered via single fresh air raise to surface. Secondary
ventilation is to be delivered via fans and vent ducting placed in active levels. Mine exhaust is to be ventilated via the main
haulage ramp and decline to surface.
| | | 97 |
As per the qualitative finding in section
16.1, the general mining method for design application is to be sublevel stoping. Based on the geometry and grade of each zone,
variations of the sublevel stoping method have been identified as optimal. These methods are as follows:
| · | Transverse sublevel stoping with primary/ secondary extraction sequence |
This method is to be applied
to El Compas zone in stope blocks >12m width. Primary stopes are to be 10m strike length (north-south) with cemented rockfill
(CRF) application. Secondary stopes are to be 15m strike length with unconsolidated waste rockfill (WRF) application. Panel extraction
is to occur in a bottom-up sequence.
| · | Longitudinal sublevel stoping |
This method is to be applied
to both the El Compas zone and El Orito zone in stope blocks <12m width. Backfill is to utilise waste rockfill (WRF) were possible
and cemented rockfill (CRF) in filling zones adjacent to future production stopes. Panel extraction is to occur in a bottom-up
sequence.
Production design was completed in three
main stages as follows;
| 4- | MSO Optimisation - Identification of Potential Mineable Inventory |
| 5- | Identification of Additional Inventory – Satellite and Close Proximity to Mined Workings |
| 6- | Manual Design Amendment - Final Mine Inventory |
All stages consider material of all
Resource classification. Each stage progressively increased design granularity and improved potential to optimise (increase) mineable
inventory. The stages culminate in a final stope design which is carried through to final interrogation, scheduling and financial
analysis.
Preliminary MSO outputs are defined
as per Section 16.2. The cut-off grade defined in Section 16.3.5 provides a fully costed stope cut-off of 2.2 g/t AuEq and incremental
cut-off of 1.9 g/t AuEq. Definition of the preliminary mineable envelope was therefore closely reflected in the MSO outputs for
the 1.8 g/t AuEq case. These outputs were used to construct the first pass mineable envelope as depicted in Figure 16-18.
| | | 98 |

Figure 16-18 MSO Outputs Indicative
of Incremental Cut-off Grade - View from East
Notable optimisation
of mine inventory tonnage and mill feed head grade was achieved as a result of positive outcomes from three initiatives:
| · | Crown Zone Inclusion - High grade material on 360/380 Levels |
| · | Manual interpretation of close - proximity incremental opportunity |
| · | Manual adjustments to stope design for increased design section granularity |
Figure 16-19
shows the design results from the culmination of the manual optimisation initiatives. In comparison to the preliminary MSO outputs
at the incremental cut-off grade (Figure 16-18), the optimised design presents increased incremental ounces, improved design
consistency along strike and practical extraction horizons. Stope blocks demonstrating a mineable width >12m over a consistent
strike length have been flagged and designed to allow for transverse extraction. The transverse extraction area in the El Compas
zone is denoted by blue and purple stope blocks of 10m and 15m strike (north-south) respectively.

Figure 16-19 Production Design,
Manually Optimised (Development Depleted) - View from East
| | | 99 |
The following
statistics are based on the final design shapes.
El Compas:
| · | Numeric Average width (global) of 11.5m |
| · | Mined as a combination of Longitudinal and Transverse Stopes |
| · | Longitudinal Stopes ~ 6.0m (Average) |
| · | Transverse Stopes ~14.0m (Average) |
El Orito:
| · | Mined as Longitudinal stopes. |
| · | Longitudinal Stopes ~ 5.0m (Average) |
In addition
to the initiatives with positive outcomes noted above, detailed assessments were also conducted to identify additional opportunities
to increase the mine plan ounce profile via peripheral incremental extension and satellite vein inclusion. These assessments did
not provide additional economically viable mining blocks, however greater clarity was gained through these investigations that
will add value to future mine plan and Resource model updates.
The final mine
plan with the crown zone recovers in excess of 85% in-situ metal from the available Resource (on an in-situ basis). Opportunities
to collect additional ounces are therefore numerically limited; however, these options have been investigated to ensure diligent
optimisation has been conducted.
Three additional
areas were identified for detailed investigation for peripheral incremental extension and satellite vein assessment.
| · | El Compas Lower South Extension |
| · | El Compas Satellite South |
| · | El Orito Extension North |
These areas
were assessed and deemed not feasible as an economic contributor to the Mineable Inventory. Refer to Appendix II for further information
on these discounted areas. Figure 16-20 shows that the remaining ounces not captured in the mining inventory are generally
situated in zones of 3.0 g/t AuEq material typically with high block dispersion.
| | | 100 |

Figure 16-20 Resource Model
and Production Design Overlay- Inventory Optimisation
| 16.4.5 | Recovery and Dilution |
Mining recovery and mining dilution
have been estimated for the chosen mining methods of Longitudinal Stoping (for orebody widths up to 12 metres) and Primary-Secondary
Transverse Stoping. Mining recovery was estimated based on the average geometries applicable to each mining method and zone.
Table 16-16 Summary
of Dilution and Recovery Factors
| |
Dilution (%) |
Recovery (%) |
| Longitudinal Stoping |
12 |
93 |
| Transverse Stoping |
14 |
91 |
| Development |
0 |
100 |
Longitudinal Stopes
Longitudinal stopes relate to stopes
up to maximum width of 12m and extracted via LHOS with cemented rockfill (CRF) as per section 16.1.3. Mining recovery of longitudinal
stopes has been calculated at 93% based on geometry, estimates of practical equipment application and benchmarking to mines utilising
a similar mining method. Mining dilution has been estimated at 12% as per Table 16-17.
| | | 101 |
Table 16-17 Summary
of Longitudinal Stoping Dilution Factor
| Parameter |
Value |
Unit |
| Stope Height |
20 |
m |
| Stope Length |
20 |
m |
| Stope Width |
6 |
m |
| Density |
2.6 |
t/m3 |
| FW/HW Overbreak |
0.3 |
m |
| CRF Contact Overbreak |
0.4 |
m |
| Dilution Total |
12 |
% |
A typical long section and plan view
of the longitudinal stoping layout is presented in Figure 16-21.


Figure 16-21- Longsection and
Plan View of Typical Longitudinal Stoping Layout
| | | 102 |
Transverse Stopes
Transverse stopes relate to stopes greater
than 12m width and extracted via primary-secondary transverse mining with cemented rockfill (CRF) of the primaries only as per
Section 16.1.3. Holistic mining recovery of transverse stopes has been calculated at 91% based on geometry, estimates of practical
equipment application and benchmarking to mines utilising a similar mining method. Mining dilution has been estimated at 14% as
per Table 16-8.
Table 16-18 Summary
of Transverse Stoping Dilution Factor
| Parameter |
Value |
Unit |
| Stope Height |
20 |
m |
| Stope Length |
20 |
m |
| Stope Width |
6 |
m |
| Density |
2.6 |
t/m3 |
| FW/HW Overbreak |
0.3 |
m |
| CRF Contact Overbreak |
0.4 |
m |
| Dilution Total |
14 |
% |
A typical long section, cross section
and plan view of the transverse stoping with CRF layout is presented in Figure 16-22.

Figure 16-22- Longsection- Long
Section, Cross Section and Plan of Typical Transverse BHS with CRF Layout
| | | 103 |
| 16.4.6 | Crown Zone Extraction Methodology |
The El Compas area exhibits mineable
inventory on the 380 Level with a vertical offset less than 15m from the defined topography. The Crown zone on the El Compas 380
level contains an estimated 75,000 tonnes at 8.2 g/t AuEq in-situ. This area represents high value to the project and as such has
been included for extraction. The extraction period has been scheduled for the later stages of El Compas zone mining which will
allow for suitable surface disturbance permits
to be approved. Figure 16-24 provides a longsection view of
the El Compas crown zone. However, drilling and blasting is to be applied to the El Compas crown zone for the following reasons:
| · | Maximise metal recovery from this high grade portion of the mineralisation |
| · | Ensure tight filling of backfill along the 380 Level void horizon |
| · | Facilitate the provision of long-term stability in the crown zone |

Figure 16-23- El Compas Crown
Zone Overview- Longsection View from East
The crown zone at El Compas will be
extracted using longitudinal longhole open stoping from the 380 Level upon completion of mining in the remainder of the El Compas
zone mineable inventory. Overburden material will be cleared from surface down to bedrock to reduce waste dilution. Drilling will
then be undertaken from surface and from underground.
Slot raises will be developed from the
380 level to surface via Alimak raising or alternative methods. Underground drilling (upholes) will be used to extract the mineralised
portion of the crown zone (the lower portion) so that this material can be recovered with minimal dilution from the 380 Level.
The upper portion consisting of waste material will then be drilled and blasted from surface. This waste material will serve as
backfill material for the void below. Minor volumes of waste material will require mucking to allow for CRF placement directly
adjacent to future stope blocks. This activity provides a stable face to blast against whilst minimising dilution from adjacent
unconsolidated waste rockfill. As the blasted waste material will occupy the void below, the ultimate upper crown portion is to
be backfilled from surface. This process will ensure tight-filling of voids, optimal metal recovery and long-term stability and
serviceability of the crown zone. Figure 16-24 presents an indicative
sequence for crown zone extraction, identifying slotting, extraction of mineralised portion on the 380 level and blasting of the
upper waste portion.
| | | 104 |

Figure 16-24- El Compas Crown
Zone Extraction Methodology- Longsection View from East
The surface disturbance associated with
the El Compas surface breakthrough is estimated to be negligible. The breakthrough footprint is estimated at 3,050m2
spanning an area of approximately 240m x 15m. Surface clearing works, equipment access and bund walls will be required to service
the blasting and backfilling activity. A 20m buffer has been assigned to this area, yielding a total disturbance boundary of approximately
15,250m2. Figure 16-25 depicts the estimated surface
disturbance boundary and breakthrough area.
| | | 105 |

Figure 16-25- El Compas Crown
Zone- Surface Breakthrough and Disturbance Boundary
Optimised crown zone extraction is highly
dependent on the accuracy of topographic data and localised resolution in the Resource model.
The El Orito zone does not present notable
mineralisation within a crown zone between surface and upper stopes, and as such, a minimum 20m pillar is to remain in-situ.
| 16.4.7 | Backfill Methodology |
Application of backfill varies for each
extraction method depending on the requirement for dilution control during adjacent stope blasting. Transverse Primary stopes are
to have 100% cemented fill applied with 4% cement (w/c) content. Transverse secondary stopes are to be 100% unconsolidated waste
rockfill (WRF) as no adjacent stope blasting is required. Longitudinal stope voids are to be filled through a combination of consolidated
(CRF) and unconsolidated (WRF) backfill. Table 16-19 provides a summary of backfill application by stope type.
| | | 106 |
Table 16-19 Summary
of Backfill Application by Stope Type
| |
% of backfill as CRF
|
% of backfill as WRF
|
Cement Addition c/w
|
| Transverse - Primary |
100% |
0% |
4% |
| Transverse - Secondary |
0% |
100% |
0% |
| Longitudinal |
50% |
50% |
4% |
CRF will be placed into the top of primary
transverse and longitudinal stopes. Transverse primary stopes receive 100% of void filling by means of CRF. In the case of longitudinal
stopes, CRF will be placed only to establish a consolidated face against the adjacent in-situ stope. This consolidated face has
been estimated at 50% of the stope void based on a 38 degree angle of repose. The loader will transfer the CRF from the remuck
bay of the upper level of the stope to be filled, and deposit this material into the stope void. Cement slurry will be made on
surface and transported underground via agitator trucks. The cement slurry will then be poured onto mine waste at the designated
remuck bay and mixed by the loader prior to placing in stope voids. A loader stop will be secured to the walls of the stope crosscuts
and will need to be periodically repositioned as the rill of CRF progresses towards the end of the primary stope void.
Figure 16-26 shows a long section
for a typical longitudinal stope whereby a loader deposits CRF into the stope void with the use of an engineered loader stop. This
image depicts the application of CRF to the desired face coverage and angle of repose. For longitudinal stopes, the remaining stope
void is filled with unconsolidated fill (WRF).
| | | 107 |

Figure 16-26 Long Section Schematic
showing Application of Consolidated Backfill into Longitudinal Stope Void
The loader stop will be secured to the
walls of the ore drive or crosscut by rated chains and the anchor points will be positioned so that they are clearly visible to
the loader operator and it can be readily identified if the loader stop has become unsecured. The loader stop will need to be periodically
repositioned as the rill of backfill progresses towards the end of the stope void.
| 16.4.8 | Mine Inventory and Final Mine Layout |
The mine design has been optimised to
reduce capital development and maximise mineable ounces within the guidance of the defined constraints and modifying factors. The
final mine layout is depicted in Figure 16-27.
| | | 108 |

Figure 16-27 Final Mine Layout
Longsection (View Looking West)
Summaries of mine physicals are presented
in Table 16-20 to Table 16-26. Tonnages represent recovered material. Recovered grades are provided for AuEq, Au and Ag
for the purpose of transparency. AuEq is calculated as per the basic commodity price equivalency formula presented in Section 16.3.5
and as such does not give consideration to relative metallurgical recoveries within this formula. Metallurgical recoveries are
fully accounted for in the economic analysis (see Section 22).
Stoping (production) activity provides
88% of potentially economic material derivation with the remaining 12% being sourced from development advance activity. 338,000
tonnes of waste material is generated during life of mine. Table 16-20 provides a summary of material mined by source.
Table 16-20 Material Quantity by Source
| Material Quantity by Source |
Value |
| Production Potentially Economic Material Mined (t) |
967,426 |
| Production Waste (t) |
0 |
| |
|
| Development Potentially Economic Material Mined (t) |
129,872 |
| Development Waste (t) |
337,913 |
| |
|
| Development Waste Capital (t) |
337,913 |
| Development Waste Operating (t) |
0 |
| | | 109 |
The mine inventory consists of 683kt
of Indicated material, 270kt of Inferred material and 144kt of Unclassified material (internal waste dilution). Table 16-21
provides a summary of recovered potentially economic Mrec material quantity (detailing tonnes and grade) by Resource category.
Table 16-22 provides a summary of recovered potentially economic Mrec material quantity (detailing tonnes and metal ounces)
by Resource category.
Table 16-21 Mrec Material Quantity
and Grade by Resource Category
| Mrec Material by Resource Category |
Value |
| |
Mrec Material Tonnes (t) Indicated |
683,169 |
| |
Mrec Material Grade AuEq (g/t) Indicated |
5.3 |
| |
Mrec Material Grade Au (g/t) Indicated |
4.7 |
| |
Mrec Material Grade Ag (g/t) Indicated |
49.8 |
| |
|
|
| |
Mrec Material Tonnes (t) Inferred |
269,882 |
| |
Mrec Material Grade AuEq (g/t) Inferred |
4.9 |
| |
Mrec Material Grade Au (g/t) Inferred |
4.1 |
| |
Mrec Material Grade Ag (g/t) Inferred |
62.4 |
| |
|
|
| |
Mrec Material Tonnes (t) Unclassified |
144,246
|
| |
Mrec Material Grade AuEq (g/t) Unclassified |
0.0 |
| |
Mrec Material Grade Au (g/t) Unclassified |
0.0 |
| |
Mrec Material Grade Ag (g/t) Unclassified |
0.0 |
| |
|
|
Table 16-22 Mrec Metal by Resource
Category
| Mrec Metal by Resource Category |
Value |
| |
Mrec Material Tonnes (t) Indicated |
683,169 |
| |
Mrec Material Metal AuEq (oz) Indicated |
117,034 |
| |
Mrec Material Metal Au (oz) Indicated |
103,122 |
| |
Mrec Material Metal Ag (oz) Indicated |
1,093,025 |
| |
|
|
| |
Mrec Material Tonnes (t) Inferred |
269,882 |
| |
Mrec Material Metal AuEq (oz) Inferred |
42,060 |
| |
Mrec Material Metal Au (oz) Inferred |
35,173 |
| |
Mrec Material Metal Ag (oz) Inferred |
541,088 |
| |
|
|
| |
Mrec Material Tonnes (t) Unclassified |
144,246 |
| |
Mrec Material Metal AuEq (oz) Unclassified |
- |
| |
Mrec Material Metal Au (oz) Unclassified |
- |
| |
Mrec Material Metal Ag (oz) Unclassified |
- |
| |
|
|
The mine plan development includes 8,635
m of lateral advance and 328m of vertical excavation. Lateral capital development total 5,577m, contributing 65% of the holistic
lateral development requirement. Table 16-23 provides a summary of holistic development metres.
| | | 110 |
Table 16-23 Holistic Summary of Development
Metres
| Development Metres |
Value |
| Lateral Capital (m) |
5,577 |
| Lateral Operating (m) |
2,656 |
| Lateral Total (m) |
8,635 |
| |
|
| Vertical Capital (m) |
328 |
| Vertical Operating (m) |
- |
| Vertical Total (m) |
328 |
The El Compas zone requires approximately
5,100m lateral development, equating to 59% of lateral advance requirements or 68% of the holistic capital lateral development
for the mine plan. The El Compas and El Orito zones incorporate 201m and 127m of vertical development respectively. Table 16-24
provides a summary of development metres by zone.
Table 16-24 Development Metres by Zone
| Development Metres by Zone |
Value |
| |
El Compas |
|
| |
Lateral Capital (m) |
3,780 |
| |
Lateral Operating (m) |
1,324 |
| |
|
|
| |
Vertical Capital (m) |
201 |
| |
Vertical Operating (m) |
0 |
| |
|
|
| |
El Orito |
|
| |
Lateral Capital (m) |
1,797 |
| |
Lateral Operating (m) |
1,734 |
| |
|
|
| |
Vertical Capital (m) |
127 |
| |
Vertical Operating (m) |
0
|
| |
|
|
Table 16-25 and Table 16-26
present a summary of total development advance by excavation type (opcode) for both lateral and vertical advance.
Table 16-25 Lateral Development by
Opcode
| Lateral Development by Opcode |
(m) |
| DEC |
Decline |
2,630 |
| OD_ |
Ore Drive |
2,651 |
| TOD |
Transverse Ore Drive |
1,015 |
| ACC |
Access |
953 |
| FWD |
Footwall Drive |
312 |
| RHB |
Rehab |
198 |
| FAD |
Fresh Air Drive |
291 |
| SP_ |
Stockpile (Remuck Bay) |
228 |
| DSP |
Decline Stockpile (Remuck Bay) |
228 |
| SMP |
Sump |
130 |
| | | 111 |
Table 16-26 Vertical Development by
Opcode
| Vertical Development by Opcode |
(m) |
| FAR |
Fresh Air Raise |
328 |
| |
|
|
| 16.5 | Underground Mine Schedule |
All designed mining activities have
been sequenced to optimise mining activity interaction, adhere to geotechnical recommendations and prioritise the potentially economic
material extraction. Extraction sequence is dominantly controlled via a priority value which is referenced during the resource
levelling stage. The priority value has been manually assigned based on preference for high grade material whilst adhering to a
practical extraction sequence. The priority assignment essentially ensures that the El Compas upper panel is prioritised for extraction
prior to the extraction of the lower panel. The priorities generated places precedence on the lower levels of the upper panel so
that mining of potentially economic material can commence as soon as possible. Later in the scheduling stage, priorities are manually
adjusted in order to adjust sequence (most non-critical path) and smooth the development and production profile.
Both the El Compas and El Orito zones
are divided into two mining panels. The upper panels for both zones are positioned from the 320 level and above, and the lower
panels being positioned below the 320 levels. As the upper panels are sequenced to commence extraction prior to the lower panels,
the bottom level of the panels is to be backfilled with cemented waste rockfill (CRF) to facilitate safe access below. Figure 16-32
presents the panel definition for the mine plan.

Figure 16-28 Mine Plan Panel
Definition by Zone- View from East
Pre-production development is prioritised
to target development that is critical path to the extraction of potentially economic material. Priority is initially placed on
advancing the main ramp development and 320/340 levels providing direct access to potentially economic material instead of prioritising
the advancement of the decline and non-critical path development. The results of this priority establishment can be seen in Figure
16-32 where first potentially economic material production is achieved on the 320 Level in the form of ore drive excavation
and high grade primary stope extraction.
Sequencing assigned high priority to
high grade stope blocks. The mine sequence was driven by both numeric priority assignment and manual sequence constraints to facilitate
high grade material extraction first wherever possible. Figure 16-33 displays the mine plan with AuEq in-situ grade legend
applied for identification of high grade priority targets.
| | | 112 |

Figure 16-29 Mine Plan Panel
AuEq In-situ Grade Legend- View from East
The sequence methodology endeavours
to prioritise the establishment of the lower levels of each mining panel to bring potentially economic material production online.
Development then progresses upwards within each mining block to maintain the central retreat of the mining front. For the El Compas
upper panel, development is focussed on establishing critical path ventilation networks to support operation at depth, whilst targeting
the excavation of the mining panels on the lower levels to bring production online. Development then progresses upwards within
the mining panels. This sequence delays non-critical capital development and allows for optimised progression of operating development.
Both production methods utilise bottom-up
extraction of mining blocks with rings drilled and blasted from the lower horizon as upholes and backfill with CRF or unconsolidated
waste rockfill delivered from the upper level. The general production strategy is to develop the central level access in order
to link to high priority ore drives and footwall drives providing direct access to the orebody. Extraction of transverse stopes
can occur as soon as development and ventilation establishment permits. Remote loaders will be required to muck potentially economic
material beyond the stope brows to create open stopes ready for backfilling.
CRF is mixed in underground remuck bays
with cement transported via agitator truck from a surface concrete batch plant. CRF is placed into primary stopes and longitudinal
stopes which will be mined against by future stopes. Unconsolidated waste backfill is placed into secondary transverse and all
other longitudinal stopes. No rib pillars are required except where waste blocks demand natural pillars of uneconomic material.
All production stope potentially economic
material is set to ASAP (as soon as possible). This sequence results in development being prioritised to areas which will bring
stopes into production, whilst maintaining the desired progression of the mining front. All stopes cannot be commenced until development
is in place above and below the stope block. This is to ensure a drilling horizon is established above and a mucking horizon is
established below. A 7 day curing delay period is established in the sequencing rules to ensure that any stope adjacent to stopes
with consolidated fill (both laterally and vertically) cannot be extracted until this curing period has passed.
Longitudinal stopes within each panel
can be extracted independently to the transverse stoping areas due to independent means of primary access. Due to the bottom up
mining sequence, backfilled longitudinal stopes (WRF) establish a working platform for access for the stopes above. Transverse
stope extraction is sequenced to occur independently to the longitudinal stopes, with the exception of longitudinal stopes on the
abutments of primary stopes which require a 7 day delay after the placement of CRF within the primary stope void.
| | | 113 |
Primary stopes are established first
within the transverse arrangement in a bottom up extraction scenario. A secondary stope can commence only when the adjacent primary
stope and the primary stopes on the level directly above have undergone a 7 day curing period.
The Processing facility has a defined
preferential operating capacity of 450 tpd (average). Holistic potentially economic material production tonnage is therefore targeted
to adhere to the mill throughput.
All scheduling rates have been based
on contractor feedback on regional productivity and cross checked with similar operations. Task rates refer to the productivity
rate at which any given task can complete its primary objective within an average operational scenario. For example, the task rate
for a development heading indicates the rate at which that development heading can be advanced (metres per month) when considering
drilling, blasting, mucking, ground support and service extension.
Table 16-27 summarises the development
task rates applied to schedule tasks. Lateral rehab rate refers to re-access, stripping and ground support of historic underground
development.
Table 16-27 Development Task Rates-
Scheduling Rates
| Development Type |
Task Rate |
Unit |
| Lateral Development |
180 |
m/month |
| Lateral Rehab |
360 |
m/month |
| Fresh Air Raise |
90 |
m/month |
Resource rates refer to the productivity
rate at which an assigned resource such as a development drill (Jumbo) can complete available tasks in a given scenario. Single
heading scenario relates to situations whereby a single active main face is available which is typical for initial decline advancement.
Multi heading scenario typically occurs when the main decline reaches a level turnout of access. From that point, multiple active
headings are available and jumbo drill utilisation increases. This represents the theoretical productivity of the equipment in
the given scenario. Based on an average 3.0 metre cut length, a resource rate of 2 cuts per day and 3 cuts per day have been assigned
for single and multi-heading scenarios respectively. Drive rehabilitation is assigned an equivalent 4 cuts per day rehab advance.
Table 16-28 summarises the development resource rates applied to assigned development drill resource(s).
Table 16-28 Development Resource Rates-
Scheduling Rates
| Development Type |
Resource Rate |
Unit |
| Single Heading Scenario |
180 |
m/month |
| Multi Heading Scenario |
250 |
m/month |
Production tasks involving mucking such
as backfill placement and production mucking are based on the maximum achievable rate at which a single loader can complete the
mucking task in a given period. The rate is based on the assignment of a single resource to the mucking task. Production drilling
task rate is also based on the assignment of single production drill unit to any given production drill task. The task rate therefore
represents the productivity of the assigned resource. Table 16-29 summarises the production task rates.
| | | 114 |
Table 16-29 Production Task Rates-
Scheduling Rates
| Task |
Value |
Units |
| Production Mucking |
500 |
t/day |
| Production Drilling |
200 |
drm/day |
| CRF Backfill Placement |
500 |
t/day |
| WRF Backfill Placement |
500 |
t/day |
Once task rates have been applied to
the relevant schedule tasks, resources are assigned to relevant tasks (Multiple resource assignments in some instances, ie. development
drill and loader) so that the schedule can be resource levelled to reflect a practical and achievable production profile based
on the equipment available and the productivity of the assigned equipment. Resources that are assigned to tasks with defined task
rates must have a defined resource rate.
Resource rate refers to the productivity
of a given piece of equipment when assigned to multiple tasks in a given period. An example of how a resource rate works is to
consider a scenario where multiple development headings are available to a single development drill. Although each development
heading can theoretically achieve say 180m/month, a development drill can complete its drilling task for one heading, tram to another
heading and continue to drill. Therefore the rate at which a development drill can advance headings is greater than the advance
rate of a single heading.
In the case of the development drill
resource rate, a rate of 250m advance/month for a multiple heading scenario has been assigned. The resource rate for development
in a single heading scenario is defaulted to the task rate as only one heading is available.
Selected critical tasks within the schedule
are resource levelled based on task rate and resource rate. The rate at which a task is completed is dictated by both rates depending
on which metric constrains productivity. Multiple assignments can be made to tasks, however the impact of additional resources
can only reduce a task duration if there is sufficient capacity within the task rate (ie, if the resource rate is less than the
task rate).
| | | 115 |
A resource levelled schedule is generated
from the establishment of these rates and resource assignments, in combination with set targets for potentially economic material
generation.
Production drilling factors have been
calculated for longitudinal and transverse extraction methods. Longitudinal factors include the provision of a slot raise of 2.5mW
x 2.5mD per 20m stope strike length. Transverse factors include the provision of a single slot raise of 2.5mW x 2.5mD per transverse
retreat. The transverse factor represents a weighted average factor of a typical transverse stoping block consisting of both primary
and secondary stope extraction. A charge factor of 90% hole length has been used for the purpose of explosive quantity estimation.
Table 16-30 provides a summary of production drilling factors for each respective mining method.
Table 16-30 Production Drilling Factors
| Drilling Factor |
Value |
Units |
| Longitudinal Stope |
5.45 |
t/drm |
| Transverse Stope |
7.09 |
t/drm |
This PEA includes inferred Mineral Resources
that are considered too speculative geologically to have the economic considerations applied to them that would enable them to
be categorised as mineral reserves, and there is no certainty that the PEA will be realised.
The life-of-mine plan represents a 7.25
year mine life (29 Quarters) at approximately 164,000 tpa. Production ramp-up to steady state 450tpd (ROM) is achieved in Q1 Year
2. Average mill feed head grade for LOM is approximately 4.5 g/t AuEq (3.9 g/t Au). All scheduled physicals and summary data presented
in this section represents mined and recovered (Mrec) values. Figure 16-30 depicts mined and recovered potentially economic
material tonnage and grade on an annual basis.

Figure 16-30 Mrec Material Tonnes
versus Mrec AuEq Grade- Annually
| | | 116 |
High grade material has been realised
early in the production profile wherever possible with the exception of the grade increase in Year 5 purely associated with the
extraction of the El Compas high-grade crown zone. The El Compas crown zone represents 75,000 potentially economic material tonnes
at 8.2 g/t AuEq which presents a period of grade inflation.
Table 16-31 presents a summary of
potentially economic material tonnage and grades (Mrec) by project year.
Table 16-31 Potentially Economic Material
Tonnage and Grade- Annually
| Material |
Year 1 |
Year 2 |
Year 3 |
Year 4 |
Year 5 |
Year 6 |
Year 7 |
Year 8 |
| Mrec Material Tonnes (t) |
58,686 |
167,069 |
169,597 |
163,770 |
170,123 |
172,497 |
163,880 |
31,677 |
| Mrec Material Grade AuEq (g/t) |
6.1 |
4.9 |
4.2 |
4.0 |
6.0 |
4.0 |
3.6 |
2.6 |
| Mrec Material Metal AuEq (oz) |
11,562 |
26,365 |
23,096 |
21,172 |
33,006 |
22,296 |
18,982 |
2,614 |
| Mrec Material Grade Au (g/t) |
5.3 |
4.4 |
3.4 |
3.6 |
5.5 |
3.3 |
3.1 |
2.1 |
| Mrec Material Metal Au (oz) |
10,008 |
23,507 |
18,543 |
19,122 |
30,223 |
18,344 |
16,400 |
2,147 |
| Mrec Material Grade Ag (g/t) |
64.7 |
41.8 |
65.6 |
30.6 |
40.0 |
56.0 |
38.5 |
36.0 |
| Mrec Material Metal Ag (oz) |
122,063 |
224,539 |
357,754 |
161,035 |
218,678 |
310,496 |
202,859 |
36,690 |
| Waste Mrec Tonnes (t) |
112,111 |
100,717 |
6,340 |
42,438 |
55,292 |
21,014 |
- |
- |
Table 16-32 presents a summary of
annual metal production, recovery and payable ounces. Mill recovery for gold and silver has been estimated at 83.3% and 55.3% respectively.
Payables for gold and silver have been assigned 99.5% and 98.0% respectively.
Table 16-32 Annual Metal Production
and Recovery
| |
Unit |
Total |
Year 1 |
Year 2 |
Year 3 |
Year 4 |
Year 5 |
Year 6 |
Year 7 |
Year 8 |
| Mill Feed |
t |
1,097,297 |
58,686 |
167,069 |
169,597 |
163,770 |
170,123 |
172,497 |
163,880 |
31,677 |
| |
|
|
|
|
|
|
|
|
|
|
| Contained Gold |
oz |
138,295 |
10,008 |
23,507 |
18,543 |
19,122 |
30,223 |
18,344 |
16,400 |
2,147 |
| Contained Silver |
oz |
1,634,113 |
122,063 |
224,539 |
357,754 |
161,035 |
218,678 |
310,496 |
202,859 |
36,690 |
| |
|
|
|
|
|
|
|
|
|
|
| Recovered Gold |
oz |
115,200 |
8,337 |
19,582 |
15,446 |
15,929 |
25,176 |
15,281 |
13,662 |
1,788 |
| Recovered Silver |
oz |
903,991 |
67,525 |
124,215 |
197,909 |
89,085 |
120,972 |
171,766 |
112,222 |
20,297 |
| |
|
|
|
|
|
|
|
|
|
|
| Payable Gold |
oz |
114,624 |
8,295 |
19,484 |
15,369 |
15,849 |
25,050 |
15,204 |
13,593 |
1,779 |
|
Payable Silver
|
oz |
885,912 |
66,175 |
121,731 |
193,951 |
87,303 |
118,553 |
168,331 |
109,977 |
19,891 |
The El Compas zone is forecast to yield
an average mill feed head grade of 5.0 g/t AuEq (4.3 g/t Au). The El Compas zone represents a higher mill feed head grade compared
to the El Orito zone at 3.5 g/t AuEq (3.0 g/t Au). Figure 16-31 shows
the annual grade values (AuEq) for the El Compas and El Orito zones.
| | | 117 |

Figure 16-31 Mrec Material Tonnage
and Grade by Zone- Annually
Table 16-33 provides an annual summary
of potentially economic material tonnage and grade by zone.
Table 16-33 Potentially Economic Material
Tonnage and Grade by Zone- Annually
| |
Year 1 |
Year 2 |
Year 3 |
Year 4 |
Year 5 |
Year 6 |
Year 7 |
Year 8 |
| El Compas |
|
|
|
|
|
|
|
|
| Mrec Material Tonnes (t) |
58,686 |
167,069 |
169,597 |
163,770 |
143,288 |
49,512 |
- |
- |
| Mrec Material Grade AuEq (g/t) |
6.1 |
4.9 |
4.2 |
4.0 |
6.6 |
5.0 |
- |
- |
| Mrec Material Grade Au (g/t) |
5.3 |
4.4 |
3.4 |
3.6 |
6.0 |
3.7 |
- |
- |
| Mrec Material Grade Ag (g/t) |
64.7 |
41.8 |
65.6 |
30.6 |
40.6 |
95.5 |
- |
- |
| |
|
|
|
|
|
|
|
|
| El Orito |
|
|
|
|
|
|
|
|
| Mrec Material Tonnes (t) |
- |
- |
- |
- |
26,835 |
122,984 |
163,880 |
31,677 |
| Mrec Material Grade AuEq (g/t) |
|
|
|
|
3.3 |
3.6 |
3.6 |
2.6 |
| Mrec Material Grade Au (g/t) |
- |
- |
- |
- |
2.8 |
3.1 |
3.1 |
2.1 |
| Mrec Material Grade Ag (g/t) |
- |
- |
- |
- |
36.7 |
40.1 |
38.5 |
36.0 |
Figure
16-32 shows the final mine plan color-coded by project year. This visual depicts the El Compas zone completing extraction
in project Year 6 with the El Orito zone completing production in project Year 8.
| | | 118 |

Figure 16-32 Mine Plan by Project
year- Longsection View from East
Approximately 967,000 tonnes of potentially
economic material is derived from stoping activity, with the remaining 130,000 tonnes derived from development activity (12% of
total potentially economic material generated). Figure 16-33 shows
the annual potentially economic material tonnage profile for production versus development.

Figure 16-33 Annual Mrec Material
- Production versus Development
The El Compas zone is scheduled to initiate
production ramp-down in Q1 Year 5 as the El Orito zone commences potentially economic material production. The El Compas zone extraction
is scheduled to end in Q2 Year 6 with the El Orito zone reaching steady state thereafter. Figure
16-34 presents a chart depicting potentially economic material tonnage by quarter for each respective production zone.
| | | 119 |

Figure 16-34 Quarterly Mrec
Material Tonnes by Zone
Lateral development advance averages
200m/month during the establishment of El Compas production zone (Year 1 and Year 2). Lateral development for El Compas ramps down
during H1 Year 3 with an average advance of 100m/month. Development advance for access and establishment of the El Orito zone commences
H2 Year 4 at an average advance of 130m/month, terminating in H2 Year 6. Figure
16-35 presents capital and operating lateral development advance by year.

Figure 16-35 Lateral Development
Metres - Annually
Critical path development advance pauses
for approximately 1 year between Q3 Year 3 and Q2 Year 4. In efforts to delay non-critical path capital development, El Orito development
advance was delayed as the potentially economic material tonnage target can be sufficiently maintained from the established El
Compas infrastructure during this period. The recommencement of development advance in Q3 Year 4 is associated with the access
and establishment of the El Orito production zone. The El Orito zone requires an average of 130m/month advance until development
completion in Q4 Year 6. Figure 16-36 presents a charted quarterly
summary of capital and operating lateral development metres by quarter.
| | | 120 |

Figure 16-36 Lateral Development
Metres- Quarterly
Figure
16-37 shows the mine plan development color-coded by project year. This visually depicts the El Compas zone completing
development in Q2 Year 3 with the El Orito zone completing development in project Q4 Year 6.
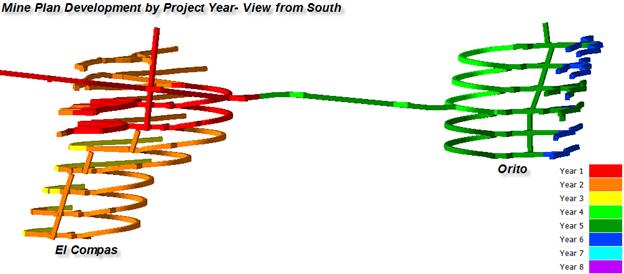
Figure 16-37 Mine Plan Development
by Project year- View from South
| 16.5.4 | Backfill and Waste Provision |
Life of mine waste generation is estimated
338,000 tonnes. Approximately 864,000 tonnes of waste is required for mine operation (LOM) comprising of 844,000 tonnes for backfill
placement and 20,000 tonnes for road base provision. Underground operation is estimated to present a waste provision deficit of
526,000 tonnes (LOM). Waste material requirements have been estimated for underground activity only and do not consider material
provisions for surface works. Surface requirements are included within relevant costing and activity calculations.
| | | 121 |
Figure
16-38 shows the cumulative waste balance for life of mine. Waste provision realises deficit commencing Q1 Year 3 of
mine production.

Figure 16-38 Cumulative Waste
Balance
Materials handling of waste material
occurs via four paths as per Figure 16-39.
| · | U/G to U/G – Waste sourced from development moved from source direct to stope void or road
base application (sizing dependent). |
| · | U/G to S/P – Waste sourced from waste and hauled to surface waste stockpile. This path is
required during mine establishment where waste provision exceeds backfill requirement. |
| · | S/P to U/G- Waste material is rehandled and moved from surface stockpile to location of underground
requirement. This path is required in the early stages of mine production. Backfilling activity can source material from the surface
stockpile. |
| · | Quarry to U/G- Waste material is to be sourced through alternative means such as surface quarry
activity. This path is required once the surface waste stockpile is depleted and alternative provision is required. |
It should be noted that a minimum surface
waste stockpile should be maintained throughout production to provide a contingency for backfilling and to provide a physical buffer
between quarry activity and site office buildings.
| | | 122 |

Figure 16-39 Waste Material
Handling Path Scenarios
Waste material is to be supplied from
quarry activity from Q1 Year 3 onwards, culminating in a total alternative provision of 526,000 tonnes. Figure
16-40 provides a chart of cumulative waste provision from quarry activity by period (LOM).

Figure 16-40 Alternative Waste
Provision Requirement (Cumulative)
| 16.5.5 | Dewatering Strategy |
The existing workings are estimated
to contain 18.7ML of water based on historical mining records and as-built excavation volumes. Dewatering of the existing workings
is expected to take approximately 60 days, equating to a dewatering rate of 3.6L/s. It is expected that if dewatering commences
once the new ramp development reaches the same elevation as the uppermost existing El Compas level development, that dewatering
would maintain the water level well below the elevation of the advancing ramp development.
| | | 123 |
Key points for historic workings dewatering
strategy are as follows:
| · | The Main ramp reaches the 380 elevation after approximately 280m lateral development
(ie; down to the second ramp remuck bay) |
| o | Ideally, this should be the trigger to start dewatering in late Q1 |
| o | Dewatering is estimated to take approximately 60 days |
| · | El Compas development is excavated within 100m lateral proximity to as-built workings during the
first cut of the El Compas spiral decline in mid Q2. |
| · | The historical as-built development is undercut by the new proposed development in late Q2 to early
Q3. |

Figure 16-41 El Compas Development-
As-builts for Dewatering and Proposed Development Schedule
The El Compas mine will be managed by
Canarc through employment of management, administrative and technical personnel). Mining will be performed by a local mining contractor
with requisite experience and equipment.
| 16.5.7 | Labour Requirements |
Underground mining activity will be
conducted by the mining contractor with the owner supplied labour force providing overarching site management, mine technical support
and processing facility labour. The mine contractor will provide maintenance labour for the mine and mobile equipment fleets.
Table 16-34 shows a summary of
owner labour requirements by department.
| | | 124 |
Table 16-34 El Compas Labour Requirements
| Labour Area |
Head Count |
| General Manager |
1 |
| General & Administration |
14 |
| Mine Administration |
1 |
| Mine Technical |
9 |
| Mill Administration |
1 |
| Mill Technical |
2 |
| Mill Operations |
29 |
| Mill Maintenance |
7 |
| Total Owners Labour Workforce |
64 |
| 16.5.8 | Equipment Requirements |
Mobile equipment for the mine will be
supplied by the mining contractor according with the size and capacity determined by Canarc.
The mobile equipment requirements for
El Compas have been determined on the basis of the planned production rate, mining method and development profile dimensions.
Table 16-35 summarises the mobile equipment requirements.
Table 16-35 El Compas Mobile
Equipment Requirements
| Equipment |
Capacity |
Dimensions |
Quantity |
Example |
| Loader |
6.7t payload (2.7-3.7m3 bucket) |
2.14mW x 8.63mL x 3.21mH |
2 |
Sandvik LH307 |
| Truck |
32t payload |
2.55mW x 7.82mL x 3.02mH |
2 |
Iveco AD380T50 6x4 |
| Jumbo |
Twin boom |
2.15mW x 11.80mL x 2.95mH |
1 |
Sandvik DD321 |
| Bolter |
Single boom with screen handler (option) |
2.37mW x 12.04mL x 3.10mH |
1 |
Sandvik DS411 |
| Production Drill |
Horseshoe Frame |
3.24mW x 10.04mL x 3.1mH |
1 |
Sandvik DL321 |
| ANFO Loader |
1360kg ANFO |
1.98mW x 8.29mL x 2.29mH |
1 |
MacLean AC2 |
| Light Vehicle (Underground) |
2/5 person |
1.89mW x 5.39mL x 1.79mH |
3 |
Toyota Tacoma |
| Grader |
|
2.45mW x 9.77mL x 3.33mH |
1 |
Cat 120K |
| Service Vehicle (IT Carrier) |
|
2.78mW x 9.12mL x 3.45mH |
1 |
Cat IT62H |
| Light Vehicle (Surface) |
5 person |
1.89mW x 5.39mL x 1.79mH |
1 |
Toyota Tacoma |
| | | 125 |
| 16.5.9 | Ventilation Strategy |
During initial development of the ramp
from the new portal until the El Compas fresh air raise is developed through to surface, the mine will be force ventilated by large
auxiliary fans (installed outside the new portal) and low-leakage ducting.
Following development of the El Compas
fresh air raise, a primary axial flow fan will be installed on top of this raise, force-ventilating the mine and exhausting via
the new portal.
A large auxiliary fan will be installed
in a bulkhead on the 340 Level (El Compas zone) to deliver fresh air for the continued ramp development towards the El Orito zone.
Once the El Orito fresh air raise is developed through to surface, a second primary fan will be installed on top of the El Orito
fresh air raise, force ventilating the mine and exhausting via the new portal.
Mine ventilation requirements and infrastructure
are discussed further in Section 18.8.
| | | 126 |
The use of the term “ore”
within this section relates to potentially economic mineable inventory delivered to the processing facility.
| 17.1 | Operating Facility and Treatment Flowsheet |
Treatment of the El Compas potentially
economic material will be performed at the La Plata processing facility located 20 km from the mine. The facility is accessed via
all-weather roads from both the El Compas mine and the nearby city of Zacatecas. The facility includes a mineral processing plant,
TMF and related equipment, including infrastructure. Operations at La Plata have been shut down since October 2014. The plant was
originally constructed with support from the Zacatecas State government for the purpose of undertaking toll milling for smaller
local mines. The reported design capacity of the processing facility was 500 tonnes per day.
The La Plata processing facility incorporated
conventional comminution and froth flotation to produce concentrate for sale to nearby smelters and refiners. Canarc will modify
the processing facility to add a gravity circuit, a concentrate leaching and recovery circuit and a refinery to allow for doré
production on site. Equipment for the comminution and flotation circuits that is currently installed includes crushers, mill feed
material bins, ball mills, conveyors, flotation cells, thickeners and tailings handling. Some of this equipment requires refurbishment.
Miscellaneous auxiliary items including pumps, piping, electrical and instrumentation may need alterations or replacement. A list
of the major existing equipment is outlined in Table 17-1.
| | | 127 |
Table 17-1 Major Existing Plant
Equipment

The existing facility infrastructure
includes electric power, water supply and distribution, outbuildings such as the maintenance shops, assay laboratory and the TMF;
all of which will be leased from the government. The grinding mills and flotation circuit are housed in a steel beam supported,
metal clad structure. The processing facility will utilise municipal water, through an agreement with Minera Capstone that have
operations nearby. There has been no testing of this water supply undertaken as part of this study.
Canarc will install the additional equipment
required for a gravity circuit, a concentrate leaching and recovery circuit and a refinery to produce doré bars at site.
This includes equipment for gravity pre-treatment, cyanide leaching, cyanide detoxification and precious metal recovery, including
a Merrill Crowe (MC) circuit. The modified circuit will incorporate the existing equipment to as great an extent as possible in
order to reduce capital expenditures.
A simplified flowsheet is provided in
Figure 17-1.
| | | 128 |

Figure 17-1 Process Flow Sheet
| | | 129 |
The existing crushing circuit (see Photo
17-1) will operate with a jaw crusher and two cone crushers operating in closed circuit with a vibrating screen to produce
a ball mill feed with an 100% passing particle size of 9 mm (3/8”).

Photo 17-1 Crushing Circuit
Fine mill feed material is conveyed
separately to two ball mills, with each mill operating in closed circuit with a dedicated hydrocyclone for which the overflow is
directed to flotation. A one third split of cyclone underflow is sent to a centrifugal concentrator, and the resulting concentrate
cleaned by tabling. The flotation concentrate will be cyanide leached and the pregnant leachate solution (PLS) treated in the Merrill
Crowe recovery system. The resulting precipitate, along separately with the tabled concentrate will be smelted to produce doré
bars. A more detailed process description is provided below in Section 17.4.
| 17.2 | Process Design Criteria |
The La Plata facility will process at
a nominal daily throughput of 483 tonnes/day, at 93% availability. The average head grade of El Compas mill feed is 3.9 g/t gold
and 46.3 g/t silver, with an overall recovery of 83% for gold and 55% for silver. Precious metal recoveries are based on laboratory
test results for gravity, flotation and leaching treatment. There is some recovery extrapolation for assumed gravity cleaning by
tabling, with table rejects forwarded to cyanidation, as well as minor assumed losses during precious metal precipitation, washing,
and doré production.
The process design criteria (PDC) are
summarised in Table 17-2.
| | | 130 |
Table 17-2 Process Design Criteria

| | | 131 |
Potentially economic material will be
delivered from the El Compas mine to the La Plata processing facility seven days a week. The mined potentially economic material
will be minus 200 mm (8”) and delivered in 20 tonne loads, operated by a private contractor. Upon arrival at site each truckload
will be weighed on a platform scale. The delivered material will be routinely dumped directly through a 200 mm grizzly into a 63
tonne receiving hopper. Oversize (+200 mm) will be broken with a portable rock breaker. Excess material delivered from the mine
is placed in separate coarse mill feed material pads, capable of accommodating up 3200 tonnes of material (approximately 7 days
of mill feed). The stockpiles will be located near the hopper in order to be fed into the plant with a front end loader.
Crushing will typically be conducted
at 12 hours per day to ensure mill feed is available over the evening shift and with sufficient contingency to allow for scheduled
crusher maintenance. The coarse mill feed material is delivered from the receiving hopper via a belt feeder to a 75 HP 0.6 m X
0.9m (24” X 36”) Manyu jaw crusher. Primary crushing reduces the rock to a nominal 50 mm (2”), which is conveyed
onto secondary crushing in a standard 150 HP 1.3 m (4.25’) Symons cone crusher. The secondary product is sent to a double
deck vibrating screen, incorporating a 9.5 mm (3/8”) bottom slot opening providing for a product particle size 80% passing
(P80) of 6.4 mm (1/4”). The plus 9.5 mm material is sent to a 150 HP 1.2 m (4’) Symons short head cone crusher
operated in closed circuit with the screen. The minus 9.5 mm screened undersize is sent to two fine mill feed material bins, each
having a 372 tonne live load capacity.
Ore is delivered from each of the two
fine mill feed material bins on a dedicated conveyor to separately feed two ball mills. The ball mills consist of a 250 HP, Marcy
7.0’ dia x 7.5’ rubber lined ball mill, and a second larger Avante 350 HP, 8’ dia X 9’ mill. (see Photo
17-2).

Photo 17-2 Ball Mill
| | | 132 |
Both mills will operate in closed cycle
with a dedicated hydrocyclone using a 300% circulating load. Each hydrocyclone overflow would target a particle size of P80
of 65 microns that is directed to flotation. Hydrocyclone underflow would be sent to a splitter box, with approximately
1/3 of the each underflow split combined and sent to a 1.7 mm (10 Tyler mesh) vibrating screen for gravity feed, and the remainder
of the split directed back to the ball mill of origin.
| 17.3.3 | Gravity Pre-treatment and Flotation |
The minus 1.7 mm gravity feed is forwarded
to a semi-continuous centrifugal concentrator. Automatic backflush times from the bowl are typically set at 30 minutes and can
be adjusted depending on the expected gold head grade. Centrifugal concentrator tailings are pumped to the larger ball mill, with
a bypass to the smaller mill available.
The resulting rougher gravity concentrate
is stored in a holding tank and cleaned on a shaking table. Table tailings are forwarded to the leach circuit, or can alternately
be directed to flotation. Table middling can be combined with table tailing, or alternately can be bypassed back to grinding. Tabled
concentrate is forwarded to an electric furnace for doré production (see Gold and Silver Recovery section, below). The rougher
gravity circuit will be placed in a secure area adjacent to the ball mills, and tabling will be performed in a secure gold recovery
room.
The combined cyclone overflows discharge
to a flotation feed conditioning tank that allows for four minutes of conditioning time. Based on laboratory observations during
testing, the flotation feed pulp density will be adjusted to 28 wt.% solids, which is lower than standard, in order to assist with
dispersing colloidal particles. Copper Sulfate (CuSO4) and flotation collectors including potassium amyl xanthate (PAX),
AF65 and A3477 are added in the conditioning tank. More information on reagents is provided in Table 17-3 below. After conditioning,
and adjusting pulp density of the flotation feed, it is forwarded to rougher float cells (see Photo 17-3) allowing for 40 minutes
retention time. Frother and additional collector are added, as required, during flotation. The combined bulk rougher concentrate
amounting to 50 tpd is collected and pumped to a 9.1 m (30’) diameter leach feed thickener.

Photo 17-3 Flotation Cells
| | | 133 |
| 17.3.4 | Concentrate Leaching |
Flocculent is added to the concentrate
slurry going into the leach feed thickener., where it is diluted to 10% wt. solids with clarified overflow water recycled into
the feed well. The incoming slurry pH is adjusted with hydrated lime (CaOH2) to pH 10.5. The adjustments to pulp density
and pH are used to improve settling characteristics.
The clarified thickener overflow is
sent to the process water storage for use in the grinding circuit. The thickener underflow is discharged at 60 wt.% solids and
pumped to the leach circuit. The leach pulp density is adjusted to 45% solids in the first leach tank with addition of recycled
barren solution. The leach circuit consists of a series of six, gravity overflow tanks, allowing for a retention time of 48 hours.
Each of the leach tanks incorporates air sparging. During the leach, free cyanide concentration is maintained at 1.0 g/L with the
addition of sodium cyanide (NaCN) solution, and protective alkalinity is controlled at pH 10.5 to 11 with slurried lime.
The leached slurry is discharged to
a product surge tank and pumped in batch to a pressure filter. The filtrate PLS is collected and the filter cake is washed twice
with barren solution. The PLS and primary wash are directed to a solution storage tank prior for delivery to the Merrill Crowe
circuit. The second filter wash is recycled and used to adjust pulp density in the leach circuit.
| 17.3.5 | Gold and Silver Recovery |
From the PLS storage tank, the un-clarified
Merrill Crowe feed solution will be pumped at 5 m3/h to a pressure leaf clarifier filter, which is pre-coated using
diatomaceous earth as a filter aid. The resulting filtrate will then discharge directly to a de-aeration tower to remove dissolved
oxygen to less than 0.5 ppm O2, following which zinc dust will be added to precipitate out dissolved gold and silver.
The slurried precipitate is pumped to a plate and frame filter press. The press will be manually opened and emptied, with the collected
precipitate placed in drying ovens. Barren solution is recycled back into the leach circuit. A barren bleed is discharged into
the cyanide detoxification circuit, along with re-pulped washed leach residue filter cake.
Dried precipitate will be put into a
mixer where smelter flux is added. The mix is then charged to an electric or gas fired furnace for smelting. Separately, the tabled
gravity concentrate will be dried, charged and melted in the furnace. Fumes from the melting furnace will be collected and cleaned
in a dust collector system before discharging to the atmosphere. Upon completion each melt will be poured into a mold and allowed
to separate into doré and slag. The doré while liquid will be sampled using vacuum tube samplers.
After cooling and solidifying, the slag
will be separated from the doré bars. The slag will be pulverised and screened to recover high grade prills. Any prills
will be returned to the melting furnace, and remaining slag will be manually recycled to the comminution circuit. The doré
bars will be cleaned and brushed, with the weight and specifics of each bar recorded along with a bar identification number. Doré
bars will be placed in a safe, in the gold room, until collected for transport to the refiner.
Areas in the gold room including the
gravity concentrate storage, tabling, precipitate press, drying ovens, electric furnace, the safe and associated equipment will
be housed in a secured and caged area with restricted access. The area and access points will be alarmed and monitored by closed
circuit security cameras.
| | | 134 |
| 17.3.6 | Detoxification and Tailings Disposal |
The leached product filter cake, following
washing, is discharged and re-pulped in process water and barren bleed solution and then pumped to a sulfur dioxide (SO2)
- air cyanide detoxification circuit. This step reduces residual cyanide, including weak acid dissociable CN species, before discharge.
Oxygen is needed and is provided by aggressively air sparging below radial flow impellers, providing 90 minutes of retention time
in two tanks operating in series. The pH is maintained between pH 8 to 9 with lime, to neutralise acid generated from the chemical
reaction. Copper sulfate is added as a catalyst at an initial dosage to provide 30 mg/L dissolved copper (Cu). Sulfur dioxide is
provided from addition of sodium metabisulfite (Na2S2O5).
The detoxified leach tailings are combined
with flotation tailings and pumped to a 15.2 m (50 ft.) diameter tailings thickener. The underflow is discharged to the TMF (See
Photo 20-1), which is located at an elevation below the thickener. Process water from the tailings thickener overflow and TMF
is reclaimed for use in the plant as required.
The reagent types and dosage are summarised
in Table 17-3. The reagent requirements for the flotation and leach circuits are based on the preliminary mineral processing
and metallurgical test work. Other consumable requirements are based on industry references and vendor information.
Table 17-3 Reagents

| | | 135 |
The flotation collectors and sodium
cyanide will be delivered to site as solids in bags or drums. These reagents will be dissolved in fresh make-up water per manufacturer
specifications and delivered in dedicated reagent distribution systems. Lime will be delivered as bulk quick lime and hydrated
in process water then pumped to the thickener, leach tanks and detox circuit to meet the specified pH requirements.
Average power requirements
for processing are expected to be 1215 kW. Oxygen for leaching and cyanide detoxification will be provided by sparging air, via
blowers, through sparge rings centred under the impellers of each tank. Fresh grinding media will consist of adding 50 mm (2”)
diameter alloy steel grinding balls that are hoisted in a bucket to the mill feed chute. The grinding media consumption used is
0.95 kg per tonne of ore processed.
| | | 136 |
The majority of infrastructure for the
mine will be located in close proximity to the new portal. This includes temporary waste dump, water settling pond, office buildings
(owner and contractor), workshop, first aid room etc. The primary ventilation fans will be located on top of the fresh air raise
for each of the El Compas and El Orito zones, to the northeast of the office buildings. The El Compas site layout plan is shown
in Figure 18-1.

Figure 18-1 El Compas Site Layout
Plan
The La Plata site is already laid out
with the majority of infrastructure required for ongoing processing operations, including office buildings, laboratory building,
security gatehouse, process water dam etc. The La Plata site layout plan is shown in Figure 18-2.
| | | 137 |

Figure 18-2 La Plata Site Layout
Plan
El Compas is located within one kilometre
from paved roads in the southern part of the city of Zacatecas and is accessed by an all-weather gravel road. Access is available
directly to the existing El Compas mine portal and to the quarry where the new portal will be excavated. Minor roadworks will be
required to provide clear and suitable access in and around the new portal site.
The La Plata processing plant and tailings
facility is accessible by paved roads and all-weather gravel roads, approximately 20 kilometres from the El Compas mine site around
the western side of Zacatecas City.
| | | 138 |

Figure 18-3 Road Route from
El Compas to La Plata (Haulage)
Treatment of the El Compas mineralised
material will be performed at the La Plata processing facility located approximately 20 km from the mine. The facility is accessed
via all-weather roads from both the El Compas mine and the nearby city of Zacatecas. The facility includes a mineral processing
plant and related equipment and infrastructure. The facility will be refurbished with some additional infrastructure installed
to satisfy the new process flowsheet. Additional equipment will be mostly in used condition. Further details on the processing
facility infrastructure are included within Section 17.
| 18.4 | Tailings Management Facility |
The Historic TMF at La Plata was constructed
in 2014 by the Zacatecas state government, There is no information as to the standard to which it has been built with respect to
seismic or flood events. The tailings dam was inspected John Michael Collins and Neil Schunke in October 2015 and was observed
to be in reasonable condition with no apparent gullies or physical flaws. According to information supplied by Canarc, it is permitted
and currently has capacity for 1.14 million tonnes of flotation tailings. The TMF is unlined.
The modified process flowsheet will
use a cyanide destruction circuit and blend the leach circuit tailings into the flotation tailings for discharge
into the existing TMF. A modification to the existing permit for the TMF is expected to be required based on the modified
flowsheet.
The tailings dam will be raised in planned
stages periodically over the life of the mine to increase the capacity of the TMF as more tailings are produced.
| | | 139 |
| 18.5 | Buildings and Workshop |
One small core storage building remains
at El Compas, in the vicinity of the planned portal location.
Additional buildings for the El Compas
mine operation will be temporary structures to minimise costs and surface impact. Buildings will be required for the following:
| · | Mine administration (Management, Finance, HSE and Mine Technical) |
| · | Contractor’s personnel (Project Manager, Foreman, Project Engineer, Project Administrator
etc) |
| · | Storage (new mine portal area) |
Sizing for these buildings is based
on intended usage (eg. provision of suitable office space or based on expected storage area requirements).
48 foot sea containers will be utilised
for all buildings, with fitting out suitable for the intended usages.
The La Plata processing facility site
has existing buildings sufficient for operation of the facilities including offices, laboratory and a security gatehouse.
Diesel fuel will be used for all mobile
equipment required for the project. Suitable storage and re-fuelling facilities will be required at the El Compas mine and La Plata
processing facility sites. Estimated fuel requirements for mobile equipment for the mine and processing facility are summarised
in Table 18-1 and Table 18-2 respectively.
Table 18-1 Estimated Diesel
Requirements – El Compas Mine
| Equipment |
Diesel Consumption (L/hr) |
Number |
Availability (%) |
Utilisation (%) |
Diesel Consumed |
| (kL/yr) |
(kL/mth) |
(kL/wk) |
| Loader |
25.5 |
2 |
83% |
70% |
261 |
22 |
5 |
| Truck |
20.0 |
2 |
83% |
50% |
146 |
12 |
3 |
| Jumbo |
18.7 |
1 |
83% |
15% |
20 |
2 |
0 |
| Bolter |
18.7 |
1 |
83% |
15% |
20 |
2 |
0 |
| Production Drill |
12.6 |
1 |
83% |
5% |
5 |
0 |
0 |
| Charge-up Machine |
19.2 |
1 |
83% |
70% |
98 |
8 |
2 |
| LV (Underground) |
7.0 |
3 |
83% |
25% |
38 |
3 |
1 |
| Grader |
25.0 |
1 |
83% |
15% |
27 |
2 |
1 |
| IT Carrier |
29.2 |
1 |
83% |
70% |
149 |
12 |
3 |
| LV (Surface) |
7.0 |
7 |
83% |
70% |
250 |
21 |
5 |
| Contingency |
|
30% |
|
|
305 |
25 |
6 |
| Total |
|
|
|
|
1,321 |
110 |
25 |
| | | 140 |
Table 18-2 Estimated Diesel
Requirements – La Plata Processing Facility
| Equipment |
Diesel Consumption (L/hr) |
Number |
Availability (%) |
Utilisation (%) |
Diesel Consumed |
| (kL/yr) |
(kL/mth) |
(kL/wk) |
| LV (Surface) |
7.0 |
2 |
83% |
70% |
72 |
6 |
1 |
| Contingency |
|
30% |
|
|
21 |
2 |
0 |
| Total |
93 |
8 |
2 |
Diesel fuel will be supplied to a transportable,
self-bunded (“enviro”) storage tank at the El Compas mine (24,600L capacity), and at the La Plata processing facility
(5,000L capacity). These capacities allow for contingency in case of peak fuel requirements. These tanks will have pumps and filling
equipment suitable for the equipment in use at each site.
Diesel fuel is readily available in
Zacatecas City.
Explosives magazine facilities will
be constructed and sited in a suitable location in accordance with Federal Regulations at the El Compas mine site.
Ventilation design and modelling for
the El Compas underground mine has been undertaken to meet Mexican Federal Regulations for underground mines (NORMA Oficial
Mexicana NOM-023-STPS-2012, Minas subterráneas y minas a cielo abierto - Condiciones de seguridad y salud en el trabajo).
The relevant regulations for underground mine ventilation state:
| · | 1.5 m3 per minute of air per person |
| · | 2.13 m3 per minute per every HP of diesel equipment |
| · | Minimum speed of airflow of 15.24 m per minute where operating diesel equipment |
| · | Vent ducting to be provided to within 30 metres of the face |
| · | Compressed air to be provided in case of an emergency, controlled by a valve |
| · | Daily supervision of working areas, to be ventilated for a minimum of 10 minutes before any work
starts at the face |
| · | No recirculation of the air |
| · | No fuel nearby the areas where the fans will be installed. |
The following criteria were used in
determining the ventilation requirements for the El Compas underground mine.
| · | A 0.048 m3 per second per effective kW minimum exhaust dilution air quantity |
| | | 141 |
| · | All regular underground mining equipment used for calculating minimum ventilation airflow (not
including emergency vehicles and other diesel equipment not regularly used underground) |
| · | An engine utilisation factor (%) – representation of machinery usage and time spent UG |
| · | An allowance for contingency (20% of total mine flow) |
| · | An allowance for leakage (15% of total mine flow). |
Initial development of the main ramp
will be undertaken by force ventilation with secondary fans installed in fresh air immediately outside the new portal, delivering
fresh air to the working development faces via ventilation ducting. Exhaust air will leave the mine via the new portal.
As soon as underground development has
advanced sufficiently close to the El Compas and El Orito deposits, ventilation raises will be developed to the surface. On completion,
primary ventilation fans will be installed on top of each raise, forcing fresh air via the raises to each working level. Bulkheads
(with secondary fans installed within them) will be erected in the ventilation drive on each level to enable fresh air supply to
be controlled to where it is required. Exhaust air will leave the mine via the new portal.
The estimated ventilation requirements
for the mine based on the expected diesel fleet are summarised in Table 18-3.
Table 18-3 Estimated Underground
Ventilation Requirements
| Type |
Number |
kW |
Air Required per kW
(m³/s/kW) |
Design Utilization
Factor (Operating under Diesel) |
Design Air Volume (m3/s) |
Air Volume (CFM) |
| Loader |
2 |
150 |
0.048 |
70% |
10.1 |
21,358 |
| Truck |
2 |
368 |
0.048 |
50% |
17.7 |
37,428 |
| Jumbo |
1 |
110 |
0.048 |
15% |
0.8 |
1,678 |
| Bolter |
1 |
110 |
0.048 |
15% |
0.8 |
1,678 |
| Production Drill |
1 |
74 |
0.048 |
5% |
0.2 |
376 |
| Charge-up Machine |
1 |
103 |
0.048 |
70% |
3.5 |
7,333 |
| LV |
3 |
126 |
0.048 |
70% |
12.7 |
26,916 |
| Grader |
1 |
118 |
0.048 |
15% |
0.8 |
1,797 |
| IT Carrier |
1 |
172 |
0.048 |
70% |
5.8 |
12,211 |
| Contingency at 20% |
10.5 |
22,155 |
| Sub-total |
62.7 |
132,932 |
| Plus 15% Leak Factor |
9.4 |
19,940 |
| Total |
72 |
152,871 |
As production from the underground mine
will be phased (ie. initially production will be predominantly sourced from the El Compas deposit and progressively transitioned
across to the El Orito deposit), primary fans will require variable pitch blades. Each primary fan will be required to supply 72m3/s
(peak) and the estimated input power for each fan will be 150kW.
The ventilation raises from surface
will be developed as 2.5m diameter raisebores since this size will provide sufficient surplus ventilation capacity and accommodate
an escape ladderway system and (to a reasonable extent) future potential mine expansions. Internal ventilation raises will be developed
as 1.8 m x 1.8 m square profile alimak raises. The primary fan base structure on top of each raise will feature an escape hatch
as part of the emergency egress system.
| | | 142 |
Secondary ventilation fans will be supplied
by the mining contractor.
Electrical power line and transformer
installations are in place at the El Compas mine area. The line capacity allows for 480V usage with conversion to 120V. This power
supply is currently available for basic dewatering of the underground workings. Modifications will be required to suit supply of
additional power at 480V for regular underground mining activities.
The electricity available at the processing
facility is 2,000kVA.
The mobile equipment and fixed plant
requirements for the El Compas mine, along with estimated utilisation percentages and equipment numbers have been considered for
calculating power usage over the life of mine. Input parameters for the electrical demand calculation are summarised in Table 18-4.
The total site power requirements and usage for each type of mobile equipment, fixed plant or infrastructure are shown in Figure
18-4 and Figure 18-5.
| | | 143 |
Table 18-4 El Compas Mine Electrical
Demand Calculation Inputs
| Equipment |
Inst. Power (kW) |
Util. (%) |
PF (%) |
Quantity in Year |
| 1 |
2 |
3 |
4 |
5 |
6 |
7 |
8 |
| Underground Mobile Plant: |
| Production Drill |
75 |
30% |
95% |
0 |
1 |
1 |
1 |
1 |
1 |
1 |
0 |
| Jumbo Drill |
110 |
17% |
95% |
1 |
1 |
0 |
0 |
1 |
1 |
0 |
0 |
| Bolter |
75 |
20% |
95% |
1 |
1 |
0 |
0 |
1 |
1 |
0 |
0 |
| Compressor |
70 |
50% |
95% |
0 |
1 |
1 |
1 |
1 |
1 |
1 |
1 |
| |
|
|
|
|
|
|
|
|
|
|
|
| Underground Fixed Plant: |
| 10kW Submersible Pump |
10 |
30% |
95% |
0 |
1 |
1 |
2 |
2 |
2 |
2 |
2 |
| 20kW Submersible Pump |
20 |
30% |
95% |
1 |
1 |
1 |
1 |
1 |
1 |
1 |
1 |
| 103 Mono Pump |
91 |
30% |
95% |
0 |
1 |
1 |
1 |
1 |
1 |
1 |
1 |
| |
|
|
|
|
|
|
|
|
|
|
|
| 110kW Secondary Fan |
45 |
80% |
95% |
0 |
4 |
4 |
5 |
5 |
5 |
5 |
5 |
| 200kW Secondary Fan |
200 |
90% |
95% |
1 |
1 |
1 |
1 |
1 |
1 |
1 |
1 |
| |
|
|
|
|
|
|
|
|
|
|
|
| Surface Primary Fans: |
| Primary vent fan 1 - 5400 VAX 2700 - El Compas |
149 |
100% |
95% |
0 |
1 |
1 |
1 |
1 |
1 |
1 |
1 |
| Primary vent fan 2 - 5400 VAX 2700 - El Orito |
149 |
100% |
95% |
0 |
0 |
1 |
1 |
1 |
1 |
1 |
1 |
| |
|
|
|
|
|
|
|
|
|
|
|
| Other Surface Infrastructure: |
| Administration Offices/Ablutions |
50 |
60% |
95% |
1 |
1 |
1 |
1 |
1 |
1 |
1 |
1 |
| Workshop Facilities |
50 |
60% |
95% |
1 |
1 |
1 |
1 |
1 |
1 |
1 |
1 |
| Dam Pumps |
40 |
50% |
95% |
1 |
1 |
1 |
1 |
1 |
1 |
1 |
1 |
| Surface workshop Compressor |
70 |
50% |
95% |
1 |
1 |
1 |
1 |
1 |
1 |
1 |
1 |
| Total Site Installed Power (kW) |
355 |
708 |
796 |
838 |
852 |
845 |
828 |
810 |
| | | 144 |

Figure 18-4 El Compas Power
Requirements Over Life of Mine

Figure 18-5 Site Power Usage
by Equipment/Infrastructure Type
An electrical line diagram for the El
Compas mine site is shown in Figure 18-6.
| | | 145 |

Figure 18-6 El Compas Electrical
Line Diagram
Compressed air will be used for:
| · | Loading explosives into blastholes |
| · | Alimak raise development |
| · | Operation of portable tools |
The majority of mobile mining equipment
that requires compressed air for operation (including drill rigs and charging trucks), are typically equipped with on-board air
compressors meeting their specific compressed air requirements. However, supplementary air will be required to enable air-water
flushing and to complete other tasks in the mine efficiently and as a backup in case of failure of the on-board compressors.
Nominal air pressure to be provided
is 7.5 bar (750 kPa). The volume of compressed air required is determined based on the compressed air volume (litres per second,
L/s) requirements of each item requiring supplementary air.
The total compressed air volume requirement
for the underground mine is 150 L/s and 100L/s for the surface workshop. Table 18-5 outlines the compressed air volume requirements
for the mine, while Table 18-6 outlines compressed air requirements for the surface workshop.
| | | 146 |
Table 18-5 Underground Mine
Compressed Air Requirements
| Mining Equipment / Activity |
Quantity |
Compressed Air Requirement (L/s) |
Utilisation |
Compressed Air Losses (%) |
Total Compressed Air Volume Required (L/s) |
Total Compressed Air Volume Required (CFM) |
| Jumbo face boring/ground support |
1 |
5.8 |
30% |
25% |
2.3 |
4.9 |
| Bolter |
1 |
5.8 |
30% |
25% |
2.3 |
4.9 |
| Production drill |
1 |
5.0 |
30% |
25% |
2.0 |
4.2 |
| Handheld rockdrills |
2 |
73.3 |
30% |
25% |
58.6 |
124.3 |
| Alimak raising |
1 |
50.0 |
30% |
25% |
20.0 |
42.4 |
| ANFO Charger |
1 |
63.7 |
30% |
25% |
25.5 |
54.0 |
| Contingency |
30% |
|
|
|
33.2 |
70.4 |
| Total (Rounded Up) |
150 |
310 |
Table 18-6 Surface Workshop
Compressed Air Requirements
| Mining Equipment / Activity |
Quantity |
Compressed Air Requirement (L/s) |
Utilisation |
Compressed Air Losses (%) |
Total Compressed Air Volume Required (L/s) |
Total Compressed Air Volume Required (CFM) |
| Air tooling (Surface Workshop) |
1 |
175 |
30% |
25% |
70 |
148.3 |
| Contingency |
30% |
|
|
|
21 |
44 |
| Total (Rounded Up) |
100 |
200 |
Mine compressed air systems can be either
centralised or de-centralised. A centralised compressed air system was selected for El Compas and El Orito for simplification of
the system (fewer air compressors and a streamlined compressed air line network).
An Atlas Copco GA110 compressor has
been selected for the underground mine based on the site elevation. This compressor has installed motor power of 110kW and delivers
a maximum working pressure of 9 bar and 230L/s capacity.
An Atlas Copco GA90 compressor has been
selected for the surface workshop based on the site elevation. This compressor has installed motor power of 90kW and delivers a
maximum working pressure of 9 bar and 200L/s capacity.
| | | 147 |
The existing El Compas workings are
currently flooded and numerous east-west faults intersect these workings and the planned development. These workings will therefore
need to be dewatered ahead of the new development advancing sufficiently far to the north and in close proximity to these workings.
Groundwater inflows into the El Compas
mine are understood to be negligible. The mine development design includes sumps on each level which will be connected with drainholes
or have a submersible pump installed to transfer water to a settling dam.
The mining contractor will be responsible
for providing these submersible pumps.
Water supply for the mine will be partially
provided by the water that is currently in the existing workings at El Compas. Additional water will be sourced from the municipal
water supply.
Refuge chambers will be the preferred
place of retreat in the event of fire or any emergency situation involving release of stench gas into the mine intake air.
Portable refuge chamber units will be
positioned in remuck bays off the main ramp at various locations throughout the El Compas and El Orito mines.
To allow for reasonable levels of personnel
fitness and conservatism, refuge chamber separation should be a maximum of 750 m along gradient. Refuge chambers also need to be
able to sustain all personnel that could be reasonably expected to be in the vicinity of the particular refuge chamber in an emergency
situation. Based on the access and main ramp lengths, up to 2 large refuge chambers (12 person capacity) and 1 small refuge chamber
(4 person capacity) will be required for the life of mine. The smaller unit will be located close to the working main ramp face.
Escapeway ladders will be installed
within the fresh air ventilation raise for each of the El Compas and El Orito deposits. Exit manway doors will be required at the
top of each ventilation raise due to the positioning of primary ventilation fans on top of each raise.
Mobile equipment requirements are outlined
in Section 16.5.8.
| | | 148 |
| 19 | Market Studies and Contracts |
The El Compas Project will produce gold
and silver in the form of doré bars containing both metals. The weight of the doré bars and preliminary assays will
be used to calculate gold and silver content and the overall value of each shipment.
Doré bars are readily traded
in the market so there are not expected to be any issues with sale of mine output. There are several internationally recognised
precious metal refineries who are likely to be interested in refining gold and silver from El Compas production.
Transportation and refining charges
have been assigned based on terms for similar doré products in North America.
| · | Transportation US$0.10/oz doré |
| · | Refining US$0.15/oz doré. |
Contracts will be established for mining
activities (including development, production and haulage within the mine) and haulage of material between the mine and processing
facility.
| | | 149 |
| 20 | Environmental Studies, Permitting and Social or Community Impact |
| 20.1 | Environmental and Permitting |
Oro Silver has obtained Environmental
permits from the Mexican government for the development of an underground mine at El Compas and the construction of a 750 tpd leach
plant and tailings facility at the El Compas property. Oro Silver has acquired 12 hectares of land on which to construct these
facilities. The MIA Permit was obtained in September 2014 and the Cambio Uso de Suelo permit was obtained in June 2013. With the
rental of the La Plata processing facility from the Zacatecas government there will be no processing plant and tailings facility
constructed at the El Compas site. Mill feed will be trucked approximately 20 kilometres for processing at the government owned
La Plata processing facility discussed below.
| 20.1.2 | La Plata Processing Facility |
Canarc signed a Letter of Intent with
the Zacatecas government for rental of the idle 500 tpd government processing facility that is located on the outskirts of Zacatecas
for processing the El Compas potentially economic material. The government processing facility is a fully permitted plant and tailings
facility as a 500 tpd crushing, grinding and flotation operation. The operating permit may need to be amended to add a concentrate
leaching circuit and cyanide destruction circuit to the plant.
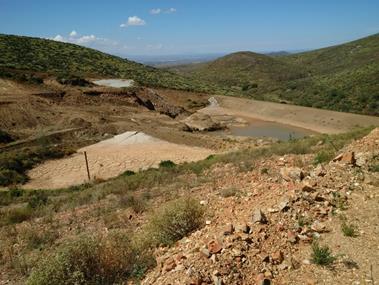
Photo 20-1 View of the Tailings
Impoundment at La Plata
| | | 150 |
| 20.2 | Surface Access – El Compas |
The mineral rights are held by Oro Silver
and the mineral concession is issued by the Mexican government. The surface rights in the area are held by several individuals
and families.
Oro Silver was granted permission
in the past in writing by Mr. de la Torre and others with surface rights in the El Compas and El Orito areas, in order to
carry out surface exploration including drilling. Presently the surface access agreement between Oro Silver and Maricela
Bañuelos Arellano for a 53 hectare plot covering some of the key ground at El Compas, specifically on the Don Luis del
Oro and La Virgen concessions with the exception of a small block for a surface quarry kept out of the agreement. The term of
the surface access contract expires in 2024 and is adequate for surface mining facilities and the proposed underground portal
access.
There is potential for issues arising
from the close proximity of the operations to the urban area of Zacatecas, although open pit and underground mining is currently
taking place within, and very close to Zacatecas and Guadalupe in other operations. The location of the portal will put it facing
south-west into scrub land behind a small hill and limit any noise and surface activity entering the community to the north. Added
trucks related to the project may go through residential areas which are already corridors for quarry related vehicles.
The community is growing southwards
and getting closer to the project area annually. There is a portion of the El Orito Mineral Resource at its extreme northern end
that is below residences.
| | | 151 |
| 21 | Capital and Operating Costs |
Capital and operating cost estimates
for underground mining were prepared by Neil Schunke, P.Eng of MP with the support of Zach Allwright, P.Eng of MP. Mining capital
infrastructure, materials and labour cost estimates are based mostly on vendor quotations and data relevant to the region as obtained
by MP and Canarc, with minor items based on estimates from other relevant mining projects and on a first principles basis. Quotations
were obtained by Canarc from several mining contractors for underground mining activities. There has been no consideration for
price escalations due to inflation.
The capital and operating cost estimate
for the processing facility complex was prepared by Garry Biles, P.Eng of Canarc, with the support of Frank Wright, P.Eng of F.
Wright Consulting. The mill capital cost estimate was based on vendor quotations obtained by Canarc for refurbishment of existing
infrastructure and purchase of mostly used equipment. The capital costs estimate for the TMF and environmental infrastructure was
prepared Garry Biles, P.Eng of Canarc. Milling operating costs are based on expected equipment sizing, vendor quotations for reagents
and other materials and a quotation for power cost from the local power utility.
Capital cost estimates have been scheduled
through the mine life as required according to the mining schedule.
| 21.1 | Capital Cost Estimates |
The total project life of mine capital
requirements are estimated at $11.53 million comprising of $7.65 million and $3.88 million for upfront and sustaining capital expense
respectively. A contingency of 15% was applied to upfront mine capital estimations. Mill Capital estimations have a 12% contingency
applied. Table 21-1 shows a summary of the total project capital costs.
Table 21-1 Capital Cost Summary
| |
Cost US$M |
| |
Upfront Capital Cost |
7.65 |
| |
Sustaining Capital Cost |
3.88 |
| |
|
|
| |
Total |
11.53 |
| |
|
|
The
following items are specifically excluded from the capital cost estimate:
| · | Allowance for escalation in prices; |
| · | Allowance for currency exchange variations (MXN:US$) |
| 21.1.1 | Upfront Capital Costs |
Pre-Steady state is defined as the period
prior to the achievement of continuous mine output at 450 tonnes per day economic mineralised material (mineable inventory). Steady
state is achieved in Q2 Year 2 of the mine schedule. Capital costs incurred during the pre-steady state phase are categorised as
upfront capital costs. Pre-Steady state capital development comprises $1.80M of the upfront capital costs. Table 21-2 provides
a summary of upfront capital costs associated with pre-steady state operation.
| | | 152 |
Table 21-2 Total Upfront Capital
Costs Summary
| Upfront
Capital Costs |
Cost
US$M |
| Mining |
1.97 |
| Processing |
3.88 |
| Pre-Steady State Capital Development |
1.80 |
| |
|
| Total |
7.65 |
Table 21-3 provides a breakdown
of mine upfront capital cost components totalling $1.97 million.
Table 21-3 Mine Upfront Capital
Cost Summary
| Mine Capex Summary |
Cost US$M |
| |
Electrical |
0.48 |
| |
Road Refurbishment |
0.28 |
| |
Portal Establishment |
0.03 |
| |
Compressor(s) |
0.17 |
| |
|
|
| |
Surface Buildings (Sea Containers) |
0.20 |
| |
Security Building |
0.01 |
| |
Powder Mag |
0.04 |
| |
Cap Mag |
0.01 |
| |
Diesel Storage |
0.05 |
| |
Primary Ventilation Fans and Establishment |
0.18 |
| |
Escapeway ladders |
0.02 |
| |
Refuge chambers |
0.14 |
| |
Owner Vehicles |
0.15 |
| |
|
|
| |
Contingency |
0.22 |
| |
|
|
| |
Total (With Contingency) |
1.97 |
| |
|
|
Table 21-4 provides a breakdown of mill capital cost components totalling $3.88 million.
Table 21-4 Mill Upfront Capital
Cost Summary
| Mill Capex Summary |
Cost US$M |
| Gravity Circuit |
0.08 |
| Leaching |
0.31 |
| Pregnant & Barren Solution Tanks |
0.03 |
| Merrill Crowe System |
0.20 |
| Refinery |
0.12 |
| Cyanide Destruction System |
0.11 |
| Detox Slurry Pump |
0.01 |
| Filter Press & Accessories |
0.51 |
| First fills - Supplies - Allocation |
0.10 |
| |
|
| Engineering & Overhead |
0.40
|
| |
|
| Equipment Installation Cost |
0.41 |
| Subtotal (Leach Circuit) |
2.27 |
| |
|
| Processing Plant Refurbishing Costs |
0.78 |
| Assay Lab |
0.43 |
| Subtotal |
3.47 |
| |
|
| Contingency |
0.41 |
| |
|
| Total (With Contingency) |
3.88
|
| | | 153 |
| 21.1.2 | Sustaining Capital Costs |
Project LOM sustaining costs have been
estimated at $3.88M. Table 21-5 provides a summary of sustaining capital costs associated with steady state production.
Table 21-5 Sustaining Capital
Costs Summary
| Sustaining Capital Costs Summary |
Cost US$M |
| |
Mining |
0.85 |
| |
Capital Development |
2.21 |
| |
Processing |
0.50 |
| |
General |
0.32 |
| |
|
|
| |
Total |
3.88
|
| |
|
|
Sustaining capital development costs
of $2.21 million relate to underground capital development advance during steady state production. Processing related sustaining
capital costs of $0.50 million are associated with TMF expansion and maintenance (as per the cost estimate provided by Canarc).
Sustaining capital costs associated with mining activity, with the exception of capital development advance, are presented in Table
21-6.
Table 21-6 Mining Sustaining
Capital Costs
| Mining- Sustaining Capital Costs |
Cost US$M |
| |
Ventilation and Establishment |
0.18 |
| |
Escapeway ladders |
0.05 |
| |
Refuge Chambers |
0.08 |
| |
Prospecting and Exploration |
0.55 |
| |
|
|
| |
Total |
0.85 |
| |
|
|
General sustaining capital costs considers
mine closure capital expense of $0.54M. This cost centre also considers cash received from the sale of relevant property, plant
and equipment (PPE) at residual value.
The capital expense associated with mine closure is anticipated to occur within the same quarter period as PPE sale at residual
value, thus both values have been amalgamated for a total general sustaining value of $0.32M. Table 21-7 presents a breakdown
for the derivation of general sustaining capital cost.
Table 21-7 General Sustaining
Capital Costs Summary
| General- Sustaining Capital Costs |
US$M |
| |
Mine Closure |
0.54 |
| |
Less, Residual Value of Capital Purchases |
0.22 |
| |
|
|
| |
Total |
0.32 |
| |
|
|
| | | 154 |
| 21.2 | Operating Cost Estimates |
Operating costs equate to $60.0 per
tonne milled as shown in Table 21-8. Mining operating activity contributes 53% of operating cost. Milling and G&A contribute
31% and 16% respectively.
Table 21-8 Operating Costs Summary
| Operating Costs Summary |
US$/t Milled |
| |
Mining |
32.0 |
| |
Milling |
18.4 |
| |
G&A |
9.7 |
| |
|
|
| |
Total |
60.0
|
| |
|
|
Note: Minor summation
discrepancies exist due to rounding
Table 21-9 provides a summary of
mining operating unit costs in terms of cost per tonne of material milled. The values presented represent average costs for life
of mine.
Table 21-9 Mining Operating
Unit Costs Summary
| Mining Operating Unit Costs |
US$/t Milled |
| |
Operating Development |
2.0 |
| |
Production (Mineable Inventory) |
14.1 |
| |
Explosives Provision |
1.8 |
| |
Mine Haulage (Mineable Inventory) |
1.9 |
| |
Backfill and Waste Provision |
3.5 |
| |
Crown Zone Surface Works |
0.1 |
| |
TMF Maintenance |
0.1 |
| |
Power |
3.1 |
| |
Water |
0.1 |
| |
Diesel (Owners Fleet) |
0.4 |
| |
Material Haulage to processing facility |
5.0 |
| |
|
|
| |
Total Mining Operating Cost |
32.0 |
| |
|
|
| | | 155 |
Table 21-10 provides a summary of
milling operating unit costs in terms of cost per tonne of material milled.
Table 21-10 Milling Operating
Unit Costs Summary
| Milling Operating Unit Costs |
US$/t Milled |
| |
Labour Component |
5.4 |
| |
Reagent Cost |
4.5 |
| |
Maintenance |
2.8 |
| |
Power |
4.4 |
| |
Other Assay and Consumables Cost |
0.9 |
| |
Transport (Doré) and Refining |
0.3 |
| |
Mill Rental |
0.1 |
| |
|
|
| |
Total Milling Operating Cost |
18.4 |
| |
|
|
Table 21-11 provides a summary
of G&A operating unit costs in terms of cost per tonne of material milled. Underground mining labour associated with contractor
activity is included within the mining operating cost component. Owners labour is presented in the G&A cost centre. Costs
are categorised by department and also consider ancillary costs associated with general maintenance, administrative, software
and legal administration. Community relations and corporate overhead costs for Canarc have not been included in G&A costs.
Table 21-11 G&A Operating
Unit Costs Summary
| G&A Operating Unit Costs |
US$/t Milled |
| |
General Manager |
1.0 |
| |
General & Administration |
2.6 |
| |
Mine Administration |
0.6 |
| |
Mine Technical |
1.7 |
| |
Mill Administration |
0.5 |
| |
Mill Technical |
0.2 |
| |
|
|
| |
Maintenance Costs |
0.4 |
| |
Site Service Costs |
0.4 |
| |
Legal |
0.3 |
| |
Auditing |
0.3 |
| |
Insurance |
0.7 |
| |
Office supplies |
0.2 |
| |
Licences and fees |
0.6 |
| |
Employee travel and other allowances |
0.4 |
| |
|
|
| |
|
|
| |
Total G&A Operating Cost |
9.7 |
| |
|
|
| | | 156 |
Figure 21-1 presents a graphical
breakdown of LOM operating unit costs.

Figure 21-1 Operating Unit Cost
Breakdown
| | | 157 |
This section summarises the economic
analysis completed to support the PEA for El Compas. Neil Schunke P.Eng of MP is the Qualified Person for this section, with inputs
provided by Garry Biles P.Eng of Canarc and Frank Wright, P.Eng of F. Wright Consulting. Project royalty and taxation calculations
were provided by Canarc.
| 22.1 | Valuation Methodology |
The El Compas project has been valued
using a discounted cash flow (DCF) approach. This method of valuation requires projecting quarterly cash inflows, or revenues,
and subtracting quarterly cash outflows such as operating costs, capital costs, royalties and taxes. Cash flows are considered
to occur at the end of each period. The resulting net period cash flows are discounted back to the date of valuation and totalled
to determine net present value (NPV) at the selected discount rates. The internal rate of return (IRR) is calculated based on the
discount rate that yields a zero NPV. The payback period is calculated as the time required to recover initial capital expenditure
for steady state production establishment.
This PEA is preliminary in nature. The
results of the economic analysis performed as a part of this PEA are based in part on inferred Mineral Resources. Inferred Mineral
Resources are considered too speculative geologically to have the economic considerations applied to them that would enable them
to be categorised as mineral reserves, and there is no certainty that the PEA will be realised. All monetary amounts are presented
in US Dollars (US$) unless otherwise noted. Financial results are reported on both post-tax and pre-tax basis where relevant.
The metal prices used in the economic
analysis were provided by Canarc. Prices of gold and silver are based on consensus long-term metal price. Metallurgical recoveries
are based on December 2015 testwork completed by RDI (reported by Tetra Tech Consulting). Payable terms are based on those for
similar products relevant to this region. Table 22-1 shows the key assumptions used in the economic analysis.
Table 22-1 Assumptions Used
in Economic Analysis
| Assumptions Used in Economic Analysis |
| Item |
Unit |
US$ |
Mill Recovery |
Payable |
| Au |
$/Oz |
1,100 |
83.3% |
99.5% |
| Ag |
$/Oz |
14 |
55.3% |
98.0% |
| 22.3 | Processing Plant Feed Throughput |
The underground mining schedule is presented
in Section 16.5 of this report. This section includes the mill feed schedule and metal production (recovered and payable). Life
of mine feed totals 1.1Mt at average Mrec grades of 4.5 g/t AuEq (3.9 g/t Au and 46.3 g/t Ag). Processing plant feed commences
in Q3 Year 1 and continues for 6.75 years until Q1 year 8.
| | | 158 |
Capital and operating cost estimates
are presented in Section 21 of this report. Initial capital is estimated at $7.65 million and sustaining capital is estimated at
$3.88 million. Site operating costs for life of mine total $65.82 million equating to an operating cost of $60.0 per tonne milled.
Capital Costs
A summary of estimated capital costs
can be found in Table 21-1.
Operating Costs
A summary of estimated operating costs
can be found in Table 21-8 for mining, processing, environmental, and G&A.
Royalties and Taxation
Royalty and tax payments are calculated
according to applicable Canadian and Mexican Mining Taxation. For royalty and tax calculations, MP has relied on the expertise
of Phillip Yee, Certified Accountant, CFO, of Canarc.
Table 22-2 provides a summary of
royalties and taxation payable for the El Compas project. A total of $20.82 million is payable over life of mine, comprising $2.07
million in royalties and $18.75 million in taxation. Corporate tax is payable based on taxable income with consideration to deferred
tax credits of $9.86 million to Oro Silver, with total credits amortised over life of mine (maximum tax pool offset of 15% credit
inclusion per annum).
Table 22-2 Taxation and Royalties
| |
Rate (%) |
Assignment |
Payable US$M |
| Royalty- Marlin Gold |
1.5% |
Rate applied to gross gold and silver revenue, less transport and refining operating cost. |
2.07 |
| Tax- Govt Mining Royalty |
7.5% |
Rate applied to earnings before income tax (EBIT). |
5.01 |
| Tax- Govt Environmental Tax |
0.50% |
Rate applied to gross gold and silver revenue. |
0.69 |
| Tax- Corporate Tax |
30.0% |
Rate applied to taxable income after deferred tax loss considerations. |
13.05 |
| |
|
|
|
| Total Royalties Payable |
|
|
2.07 |
| Total Taxes Payable |
|
|
18.75 |
| 22.5 | Indicative Economic Results |
The PEA calculates a Base Case after-tax
NPV of $32.87 million, with an after-tax IRR of 84% using a discount rate of 5%. The total life of mine capital cost of the project
is estimated to total $11.53 million. The payback period for the pre-steady state up-front capital and LOM capital is estimated
at 1.75 years (7 Quarters) and 2.75 years (11 Quarters) respectively. Cash operating costs of $522.8/Oz AuEq and All-In Costs of
$614.3/oz AuEq have been estimated.
Financial model was completed on a quarterly
basis. The base case scenario was modelled with commodity prices $1,100. The detailed cash flow model can be found in Appendix
III.
| | | 159 |
Table 22-3 presents a summary of
economic assessment key metrics.
Table 22-3 Economic Assessment-
Key Metrics
Economic Assessment – Key Metrics
Base Case of $1,100 Oz Gold, $14/ Oz Silver |
Units |
Value |
| Revenue |
|
|
| Gold Revenue |
US$M |
126.09 |
| Silver Revenue |
US$M |
12.40 |
| Total Revenue |
US$M |
138.49 |
| |
|
|
| Operating Cost |
|
|
| Mining |
US$M |
35.08 |
| Milling |
US$M |
20.14 |
| G&A |
US$M |
10.60 |
| Total Operating Cost |
US$M |
65.82 |
| |
|
|
| Capital Cost |
|
|
| Upfront Capital Cost |
US$M |
7.65 |
| Sustaining Capital Cost |
US$M |
3.88 |
| Total Capital Cost |
US$M |
11.53 |
| |
|
|
| Royalties |
|
|
| Total Royalties (Marlin Gold) |
US$M |
2.07 |
| Total Tax Payable |
US$M |
18.75 |
| |
|
|
| Project Net Cashflow (Pre-Tax) |
|
|
| Total Cashflow Before Tax |
US$M |
59.07 |
| NPV 5% |
US$M |
48.32 |
| Internal Rate of Return (IRR) |
% |
102% |
| Payback Period |
Years |
2.25 |
| |
|
|
| Project Net Cashflow (After-Tax) |
|
|
| Total Cashflow After Tax |
US$M |
40.32 |
| NPV 5% |
US$M |
32.87 |
| Internal Rate of Return (IRR) |
% |
84% |
| Payback Period |
Years |
2.75 |
| | | 160 |
The results of the base case sensitivity
and other sensitivity analyses are summarised below. Sensitivity analysis was performed on the base case taking into account variations
in metal price, operating cost, capital cost and discount rate. Base case represents a discount rate of 5% with commodity prices
for gold and silver US$1,100/Oz and US$14/Oz respectively. Table 22-4 shows project metrics based on commodity price variation.
Table 22-4 Sensitivity- Project
Metrics based on Commodity Price Variation
| Sensitivity Analysis |
| Gold price US$/Oz* |
$ 900 |
$ 1,000 |
$ 1,100 |
$ 1,200 |
$ 1,300 |
| Pre-Tax NPV 5% US$M |
$ 27.61 |
$ 37.97 |
$ 48.32 |
$ 58.68 |
$ 69.04 |
| After-Tax NPV 5% US$M |
$ 19.28 |
$ 26.18 |
$ 32.87 |
$ 39.46 |
$ 45.99 |
| Pre-Tax IRR |
67% |
85% |
102% |
118% |
132% |
| After-Tax IRR |
57% |
71% |
84% |
97% |
108% |
* Commodity price variation includes
proportional adjustment of both gold and silver prices.
Project NPV is most sensitive to commodity
price variance in comparison to variances in mine operating cost, capital cost or discount rate. This is a typical result for operation
of this type as variations in metal price have a direct impact on the revenue stream. Table 22-5 provides a summary of project
NPV (After-Tax) sensitivity based on key driver deviations from base case.
Table 22-5 Sensitivity- Project
NPV (After-Tax)
| After-Tax NPV |
| Parameter for Variation |
-20% |
-10% |
Base Case |
10% |
20% |
| Commodity Price |
$18.0 |
$25.5 |
$32.9 |
$40.1 |
$47.3 |
| Mining Operating Cost |
$39.8 |
$36.3 |
$32.9 |
$29.3 |
$25.6 |
| Discount Rate |
$34.2 |
$33.5 |
$32.9 |
$32.2 |
$31.6 |
| Total Capital Cost |
$34.4 |
$33.6 |
$32.9 |
$32.1 |
$31.4 |
| | | 161 |
Project NPV exhibits similar sensitivity
to capital costs and discount rate. This is demonstrated by the close graphical overlay of these parameters in Figure 22-1.

Figure 22-1 NPV Sensitivity
Spider Chart
Table 22-6 and Table 22-7 present
before-tax and after-tax NPV sensitivity to commodity price and discount rate variation.
Table 22-6 Sensitivity- NPV
(Before Tax) based on Discount Rate and Commodity Price Variation
| Commodity Price- Gold (UD$/Oz) |
| Discount Rate (%) |
$900 |
$1,000 |
$1,100 |
$1,200 |
$1,300 |
| 5.0% |
27.6 |
38.0 |
48.3 |
58.7 |
69.0 |
| 6.0% |
26.4 |
36.5 |
46.5 |
56.5 |
66.5 |
| 7.0% |
25.3 |
35.0 |
44.7 |
54.3 |
64.0 |
| 8.0% |
24.3 |
33.6 |
43.0 |
52.3 |
61.7 |
| 9.0% |
23.3 |
32.3 |
41.3 |
50.4 |
59.4 |
| 10.0% |
22.3 |
31.0 |
39.8 |
48.5 |
57.3 |
| | | 162 |
Table 22-7 Sensitivity- NPV
(After Tax) based on Discount Rate and Commodity Price Variation
| Commodity Price- Gold (UD$/Oz) |
| Discount Rate (%) |
$900 |
$1,000 |
$1,100 |
$1,200 |
$1,300 |
| 5.0% |
19.3 |
26.2 |
32.9 |
39.5 |
46.0 |
| 6.0% |
18.4 |
25.1 |
31.6 |
37.9 |
44.2 |
| 7.0% |
17.6 |
24.1 |
30.3 |
36.5 |
42.6 |
| 8.0% |
16.9 |
23.1 |
29.2 |
35.1 |
41.0 |
| 9.0% |
16.2 |
22.2 |
28.0 |
33.8 |
39.5 |
| 10.0% |
15.5 |
21.3 |
26.9 |
32.5 |
38.0 |
| | | 163 |
The region in and surrounding the City
of Zacatecas is built around a multi-century history of mining predominantly for silver. The earliest mining precedes the colonial
Spanish arrival and has resulted in numerous mines, tunnels and holes in the region around Zacatecas. Notwithstanding this long
history MP is not aware of any significant adjacent properties that are surrounding the El Compas Project.
| | | 164 |
| 24 | Other Relevant Data and Information |
There is no further relevant data or
information that MP is aware of.
| | | 165 |
| 25 | Interpretation and Conclusions |
The reader is cautioned that the PEA
is preliminary in nature, and the PEA mine plan and economic model include the use of Inferred Resources that are considered to
be too speculative to be used in an economic analysis, except as allowed for by Canadian Securities Administrator’s National
43-101 (43-101) in PEA studies. Mineral Resources that are not mineral reserves do not have demonstrated economic viability. There
is no certainty that the Resources can be converted to Reserves, and as such, there is no certainty that the results of this PEA
will be realised.
| 25.1 | Exploration Conclusions |
The El Compas Mineral Resource is based
on current drilling and underground channel sampling and constrained with vein models and topographic data. There is opportunity
to refine the near surface Mineral Resource estimate with the use of an accurate LIDAR topographic survey and infill drilling.
The El Compas Mineral Resource has been
reported by mineralised vein system, above defined gold cut-off grades and by Resource category, which is presented in Table 25-1.
The Resource has been depleted for historic mining and therefore is considered in-situ.
Table 25-1 El Compas Mineral
Resource Inventory
Mineral Resource Estimate for the El Compas Deposit
January 14, 2016 |
| Vein |
Cut off Au g/t |
Tonnes |
Au g/t |
Ag g/t |
Au Oz |
Ag Oz |
| Indicated |
| El Compas |
2.0 |
507,000 |
6.7 |
66.7 |
110,000 |
1,087,000 |
| El Orito |
2.0 |
45,000 |
4.3 |
60.5 |
6,000 |
88,000 |
| Total |
|
552,000 |
6.5 |
66.2 |
116,000 |
1,175,000 |
| |
Inferred |
| El Compas |
2.0 |
129,000 |
3.4 |
58.0 |
14,000 |
240,000 |
| El Orito |
2.0 |
292,000 |
4.5 |
60.8 |
42,000 |
571,000 |
| Total |
|
421,000 |
4.2 |
59.9 |
57,000 |
812,000 |
Notes:
| 1. | Mineral Resources estimated as of January 14, 2016. |
| 2. | CIM Definition Standards were followed for the Mineral Resource estimates. |
| 3. | Mineral Resources are estimated using Vulcan software, and have been reported at a 2.0 g/t Au cut-off
grade. |
| 4. | For the purpose of Resource estimation, assays were capped at 75.0 g/t for Au and 700.0 g/t for
Ag. |
| 5. | A bulk density of 2.6 tonnes/m3 has been applied for volume to tonnes conversion. |
| 6. | Resource categories have been applied to the estimation on the basis of drill-hole density, number
of available composites, estimation pass and confidence in the estimation. |
| 7. | A small amount of the Resource has been mined at the top of the El Compas vein and this material
has been removed from the Resource. |
This El Compas project assessment includes
Inferred Resources in the economic analyses. Inferred Resources are considered too speculative geologically to have the economic
considerations applied to them that would enable them to be categorised as Mineral Reserves.
| | | 166 |
The Resource is currently limited at
depth by the extent of drilling and there is potential for expansion of the Resource at depth and along strike to the north on
the El Compas vein and on strike to the south on the El Orito vein.
| 25.2 | Metallurgical Conclusions |
Process testing for the current flowsheet
is preliminary in scope and uncertainties or variation in the design criteria, including metal recovery and related economics may
result, following more detailed laboratory test work. Based on the currently defined Resource, metallurgical testing results and
the existing flotation circuit at the La Plata processing facility, the chosen circuit for treating El Compas potentially economic
material is a gravity and flotation process followed by cyanidation of a flotation concentrate. A gravity step will be installed
prior to the flotation stage. The average head grade of El Compas mill feed is 3.9 g/t gold and 46.3 g/t silver with an overall
recovery of 83.3% for gold and 55.3% for silver. There is some recovery extrapolation for assumed gravity cleaning by tabling,
with table rejects forwarded to flotation, as well as minor assumed losses during precious metal precipitation, washing and doré
production. Precious metal recoveries are based on preliminary laboratory test results for gravity, flotation and leaching. These
recoveries may change with additional recommended testing.
The processing facility will utilise
treated municipal water, through an agreement with Minera Capstone who have operations nearby. There has been no testing
of this water supply undertaken as part of this study.
Canarc has signed a definitive lease
agreement on the La Plata processing facility with the state government of Zacatecas.
The PEA mine plan uses the Inferred
Resources. Confidence in Inferred Resources should be increased prior to mining in these areas by completing infill drilling. An
estimate of infill drilling requirements to convert Inferred Resources to Indicated Resources has been undertaken as part of this
PEA.
The mine plan has been optimised, and
production and development designs completed to a level of detail above that which is usually conducted in a PEA. The efficiency
of mining extraction is maximised by using a combination of transverse and longitudinal stoping for Resource extraction. Transverse
longhole stoping is utilised in the wider zones of the El Compas zone that are greater than 12 metres wide and longitudinal longhole
stoping is utilised in the narrower areas of the El Compas and El Orito zones. The mining sequence has been optimised to target
the extraction of higher grade stope blocks early in the mine life. Incremental tonnes of mineralised material that are below the
cut-off grade, but proximal to planned development work has been added to the production schedule where mining can be demonstrated
to be economically viable. Mining of the crown zone on the El Compas vein relies on the permit approvals and land access agreements
that are not yet in place.
| | | 167 |
The PEA calculates a Base Case after-tax
NPV of $32.87 million with an after-tax IRR of 84% using a discount rate of 5%. The total life of mine capital cost of the project
is estimated to total $11.53 million. The payback period for the pre-steady state up-front capital and LOM capital is estimated
at 1.75 years (7 Quarters) and 2.75 years (11 Quarters) respectively. Cash operating costs of $522.8/Oz AuEq and All-In Costs of
$614.3/oz AuEq have been estimated. Operating costs for life of mine total $65.82 million, equating to an operating cost of $60.0
per tonne milled.
Project highlights and key parameters
and potential economic outcomes from the mining and processing plan considered in this PEA are detailed in Table 25-2.
Table 25-2 PEA Highlights and
Financial Parameters
PEA Highlights
Base Case of $1,100 Oz Gold, $14/ Oz Silver |
Unit |
Value |
| Net Present Value (After Tax 5% Discount Rate) |
US$M |
32.9 |
|
| Internal Rate of Return |
IRR |
84% |
|
| Mill Feed |
Tonnes (t) |
1,097,297 |
|
| Mining Production rate |
t/ year |
164,250 |
|
| LOM Project Operating Period |
Years |
7.25 |
|
| Total Capital Costs |
US$M |
11.5 |
|
| Net After-Tax Cashflow |
US$M |
40.3 |
|
| LOM Gold Production (Payable) |
Oz |
114,624 |
|
| LOM Silver Production (Payable) |
Oz |
885,912 |
|
| Total Operating Unit Costs |
US$/t |
60.0 |
|
| Total Operating Unit Costs |
US$/Oz AuEq |
522.8 |
|
| All-in Unit Costs |
US$/Oz AuEq |
614.3 |
|
Notes:
| 1. | Gold equivalency has been calculated based on a gold price of US$1,100/Oz and a silver price of US$14/Oz,
metallurgical recoveries of 83.3% for gold and 55.3% for silver. The estimates for gold and silver recoveries are based on
flotation and leaching tests conducted at Research Development Inc.’s laboratory, which is located in Colorado, US and
supervised by Tetra Tech, Inc. personnel. |
| 2. | Tonnages are quoted as metric tonnes (t). |
| 3. | Deferred tax credits of US$9.86 million in Oro Silver have been incorporated into tax payable estimation
with total credits amortised over life of mine (maximum tax pool offset of 15% credit inclusion per annum) |
Project NPV is most sensitive to commodity
price variance in comparison to variances in mine operating cost, capital cost or discount rate. Project NPV exhibits similar sensitivity
to capital costs and discount rate. Table 25-3 shows the sensitivity of project metrics to commodity price variations.
| | | 168 |
Table 25-3 Sensitivity- Project
Metrics to Commodity Price Variations
| Sensitivity Analysis |
| Gold price US$/Oz |
$900 |
$1,000 |
$1,100 |
$1,200 |
$1,300 |
| Pre-Tax NPV 5% US$M |
$ 27.61 |
$ 37.97 |
$ 48.32 |
$ 58.68 |
$ 69.04 |
| After-Tax NPV 5% US$M |
$ 19.28 |
$ 26.18 |
$ 32.87 |
$ 39.46 |
$ 45.99 |
| Pre-Tax IRR |
67% |
85% |
102% |
118% |
132% |
| After-Tax IRR |
57% |
71% |
84% |
97% |
108% |
| | | 169 |
The results of this PEA support the
continued advancement of the El Compas project and work related to further technical studies. No production decision has been made
at this time. MP recommends that additional studies are conducted in the following areas prior to making a production decision:
| · | Metallurgical testwork to optimise and finalise the process flowsheet. |
| · | Detailed engineering work to confirm infrastructure requirements including processing facility,
electrical, ventilation, compressed air and dewatering. |
| · | Confirmation of TMF dam construction to current quality standards. |
The following recommendations are made
considering the results of this PEA.
| · | Conduct infill drilling to upgrade Inferred Resources to Indicated Resources. The economic analysis
includes costs for infill drilling to upgrade inferred Mineral Resources to the indicated category that are included within the
PEA mine plan. An estimate has been made of the infill drilling requirements from underground drilling bays and from surface. Some
at El Orito infill drilling can be done from surface for a similar meterage. The estimated infill drilling requirement is: |
| o El Compas | 1,500 m |
| o El Orito | 4,000 m |
| · | A stronger re-assaying, standard failure review and follow up program should be undertaken for
future assay sampling programs (Estimated Budget US$7,000) |
| · | The source data for the bulk density measurements in the database should be located and the values
re-calculated using the standard water immersion technique calculation (Estimated Budget US$3,500) |
| · | Conduct LIDAR topographic survey to confirm surface relative to drillholes and Resource (Estimated
Budget US$22,701) |
| · | Update the Mineral Resource estimate based on re-calculated bulk density data, updated topographic
survey and infill drilling (Estimated Budget US$35,000) |
| · | Confirm hydrogeological investigations and associated drilling to estimate groundwater inflow rates
and confirm standoff distance from water bodies (Estimated Budget US$10,500) |
| · | Geotechnical testwork results for tests conducted at Advanced Terra Testing lab in Golden, Colorado
in late 2012 (including UCS, triaxial compression, direct shear) were not located for this study. Further geotechnical investigations
should be undertaken (including either locating the 2012 testwork results or conducting new laboratory testwork) to determine suitable
stoping dimensions, backfill requirements and ground support requirements (Estimated Budget US$17,500) |
| · | Revise the crown zone design and extraction strategy based on updated topographic survey and Resource
estimate. Infill and grade control drilling in the area of the El Compas crown zone will assist with further improvements to the
Resource model (Estimated Budget US$4,000) |
| · | Seek a modification to the current mining permit to cover the planned extraction and subsequent
remediation of the El Compas crown zone (Estimated Budget US$3,500) |
| · | Conduct detailed engineering on infrastructure requirements (including electrical supply, ventilation,
water supply, dewatering and backfill systems) (Estimated Budget US$25,000) |
| · | Given the current Mineral Resource tonnage identified at El Compas and the fact that froth flotation
equipment is already installed at the La Plata processing facility, this suggests a continued examination of flotation can be performed
in order to evaluate a potential benefit to project economics resulting from the reduction in capital expense requirements. This
can include further investigation into leaching of the flotation concentrate either on site or selling of the concentrate to potential
toll or smelting facilities. Process laboratory testing is estimated to cost US$100,000. Process makeup water supply should also
be tested for suitability and effluent discharge |
| · | Update the processing plant design, refurbishment and addition of new and/or used equipment based
on future modifications to the process flowsheet (Estimated Budget - internal cost) |
| | | 170 |
| · | Confirm that the TMF dam construction meets current quality standards prior to re-activating, including
foundation investigations for future dam raises (US$30,000) |
| · | Seek a modification to the existing permit for the TMF to account for changes as per the updated
process flowsheet (Estimated Budget US$2,000) |
| · | Investigate requirements for any baseline testing required in Zacatecas City to establish base
case conditions (ie. foundation damage) within potential zone of influence of the mining operation (Estimated Budget US$10,000) |
| · | Confirm tax pool usage limitations to refine taxation payable by period and total project economics
(Estimated Budget – internal cost). |
| | | 171 |
Caballero
Martinez, J.A., and I. Rivera Venegas. 1999, Carta Geologico-Minera, Zacatecas F13-B58. Servicios Geologico Mexicano, Secretaria
de Economia. 1:50,000 scale.
Caballero
Martinez, J.A., Isabel Blanco, J., and A. Luevano Pinedo. 1999. Carta Geologico-Minera, Guadalupe F13-B68. Servicios Geologico
Mexicano, Secretaria de Economia. 1:50,000 scale.
Cereceres
Estudio Legal, S.C., 2015. El Compas / Due Diligence Report for Canarc Resource Corp, September 15, 2015.
Corbett,
G., 2004, Epithermal and Porphyry Gold – Geological Models, Pacrim 2004, Adelaide, Australia, Australasian Institute of Mining
and Metallurgy, 2004.
Jutras, M.
and H. Thiboutot, R. De L’Etoile, 2008, Technical report (Amended) on the El Compas Property, October 31, 2008.
Rigby, N.,
J. Volk, D. Bair, R. P. Riley, A. Moran, 2011. NI 43-101 Technical Report on Resources, El Compas Property, SRK Consulting, January
30, 2011.
Sillitoe,
R.H. and J.W. Hedenquist. 2003, Linkages between volcanotectonic settings, ore-fluid compositions, and epithermal precious-metal
deposits. In Volcanic, Geothermal, and oreforming fluids: Rulers and witnesses of processes within the Earth, Simmons, S.F. and
I.Graham, eds. Society of Economic Geologist, Special Publication Number 10, p. 315 –343.
SGS Lakefield
Research Limited, 2007. A Deportment of Study of Gold in High Grade 2 Composite Sample from Mexico. LIMS#MI5020-NOV07, December
18, 2007.
SGS Minerals
Services, 2009. An investigation of Gold and Silver Extraction by Ammonium Thiosulphate Leaching of Low Grade Composite Samples,
November 25, 2009.
Tarnocai,
C. and Thiboutot, H., 2007. Technical Report on the El Compas Property, Zacatecas State, Mexico. For Oro Silver Resources Ltd.,
August 24, 2007, 48p.
Tetra Tech,
2015. El Compas Gold-Silver Mine Zacatecas, Mexico, Metallurgical Test Results by Tetra Tech Golden Colorado dated December 8,
2015, 5p plus 7 Appendices.
http://www.canarc.net
Canarc Resource Corp. website and news releases.
http://www.zacatecas.climatemps.com/.
Wikipedia,
2015. www.en.wikipedia.org/wiki/Zacatecas.
| | | 172 |
Appendix
I
Swathe
Plots for Domains 6 & 7

Gold swathe plot for El Orito veins
(domain 6 &7)

Silver swathe plot for El Orito
veins (domain 6 &7)
| | | 173 |
Appendix
II
Production
Design- Discounted Areas
Three additional
areas were identified for detailed investigation for incremental extension and satellite vein assessment.
| · | El Compas Lower South Extension |
| · | El Compas Satellite South |
| · | El Orito Extension North |
These
areas were assessed and deemed not feasible as an economic contributor to the Mineable Inventory.
Other Areas were easily discounted due
to outcomes of previous detailed design assessments and high level numerical disqualification. Both the El Compas and El Orito
zones present mineralised material below the current mine design. These areas were assessed in detail during the initial stage
of design and interrogations. These areas were found to fall below both the fully costed and incremental cut-off grades once evaluated
with mineable design shapes. These areas also require a substantial amount of capital development relative to the tonnage and ounce
contribution. Due to these economic justifications, the subgrade material at the lower extents of these zones cannot enter the
Mineable Inventory. A pocket of mineralisation in the lower south El Compas was flagged as a potential source of economic ounces
however on further investigation, the low grade nature and low ounces per vertical metre yielded no economically viable metal contribution.
For this reason, this satellite zone was deemed not feasible as an economic contributor to the Mineable Inventory.
El Compas- Lower South Extension
A refined stope design was completed
for the El Compas lower South which represents as an 80m mineralised strike length on the 300 Level to the south of the proposed
level access. This area was deemed marginal during first pass mine planning stages. The results of detailed design and interrogation
yielded 44,000 tonnes @ 1.1 g/t AuEq. The results confirm this block is not an economic contributor to project value and has therefore
been omitted from the Mineable Inventory.

El Compas- Satellite South Assessment
A small lens hosting approximately 69,000
mineralised tonnes (in-situ) is located to the south of the main El Compas zone and is positioned 35m away (laterally) from the
proposed decline design. The satellite area exhibits widths <3m and spans a vertical extent of 140m. Interrogation of this satellite
area with mineable stope design outlines demonstrated that this area does not yield economically viable grades to warrant inclusion
in the Mineable Inventory. The Lens yields and average in-situ grade of 1.4 g/t AuEq. This area would also require substantial
capital development relative to the ounce provisions, rendering this area not economic.
| | | 174 |

El Orito- Inventory Extension Assessment
The northern most mineralised zone of
the El Orito exists in an area of sparse grade distribution characterised by narrow veins. The mineralised block model cells in
this region typically display cells of ~3.0 g/t AuEq, however blocks are generally separated by waste, resulting in mineable stope
grades returning sub-economic results. In order to determine the economic viability of the El Orito extension to the north, stope
and development designs were completed and interrogated. The results of the El Orito North Extension interrogation are presented
below.
| |
In-situ Resource |
| Mrec Tonnes |
79,040 |
| Mrec AuEq (g/t) |
1.2 |
The figure below clearly identifies
the El Orito North Extension as sub-economic. The dominant light blue colour of the El Orito North identifies that the majority
of this region is below the incremental cut-off grade and therefore does not make a positive cash flow contribution to the project.
| | | 175 |

| | | 176 |
Appendix
III
Canarc
- El Compas Project- Discounted Cashflow Model

| | | 177 |

| | | 178 |

| | | 179 |

| | | 180 |
Canarc
- El Compas Project- Sensitivity Tables (After-Tax)

| | | 181 |

| | | 182 |


| | | 183 |
Canarc
- El Compas Project- Sensitivity Tables (Before-Tax)

| | | 184 |

| | | 185 |
CONSENT of QUALIFIED PERSON
| TO: | British Columbia Securities Commission |
Alberta Securities Commission
Securities Division, Financial
and Consumer Affairs Authority (Saskatchewan)
Ontario Securities Commission
Nova Scotia Securities Commission
Toronto Stock Exchange
I, Lisa Bascombe, MAIG, of Mining Plus Pty
Ltd, Bravo building, 1 George Wiencke Drive, Perth, Western Australia, consent to the public filing of the technical report titled
“Canarc Resource Corp., NI 43-101 Technical Report for the El Compas Project, Zacatecas State, Mexico” with effective
date January 19th, 2016 (the “Technical Report”) by Canarc Resource Corp.
I also consent to any extracts from or a summary
of the Technical Report in the news releases dated January 14th and 19th, 2016 of Canarc Resource Corp.
I certify that I have read the news releases
dated January 14th and 19th, 2016 filed by Canarc Resource Corp. and that it fairly and accurately represents
the information in the sections of the technical report for which I am responsible.
Dated this February 5th, 2016.
Lisa Bascombe (Signed)
________________________
Signature of Qualified Person
Lisa Bascombe
________________________
Print name of Qualified Person
CONSENT of QUALIFIED PERSON
| TO: | British Columbia Securities Commission |
Alberta Securities Commission
Securities Division, Financial
and Consumer Affairs Authority (Saskatchewan)
Ontario Securities Commission
Nova Scotia Securities Commission
Toronto Stock Exchange
I, Sean Butler, P.Geo., of Mining Plus Canada
Consulting Ltd, Suite 440 - 580 Hornby Street, Vancouver BC V6C 3B6, consent to the public filing of the technical report titled
“Canarc Resource Corp., NI 43-101 Technical Report for the El Compas Project, Zacatecas State, Mexico” with effective
date January 19th, 2016 (the “Technical Report”) by Canarc Resource Corp.
I also consent to any extracts from or a summary
of the Technical Report in the news releases dated January 14th and 19th, 2016 of Canarc Resource Corp.
I certify that I have read the news releases
dated January 14th and 19th, 2016 filed by Canarc Resource Corp. and that it fairly and accurately represents
the information in the sections of the technical report for which I am responsible.
Dated this February 5th, 2016.
Sean Butler (Signed)
________________________
Signature of Qualified Person
Sean Butler
________________________
Print name of Qualified Person
CONSENT of QUALIFIED PERSON
| TO: | British Columbia Securities Commission |
Alberta Securities Commission
Securities Division, Financial
and Consumer Affairs Authority (Saskatchewan)
Ontario Securities Commission
Nova Scotia Securities Commission
Toronto Stock Exchange
I, John Michael Collins, P.Geo., of Mining
Plus Canada Consulting Ltd, Suite 440 - 580 Hornby Street, Vancouver BC V6C 3B6, consent to the public filing of the technical
report titled “Canarc Resource Corp., NI 43-101 Technical Report for the El Compas Project, Zacatecas State, Mexico”
with effective date January 19th, 2016 (the “Technical Report”) by Canarc Resource Corp.
I also consent to any extracts from or a summary
of the Technical Report in the news releases dated January 14th and 19th, 2016 of Canarc Resource Corp.
I certify that I have read the news releases
dated January 14th and 19th, 2016 filed by Canarc Resource Corp. and that it fairly and accurately represents
the information in the sections of the technical report for which I am responsible.
Dated this February 5th, 2016.
John Michael Collins (Signed)
________________________
Signature of Qualified Person
John Michael Collins
________________________
Print name of Qualified Person
CONSENT of QUALIFIED PERSON
| TO: | British Columbia Securities Commission |
Alberta Securities Commission
Securities Division, Financial
and Consumer Affairs Authority (Saskatchewan)
Ontario Securities Commission
Nova Scotia Securities Commission
Toronto Stock Exchange
I, Neil Schunke, MAusIMM (CP Mining), P.Eng.,
of Mining Plus Canada Consulting Ltd, Suite 440 - 580 Hornby Street, Vancouver BC V6C 3B6, consent to the public filing of the
technical report titled “Canarc Resource Corp., NI 43-101 Technical Report for the El Compas Project, Zacatecas State, Mexico”
with effective date January 19th, 2016 (the “Technical Report”) by Canarc Resource Corp.
I also consent to any extracts from or a summary
of the Technical Report in the news releases dated January 14th and 19th, 2016 of Canarc Resource Corp.
I certify that I have read the news releases
dated January 14th and 19th, 2016 filed by Canarc Resource Corp. and that it fairly and accurately represents
the information in the sections of the technical report for which I am responsible.
Dated this February 5th, 2016.
Neil Schunke (Signed)
________________________
Signature of Qualified Person
Neil Schunke
________________________
Print name of Qualified Person
CONSENT of QUALIFIED PERSON
| TO: | British Columbia Securities Commission |
Alberta Securities Commission
Securities Division, Financial
and Consumer Affairs Authority (Saskatchewan)
Ontario Securities Commission
Nova Scotia Securities Commission
Toronto Stock Exchange
I, Frank Wright, P.Eng., of F. Wright Consulting,
#45-10605 Delsom Cres., Delta, British Columbia, Canada, consent to the public filing of the technical report titled “Canarc
Resource Corp., NI 43-101 Technical Report for the El Compas Project, Zacatecas State, Mexico” with effective date January
19th, 2016 (the “Technical Report”) by Canarc Resource Corp.
I also consent to any extracts from or a summary
of the Technical Report in the news release dated January 19th, 2016 of Canarc Resource Corp.
I certify that I have read the news release
dated January 19th, 2016 filed by Canarc Resource Corp. and that it fairly and accurately represents the information
in the sections of the technical report for which I am responsible.
Dated this February 5th, 2016.
Frank Wright (Signed)
________________________
Signature of Qualified Person
Frank Wright
________________________
Print name of Qualified Person
Canagold Resources (QB) (USOTC:CRCUF)
Historical Stock Chart
From Apr 2024 to May 2024
 Charts.")
Canagold Resources (QB) (USOTC:CRCUF)
Historical Stock Chart
From May 2023 to May 2024
 Charts.")