 Saving Grace
2 days ago
Saving Grace
2 days ago
Hycroft Mine Expansion Project, Nevada Construction Started December-2018
Hycroft Mining (formerly Allied Nevada Gold) is undertaking an expansion of its Hycroft gold mine located in Nevada, US.
The Hycroft mine is among the world’s largest gold and silver deposits with a low-capital and low-cost process. It is expected to produce 366,000oz of gold a year through an estimated mine life of 34 years, following the expansion.
Feasibility study for the two-phase expansion project was completed in 2014 and phase one construction works began in December 2018. Mining operations at the site began in April 2019, while production was achieved in August the same year.
The expansion project currently employs 120 people supported by contractors and temporary workers.
Hycroft mine background details
Mining at Hycroft initially began in 1983 and production started at the Brimstone oxide open-pit mine in 1987. The mining operations stalled in December 1998 due to low gold prices.
“This expansion involves reopening of the Brimstone oxide open-pit mine, which has been under care and maintenance since 1998.”
The first phase of the expansion tested the commercial scope of proprietary oxidation and heap leach process for sulphide ores.
Hycroft mine location, geology, and mineralisation
Hycroft mine is situated 88km west of Winnemucca, in Humboldt and Pershing Counties of Northern Nevada. It is positioned on the western flank of the Kamma Mountains and eastern edge of the Black Rock Desert.
The project is located close to the Scossa Gold Property and is accessible through Nevada State Route 49.
Hycroft is an epithermal, low-sulphidation, hot springs deposit lying in six major zones known as Bay, Brimstone, Boneyard, Camel, Central, and Vortex.
The project mineralisation consists of deposits from an early silica sulphide flooding situated typically along the bedding, which is cross-cut by alunite veins. The Vortex zone and Central area comprise late-stage silver-bearing veins.
Hycroft gold mine reserves
The Hycroft mine is estimated to contain proven and probable mineral reserves of 12 million ounces (Moz) of gold and 481Moz of silver.
The mine is expected to contain 231,000oz of gold and 10.1Moz of silver.
Mining and processing at the Hycroft mine expansion project
An open-pit mining method, followed by heap leaching of ore, will be conducted at the Hycroft gold mine expansion project.
The mine plan anticipates production of 151 million tons (Mt) in between 2017 to 2020, which will be further increased to 202Mt in 2021. The mine is expected to reach maximum production between 2021 and 2024, with an annual production rate of 202Mt, exploiting Brimstone and Vortex pits.
The mining fleet currently comprises two wire rope shovels, three hydraulic shovels, and 33 units of 320t haul trucks along with ancillary equipment. Other equipment required will include 15 320t haul trucks and two additional electric rope shovels.
Ore is transported to the heap leach pads as run-of-mine (ROM) and crushed before undergoing cyanide leaching.
The precipitate from the heap leach pads is dried and smelted on-site to produce doré. The carbon-in-column (CIC) method is also used for processing, in which the loaded carbon from the plant is transported offsite for processing.
Infrastructure at the Hycroft mine
The existing infrastructure at the Hycroft site includes two Merrill-Crowe processing plants, administrative buildings, mobile equipment maintenance shops, a refinery, and heap leach pads.
All power required for the project is supplied through a 345kV power transmission line with substations.
The site receives water supply from a well field situated west of the mine as well as from mine dewatering activities.
Tailings generated by the project will be stored at the tailing management facility (TMF).
Contractors involved
Technical report and feasibility study for the Hycroft gold and silver mine was prepared by M3 in association with Allied Nevada Gold, while SRK Consulting performed resource modelling.
Hanlon Engineering and Architecture designed a maintenance facility, while Battle Born Ventures provided surveying and construction staking services for the same.
NV Energy constructed the transmission line and substation, while HDR Engineering provided engineering services for the water supply system as part of the preliminary environmental assessment (PEA).
Mountain States Contracting provided design and cost for the rail siding. Golder Associates prepared preliminary engineering design and capital and operating cost estimates for the new heap leach pads and the tailing management facility.
ALS Minerals conducted assays of exploration drilling and sampling material, while American Assay Laboratories conducted assay testing of sulphide materials.
Call & Nicholas conducted geomechanical analyses and determined pit slope angles, while Inspectorate America conducted assays of exploration drilling and sampling material for the elements.
Kappes Cassidy & Associates, Hazen Research, G&T Metallurgical Services, and SGS Lakefield performed bench scale rougher flotation tests, while McClelland Laboratories performed column leach tests.
https://www.mining-technology.com/projects/hycroft-mine-expansion-project-nevada/?cf-view&cf-closed
Hycroft Appoints Diane R. Garrett, Ph.D. As President, CEO & Director DENVER, Aug. 31, 2020 /PRNewswire/ -- Hycroft Mining Holding Corporation (Nasdaq: HYMC) ("Hycroft" or the "Company"), a gold and silver producer operating the Hycroft mine in the world-class mining region of Northern Nevada, today announced the appointment of Dr. Diane R. Garrett, Ph.D. as the Company's President & Chief Executive Officer, effective September 8, 2020. Dr. Garrett will also join the Company's Board of Directors on that same date.
Dr. Garrett has over 20 years of senior executive management experience in the mining industry and an exceptional track record for developing projects and building companies. Dr. Garrett was President, CEO and Director of Romarco Minerals Inc. where she built and led the team that developed the multi-million ounce Haile Gold Mine from discovery through to final feasibility, permitting and construction. Romarco was subsequently acquired by OceanaGold in 2015 and Dr. Garrett was appointed to the Board of OceanaGold and a member of the Steering Committee for the Haile Gold Mine. Dr. Garrett was most recently the President and Chief Executive Officer of Nickel Creek Platinum Corp. (NCP), a mining exploration and development company, since June 2016. Dr. Garrett is also a Director of NovaGold Resources Inc., a gold company listed on the NYSE American and Toronto Stock Exchange. Prior to her time at Romarco, Dr. Garrett held numerous senior positions in public mining companies including VP of Corporate Development at Dayton Mining Corporation and VP of Corporate Development at Beartooth Platinum Corporation. Early in her career, Dr. Garrett was the Senior Mining Analyst and Portfolio Manager in the precious metals sector with US Global Investors. Dr. Garrett has also served as a director of TriStar Gold, Inc. and Revival Gold Inc. Dr. Garrett received her Ph.D. in Engineering and her Masters in Mineral Economics from the University of Texas at Austin.
David Kirsch, Chairman of the Company's Board of Directors, said "on behalf of Hycroft and its Directors, I want to welcome Diane to the Company. The board believes that her significant experience in permitting, developing and constructing gold mines, moving a precious-metals mining company from the development stage to the successful producer stage and her experience as a seasoned mining executive, all position her to lead our Company towards its next chapter."
"I'm excited to join Hycroft Mining. I appreciate the hard work carried out by current management and the Board that brought the Company to this point and I look forward to working with them to continue unlocking the value of this unique and significant mineral endowment," said Dr. Garrett.
Effective upon Dr. Garrett's appointment as President & CEO, and Director, on September 8, 2020, Mr. Stephen M. Jones will step down from his position as Interim President and Chief Executive Officer, a role he has held since July 1, 2020.
"I want to sincerely thank Steve for his many years of hard work and dedication to our business. Steve was instrumental in getting our deal done to acquire the Hycroft Mine and has been a leader that our team has relied upon for years," said Mr. Kirsch.
Mr. Jones stated, "I have greatly enjoyed my many years at Hycroft and the dedicated team that I have worked with. I am proud of all we accomplished together and look forward to seeing the future of Hycroft with Dr. Garrett at the helm."
https://www.prnewswire.com/news-releases/hycroft-appoints-diane-r-garrett-phd-as-president-ceo--director-301120943.html
Dr. Garrett's appointment as President & CEO, and Director, on September 8, 2020. Dr. Garrett then began to fire dead weight employee trouble makers who bash and lie about progress expansion and Mine rebuild. Since then, Alex Davidson was hired to oversee massive drilling operation, to pin point massive Gold and Silver targets.
Underground Mine and would be restart, per filing April 3
Just like I have posted.
WINNEMUCCA, NV, April 3, 2024 – Hycroft Mining Holding Corporation (Nasdaq: HYMC) (“Hycroft” or “the Company”) is pleased to provide an
update for the ongoing 2024 exploration drill program.
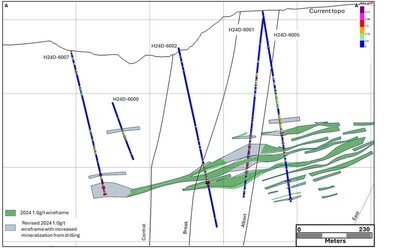
The 2024 Brimstone and Vortex drilling is well underway with assays pending on the initial drill holes. This 10-hole program, launched in February 2024, is
targeting the two high-grade underground silver trends discovered in November 2023 (see news release dated November 16, 2023 “Hycroft Drills Best Hole
Ever - Discovers New High-Grade Silver System”). Due to the exciting results achieved, this drill program was launched in February 2024 and will continue
through May 2024 with flexibility to expand the program. The drilling is targeting confirmation of the continuity of the high-grade silver mineralization
between the Vortex-Brimstone trend and the Vortex-Camel trend, expanding both trends along strike and at depth, and enhancing our understanding of
structural controls.
Alex Davidson, Vice President, Exploration, commented “The paradigm is shifting with our understanding of what is controlling the high-grade mineralization
within the expansive Hycroft system. This new understanding of low-angle structural controls has far-reaching implications for the broader district-scale
targets, as well as the high-grade silver discoveries. This has been confirmed through drill data and recent geophysics. This work supports the idea of a
potential underground starter mine at Hycroft, which would contribute to more robust economics and lower initial capital costs generating better value for our
shareholders.”
Mr. Davidson also commented: “The Vortex-Brimstone trend is a series of well-defined high-grade veins that remains open in both directions and at depth. The
Vortex-Camel trend is a structurally controlled system that has become more apparent as we continue our work that also remains open in both directions and at
depth.”
Diane R. Garrett, President and CEO stated: “The exploration and on-going technical work at Hycroft is solidifying our belief that the potential of this asset has
yet to be fully understood. Through our work and on-going communications and marketing to the investing public, our story is resonating positively and we are
pleased to see that reflected in the recent performance of our share price.
“Not only does our team continue to deliver incredibly strong exploration results, fueling this project forward, but they also continue to demonstrate a
commitment to health and safety at site continuing to maintain a 0.00 TRIFR
Tweet Share On Facebook
Drilling extends Vortex west ~100 meters
Multiple intervals exceeding 1000 g/t silver
Significant gold intercepts being encountered
WINNEMUCCA, Nev., Oct. 3, 2024 /PRNewswire/ -- Hycroft Mining Holding Corporation (Nasdaq: HYMC) ("Hycroft" or "the Company") announces additional drill results from the 2024 exploration drill program (the "Drill Program") at the Hycroft Mine, located in Nevada, a Tier-1 mining jurisdiction.
Webinar
HYMC, Next Target, The Moon!
https://www.otcmarkets.com/filing/conv_pdf?id=17425150&guid=p9Q-kn8hn_NeJth
Hycroft Mine CEO Dr. Diane Garrett
https://packaged-media.redd.it/ia8klgvnrazc1/pb/m2-res_480p.mp4?m=DASHPlaylist.mpd&v=1&e=1715547600&s=5c5e26ce97c0a9e8876d9370e7fcd9b22683ea16#t=0
Saving Grace
4 weeks ago
Hycroft Mine Expansion Project, Nevada prior to Diane Garrett joining HYMC as CEO. Hycroft Mining performed infrastructure upgrades including but not limited too, the existing infrastructure at the Hycroft site which includes two Merrill-Crowe processing plants, administrative buildings, mobile equipment maintenance shops, a refinery, and heap leach pads.
All power required for the project is supplied through a 345kV power transmission line with substations.
The site receives water supply from a well field situated west of the mine as well as from mine dewatering activities.
Tailings generated by the project will be stored at the tailing management facility (TMF).
Contractors involved
Hycroft Mining (formerly Allied Nevada Gold) is undertaking an expansion of its Hycroft mine located in Nevada, US.
The Hycroft mine is among the world’s largest gold and silver deposits with a low-capital and low-cost process. It is expected to produce 366,000oz of gold a year through an estimated mine life of 34 years, following the expansion.
Feasibility study for the two-phase expansion project was completed in 2014 and phase one construction works began in December 2018. Mining operations at the site began in April 2019, while production was achieved in August the same year.
The expansion project currently employs 120 people supported by contractors and temporary workers.
Hycroft mine background details
Mining at Hycroft initially began in 1983 and production started at the Brimstone oxide open-pit mine in 1987. The mining operations stalled in December 1998 due to low gold prices.
“This expansion involves reopening of the Brimstone oxide open-pit mine, which has been under care and maintenance since 1998.”
The first phase of the expansion tested the commercial scope of proprietary oxidation and heap leach process for sulphide ores.
Hycroft mine location, geology, and mineralisation
Hycroft mine is situated 88km west of Winnemucca, in Humboldt and Pershing Counties of Northern Nevada. It is positioned on the western flank of the Kamma Mountains and eastern edge of the Black Rock Desert.
The project is located close to the Scossa Gold Property and is accessible through Nevada State Route 49.
Hycroft is an epithermal, low-sulphidation, hot springs deposit lying in six major zones known as Bay, Brimstone, Boneyard, Camel, Central, and Vortex.
The project mineralisation consists of deposits from an early silica sulphide flooding situated typically along the bedding, which is cross-cut by alunite veins. The Vortex zone and Central area comprise late-stage silver-bearing veins.
Hycroft gold mine reserves
The Hycroft mine is estimated to contain proven and probable mineral reserves of 12 million ounces (Moz) of gold and 481Moz of silver.
The mine is expected to contain 231,000oz of gold and 10.1Moz of silver.
Mining and processing at the Hycroft mine expansion project
An open-pit mining method, followed by heap leaching of ore, will be conducted at the Hycroft gold mine expansion project.
The mine plan anticipates production of 151 million tons (Mt) in between 2017 to 2020, which will be further increased to 202Mt in 2021. The mine is expected to reach maximum production between 2021 and 2024, with an annual production rate of 202Mt, exploiting Brimstone and Vortex pits.
The mining fleet currently comprises two wire rope shovels, three hydraulic shovels, and 33 units of 320t haul trucks along with ancillary equipment. Other equipment required will include 15 320t haul trucks and two additional electric rope shovels.
Ore is transported to the heap leach pads as run-of-mine (ROM) and crushed before undergoing cyanide leaching.
The precipitate from the heap leach pads is dried and smelted on-site to produce doré. The carbon-in-column (CIC) method is also used for processing, in which the loaded carbon from the plant is transported offsite for processing.
Infrastructure at the Hycroft mine
The existing infrastructure at the Hycroft site includes two Merrill-Crowe processing plants, administrative buildings, mobile equipment maintenance shops, a refinery, and heap leach pads.
All power required for the project is supplied through a 345kV power transmission line with substations.
The site receives water supply from a well field situated west of the mine as well as from mine dewatering activities.
Tailings generated by the project will be stored at the tailing management facility (TMF).
Contractors involved
Technical report and feasibility study for the Hycroft gold and silver mine was prepared by M3 in association with Allied Nevada Gold, while SRK Consulting performed resource modelling.
Hanlon Engineering and Architecture designed a maintenance facility, while Battle Born Ventures provided surveying and construction staking services for the same.
NV Energy constructed the transmission line and substation, while HDR Engineering provided engineering services for the water supply system as part of the preliminary environmental assessment (PEA).
Mountain States Contracting provided design and cost for the rail siding. Golder Associates prepared preliminary engineering design and capital and operating cost estimates for the new heap leach pads and the tailing management facility.
ALS Minerals conducted assays of exploration drilling and sampling material, while American Assay Laboratories conducted assay testing of sulphide materials.
Call & Nicholas conducted geomechanical analyses and determined pit slope angles, while Inspectorate America conducted assays of exploration drilling and sampling material for the elements.
Kappes Cassidy & Associates, Hazen Research, G&T Metallurgical Services, and SGS Lakefield performed bench scale rougher flotation tests, while McClelland Laboratories performed column leach tests.
CEO Diane Garrett began the phase II drill program with exceptional results that changed the scope of the project to include an underground startup Mine, increasing mine life beyond 40yrs and growing.
Deposit Quantities have now increased significantly from 2020 expectations with the drill program results with the best hole ever recorded, twice. Millionaires will be made with Hycroft Mining.
Hycroft Mine CEO Dr. Diane Garrett
https://packaged-media.redd.it/ia8klgvnrazc1/pb/m2-res_480p.mp4?m=DASHPlaylist.mpd&v=1&e=1715547600&s=5c5e26ce97c0a9e8876d9370e7fcd9b22683ea16#t=0
Oleblue
2 months ago
Hycroft Once Again Drills Best Hole Ever
21.2 meters of 2,359.68 g/t silver
Multiple intervals exceeding 6,000 g/t silver
WINNEMUCCA, NV, January 14, 2025 – Hycroft Mining Holding Corporation (Nasdaq: HYMC) (“Hycroft” or “the Company”) announces additional drill results from the 2024 exploration drill program (the "Drill Program") at the Hycroft Mine, located in Nevada, a Tier-1 mining jurisdiction.
Highlights from the drilling include:
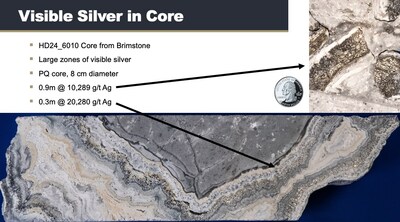
Hole H24D-6018 was drilled to the southeast approximately 60 meters from Hole H24D-6010 designed to test the extension of Brimstone up-dip
Robust drill results continue to confirm continuity of Brimstone high-grade silver dominant trend, extending mineralization along strike and up-dip
See Table 1 for additional information
Brimstone drill highlights:
H24D-6018: 21.2 meters of 2,359.68 g/t Ag and 0.38 g/t Au (30.81 g/t AuEq) Including:
7.3 meters of 6,278.23 g/t Ag and 0.59 g/t Au (81.55 g/t AuEq)
including 0.2 meters of 80,017.00 g/t Ag and 1.62 g/t Au (1,033.42 g/t AuEq)
Alex Davidson, Vice President, Exploration commented: “Hole 6018 topped Hole 5753 as the best hole ever drilled at Hycroft in its more than 40-year history. The results from this Brimstone hole firmly establish high-grade continuity up-dip approximately 60 meters from Hole 6010, reported October 16, 2024. Our strategy of using a multi-disciplined approach, utilizing geochemical, structural, assay, and geophysical data collected from this year for exploration is paying off as we continue to define the geometry of Brimstone. The presence of coarse grain argentotetrahedrite and chalcopyrite crystals and aligned geochemistry from the high-grade zone suggests that Brimstone is derived from and more proximal to a magmatic source as previously mentioned in the October 16, 2024, news release. This is important because it is a significant shift from what the Hycroft deposit has been previously described as - a low sulfidation system. We are continuing to gain a clearer picture of the substantial opportunities for high-grade mineralization in the significantly under-explored Hycroft system”.
Diane R. Garrett, President and CEO commented: “As we have said before – Hycroft is an untold story and the drill results to date confirm that. Hycroft was always considered a large low-grade system but the two high-grade silver dominant trend discoveries over the past year are dispelling that view. In addition to the excellent performance by our exploration team, the final metallurgical test work for the engineering study is progressing positively. Congratulations to the entire Hycroft team for concluding another year maintaining a TRIFR (total reportable injury frequency rate) of 0.00 and achieving more than 1,500 days of no lost-time-incidents (“LTI’s”)”.
Exploration Drill Program
The Drill Program was designed to improve continuity within the recently discovered high-grade silver trends (Vortex and Brimstone), extend mineralization along strike and at depth, and test new exhibiting potential for high-grade within and outside the currently known resource. Through this work, the Company hopes to develop opportunities to mine higher-grade ore early in the mine plan, thereby enhancing project economics. The Drill Program completed 9,058 meters of core drilling. The drilling is being conducted by Timberline Drilling Incorporated of Elko, NV. Assays are being completed by ALS Geochemistry of Reno, NV. The Company's Qualified Person is Alex Davidson, Vice President, Exploration.
Corporate Update
The Company has concluded the 2024 exploration drill program completing 9,058 meters of core drilling. Additional assays are pending. The program was hugely successful in continuing to expand the two-silver dominant high-grade trends at both Brimstone and Vortex. The technical team is assimilating the drill data, geophysics, mapping and surface samples to further enhance its new and evolving understanding of the Hycroft system and select prospective targets for a future drill program. The Company ended 2024 with approximately $49.6 million in unrestricted cash and remains in compliance with its debt covenants.
About Hycroft Mining Holding Corporation
Hycroft Mining Holding Corporation is a US-based gold and silver company developing the Hycroft Mine, among the world's largest precious metals deposits located in northern Nevada, a Tier-One mining jurisdiction. After a long history of oxide heap leaching operations, the Company is focused on completing the technical studies to transition the Hycroft Mine into the next phase of commercial operations for processing the sulfide ore. In addition, the Company is engaged in a robust exploration drill program to further expand the newly discovered high-grade dominant silver systems and unlock the full potential of this worldclass asset.
For further information, please contact:
info@hycroftmining.com
www.hycroftmining.com
Cautionary Note Regarding Forward-Looking Statements
This news release may contain "forward-looking statements" within the meaning of Section 27A of the Securities Act of 1933, as amended, and Section 21E of the Securities Exchange Act of 1934, as amended, which are intended to be covered by the safe harbor created by such sections and other applicable laws. Such forward-looking statements may include, without limitation, estimates and expectations of future production, reserve estimates, exploration outlook and expected expenditure, and operational and financial performance. The exploration target does not represent, and should not be construed to be, an estimate of a mineral resource or mineral reserve, as ranges of potential tonnage and grade (or quality) of the exploration target are conceptual in nature; there has been insufficient exploration of the relevant property or properties to estimate a mineral resource; and it is uncertain if further exploration will result in the estimation of a mineral resource. Where the Company expresses or implies an expectation or belief as to future events or results, such expectation or belief is expressed in good faith and believed to have a reasonable basis. However, such statements are subject to risks, uncertainties, assumptions and other factors, which could cause actual results to differ materially from future results expressed or implied by the "forward-looking statements". Such assumptions, include, but are not limited to the key assumptions set forth on page 4 hereof. Investors are also encouraged to refer to the Company's Form 10-K for its fiscal year 2023, filed with the SEC on March 14, 2024 , as updated by Form 10-Q for the quarterly periods ended March 31, 2024, June 30, 2024, and September 30, 2024 filed with the SEC on May 7, 2024, August 6, 2024, and November 5, 2024, respectively, as well as Hycroft's other SEC filings for additional information. The Company does not undertake any obligation to release publicly revisions to any "forward-looking statement," including, without limitation, outlook, to reflect events or circumstances after the date of this news release, or to reflect the occurrence of unanticipated events, except as may be required under applicable securities laws. Investors should not assume that any lack of update to a previously issued "forward-looking statement" constitutes a reaffirmation of that statement. Continued reliance on "forward-looking statements" is at investors' own risk.
https://mailchi.mp/1ec79c6b4a30/hycroft-drills-best-hole-ever-discovers-new-high-grade-silver-system-12745426?e=126ed5a598
Daily Chart
Weekly Chart


 News
News Market Data

 StayHumble
14 hours ago
StayHumble
14 hours ago
 NASDAQ2020
6 days ago
NASDAQ2020
6 days ago

